
Abstract
Background:
Levetiracetam is an antiepileptic drug widely used to treat partial and generalized seizures in clinicians. The effectiveness and safety of levetiracetam in individuals with epilepsy are affected by various complex factors, including physiological condition and genetic variations. Therapeutic drug monitoring (TDM) serves as a valuable tool to optimize levetiracetam treatment and enable individualized treatment for patients with epilepsy. Machine learning is now a powerful tool for data processing and analysis. However, there is a lack of studies on the application of machine learning methods for the prediction of levetiracetam blood concentration in epilepsy patients.
Objective:
The aim of this study is to develop machine learning models to predict levetiracetam concentration in epilepsy patients, utilizing a web application for clinical dosage adjustment.
Design:
This is a retrospective study enrolling patients diagnosed with seizures and given levetiracetam therapy at Beijing Hospital from January 1, 2024, to May 22, 2025.
Method:
This study included 153 cases of levetiracetam TDM data in patients with epilepsy. A total of 47 variables from five dimensions of enrolled patients were collected, and sequential forward selection was implemented to screen the optimum variable subsets related to levetiracetam TDM. The prediction abilities of multiple machine learning models were compared based on subset variables. The optimal prediction model was subsequently chosen to calculate and rank the importance scores of each variable, and SHapley Additive exPlanations (SHAP) was adopted to visually interpret the impact of variables on levetiracetam concentration.
Results:
The median value of levetiracetam TDM was 10.95 μg/mL, and the levetiracetam TDM of 72 cases (47.1%) was found to be lower than the recommended range. Eleven variables were finally identified as the optimal subset variables. Using the eleven variables as the covariates, the eXtreme Gradient Boosting (XGBoost) algorithm performed best (R2 = 0.50, mean absolute error = 0.43, and root mean square error = 0.58). In comparison, five variables, including age, daily dose, UREA, URIC, and hemoglobin, showed higher importance scores than other variables. SHAP values indicated that the daily dose made the greatest contribution to prediction performance, and a positive impact on levetiracetam concentration was found.
Conclusion:
Our study found that XGBoost is a valuable artificial intelligence instrument for predicting levetiracetam concentration. Daily dose and age were two significant covariates influencing serum concentration. This work is the first study to analyze the levetiracetam concentration data from the real world and predict the blood concentration using machine learning techniques, which provides guidance for the drug adjustment in clinical practice.
Introduction
Levetiracetam is a second-generation antiepileptic drug used for the treatment of multiple forms of seizures. 1 Because of its favorable pharmacokinetic and pharmacodynamic characteristics, levetiracetam has been widely applied in clinical settings over the years. Levetiracetam is not metabolized by CYP450 enzymes, and thus it has few pharmacokinetic interactions with other drugs. 2 In addition, the adverse effects of levetiracetam are relatively fewer, mainly including somnolence, asthenia, coordination difficulties, and dizziness.
Therapeutic drug monitoring (TDM) serves as a valuable tool in clinical settings to maintain treatment outcomes and prevent the occurrence of adverse effects. Given the pharmacokinetics differences among individual patients, TDM is able to individualize dose optimization because it can quantify drug exposure and facilitate a personalized treatment plan based on the therapeutic concentration range. 1 At present, levetiracetam TDM is not routinely recommended according to current guidelines, because of its linear pharmacokinetic profiles and wide therapeutic range. 3 However, levetiracetam TDM is recommended for special patients in whom levetiracetam pharmacokinetics may be changed, such as elderly patients, renally impaired patients, and seriously ill patients in the intensive care unit (ICU).4–6 When an adverse effect is suspected, TDM can serve as a strong clinical and diagnostic indicator. 7 The therapeutic reference range of levetiracetam in TDM is still disputed, and the 2017 AGNP (Arbeitsgemeinschaft für Neuropsychopharmakologie and Pharmakopsychiatrie)-TDM expert group consensus guidelines recommend a concentration range of 10–40 μg/mL for levetiracetam, which is adopted in this study.8–10
For clinical research, the real-world evidence (RWE) extracted from medical records has recently become an important data source. The research based on RWE usually involves a large amount of data, which requires a powerful tool for data processing and analysis. Machine learning, a branch of artificial intelligence, is capable of processing large amounts of real-world data, including data mining, modeling, and building, and exploring the relationship between variables. 11 Recently, various machine learning models have been developed, such as random forest (RF), eXtreme Gradient Boosting (XGBoost), and Light Gradient Boosting Machine (LightGBM), which can be used to build a prediction model based on real-world data and explore the underlying relationship between multiple independent variables and target variables.12–14 To date, the application of machine learning in epilepsy is rather limited, and some studies focus on the use of machine learning for the detection of epileptic seizure signals, identification of epilepsy subtypes, and prediction of disease progression.15–17 There is a lack of machine learning-based models for the prediction of levetiracetam TDM. This prediction model can facilitate the identification of important variables for TDM value, dose adjustment of individual patients, and prevention of the occurrence of adverse effects.
Therefore, this study aimed to gather available real-world data regarding the levetiracetam TDM and identify important clinical variables for levetiracetam TDM via a machine learning method. In addition, the study sought to develop a prediction model to rapidly assess whether plasma levetiracetam concentration reaches the therapeutic reference range. These findings are expected to give meaningful insights for optimizing individualized dose adjustment and helping clinical regimen decisions.
Methods
Study population
This study retrospectively enrolled inpatients who were diagnosed with seizures and given treatment with levetiracetam at Beijing Hospital from January 1, 2024 to May 22, 2025. TDM was an integral part of their care, with at least one assessment performed after the administration of levetiracetam. The reporting of this study conforms to the The Strengthening the Reporting of Observational Studies in Epidemiology (STROBE) statement. 18 The STROBE checklist is provided as a Supplemental file (see Supplemental Materials). Because of the retrospective nature of this study, researchers waived the need to get written informed consent.
The inclusion criteria were as follows: (1) patients aged between 18 and 80 years; (2) patients who accepted levetiracetam treatment for at least 2 days at the same dose, and the blood concentration reached steady state at the time of blood draw; (3) patients who had TDM results. The exclusion criteria included the following: (1) patients who had incomplete clinical records with more than 30% absence of major research data; (2) patients who were undergoing dialysis; (3) patients who had blood drawn after usage of levetiracetam, and the TDM concentration did not represent the trough level. Eventually, this study included 132 patients with 153 cases of levetiracetam TDM information based on the inclusion and exclusion criteria. Data of enrolled patients were collected from electronic medical records, including demographic information and laboratory test results.
Variable selection
In this study, we collected the 47 variables of enrolled inpatients across five dimensions: patients’ demographic information, usage of levetiracetam, laboratory test results, comorbidities, and concomitant medication. To be specific, the patient’s demographic information encompassed age, gender, weight, height; usage of levetiracetam included dosage each time, daily dosage, and frequency. Laboratory test results included renal function, liver function, coagulation function, blood routine examination, etc., with the values obtained within 3 days of levetiracetam TDM. Comorbidities included hypertension, diabetes, coronary heart disease, renal insufficiency, abnormal liver function, and malnutrition; concomitant medication included valproic acid, carbamazepine, and oxcarbazepine. The detailed information on these 47 variables, including unit and abbreviation, has been depicted in supplementary material (see Supplemental Table 1). The TDM value of levetiracetam was set as the target variable. These 47 variables, as well as the target variable, constituted the dataset.
Based on the final dataset for eligible patients, all 47 variables were checked for collinearity, and a correlation matrix heatmap was plotted. Variables with correlation coefficients over 0.7 were removed to avoid multicollinearity. Then, variable selection was performed using sequential forward selection (SFS) based on XGBoost to select the variable subsets with minimum size and optimum performance. Before SFS, data transformation using logarithms was implemented for continuous variables, and then 47 variables were selected using SFS based on the comparison of model performance. The evaluation of model performance was performed by calculating R-square (R2), mean absolute error (MAE), and root mean square error (RMSE). R2 represents the square correlation between the predicted and actual levetiracetam TDM values. MAE indicates the average of the absolute difference between predicted and actual levetiracetam TDM values, and RMSE is the square root of the mean square error between predicted and actual levetiracetam TDM values. Higher R2 value, along with lower values of MAE and RMSE, indicate better model goodness of fit. The variable subset with optimum R2 as well as lower MAE and RMSE was finally selected and subsequently used for model establishment.
Model establishment
Based on the selected variable subset, we established multiple machine learning models to identify the most effective predictive model for levetiracetam concentration, including XGBoost, random forest, LightGBM, gradient boosted decision tree (GBDT), artificial neural network (ANN), and support vector machine (SVM), and compared their predictive ability for levetiracetam TDM value. The final dataset (eleven covariates and one target variable) was randomly divided into training and testing data at a ratio of 7:3. Model optimization and establishment were done in the training data, and then the testing data was used to evaluate and verify the efficacy of the model. To ensure a more accurate assessment of model performance, we applied a 10-fold cross-validation method in the training data. More specifically, training data was divided into 10 subsets, where nine subset was used as the training data and the remaining one subset as the testing data in each iteration when fine-tuning the hyperparameters of different models. This method can reduce the risk of over-fitting and enhance the model’s generalization ability. Finally, the prediction model was trained on the testing data using the optimized parameters and feature subset. The efficacy of the prediction model was determined by calculating the R2, MAE, and RMSE. The prediction model with higher values of R2 as well as lower values of MAE and RMSE was chosen as the optimal model.
Clinical interpretation
The importance scores of variables indicate the contribution of each variable to the predictive power of the whole model. With the best prediction model, the importance scores of each variable were calculated and ranked using the algorithm. Variables with higher importance scores have a close relationship with the accurate prediction of levetiracetam TDM value. Subsequently, SHapley Additive exPlanations (SHAP) was used to visually show the impacts of important values on the predictive model. This study draw SHAP bee swarm plot to elucidate how variables impact the model output.
Statistical analysis
Variable with more than 20% missing values were excluded from the final dataset. If the percentage of missing values was less than 20%, interpolation was carried out using the mean method. Continuous data with normal distribution were expressed as mean ± standard deviation (mean ± SD), and non-normally distributed continuous variables were expressed as medians and first quartile to third quartile (interquartile range, IQR). Categorical data were transformed into numerical data and presented using frequencies and percentages. Statistical analysis was conducted using R software, version 4.5.
Results
Baseline information
Based on the inclusion and exclusion criteria, this study finally included 153 cases of levetiracetam TDM data from 132 patients. Regarding the type of seizures, focal aware seizures accounted for 10.6% (14 patients) of all enrolled patients, and focal impaired awareness seizures accounted for 21.2% (28 patients). The other 90 patients had the type of focal-bilateral tonic-clonic seizures. Baseline characteristics of 153 cases, which covered 47 variables across five dimensions, are shown in Table 1. The levetiracetam TDM results, as the target variable, were also presented in Table 1. The median value of levetiracetam TDM was 10.95 μg/mL with an IQR of 5.5–17.0 μg/mL. Among the 153 cases, the levetiracetam TDM data of 72 cases (47.1%) were found to be lower than the recommended range (10–40 μg/mL), 69 cases (45.1%) were within the recommended range, and 12 cases (7.8%) were higher than the recommended range. The mean age of patients was 63.1 ± 20.6 years, with females accounting for 51.6% of the total. The median dosage of levetiracetam was 0.5 g, and the median frequency was 2 times/d along with the median daily dosage of 1.0 g. Among 153 cases, 84 cases (54.9%) had a diagnosis of hypertension, 51 cases (33.3%) diabetes, 30 cases (19.6%) coronary heart disease, 19 cases (12.4%) renal insufficiency, 31 cases (20.3%) abnormal liver function, 44 cases (28.8%) malnutrition. The main concomitant medication of enrolled patients was valproic acid, and 50 patients (32.7%) used valproic acid together with levetiracetam.
Baseline characteristics.

A/G, albumin/globulin; ALB, albumin; ALT, alanine transaminase; APTT, activate partial thromboplastin time; AST, aspartate aminotransferase; BNP, B-natriuretic peptide; CK-MB, creatine kinase-MB; CRE, creatinine; CRP, C-reaction protein; DBIL, direct bilirubin; DD, D-dimer quantification; eGFR, estimated glomerular filtration rate; GLB, globulin; HDL, high density lipoprotein; HGB, hemoglobin; hs-TNI, high sensitivity troponin; INR, prothrombin time international normalized ratio; IQR, interquartile range; LDL, low density lipoprotein; LYMPH%, lymphocyte percentage; LYMPH, lymphocyte; MYO, myoglobin; NEUT%, neutrophil percentage; NEUT, neutrophil; PLT, platelet; RBC, red blood cell; SD, standard deviation; TBIL, total bilirubin; TC, total cholesterol; TDM, therapeutic drug monitoring; TG, triglyceride; TP, total protein; TT, thrombin time; WBC, white blood cell.
Variable analysis
Multiple variables can affect the levetiracetam TDM data, and the detailed characteristics of 47 variables have been listed in Table 1. To avoid multicollinearity between each variable, multicollinearity analysis was initially used to filter all variables, and a correlation matrix heatmap was plotted, as shown in Figure 1. Then, nine variables were deleted through multicollinear analysis, which had correlation coefficients over 0.7, including neutrophil (NEUT), red blood cell, lymphocyte percentage (LYMPH%), total cholesterol, dosage each time, albumin/globulin, aspartate aminotransferase, creatinine, and height.

The correlation matrix heatmap of all variables.
Following multicollinear analysis, which eliminated the above nine variables, the remaining 38 variables were screened through the SFS based on XGBoost to further identify the optimum variable subset. The relationships between the number of variables and model performance based on SFS have been presented in Figure 2. As seen, the model performance reached the optimum (R2 = 0.467, MAE = 0.561, RSME = 0.674) when eleven variables were selected as the subset variables. Although the R2 (0.503) was slightly higher using thirty-three variables as the subset, the optimal choice should be concise and accurate with minimal variables as well as high predictive capacity. Ultimately, these eleven variables were used to construct the predictive models for levetiracetam plasma concentration, including age, UREA, daily dose, lymphocyte (LYMPH), abnormal liver function, D-dimer quantification (DD), URIC, neutrophil percentage (NEUT%), triglyceride (TG), hemoglobin (HGB), and estimated glomerular filtration rate (EGFR).
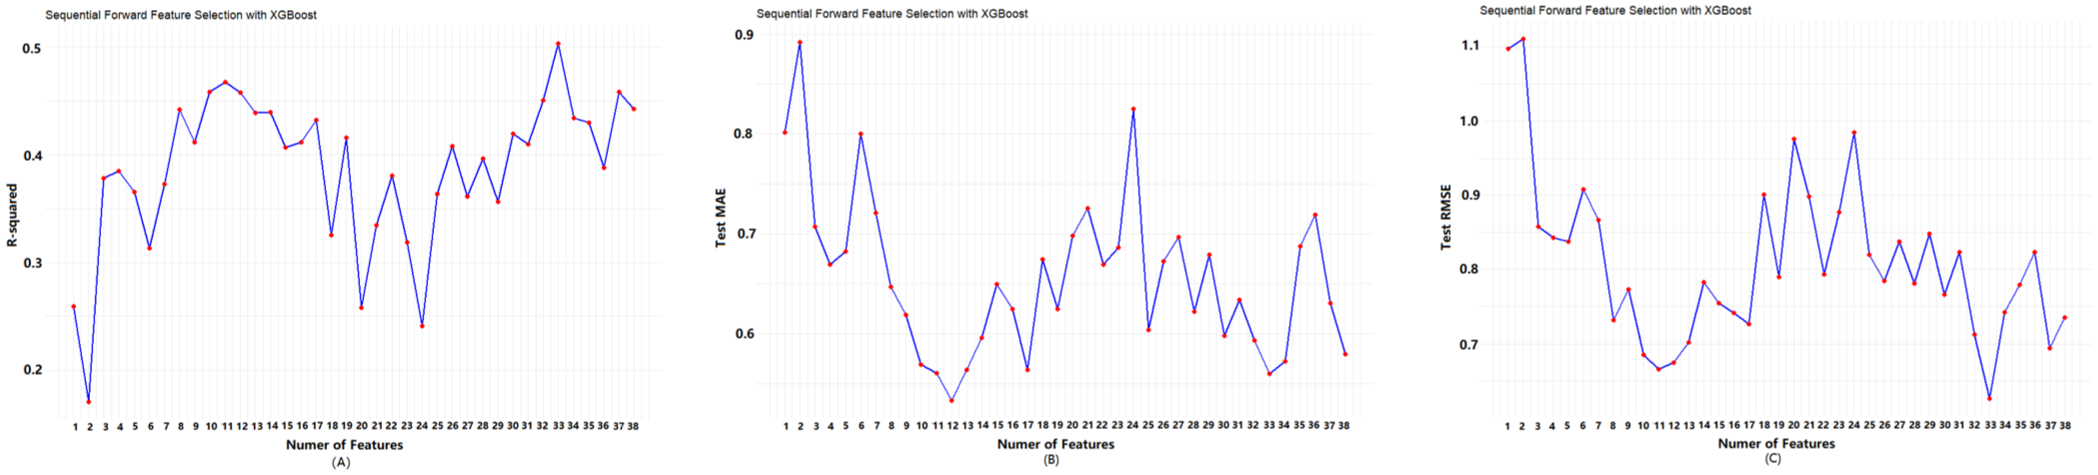
R2 (a), MAE (b) and RMSE (c) corresponding to the number of ranked variables.
Model performance
Using the above optimum variables subset as the covariates, several machine learning models were established, and their prediction performances have been presented in Table 2. Specifically, XGBoost showed the better prediction performance with R2 = 0.50, MAE = 0.43, and RMSE = 0.58. In addition, the accuracy of the predicted concentration within ±30% of actual concentration in the testing data was also calculated to validate the model outcome. The XGBoost model performed better than other models, achieving the highest accuracy of 76.1%. Therefore, the XGBoost algorithm was chosen as the final prediction model. The main parameters were as following: max_depth = 6; min_child_weight = 1; eta = 0.05; subsample = 0.8; colsample_bytree = 0.8. Figure 3 shows the relationship between the predicted values and true values of levetiracetam TDM in the testing data by the XGBoost algorithm. The black line represented predicted values equal to the actual values. The blue dots were close to the black line, meaning the good prediction ability of the XGBoost algorithm.
The prediction performance of different machine learning model.

ANN, artificial neural network; GBDT, gradient boosted decision tree; MAE, mean absolute error; RMSE, root mean square error; SVM, support vector machine; XGBoost, eXtreme Gradient Boosting.

The relationship between the predicted values and true values of levetiracetam TDM by the XGBoost algorithm.
Clinical interpretation
The importance scores of the eleven variables were then calculated and ranked by XGBoost, as shown in Figure 4. It was found that the impact of six variables on predicting levetiracetam TDM value was balanced, including EGFR, abnormal liver function, TG, LYMPH, DD, and NEUT%. In contrast, the importance of five variables (age, daily dose, UREA, URIC and HGB) was higher than that of other variables. To visually show the results, SHAP was employed to quantify the feature importance in prediction and show the impacts of the model predictors on the outcome. The SHAP bee swarm plot was presented in Figure 5. The feature values represent the contribution of each variable to the prediction performance of the XGBoost model. The dot color gets more purple when the feature value is larger, and conversely, the dot color gets more yellow when the feature value is smaller. For the variable of daily dose, the dot color gets more purple when its SHAP value is larger, and the dot color gets more yellow when SHAP values become smaller, which represents the positive impact of daily dose on levetiracetam TDM. In contrast, for the variable of HGB, the dot color gets more yellow when its SHAP values become larger, showing the negative impact of HGB on levetiracetam TDM. In terms of the categorical variable, for “abnormal liver function,” “abnormal liver function 0” represents no presence of comorbidity of abnormal liver function, and inversely “abnormal liver function 1” means the presence of abnormal liver function. As seen in Figure 5, the presence of abnormal liver function has a negative impact on levetiracetam TDM. For other variables, including age, UREA, LYMPH, DD, URIC, NEUT%, TG, and EGFR, no regular positive or negative impact on levetiracetam TDM can be found (Figure 5).

Importance ranking of variables by XGBoost.

SHAP values of the important variables. The dot color is more purple-red when the feature value gets higher and more yellow when the feature value gets lower. SHAP value means the impact of the variable on the model output.
Discussion
In this study, the multicollinear analysis and SFS algorithm determined the optimal variable subsets. Based on the optimal variable subsets, we developed and validated several machine learning models for the prediction of levetiracetam TDM value, while the XGBoost algorithm achieved the best performance (R2 = 0.50, MAE = 0.43, RMSE = 0.58) among the tested machine learning algorithms. It was indicated that the XGBoost algorithm exhibited good prediction performance and potential for clinical application in predicting TDM values after treatment with levetiracetam. For the optimal model, we applied the SHAP method to better visualize the predicted outcomes.
Our findings showed that the levetiracetam TDM values of 72 cases (47.1%) were less than the therapeutic threshold of 10–40 μg/mL. In the study of Shi et al., 1 among 352 samples (taken from 248 patients), 67.6% of samples had levetiracetam blood levels below the reference range (10–40 μg/mL). Similarly, Naik GS et al. collected 353 levetiracetam samples, revealing that 57% of the samples were within their reference range (12–45 μg/mL) and 43% of the samples were outside the range. 19 The findings in these studies were similar to ours, and more than half of the studied population were not within the reference range of levetiracetam blood concentrations. Thus, whether the reference range of levetiracetam recommended in AGNP-TDM consensus guidelines (10–40 μg/mL) is suitable for the Chinese population deserves further study. In this regard, TDM for levetiracetam should be encouraged in clinical settings to gather more data and establish a persuasive recommended range.
Among the eleven variables in the prediction model (Figure 4), the importance scores of age ranked first (importance score = 0.2481), indicating the significant impact of age on outcome. The mean age of our study population was 63.1 ± 20.6 years, with 57.5% (n = 88) of patients over 60 years old. The 153 patients in this study were divided into three age groups: 18–40, 40–60, and over 60 years, and then the age groups were adopted as the x-axis coordinate for the violin plot of levetiracetam concentration, as seen in Figure 6(a). The mean levetiracetam concentration in the over 60 years group was higher than that in the other two groups, and a large inter-individual difference in levetiracetam concentration was observed in the age group over 60 years. Since the majority of samples in this study were elderly patients, physiological changes in the elderly patients affect the pharmacokinetic properties of levetiracetam, such as longer half-life as well as lower creatinine clearance rates. 20 This can be explained by the higher levetiracetam blood concentration in the age group over 60 years.

Violin diagram of levetiracetam blood concentration distribution in different age (a) and daily dose groups (b).
The other significant covariate found in the prediction model was daily dose, which exhibited a positive impact on levetiracetam blood concentration in our study (see Figures 4 and 5). The correlation between levetiracetam dose and concentration has not yet been demonstrated. 1 To visually show the impact of dose on levetiracetam concentration, all patients were divided into three dose groups of 0–0.5, 0.5–1.0, and 1.0–3.0, and the levetiracetam concentration was presented as a violin plot in Figure 6(b). The mean levetiracetam concentration in 1.0–3.0 g/d dose group was higher than in the other two groups. Levetiracetam possesses linear kinetics characteristics, and thus an increase in dosage can be accompanied with predictable increase in blood concentration. Therefore, the effect of dosage on levetiracetam concentration was expected.
In the optimal model, the importance of urea was relatively higher, meaning a significant impact on levetiracetam concentration. In fact, 93% of the administered dose of levetiracetam is excreted in urine. Urea is an indicator of kidney function, which can directly affect levetiracetam blood concentration. This could interpret the correlation between urea and levetiracetam concentration. Our study found that HGB was related to levetiracetam concentration and showed a reverse association. HGB can bind with levetiracetam, and thus high HGB levels may decrease the free, unbound concentration of levetiracetam in blood.
In this study, less than half (45.1%) of enrolled patients achieved effective levetiracetam levels within the therapeutic range of 10–40 μg/mL. Regarding this, we encourage clinicians to use TDM monitoring to enhance and guarantee the efficacy of levetiracetam. Machine learning found that age and daily dose were two significant covariates influencing plasma levetiracetam concentration. For patients over 60 years, a large inter-individual difference in levetiracetam concentration occurred, and TDM should be adopted. When plasma concentration is not located in the recommended range, adjustment of drug dosage is an effective strategy. According to the drug instruction, levetiracetam is indicated for the treatment of focal onset seizures with or without secondary generalization. In this study, we enrolled patients diagnosed with epilepsy, and levetiracetam therapy was administered in accordance with the instructions. Under these circumstances, the most accepted plasma therapeutic range for levetiracetam is between 10 and 40 μg/mL. Nevertheless, levetiracetam is also extensively used as antiepileptic prophylaxis in the neurocritical setting, including traumatic brain injury, subarachnoid hemorrhage, non-traumatic intracranial hemorrhage, stroke, tumor, and craniotomy. 21 In these clinical scenarios, there is no consensus on the optimal dosage and plasma concentration. Some studies proposed that even a low dose of levetiracetam as 500 mg every 12 h may be effective in epilepsy prophylaxis.22,23 It is therefore very challenging to evaluate the safety and drug levels due to the lack of levetiracetam TDM data when used for epilepsy prophylaxis. This aspect also needs to be further investigated by more studies, and the machine learning method provides a powerful tool for the analysis of relevant covariates and the development of a prediction model.
This study has several limitations. First, this was a single-center study, and further validation of the optimal model with external data is needed. Further research should collect large data from more centers to verify the model’s generalization. Second, few studies have found that ABCB1 gene polymorphism may increase the risk of drug resistance in epilepsy, and one study suggested that levetiracetam blood concentration and therapeutic efficacy in Uygur children with epilepsy were associated with ABCB1 gene polymorphism.24,25 This study did not investigate the impact of the related gene on levetiracetam concentration. In fact, our research team is gathering ABCB1 gene polymorphism in epileptics, and conducting studies on the correlation between the gene and levetiracetam concentration. Third, the study did not correlate levetiracetam concentration with clinical efficacy or drug toxicity.
Conclusion
Up to now, this is the first study to predict the levetiracetam trough concentration in patients with epilepsy using machine learning techniques based on RWE. More than half (54.9%) of levetiracetam TDM values were not within the reference range recommended by AGNP consensus guidelines. Among the models tested, the XGBoost model was demonstrated to show optimal prediction performance compared to other models, and the accuracy of the predicted TDM value within ±30% of the true value was 76.1%. However, regarding the limitations of this study, such as single-center data, this model has the potential to help clinicians in predicting levetiracetam blood concentration. Further research is needed to expand the dataset and refine the predictive model to assess the validity and generalizability of this study.
Supplemental Material
sj-doc-1-tpp-10.1177_20451253261426849 – Supplemental material for Predicting the blood concentration of levetiracetam in people with epilepsy using machine learning and real-world data
Supplemental material, sj-doc-1-tpp-10.1177_20451253261426849 for Predicting the blood concentration of levetiracetam in people with epilepsy using machine learning and real-world data by Bolin Zhu, Nan Zheng, Di Chen and Yuanchao Zhu in Therapeutic Advances in Psychopharmacology
Supplemental Material
sj-docx-2-tpp-10.1177_20451253261426849 – Supplemental material for Predicting the blood concentration of levetiracetam in people with epilepsy using machine learning and real-world data
Supplemental material, sj-docx-2-tpp-10.1177_20451253261426849 for Predicting the blood concentration of levetiracetam in people with epilepsy using machine learning and real-world data by Bolin Zhu, Nan Zheng, Di Chen and Yuanchao Zhu in Therapeutic Advances in Psychopharmacology
Footnotes
References
Supplementary Material
Please find the following supplemental material available below.
For Open Access articles published under a Creative Commons License, all supplemental material carries the same license as the article it is associated with.
For non-Open Access articles published, all supplemental material carries a non-exclusive license, and permission requests for re-use of supplemental material or any part of supplemental material shall be sent directly to the copyright owner as specified in the copyright notice associated with the article.