
Abstract
Background:
The widespread clinical use of lacosamide (LCM) has revealed significant individual differences in clinical response, with various reported influencing factors. However, it remains unclear how genetic factors related to the disposition and clinical response of LCM, as well as drug–drug interactions (DDIs), exert their influence on pediatric patients with epilepsy.
Objectives:
To evaluate the impact of genetic variations and DDIs on plasma LCM concentrations and clinical response.
Design:
Patients with epilepsy treated with LCM from June 2021 to March 2023 in the Children’s Hospital of Nanjing Medical University were included in the analysis.
Methods:
The demographic information and laboratory examination data were obtained from the hospital information system. For the pharmacogenetic study, the left-over blood specimens, collected for routine plasma LCM concentration monitoring, were used to perform genotyping analysis for the selected 26 single nucleotide polymorphisms from 14 genes. The trough concentration/daily dose (C0/D) ratio and efficacy outcomes were compared.
Results:
Patients achieved 90.1% and 68.9% responder rates in LCM mono- and add-on therapy, respectively. The genetic variant in the CYP2C19 *2 (rs4244285) was associated with a better responsive treatment outcome (odds ratio: 1.82; 95% confidence interval: 1.05–3.15; p = 0.031). In monotherapy, 36% of patients were CYP2C19 normal metabolizers (NMs), 49% were intermediate metabolizers (IMs), and 15% were poor metabolizers (PMs) carrying CYP2C19 *2 or *3. Of note, the C0/D ratios of IMs and PMs were 9.1% and 39.6% higher than those of NMs, respectively. Similar results were in the add-on therapy group, and we also observed a substantial decrease in the C0/D ratio when patients were concomitant with sodium channel blockers (SCBs).
Conclusion:
This study was the first to confirm that CYP2C19 *2 or *3 variants impact the disposition and treatment response of LCM in children with epilepsy. Moreover, concomitant with SCBs, particularly oxcarbazepine, also decreased plasma LCM concentration.
Plain language summary
This study examined the impact of genetic factors and drug combinations on the effectiveness and plasma concentrations of lacosamide, an antiseizure medication, in patients under 18. Analyzing blood samples from 316 patients at the Children’s Hospital of Nanjing Medical University, researchers discovered that genetic variations in the CYP2C19 (i.e. *2 and *3), along with metabolic capacity, and co-medication with sodium channel blockers, all influence plasma lacosamide concentration. Understanding these genetic influences could inform personalized dosing strategies, improving the medication’s management for pediatric epilepsy patients.
Introduction
Lacosamide (LCM: R-2-acetamido-N-benzyl-3-methoxypropionamide) is used to control partial onset seizures in adults and children 1 month of age and older. LCM is also used in combination with other antiseizure medications (ASMs) to control primary generalized tonic–clonic seizures in children 4 years of age and older and adults. 1 Published studies have revealed its good tolerability and effectiveness in pediatric patients.2–4 However, some patients continue to experience suboptimal or even unsuccessful seizure control, and the underlying factors contributing to this conundrum have remained elusive yet and warrant further investigation.
The LCM metabolic pathway may be involved. The metabolism of LCM has been investigated in a number of in vitro and in vivo studies. 5 Approximately 60% undergoes metabolic processes mediated by various cytochrome P450 (CYP) enzymes, including CYP2C19, CYP2C9, and CYP3A4, or follows CYP-independent routes, while the remaining 40% of LCM is excreted through renal pathways as an unchanged active compound.6,7 Indeed, the specific contribution of the above three isoforms to the metabolic conversion of LCM is currently unclear, but it is generally believed that CYP2C19 is the most important contributor. 8 Nevertheless, genetic variations in CYP2C19, CYP2C9, and/or CYP3A4 influence the metabolism of LCM, which may potentially affect its dosing, tolerability, and clinical response.
Evidence can be found in previous reports. In fact, the gene–drug interaction between CYP2C19 and various drugs has gained extensive attention, and the involved guidelines are widely applied in clinical practice.9,10 Recently, Ahn et al. 11 found that the genetic polymorphisms of the CYP2C19 affect the serum LCM concentration in Korean adult patients with epilepsy, and cases carrying two no-function alleles (*2 or *3) were likely to have higher serum concentrations of LCM. However, the research findings from adults may not be directly extrapolated to pediatric patients, because changes in mRNA and protein expression levels and associated functional activity between the perinatal period until adulthood impact drug disposition. 12 It is evident that LCM’s exposure depends on age, requiring routine concentration monitoring to tailor the dosage that guarantees therapeutic efficacy with acceptable tolerability. 6 Thus, studying the interplay between genotype and age would help to improve understanding of LCM’s disposition and clinical response in children due to the polymorphic protein CYP2C19 involved.
In addition, ASMs like LCM sometimes fail to achieve therapeutic concentrations at the target sites, partly due to active efflux mechanisms orchestrated by locally overexpressed drug transporter proteins in the brain. Notably, P-glycoprotein, encoded by the multidrug-resistant transporter gene ATP-binding cassette subfamily B member 1 (ABCB1), plays a crucial role in this process. 13 Some studies suggested that specific genetic variations in the ABCB1 and ABCC2 (also known as multidrug resistance protein 2) have been directly linked to drug resistance in epilepsy patients.14–16
Add-on therapy or polytherapy of LCM is sometimes preferred for patients with refractory epilepsy. Some co-medications like inhibitors or inducers of these enzymes may cause complex drug-drug interactions (DDIs), thereby changing the systemic exposure to LCM.1,11,17,18 However, these studies are either not conducted only in children, so the number of children involved in the research is relatively small [e.g. n = 22 (ref. 18) or n = 75 (ref. 17)] or they are studies in children, but the number of subjects is still very limited (n = 76). 1 Therefore, the conclusions are inconsistent, or the generalizability of the research findings has been affected due to the low statistical reliability.
The differences in pharmacodynamics are also an inherent mechanism behind the varied treatment responses in patients. Epilepsy involves essential genes, such as SCN1A, SCN2A, SCN9A, and SCN1B, encoding some voltage-gated sodium channels, which play pivotal roles in the intricate regulation of neuronal excitability.19,20 Previous studies highlight the possibility that α and β subunits of these channels may affect the function of sodium channels and result in different responsiveness to ASMs.21–23 However, there is a notable dearth of studies investigating such potential associations in pediatric patients.
To bring clarity to these issues, this study primarily aimed to evaluate how the genetic variants of genes encode these CYP enzymes and efflux transporters, as well as some voltage-gated sodium channel proteins, on plasma LCM concentrations or its clinical response. Another aim of this study was to examine the potential DDIs and to identify other key determinants of plasma LCM concentrations.
Materials and methods
Study design and participants
This retrospective study was carried out at a single center, the Children’s Hospital of Nanjing Medical University, to recruit patients who underwent regular therapeutic drug monitoring (TDM) for LCM during the period from June 2021 to March 2023.
Eligible participants in this study were individuals under the age of 18, who had received treatment for epilepsy for a minimum of 1 month and had routine TDM of LCM. Patients were excluded from the study if they had an underlying metabolic and systemic disorder, or their detailed information was absent in the hospital information system. The Ethics Committee of the Children’s Hospital of Nanjing Medical University approved the study (Protocol number 202204021-1). The requirement for written consent was waived due to the retrospective nature of the study.
Epilepsy types were made after reviewing the semiology of seizures, electroencephalography (EEG), and magnetic resonance imaging (MRI) findings, as defined by the current International League Against Epilepsy criteria. 24 The following parameters were collected: current age, sex, weight, age at seizure and treatment onset, type of epilepsy, concomitant medication, dosage of LCM, duration of treatment, duration of epilepsy, percentage of reduction in seizure frequency, and adverse effects (AEs). The percentage of reduction in seizure frequency was calculated from the total frequency of seizures in the month before and at each follow-up point after LCM treatment.
Treatment protocol
The dose regimen was given by the pediatrician regarding the package insert and a comprehensive assessment of the patient’s disease. LCM was administered orally in tablet form twice daily.
In general, for children aged ⩾4 years, the initial dose was 2 mg/kg/day, which should be increased to a therapeutic dose of 4 mg/kg/day after 1 week. Depending on the clinical response and tolerance, the maintenance dose can be increased by 2 mg/kg/day every week. Gradually titrate the dose until the best response is achieved.
For pediatric patients below the age of 4 years with focal epilepsy, informed consent was obtained from each patient’s parent due to the nature of off-label use. According to the package insert, the dose tailoring was performed based on the weight, that is, the recommended dosages for weighing 6 to <11 kg and weighing <6 kg.
Clinical outcomes assessment
Patients were stratified into subgroups based on the percentage reduction in seizure frequency compared to the baseline at the time of follow-up. Individuals with a reduction in seizure frequency of 50% or greater were classified as ‘responders’, whereas those with less than 50% were categorized as ‘nonresponders’. The responder rate was calculated by considering the proportion of responders, while the seizure-free rate was determined based on the proportion of patients who remained seizure-free for a minimum of 6 months.
Efficacy was also evaluated by the retention rate, that is, the long-term efficacy, defined as the probability of patients maintaining their therapeutic benefits following 1 month of seizure control, was assessed using Kaplan–Meier survival curves.
AEs were recorded according to parents’ and physicians’ observations.
Routine therapeutic monitoring of LCM
The trough concentration (C0) of LCM was quantified through the liquid chromatography-tandem mass spectrometry (LC-MS/MS) methodology. For the monitoring of 15 ASMs, including LCM, a previously published method by our team was employed. 25
The bioanalysis procedures were executed utilizing an LC-MS/MS system, which comprised of a Triple Quad™ 4500MD mass spectrometer (MS) (AB Sciex Pte. Ltd, USA). This MS was interfaced with a Turbo V™ ion source, which was in turn coupled with a Jasper™ liquid chromatography (LC) system (AB Sciex Pte. Ltd, USA). The LC system was equipped with essential components, including a binary pump (Sciex Dx™, USA), an online degasser (Sciex Dx™, USA), an autosampler (Sciex Dx™, USA), and a column oven (Sciex Dx™, USA).
The analytical control, data acquisition, and data processing for the LC-MS/MS system were facilitated using the AB-SCIEX Analyst software packages (version 1.6.3, AB Sciex Pte. Ltd, USA). This software was responsible for overseeing the LC-MS/MS system’s operations and managing the acquisition and processing of data. The inter-batch precision (relative standard deviation, RSD, %) and accuracy (relative error, RE, %) results of plasma LCM concentration based on three-level quality control samples were less than or equal to ±6.7% and within the acceptable criteria (⩽ ±15%) (Supplemental Table 1).
The C0 values from patients were normalized by dividing them by the ratio of the total daily dose, yielding the C0/D ratio of LCM. To meet the data distribution requirements for statistical analysis, logarithmic transformation was applied to the C0/D values.
Genotype analysis
The selection of genetic polymorphisms for analysis was informed by previous research13,16,19,26 and data sourced from the PharmGKB database (https://www.pharmgkb.org). Finally, we focused on 26 single nucleotide polymorphisms (SNPs) from 14 genes known to be associated with LCM’s disposition and/or its pharmacological mechanisms of action were genotyped, including ABCB1 (rs1045642, rs2032582, and rs3789243), ABCC2 (rs3740066 and rs717620), BCL11A (rs2556375), CYP2C9 (rs1057910), CYP2C19 (*2, rs4244285; *3, rs4986893; and *17, rs3758581), GABRA1 (rs2279020 and rs2290732), GABRA6 (rs3219151), GABRG2 (rs211037), GLO1 (rs1049346), SCN1A (rs10188577, rs2298771, rs3812718, and rs6730344), SCN1B (rs55742440), SCN2A (rs17183814, rs2060198, and rs17183814), SCN9A (rs3750904 and rs9646771), and STAT3 (rs1053005).
DNA was extracted from patients’ venous blood (which had been previously stored at −80°C) by using a blood DNA kit (ZhongkeBio Medical Technology, Nanjing, China). The selected 26 SNPs in 14 human genes were genotyped using the Agena MassARRAY platform 4.0 with iPLEX gold chemistry (Agena Bioscience, Inc., CA, USA).
The design of polymerase chain reaction (PCR) assays and extension primers for these SNPs was performed using MassARRAY design software (v.4.0, Agena Bioscience, Inc., CA, USA). The primers used are listed in Supplemental Table 2. PCR master mixtures were obtained using the Agena PCR reagent set, the PCR procedures were started, and then the mixtures were treated with shrimp alkaline phosphatase. The masses of the primer extension products, corresponding to specific genotypes, were determined through matrix-assisted laser desorption/ionization time-of-flight mass spectrometry (Agena Bioscience, Inc., CA, USA). Final genotypes were ascertained using MassARRAY TYPER 4.0 software (Agena Bioscience, Inc., CA, USA).
Based on the CYP2C19 genotype, the patients were classified into three phenotype groups. 27 A normal metabolizer (NM) is an individual carrying two normal function alleles (*1*1) or one normal function allele (*1) and one increased function allele (*17). An intermediate metabolizer (IM) is an individual carrying one no or decreased function allele (*2 or *3) in combination with either one normal function allele (*1) or one increased function allele (*17). A poor metabolizer (PM) is an individual carrying two no function alleles (*2 or *3).
Statistical analysis
All data analysis was carried out using GraphPad Prism 9 (GraphPad Software, La Jolla, CA, USA) and R software (version 4.3.0; R Foundation for Statistical Computing, Vienna, Austria). The sample size was evaluated using power analysis. The assessment of normality was conducted via Shapiro–Wilk tests. Demographic information and clinical characteristics were summarized with frequency counts for categorical variables, means, and standard deviations for continuous variables that exhibited a normal distribution, and medians with interquartile ranges for continuous variables with non-normal distributions.
Comparisons of continuous variables were executed employing the Mann–Whitney U test, while distinctions between independent groups were assessed using the Kruskal–Wallis test. Correlations were analyzed using Spearman’s correlation coefficient. Univariate and multivariate linear regression analyses were performed to discern potential factors influencing the C0/D ratio. Categorical variables were compared using Pearson’s Chi-square test and Fisher’s exact test as appropriate.
The allele and genotype frequencies of various genes were examined for deviation from the Hardy–Weinberg equilibrium using the goodness-of-fit Chi-square test. The relationship between genetic phenotypes and treatment efficacy was explored through logistic regression analysis.
Statistical significance was defined as a p-value of less than 0.05.
Results
Pediatric patients
The final study cohort comprised a total of 316 children, who were selected based on adherence to the specified inclusion and exclusion criteria. The demographic and pharmacologic characteristics of the patients are summarized in Table 1.
Demographic and pharmacologic characteristics of the patients.
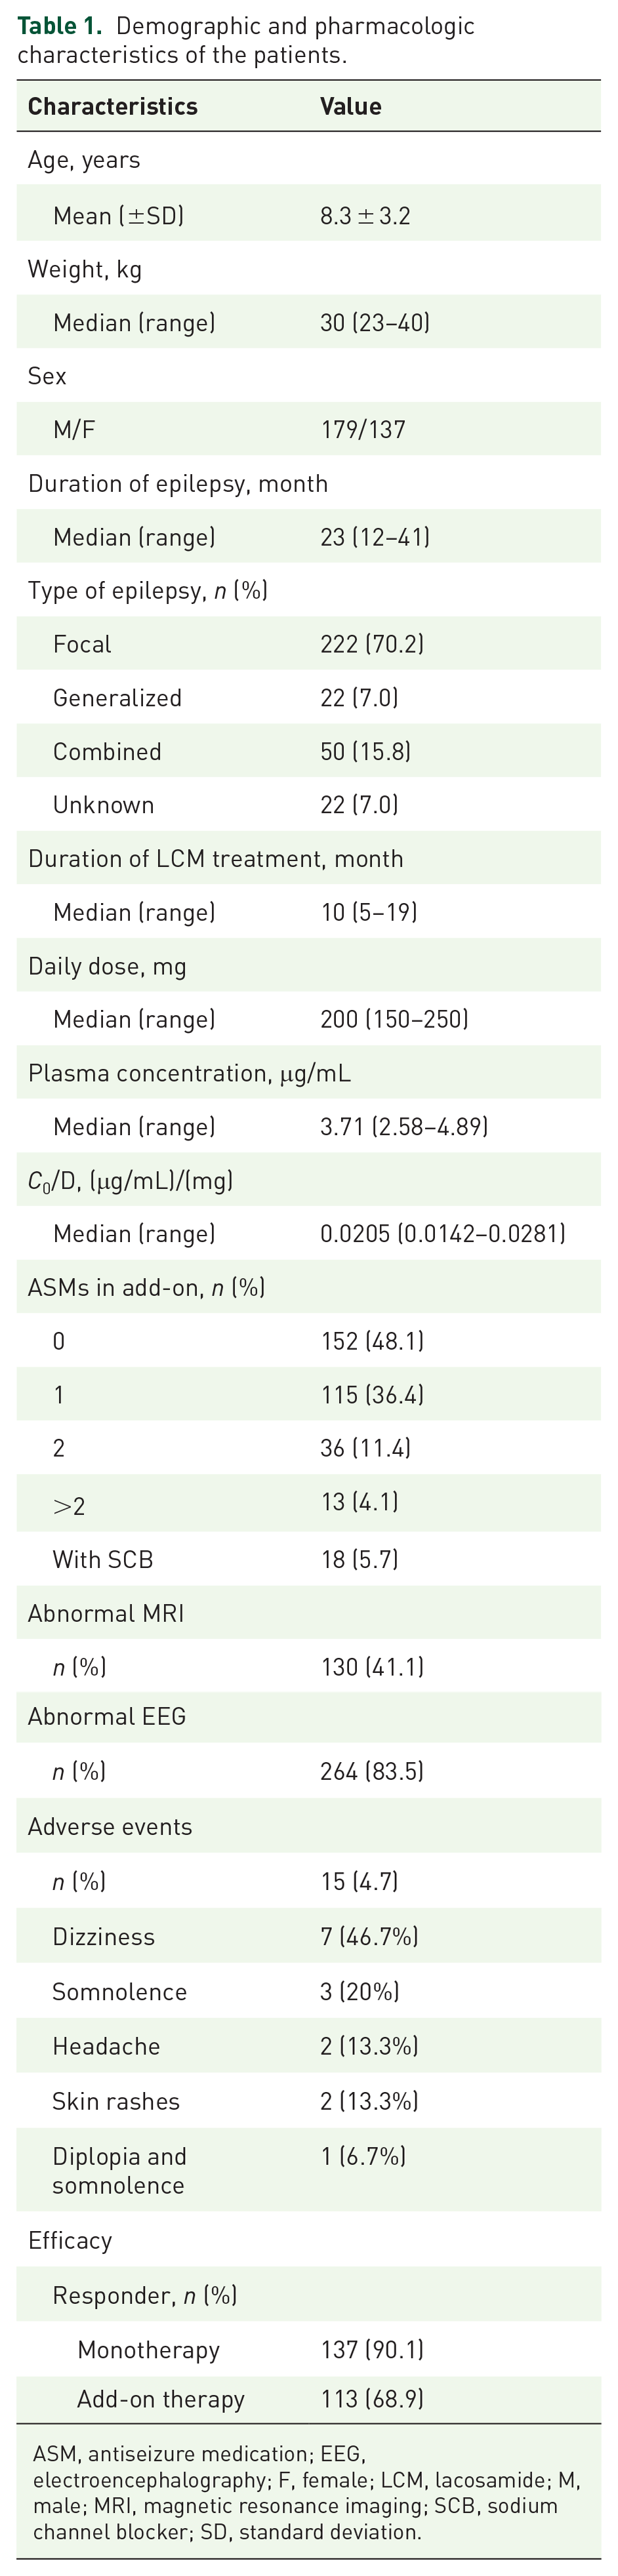
ASM, antiseizure medication; EEG, electroencephalography; F, female; LCM, lacosamide; M, male; MRI, magnetic resonance imaging; SCB, sodium channel blocker; SD, standard deviation.
Overall treatment response
Patients achieved 90.1% and 68.9% responder rates in LCM mono- and add-on therapy, respectively. During a 6-month follow-up period, 80.5% of patients (33/41) in the monotherapy group achieved complete seizure remission, and correspondingly, the seizure-free rate in the add-on therapy group was also acceptable (57.4%). The efficacy outcomes of LCM under various treatment durations are presented in Supplemental Table 3.
Among the 292 patients who achieved favorable seizure control in the initial month, the retention rates were as follows: 94.4% at 6 months, 88.9% at 12 months, and 56.0% at 36 months (Figure 1(a)). Statistically significant differences in the time to relapse were evident between the groups treated with LCM monotherapy and add-on therapy (p = 0.011, Figure 1(b)).

Kaplan–Meier survival estimates for probability to remain responders. (a) In 292 patients (median survival time: 37 months). (b) Divided into monotherapy and add-on therapy groups.
Plasma C0 of LCM
The plasma C0 was monitored throughout the entire treatment period. To avoid introducing bias from multiple samples from each patient, the latest measure was used when more than 1 result was available. In total, 316 measurements were recorded for all the 316 patients, with the median C0 values of 3.71 μg/mL (range: 2.58–4.89μg/mL, Table 1).
The therapeutic plasma LCM concentration ranged from 2 to 7 μg/mL, referring to our previously published study. 1 Notably, 82.6% exhibited therapeutic plasma LCM concentrations, 10.1% had subtherapeutic concentrations, and 7.3% displayed supratherapeutic levels.
Potential determinators of LCM efficacy
Genetic variability
We assessed a total of 26 SNPs in 14 genes. The frequencies of genetic variants in the patient cohort aligned with those observed in the East Asian population of the Genomes Aggregation Database and demonstrated agreement with Hardy–Weinberg equilibrium (p > 0.05). The overall mean call rate across these 26 SNPs was 98%, with individual SNP call rates ranging from 88% to 100%.
Supplemental Table 4 provides an overview of the characteristics of these 26 SNPs derived from 14 genes in a cohort of 316 patients who received either LCM monotherapy or add-on therapy. Among these SNPs, only the dominant variant of rs4244285 in CYP2C19 exhibited a statistically significant association with achieving a responsive outcome (odds ratio: 1.82; 95% confidence interval: 1.05–3.15; p = 0.031). However, after applying the Bonferroni correction for multiple comparisons, this association was no longer statistically significant (Bonferroni corrected p-value = 0.868).
Dose regimen
Out of the 316 individuals who adhered to the prescribed dosing regimen, they received a median dose of 6 mg/kg. A dose-dependent trend was observed, where an increase in dosage correlated with a progressive reduction in the responder rate. Patients administered an initial therapeutic dose (4 mg/kg) up to the 75th percentile dose (7.5 mg/kg) exhibited a more favorable response to LCM when compared to those receiving doses exceeding 7.5 mg/kg (p = 0.009, Figure 2). This corresponded with a statistically significant elevation in C0 levels with higher dosages (median: 4.29 vs 3.71 μg/mL, p = 0.027, Figure 2), but there was a weak correlation between concentration and daily dose (r = 0.277, p < 0.001, Supplemental Figure 1).

Plasma LCM concentrations and responder rate between low dose, medium dose, and high dose groups.
Exposure levels
A total of 250 patients were categorized as responders, and among them, 58.8% displayed either heterozygous or homozygous mutations of the CYP2C19 *2 variant. Statistically significant distinctions in plasma LCM concentrations were observed when comparing patients with heterozygous or homozygous CYP2C19 *2 mutations in the responder group to patients with wild-type variants in the non-responder group (median: 4.23 vs 3.26 μg/mL, p = 0.004, Figure 3). However, there was no significant difference in C0 values between responders and nonresponders in patients with LCM monotherapy or add-on therapy (Figure 4).

Comparison of LCM concentrations between responders and nonresponders, stratified by the CYP2C19 *2 genotype.

Comparison of LCM concentrations between responders and nonresponders, divided into monotherapy and add-on therapy.
Furthermore, in children with LCM mono- or add-on therapy, 82.2% and 82.9% of the plasma trough concentrations of LCM were within the recommended reference range (i.e. 2–7 μg/mL), respectively. Correspondingly, the response rate was 89.6% and 69.9%. No significant difference in response rate between the subtherapeutic concentration group, therapeutic concentration group, and supratherapeutic concentration group (Figure 4).
Influencing factors on the C0/D ratio of LCM
In both the monotherapy and add-on therapy groups of pediatric patients, univariate and multivariate linear regression analyses were conducted to explore the relationship between potential factors and the natural logarithm of the C0/D ratio.
Similar findings were observed in both groups, where the C0/D ratio exhibited significant associations with age, weight, and CYP2C19 phenotypes (Tables 2 and 3).
Result from linear regressions (univariate and multivariate associations) in monotherapy.

p < 0.05.
CI, confidence interval; LCM, lacosamide; EEG, electroencephalography; MRI, magnetic resonance imaging.
Result from linear regressions (univariate and multivariate associations) in add-on therapy.

p < 0.05.
ASM, antiseizure medication; EEG, electroencephalography; LCM, lacosamide; MRI, magnetic resonance imaging.
To be specific, in the monotherapy group, the C0/D ratio was negatively correlated with age or weight (β = −0.052, p = 0.001; β = −0.204, p = 0.024; Table 2). Patients with the NM phenotype exhibited lower drug exposure levels when compared to the IM and PM groups (β = −0.189, p < 0.001; Table 2). This pattern held true in the add-on therapy group as well, with NM individuals displaying lower exposure levels than IM and PM groups (β = −0.374, p < 0.001; Table 3). Additionally, the presence of the rs717620 (C > T) variant, located in ABCC2, was significantly associated with lower exposure levels in monotherapy (β = −0.305, p = 0.048; Table 2).
Furthermore, in the add-on therapy group, age still exerted a negative impact on the C0/D ratio (β = −0.424, p < 0.001; Table 3). Individuals coadministered with sodium channel blocker (SCB) (i.e. oxcarbazepine (OXC), lamotrigine, or topiramate) exhibited lower exposure levels (β = −0.204, p = 0.002; Table 3).
Results of SNP analysis of the CYP2C19
The frequencies of CYP2C19 genotypes, phenotypes, and LCM C0 values within these therapeutic groups are presented in Figure 5.

Frequencies of CYP2C19 genotypes, phenotypes, and plasma LCM concentrations by therapeutic group: subtherapeutic (<2 μg/mL), therapeutic (2–7 μg/mL), or supratherapeutic range (>7 μg/mL).
Notably, the frequency of the CYP2C19 *2 wild-type (GG) genotype was significantly lower in the therapeutic concentration group in comparison |to the subtherapeutic concentration group (p = 0.008), and significantly higher when contrasted with the supratherapeutic concentration group (p = 0.015). Furthermore, the frequency of heterozygous mutations (GA) was significantly higher in the therapeutic concentration group as opposed to the subtherapeutic concentration group (p = 0.023). The CYP2C19 *17 G allele frequency was also notably higher in the therapeutic concentration group in comparison to the supratherapeutic concentration group (p < 0.001).
In the therapeutic concentration group, 52% of patients were classified as IMs, which was higher than the percentage of NMs (36%) and PMs (12%). Conversely, in the subtherapeutic concentration group, 63% of patients were identified as NMs, a percentage significantly higher than that of IMs and PMs (p = 0.007). In the supratherapeutic concentration group, 52% of patients were classified as IMs, a figure significantly greater than that of NMs and PMs (p = 0.014).
CYP2C19 genes affect the C0/D ratio of LCM
The demographics and TDM findings of patients belonging to the three CYP2C19 phenotypes are summarized in Table 4. Daily dosage and the proportion of patients administered SCBs did not exhibit significant differences among the NM, IM, and PM groups. The sole factor that displayed a noteworthy difference among these three groups was the C0/D ratio.
Demographics and TDM findings in four CYP2C19 phenotype groups.

p < 0.05.
ASM, antiseizure medication; F, female; LCM, lacosamide; M, male; SCB, sodium channel blocker.
In monotherapy, the median C0/D ratio in the NM group was 8% lower than that in the IM group (p = 0.002) and 28% lower than that in the PM group (p < 0.001). Additionally, IM individuals exhibited significantly lower C0/D ratios in comparison to PM individuals (p = 0.038, Figure 6(a)). A similar trend was observed in add-on therapy, where NM individuals had lower LCM exposure levels than IM (p = 0.048) and PM (p = 0.002), as illustrated in Figure 6(b).

C0/D ratio ((µg/mL)/mg) of LCM in three CYP2C19 phenotypes groups. (a) In monotherapy. (b) In add-on therapy. (c, d) A comparison of C0/D ratio between monotherapy and coadministration with SCB agents and non-SCB medications.
Interestingly, the impact of CYP2C19 *2 on the C0/D ratio was more significant compared to CYP2C19 *3 (p < 0.001, Figure 7).

A comparison of C0/D ratio ((µg/mL)/mg) between different CYP2C19 genotypes (*1, *2, or *3) in LCM monotherapy.
SCBs affect the C0/D ratio of LCM
Simultaneous administration of SCBs significantly decreased plasma LCM levels, leading to 22% lower drug exposure in individuals compared to those receiving LCM monotherapy (p = 0.01, Figure 6(c)). When further categorized them into three phenotype groups, similar trends were observed in both LCM monotherapy and LCM administered concomitantly with SCBs (Figure 6(d)).
Discussion
This study investigated how the genetic variations of genes encoding drug-metabolizing enzymes, drug transporters, and drug targets affect the plasma trough concentration and clinical response of LCM in children with epilepsy and also evaluated some other determining factors like dosage, age, weight, sex, and co-medications. Of note, the genotype of CYP2C19 and concomitant use of SCBs are two key determinants affecting the plasma concentration and/or efficacy of LCM, thus necessitating dose adjustments for certain pediatric patients.
In the present study, children on LCM monotherapy achieved an impressive responder rate of 90.1%, and although slightly lower in add-on therapy, it remained substantial at 68.9%. It’s important to note that previous studies have underestimated the long-term effectiveness of LCM in the pediatric population. 4 Our study, with a large sample size, revealed a slight decline in LCM efficacy over time, with a retention rate of 56.0% at 36 months (Figure 1). Indeed, the higher responder rate in our study might also be due to the mild epilepsy severity of the enrolled patients and the fact that nearly 50% of the patients were on monotherapy. Previous studies have indicated that LCM was effective and well-tolerated in a cohort of children with refractory focal seizures, but with 42% responders and a notable retention rate after 12 months. 28
A major finding of this study was that the genetic polymorphisms of CYP2C19 were associated with the plasma concentration and clinical response of LCM. For children taking LCM monotherapy, CYP2C19 PMs, carrying two nonfunctional alleles (*2 or *3), exhibited a substantial 39.6% and 27.9% increase in the C0/D ratio compared to NMs and IMs (Figure 6), respectively. In addition, individuals carrying CYP2C19 *1/*2 or *2/*2 genotypes exhibited notably elevated C0/D ratios (by 24.1% and 37.4%, respectively) compared to individuals with *1/*1 genotypes, while no comparable statistically significant difference was observed in those with the CYP2C19 *3 genotype (Figure 7). To the best of our knowledge, this is the first study completed in children that revealed an association between the CYP2C19 genotype and the plasma trough concentration of LCM. This was in line with the very recent report performed on Korean adult patients with epilepsy. 11 This finding holds great clinical value due to the higher prevalence of CYP2C19 *2 and *3 alleles in Asian populations.29–31 Thus, the next clinical challenge will be dose tailoring based on the CYP2C19 genotypes.
Intriguingly, CYP2C19 *2 (rs4244285; G to A), but not *3 (rs4986893), was observed to be associated with the clinical response of LCM. Children carrying alleles GA or AA achieved better efficacy (Supplemental Table 4). Nevertheless, this association did not retain statistical significance after applying the Bonferroni correction for multiple comparisons. Moreover, the plasma trough concentration of LCM in nonresponders with wild GG genotypes was significantly lower than those responders with GA or AA genotypes (Figure 3). These findings suggest that individuals who have a better efficacy should have higher plasma concentrations, which was consistent with previous research.18,32 However, no statistical difference in concentration between responders and nonresponders was observed in our study.
CYP2C19 *2 mutation leads to reduced enzyme activity, resulting in increased plasma LCM concentration in pediatric patients carrying this allele. If there is no clear correlation between the drug concentration and clinical response to LCM, then this phenomenon cannot be reasonably explained from a pharmacokinetic perspective. Currently, however, there is no right research on whether the CYP2C19 *2 mutation directly affects the clinical efficacy of LCM from a pharmacodynamic perspective.
The relationship between dosage and plasma trough concentration, as well as the relationship between plasma trough concentration and clinical efficacy, is indeed a topic worthy of discussion. Indeed, the plasma concentration and the dosage of LCM are not linearly correlated (r = 0.277, Supplemental Figure 1). This was in line with our previous report, 1 but other studies revealed linear pharmacokinetics with a direct correlation between the administered dose and plasma/serum concentrations. 6 In this study, as the dosage increases (<4, 4–7.5, >7.5 mg/kg/day), there is a noticeable trend of increased plasma trough concentration of LCM, but the corresponding clinical response exhibits a bell-shaped trend of initially rising and then declining (70.4%, 83.6%, and 68.6%; Figure 2). In other words, for some patients, increasing the dosage results in higher plasma LCM concentrations without an improvement in the therapeutic effect yet. Thus, exploring the underlying reasons for this phenomenon is beneficial for improving seizure control management in these patients.
Interestingly, among patients with high doses (>7.5 mg/kg/day) and high plasma LCM concentrations but with poor clinical response, the proportion receiving add-on therapy with two or more ASMs is twice that of the intermediate dose group (4–7.5 mg/kg/day; 24% vs 12%) (Figure 2). Thus, this is just selection bias that there are more refractory patients in this group (taking >2 ASMs).
It should also be noted that for elderly and heavier children, the clinical use of doses ranging from 8 to 12 mg/kg/day is rare, as this dosing strategy may result in a daily total dose reaching or exceeding adult levels (400 mg/day). This situation further highlights the significance of conducting routine TDM of LCM to tailor the most appropriate dosage for children in this age group.
Next, we further discussed the effects of age and weight on the plasma trough concentration of LCM. After total daily dose correction, LCM trough concentration is negatively correlated with age or weight (Tables 2 and 3). This finding and previous report 1 could corroborate with each other. We are interested in age to evaluate the impact of CYP2C19 ontogeny on plasma LCM concentration. Indeed, human mRNA and protein expression data remain very limited for CYP2C19, and the only data we have mainly comes from studies on cynomolgus monkeys, in which CYP2C19 shows a rapid increase and normalizes at the adult values. 12 Based on this, it can be inferred that the influence of CYP2C19 ontogeny on plasma LCM concentration may be negligible. The true mechanism behind the influence of age may be related to the higher hepatic and renal clearance due to the larger relative size of the liver and kidney. 33 Arguably, we also cannot rule out the impact of renal tubular transporter ontogeny, considering that close to 40% of LCM is excreted in its unchanged form through urine. 6 In addition, the tendency of LCM to distribute in the extracellular fluid determines the influence of total body water on the plasma trough concentration, which may help explain why C0/D ratios are relatively lower in pediatric patients with higher weight.6,34
Another relevant finding in the present study was the DDIs caused by the co-medications between LCM and SCBs. Of note, SCBs significantly decreased the plasma LCM concentration (22% lower than monotherapy) in children taking LCM only in a CYP2C19 phenotype-independent manner (Figure 6(c) and (d)). This finding indicates that the DDIs caused by concomitant SCBs are an independent influencing factor distinct from the CYP2C19 phenotype. It also reminds us to give sufficient attention in clinical practice.
Indeed, many studies have shown that enzyme-inducing antiseizure medications (EIASMs, particularly for carbamazepine) can significantly reduce LCM concentrations.35–37 Coadministration with an EIASM resulted in a 30%–40% decrease in trough concentrations of LCM, with a more pronounced impact when more than one EIASM was co-administered with LCM. 17 Intriguingly, very limited data accumulated today demonstrated that OXC did not reduce the concentration of LCM, unlike carbamazepine. 18 However, in this study, there was a clear association that SCBs, OXC-dominated (56%), decreased the plasma LCM levels. OXC is known to induce CYP enzymes in the liver and exert its antiseizure effects by modulating sodium channels. 38 Thus, OXC and LCM may interact on drug disposition and pharmacodynamic pathways. Moreover, co-medication with more than 1 SCB was found to be associated with an increased risk of AEs. 39 TDM may be beneficial in monitoring this and ensuring that the LCM concentration does not drop significantly when interacting with an add-on ASM.
One more question needs to be further discussed. In our previous study, 1 we tried to define a reference range of LCM (i.e. 2–7 μg/mL) to match the clinical response and tolerability for Chinese children with epilepsy. In the present study, we confirmed the above finding (Figure 4) with a large number of subjects (n = 316). In children with LCM mono- or add-on therapy, 82.2% and 82.9% of the plasma trough concentrations of LCM were within the recommended reference range, respectively. Unexpectedly, there is no clear association between the clinical response to LCM treatment and the reference range in those children with epilepsy. So, the question is, what is the significance of implementing TDM in clinical practice?
Various reports recommended TDM for LCM, but they did not consistently agree on the reference range, fluctuating within the range of 2–20 μg/mL.18,40–45 Preferring recommendation for TDM of LCM in clinical practice may be based on various reasons, including but not limited to the following, despite controversial conclusions regarding the correlation between concentration and efficacy or AEs in studies.11,32,46–49 First, TDM can identify outliers who may still experience variability in drug metabolism and may be helpful for personalizing adjustments. Second, certain patient groups, such as those with hepatic or renal impairment, may dispose of drugs differently. In such cases, TDM could be valuable to ensure the maintenance of therapeutic levels. Third, TDM can assist in handling scenarios where drug interactions may impact LCM metabolism, guiding dose adjustments if patients are taking other medications that influence LCM levels. Lastly, regular TDM can provide insight into the patient’s medication adherence, which is particularly crucial for seizure management.
This is the first study focusing on the impact of CYP2C19 genetic polymorphisms on plasma LCM concentrations and clinical response in pediatric patients with epilepsy, with a total of 316 children included in the study. An important strength of our study was the ability to assess the impact of genetic polymorphisms on the exposure and response to LCM therapy, examining 26 SNPs in 14 genes (Supplemental Table 4). These genes encode various proteins linked to the disposition of LCM and/or its pharmacological mechanisms. Of note, the impact of CYP2C19 genetic variations stands out, indicating a greater contribution of CYP2C19 to the disposition of LCM. Thus, personalized dose adjustments based on the genotype or phenotype of this CYP enzyme are feasible.
Another strength of this study was the inclusion of both children receiving LCM monotherapy (n = 152) and those receiving LCM in combination with other ASMs (n = 164), which facilitated our assessment of potential DDIs. Indeed, we did observe that OXC reduced LCM plasma drug concentrations. Further research is needed to determine whether dose adjustments are necessary when LCM is used concomitantly with SCBs, including OXC, and how these adjustments should be made.
However, there are several limitations in our study due to its retrospective design nature. Firstly, our assessment of AEs was very limited. In this study, the overall incidence of AEs related to LCM was 4.7%, with dizziness being the most common AE at 46.7%. When compared with the results of a systematic safety review of LCM, 50 our study reported fewer AEs, which might suggest the safety of LCM, but also due to the retrospective design nature. No questionnaire or quantitative analysis of AEs associated with the LCM was conducted in this study. Secondly, the lack of a clear correlation between plasma LCM concentrations and efficacy or AEs cannot be explained. While this association was found in healthy subjects and adult epilepsy patients, it does not hold true for children, warranting further exploration into the underlying reasons. Furthermore, in our clinical practice, we use seizure frequency, MRI, and video EEG (vEEG) data for comprehensive epilepsy treatment evaluation, and the absence of MRI and vEEG data in this study is a limitation that we plan to address in future research. Thirdly, 40% of LCM is excreted unchanged in the urine, but the specific excretion mechanism remains unclear, and we are unable to assess the impact of genetic variations in the renal transporter encoding genes that may be involved. This aspect of research deserves attention. Finally, we did not attempt to assess the potential effects of CYP3A4 *22 due to its minor allele frequency of less than 0.6%. Indeed, the observed variability in activity was believed to have a limited contribution from genetic variants in CYP3A4 due to the unimodal distribution of enzyme activity and the wide range of hepatic protein expression. 51 In addition, although our sample size is the largest currently reported, the sample size for certain methods may still be insufficient, which could affect the statistical power of some analysis results. Further expansion of the sample size is needed in the future to explore the reliability of the results.
Conclusion
Children with epilepsy carrying the CYP2C19 *2 or *3 genotypes tend to achieve higher plasma drug concentrations after receiving LCM monotherapy or adjunctive therapy. Additionally, those carrying the CYP2C19 *2 mutation exhibit slightly better clinical efficacy. Concurrent use of LCM with SCBs, particularly OXC, also significantly reduces LCM plasma drug concentrations. Data from our cohort of 316 pediatric patients once again emphasizes that the reference range for LCM plasma concentration can be defined as 2–7 μg/mL, despite the lack of a clear correlation between plasma drug concentration and efficacy or adverse reactions. Addressing the challenge of considering CYP2C19 genotypes and concomitant SCB therapy to guide individualized dose adjustments presents a noteworthy clinical concern.
Supplemental Material
sj-docx-1-tan-10.1177_17562864241273087 – Supplemental material for CYP2C19 genotype and sodium channel blockers in lacosamide-treated children with epilepsy: two major determinants of trough lacosamide concentration or clinical response
Supplemental material, sj-docx-1-tan-10.1177_17562864241273087 for CYP2C19 genotype and sodium channel blockers in lacosamide-treated children with epilepsy: two major determinants of trough lacosamide concentration or clinical response by Yue Li, Hong-Li Guo, Jie Wang, Yuan-Yuan Zhang, Wei-Jun Wang, Jian Huang, Lin Fan, Ya-Hui Hu, Xiao-Peng Lu and Feng Chen in Therapeutic Advances in Neurological Disorders
Footnotes
References
Supplementary Material
Please find the following supplemental material available below.
For Open Access articles published under a Creative Commons License, all supplemental material carries the same license as the article it is associated with.
For non-Open Access articles published, all supplemental material carries a non-exclusive license, and permission requests for re-use of supplemental material or any part of supplemental material shall be sent directly to the copyright owner as specified in the copyright notice associated with the article.