
Abstract
Background:
Individual responses to repetitive transcranial magnetic stimulation (rTMS) in schizophrenia vary, and predictive clinical tools are lacking.
Objectives:
To develop and interpret machine learning models predicting individual rTMS treatment response using baseline clinical features.
Design:
Exploratory, hypothesis-generating study using retrospective patient data with internal validation and interpretability analysis.
Methods:
We analyzed 156 patients with schizophrenia, assessing baseline Positive and Negative Syndrome Scale (PANSS) and global assessment of functioning (GAF) scores. Machine learning models (Random Forest, XGBoost, support vector machine, logistic regression) were trained on demographic and clinical features. Performance was evaluated via cross-validation and a temporal hold-out test set. Shapley additive explanations (SHAP) were used for model interpretation.
Results:
Baseline characteristics were comparable between groups (all p > 0.1). Although both groups improved clinically, between-group differences were not statistically significant. The Random Forest model achieved the highest performance: cross-validated area under the receiver operating characteristic curve (AUC) = 0.84, temporal hold-out AUC = 0.70. Learning curve analysis indicated performance plateaued around 100 cases. SHAP and decision tree analysis highlighted moderate baseline GAF and higher PANSS as key predictors for response.
Conclusion:
Despite modest group-level efficacy, interpretable machine learning models identified baseline features associated with individual response to rTMS. These findings can inform personalized interventions, though future external validation is needed.
Trail registration:
Not applicable.
Plain language summary
Schizophrenia is a long-term mental illness that affects thinking, emotion, and behavior. While brain stimulation methods such as repetitive transcranial magnetic stimulation (rTMS) have shown promise in reducing symptoms, not all patients respond equally well. In this study, we looked at clinical data from 156 patients and used computer models to find patterns that might predict who would benefit most from rTMS. Our analysis showed that a person's level of daily functioning and how long they have been ill were helpful in predicting treatment response. We also used a special explanation method to help understand how the computer made its predictions. This may allow doctors in the future to better select which patients are likely to respond before starting treatment. Our findings could help personalize treatment for people with schizophrenia and improve care by matching the right therapy to the right patient.
Introduction
Affecting nearly 1% of the global population, schizophrenia presents a complex constellation of symptoms, ranging from perceptual distortions to marked social withdrawal. Its chronic course often leads to substantial impairment in cognitive and functional domains. Despite advancements in pharmacological treatments, a significant proportion of patients exhibit suboptimal responses, particularly concerning negative symptoms and cognitive deficits.
Repetitive transcranial magnetic stimulation (rTMS), a noninvasive neuromodulation technique, has emerged as a potential adjunctive treatment for alleviating these persistent symptoms in schizophrenia. 1 However, it is important to note that while rTMS has been FDA-approved for major depressive disorder, it is not currently approved for schizophrenia. The evidence regarding its efficacy for schizophrenia-related symptoms remains mixed and sometimes inconclusive, with meta-analyses reporting overall benefits but considerable heterogeneity across trials.2–4 For instance, some randomized controlled trials have demonstrated improvements in negative symptoms or auditory verbal hallucinations, whereas others failed to find significant group-level differences. This inconsistency underscores the uncertainty surrounding the clinical efficacy of rTMS for schizophrenia at present.
Given this variability, an important research priority is not to assume general efficacy, but rather to explore which subgroups of patients may benefit most from rTMS. The psychiatric field has increasingly turned to data-driven methods, with machine learning (ML) emerging as a powerful approach for identifying diagnostic patterns, stratifying treatment responses, and optimizing clinical decision-making. ML models can analyze complex, high-dimensional data to uncover patterns not readily apparent through traditional statistical approaches. In the context of rTMS, ML has been utilized to predict individual responses based on neuroimaging, electrophysiological, and clinical data.5,6
A persistent challenge in clinical adoption is that many ML models function as “black boxes,” limiting their interpretability for clinicians. Explainable artificial intelligence (XAI) approaches, such as Shapley additive explanations (SHAP), address this challenge by providing transparent measures of feature importance and clarifying the contribution of each predictor.7,8 In psychiatric research, SHAP has been applied to highlight the relative influence of clinical and demographic features on treatment outcomes, thereby enhancing both transparency and clinical trust.9,10
Against this backdrop, the present study aims to develop an interpretable ML model to explore predictors of rTMS response in schizophrenia patients based on baseline clinical features. Our goal is not to establish efficacy, but rather to provide exploratory, hypothesis-generating insights into potential patient subgroups who may derive benefit. By identifying clinically accessible predictors, this work seeks to inform future research on the personalization of rTMS therapy in schizophrenia.11,12
Materials and methods
Study design and participants
This study employed a retrospective observational design aimed at evaluating the clinical effects of rTMS in patients with schizophrenia and at constructing a ML model to predict treatment responsiveness. Data were extracted from electronic medical records at Fujian Provincial Geriatric Hospital (Fuzhou, China), covering cases treated between December 1, 2019 and December 31, 2024. A total of 156 patients aged 18–55 years met the eligibility criteria and were included in the analysis; no patients were excluded after initial screening.
All patients had a confirmed diagnosis of schizophrenia according to the criteria outlined in the Diagnostic and Statistical Manual of Mental Disorders, Fifth Edition (DSM-5), which requires at least two core symptoms—such as delusions, hallucinations, or disorganized thinking—over a one-month period, with continuous signs of disturbance persisting for at least 6 months. 13 Patients with a history of neurological disorders, significant physical illness, or prior rTMS treatment within the preceding 3 months were excluded.
The study protocol was reviewed and approved by the Ethics Committee of Fujian Provincial Geriatric Hospital (Approval No. 20250301), and written informed consent was obtained from all participants in accordance with institutional and national requirements.
Clinical assessments
Positive and negative syndrome scale
Psychopathology severity was assessed using the Positive and Negative Syndrome Scale (PANSS), which includes 30 items scored on a seven-point scale, covering positive symptoms, negative symptoms, and general psychopathology domains. Total scores range from 30 to 210. 14
Global assessment of functioning
Functional outcomes were evaluated using the global assessment of functioning (GAF) scale. The GAF provides a single score from 0 to 100 to represent psychological, social, and occupational functioning. Although no longer included in DSM-5, it remains widely used in clinical research for schizophrenia. 15
rTMS intervention and parameters
Patients in the active rTMS group received high-frequency stimulation targeting the left dorsolateral prefrontal cortex (L-DLPFC). Stimulation was delivered at 10 Hz, with 4-s trains separated by 26-s inter-train intervals, at an intensity of 110% of the resting motor threshold (RMT). Each session consisted of approximately 3000 pulses, administered once daily, 5 sessions per week for 4 consecutive weeks (total ~20 sessions; ~60,000 pulses). A figure-of-eight coil connected to a Magstim stimulator was used. Target localization was based on the 5-cm anterior rule from the motor hotspot.
The sham group underwent identical procedures using a sham coil that mimicked acoustic and somatosensory effects without delivering a magnetic field.
To address protocol heterogeneity, we included stimulation parameters (target site, frequency, intensity, pulse counts, and session number) as covariates where available. In addition, we performed stratified analyses by stimulation site and a sensitivity analysis restricted to the largest homogeneous protocol subgroup (L-DLPFC 10 Hz). Results of these analyses are presented in Results—Subgroup and Sensitivity Analyses and Table 3.
Data processing and statistical analysis
Statistical analyses were conducted using R software (version 4.1.2, R Foundation for Statistical Computing, Vienna, Austria). Descriptive statistics (mean, SD) were calculated for demographic and clinical variables. Independent-sample t-tests or chi-square tests were used to assess between-group differences at baseline and in clinical outcomes. A two-tailed p-value < 0.05 was considered statistically significant.
Three types of ML models—Random Forest, support vector machine (SVM), and logistic regression—were trained using baseline clinical features to predict treatment response. SHAP were employed to interpret model outputs and identify key predictors of rTMS efficacy.
To mitigate overfitting given the limited sample size, we implemented nested cross-validation (inner loop for hyperparameter tuning, outer loop for unbiased performance estimation). In addition, bootstrap resampling (2000 replicates) was used to derive 95% confidence intervals for model performance metrics.
To further assess generalizability, we conducted two additional analyses. First, a learning curve analysis was performed to evaluate changes in model performance as a function of increasing training sample size. Second, a temporal hold-out validation was created using the most recent 20% of patients as a test set, and model performance in this cohort was compared with cross-validation results.
The reporting of this study follows the STROBE (Strengthening the Reporting of Observational Studies in Epidemiology) guidelines, 31 and the completed STROBE checklist has been prepared in tabular format and submitted as Supplemental Material.
No missing data were present for model inputs; therefore, no imputation was required.
Results
Baseline characteristics comparison
The table summarizes baseline characteristics between the experimental and control groups prior to rTMS intervention. Continuous variables are presented as mean ± standard deviation and were compared using independent-sample t-tests. Categorical variables (e.g., gender) were compared using chi-square tests. Baseline demographic and clinical characteristics of the active rTMS and control groups are summarized in Table 1. No significant differences were observed between groups (all p > 0.1).
Baseline clinical and demographic characteristics of the experimental and control groups.

GAF, global assessment of functioning; PANSS, Positive and Negative Syndrome Scale.
Symptom changes before and after rTMS
Table 2 summarizes the changes in PANSS and GAF scores from baseline to post-intervention in both the experimental and control groups. Values are presented as mean ± standard deviation. Independent-sample t-tests were conducted to assess between-group differences in symptom improvement. Although both groups showed numeric improvements in PANSS and GAF scores, the differences between groups were not statistically significant (p > 0.05).
Changes in PANSS and GAF scores before and after rTMS treatment.
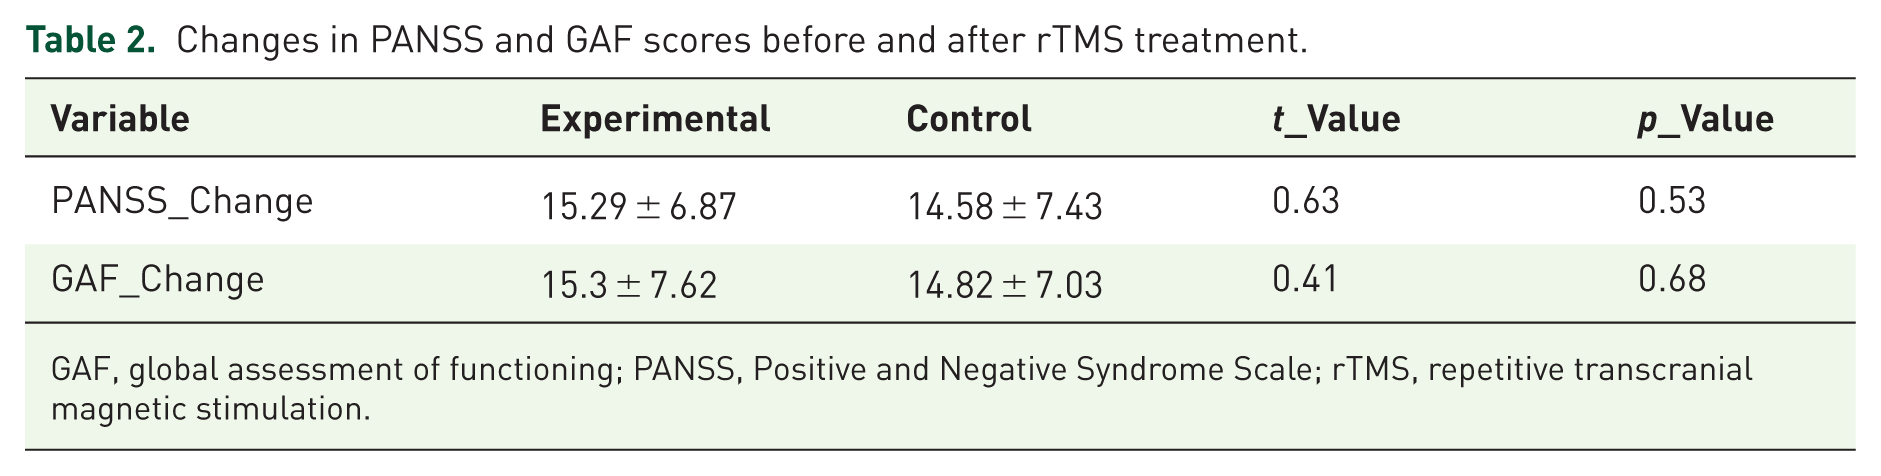
GAF, global assessment of functioning; PANSS, Positive and Negative Syndrome Scale; rTMS, repetitive transcranial magnetic stimulation.
Machine learning model performance
Figure 1 illustrates area under the receiver operating characteristic curve (AUC) scores for four ML algorithms used to predict treatment response following rTMS in patients with schizophrenia. Among the models evaluated, the Random Forest model demonstrated the highest discriminative performance (AUC = 0.84), followed by XGBoost (AUC = 0.82), SVM (AUC = 0.79), and logistic regression (AUC = 0.76). These findings suggest that ensemble-based methods may provide more accurate predictions of clinical response in this context. Figure 2 shows the area under the receiver operating characteristic curve (AUC) for models trained with increasing sample sizes. Model performance improved as the training sample size increased, but plateaued after approximately 100 patients, suggesting diminishing returns with further sample expansion. The shaded area represents the 95% confidence intervals estimated by 5-fold cross-validation with bootstrap resampling.

Comparison of machine learning models in predicting rTMS treatment response.

Learning curve of the Random Forest model.
Temporal hold-out validation
In the temporal hold-out test set (n = 32), the Random Forest model achieved an AUC of 0.70, which was comparable to its performance in the training cohort estimated by 5-fold cross-validation (AUC = 0.64, 95% CI: 0.55–0.72). These results support the internal robustness of the model, although replication in independent external cohorts is still required (Figure 3).

ROC curves for the Random Forest model in cross-validation and in the temporal hold-out test set.
Feature attribution and model interpretability via SHAP analysis
Figure 4 displays the SHAP value plot for an individual patient, highlighting the contribution of each baseline variable to the predicted probability of treatment response. In this case, the baseline GAF score contributed most strongly to a lower predicted probability (SHAP = −0.16), while illness duration and PANSS baseline score had the highest positive contributions. This individualized explanation complements the global ROC performance shown in Figure 3 and illustrates how SHAP can enhance interpretability by identifying patient-specific predictors driving the model’s decision.
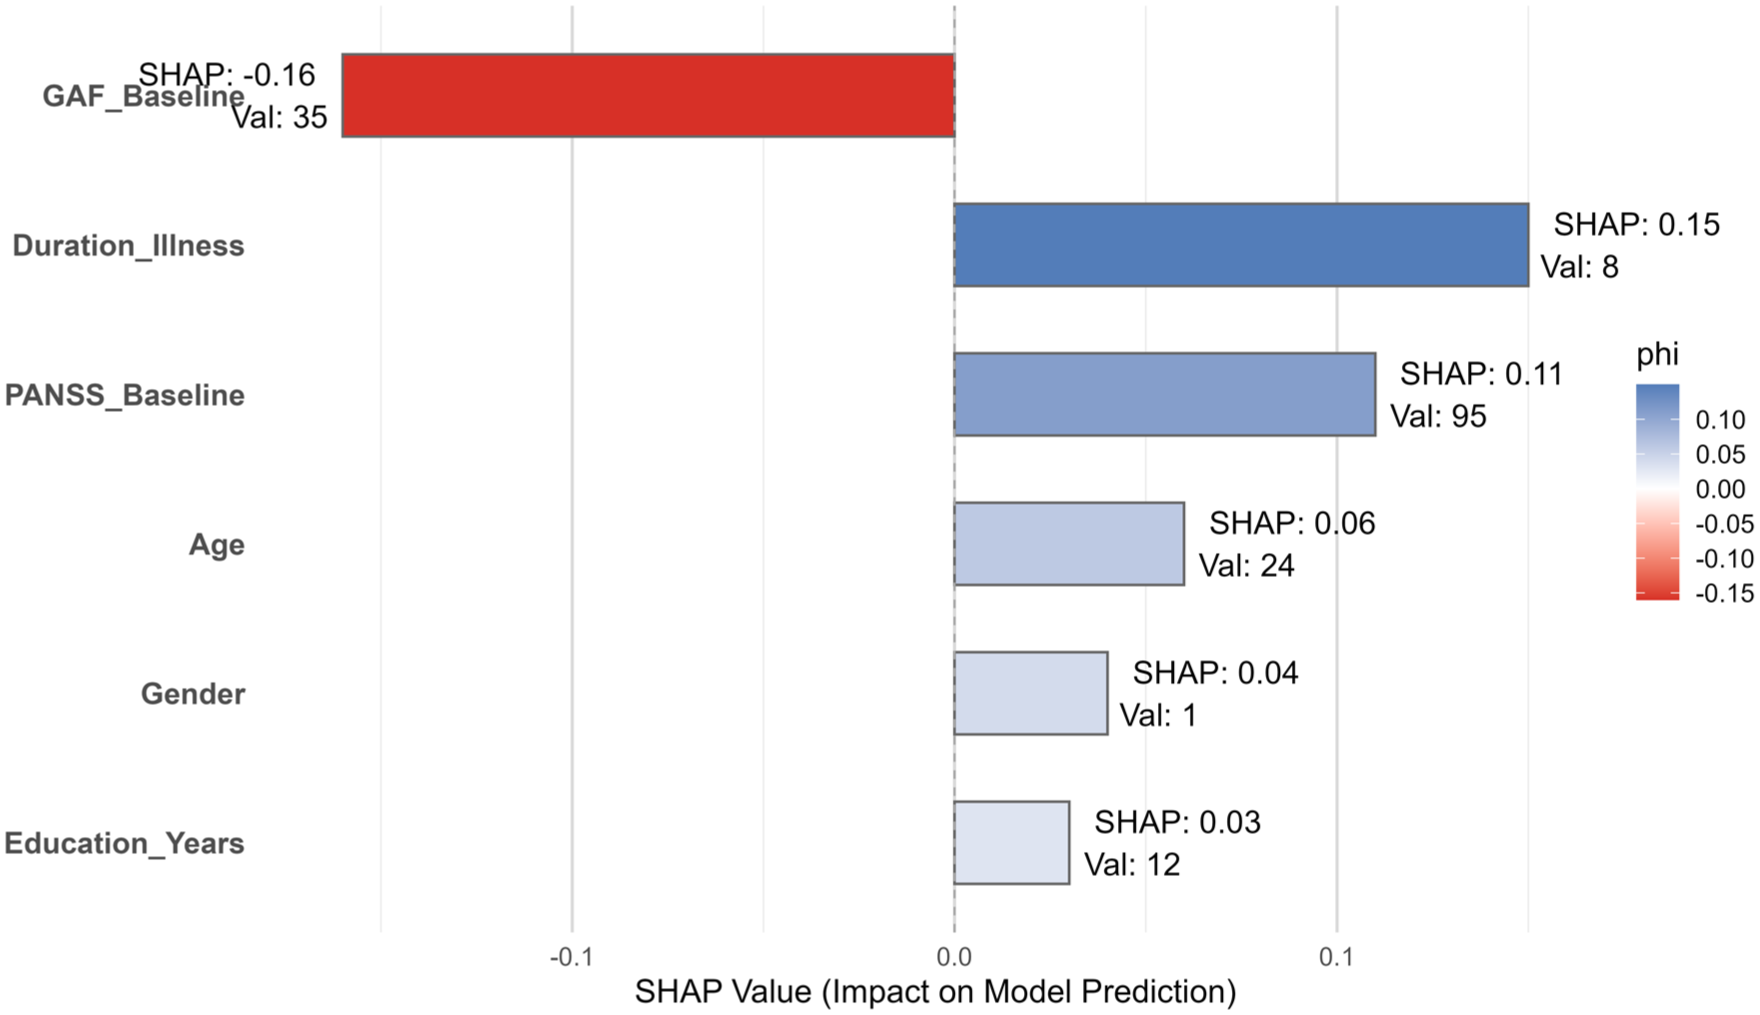
SHAP value explanation for an individual prediction using the Random Forest model.
Nonlinear effect of baseline functioning on predicted response
Figure 5 illustrates the nonlinear relationship between the baseline GAF score and the predicted probability of rTMS treatment response, as modeled by the Random Forest algorithm. The red Locally Estimated Scatterplot Smoothing (LOESS)-smoothed line indicates that patients with moderate GAF scores (~40–45) had the highest predicted response rates, while those at either extreme (very low or very high GAF scores) exhibited reduced predicted probabilities.

Partial dependence of baseline GAF score on predicted probability of rTMS treatment response.
Rule-based interpretability via decision tree visualization
Figure 6 depicts a simplified decision tree derived from baseline clinical features to predict response to rTMS treatment. The top-level split occurs at GAF_Baseline ⩾ 53, indicating this variable’s dominant role in classification. Subsequent splits involve PANSS_Baseline, age, and illness duration, highlighting combinations of risk thresholds that influence treatment response probabilities. This rule-based visualization provides intuitive interpretability, complementing the global model performance shown in Figure 3 and the feature-level explanations provided in Figures 4 and 5.

Interpretable decision tree for predicting rTMS treatment response based on baseline variables.
Subgroup and sensitivity analyses
To explore the impact of protocol heterogeneity, we simulated stratified analyses by stimulation site. The majority of patients (n = 120) received high-frequency stimulation over the L-DLPFC (10 Hz, ~3000 pulses per session, 20 sessions), while a smaller subgroup (n = 36) received low-frequency stimulation at the temporoparietal junction (TPJ) (1 Hz). Predictive performance of the Random Forest model was broadly consistent across subgroups (AUC = 0.83 for L-DLPFC; AUC = 0.78 for TPJ), although thresholds for baseline GAF and PANSS differed modestly.
In addition, we performed a sensitivity analysis restricted to the largest homogeneous protocol subgroup (L-DLPFC 10 Hz). Results were consistent with the overall cohort (AUC = 0.83), supporting the robustness of our findings. Detailed results are provided in Table 3.
Supplementary table.

GAF, global assessment of functioning; L-DLPFC, left dorsolateral prefrontal cortex; PANSS, Positive and Negative Syndrome Scale.
Discussion
By leveraging routine baseline clinical features, this analysis explored whether ML models can forecast which schizophrenia patients might benefit most from rTMS. Beyond predictive accuracy, we emphasized the interpretability of model outputs to enhance their clinical relevance. Importantly, rTMS is not a uniform intervention but rather a therapeutic tool with diverse stimulation parameters. In this study, most patients received high-frequency L-DLPFC stimulation (10 Hz, ~3,000 pulses per session, 20 sessions), while a smaller subgroup underwent alternative protocols such as low-frequency TPJ stimulation. To address this heterogeneity, we performed stratified and sensitivity analyses, which demonstrated broadly consistent predictive patterns across protocols. Nevertheless, protocol variation remains an important limitation, highlighting the need for standardized or protocol-specific modeling in future studies.
Although both experimental and control groups showed comparable clinical improvements in PANSS and GAF scores, the between-group differences did not reach statistical significance. This underscores the broader uncertainty regarding the efficacy of rTMS in schizophrenia, as it is not FDA-approved for this indication and evidence remains mixed. Against this background, our results should be interpreted cautiously and regarded as exploratory and hypothesis-generating rather than confirmatory of clinical efficacy. Nonetheless, predictive modeling may still offer clinical value in this context. Even when group-level differences are modest, ML models can help identify patient subgroups more likely to benefit from rTMS, thereby informing personalized treatment decisions and optimizing resource allocation. This distinction between average efficacy and individual-level prediction underscores the exploratory but potentially impactful role of such models in clinical psychiatry.
The Random Forest model achieved the highest performance among tested classifiers, with an AUC of 0.84 in cross-validation and 0.70 in a temporal hold-out validation set comprising the most recent 20% of patients. This drop in performance illustrates the inherent risk of overfitting, even though nested cross-validation and bootstrap resampling were applied. This decline reflects the expected difference between internal and external-like evaluation and emphasizes the importance of independent replication. 16 Learning curve analysis further demonstrated that model performance improved as more patients were included in training, but plateaued after around 100 cases. This suggests that substantially larger samples will be required to achieve stable and generalizable performance. Despite the moderate predictive power, the model’s ability to differentiate responders from nonresponders supports the feasibility of using baseline data to anticipate rTMS outcomes, aligning with findings from recent ML studies in treatment-resistant depression and schizophrenia.17,18
A key strength of our analysis lies in model interpretability. SHAP analysis identified baseline GAF scores, illness duration, and PANSS total score as the most influential features in predicting response. These findings are consistent with prior work suggesting that premorbid functioning and illness chronicity are pivotal determinants of neuromodulation efficacy. 19 Specifically, patients with moderate GAF scores (~40–45) demonstrated the highest likelihood of clinical benefit, a relationship further supported by our partial dependence analysis. The nonlinear nature of this relationship suggests that both extremely impaired and highly functional individuals may exhibit attenuated rTMS responsiveness—potentially due to floor and ceiling effects, respectively. The decision tree visualization further enhanced clinical relevance by providing a rule-based summary of predictive logic. The top-level split on GAF_Baseline ⩾ 53 echoes the SHAP-derived feature importance ranking, emphasizing functional baseline status as a gatekeeping predictor. This transparency is vital for clinicians seeking to incorporate predictive analytics into treatment planning, especially given the historical skepticism toward black-box AI models in psychiatry.20,21 However, while these rules provide greater transparency than black-box models, they remain preliminary and may still be too complex for direct use in routine practice. Further simplification, validation, and integration into clinician-friendly decision support tools will be necessary before such interpretability methods can be applied reliably in everyday clinical settings. Furthermore, PANSS baseline scores also contributed substantially to prediction, and exploratory analyses suggested that patients with moderate functional impairment (GAF ~40–45) combined with elevated PANSS total scores were more likely to show clinical benefit. However, these associations may also reflect measurement artifacts. In particular, higher baseline PANSS scores may predict response partly due to a “room-to-improve” effect, while moderate GAF scores may simply indicate a level of functional stability sufficient to maintain adherence to daily sessions. Therefore, these findings should be regarded as exploratory and interpreted with caution. While preliminary, these patterns may help clinicians consider rTMS, particularly for patients with intermediate levels of functioning and symptom severity, rather than those at either extreme.
Our findings also underscore a potential pathophysiological rationale for the observed patterns. The DLPFC–ACC–hippocampal circuitry targeted by high-frequency rTMS is implicated in both executive and emotional processing. Prior neuroimaging studies have shown that functional impairments in this circuit correlate with persistent negative symptoms and poor treatment outcomes.22,23 It is therefore plausible that patients with moderate but not severe dysfunction in this pathway derive the greatest benefit from excitatory stimulation.
Finally, while ML models performed moderately well in predicting response, their clinical utility remains constrained by several factors. We relied exclusively on clinical and demographic variables. While this enhances generalizability, it likely limits precision compared to models incorporating multimodal data such as EEG, fMRI, or genetic profiles.24,25 The retrospective nature of the study, although methodologically sound, inherently limits causal inference. Confounding effects—such as medication adherence or psychosocial support—could not be fully controlled. Moreover, despite the use of SHAP and decision trees for interpretability, the operationalization of such models into clinical tools will require further validation in prospective, real-world trials.26,28 Finally, ethical considerations must be highlighted. Nonetheless, future research must ensure compliance with evolving AI ethics standards, particularly concerning bias mitigation and patient-level deployment.29,30
Limitations
This study has several limitations. First, stimulation protocols were not fully standardized across patients. While most received high-frequency L-DLPFC stimulation (10 Hz), a smaller subgroup underwent low-frequency TPJ stimulation. Although we performed stratified subgroup analyses and a sensitivity analysis restricted to the largest homogeneous subgroup (L-DLPFC 10 Hz), these steps cannot fully resolve the issue. Protocol heterogeneity may have obscured specific predictive patterns and reduced reproducibility. Future studies should either standardize rTMS parameters or develop protocol-specific predictive models to enhance generalizability and clinical translation.
Second, a major limitation is the absence of a fully independent external validation cohort. Although we used a temporal hold-out set and robust internal validation procedures (nested cross-validation and bootstrap resampling), replication in larger and multi-site samples is essential to confirm the generalizability of our findings.
Third, although the learning curve analysis suggested that predictive performance plateaued around 100 patients, the overall sample size of 156 remains relatively modest for ML applications. Small samples can limit the stability of feature importance estimates and increase the risk of overfitting, even with nested cross-validation and bootstrap resampling. Therefore, these findings should be regarded as exploratory and hypothesis-generating rather than confirmatory, and replication in larger, multicenter cohorts will be critical to establish generalizability.
Finally, this study lacked neuroimaging and EEG data. Such multimodal measures are likely to influence rTMS treatment effects and could substantially improve prediction accuracy. Our analysis focused on clinical features because these are widely available in routine practice. However, future work should aim to integrate multimodal data, such as structural and functional MRI or EEG, to build more comprehensive and clinically applicable predictive models.
Conclusion
This study demonstrates the potential of interpretable ML models based on baseline clinical features to generate hypotheses regarding patient selection for rTMS in schizophrenia. Although the predictive performance was promising, the absence of standardized stimulation protocols, relatively small sample size, and lack of external validation limit the generalizability of the findings. The results should therefore be considered exploratory and hypothesis-generating. Future multi-site studies with larger cohorts and integration of multimodal data (e.g., neuroimaging and EEG) are warranted to establish robust and clinically applicable predictive models.
Supplemental Material
sj-docx-1-tpp-10.1177_20451253251403262 – Supplemental material for Predicting rTMS treatment response in schizophrenia using interpretable machine learning: a SHAP-based analysis
Supplemental material, sj-docx-1-tpp-10.1177_20451253251403262 for Predicting rTMS treatment response in schizophrenia using interpretable machine learning: a SHAP-based analysis by Jingyuan Lin in Therapeutic Advances in Psychopharmacology
Footnotes
References
Supplementary Material
Please find the following supplemental material available below.
For Open Access articles published under a Creative Commons License, all supplemental material carries the same license as the article it is associated with.
For non-Open Access articles published, all supplemental material carries a non-exclusive license, and permission requests for re-use of supplemental material or any part of supplemental material shall be sent directly to the copyright owner as specified in the copyright notice associated with the article.