Abstract
This case is designed to illustrate how to utilize a business intelligence framework and a geographic information system (GIS) to make better decisions in the banking industry. The case started when Jong, the senior certified analytic professional, and Kampu, the GIS solutions expert were drafting a proposal presentation to help ABC Bank of Thailand improve its home loan appraisal process. The current appraisal process was time-consuming and the appraisal value from the internal and external appraisers were very different as the appraisal process relied heavily on the opinions and judgements from all appraisal staffs. Currently, there was a home loan application pending for Hugo, the appraisal manager of ABC Bank of Thailand, to make the decision on the final appraised value. This was a great opportunity for Jong and Kampu to revisit the current appraisal process and to demonstrate how business intelligence and GIS could aid in the appraisal decision. Additionally, the proposed GIS-based BI dashboard allowed the appraisal team to the analyze data-related to the appraised property in real-time. Eventually, Jong and Kampu had to make a decision on what appraised value Hugo should recommend to the home loan committee members.
Keywords
Case A: ABC bank of Thailand
Introduction
On a busy July 1, 2021, Hugo, the appraisal manager of ABC Bank of Thailand, was assigned a big project: to work with a business intelligence (BI) consulting team consisting of Jong, the senior certified analytic professional, and Kampu, the geographic information system (GIS) solutions expert in order to help the bank improve its home loan appraisal process.
ABC Bank of Thailand had for years been one of the three largest banks in Thailand in terms of loans, deposits, and assets, with more than 1000 branches throughout the country. The bank provided a variety of banking services to both corporate and individual customers, including various types of deposit accounts, investments, mutual funds, credit cards, life and non-life insurance, personal loans, home loans, and home equity loans.
During the meeting, Hugo explained that he was responsible for handling the appraisal processes for all types of loan services at the bank: personal loans, home loans, and automobile loans. He added, The focus is on the home loan services, which are the largest share, 52%. We have six types of home loans for which the bank needs appraisals: detached houses, townhouses, commercial buildings, condominiums, ready-to-build land, and home improvements. The urgent one that brought us together today is the detached house loan applications: the bank is receiving 7,000 – 8,000 requests per month on average.
Hugo continued raising the concerns he had had to deal with recently. The bank relied on the appraisal value from both internal and external appraisers in order to finalize the credit limits, loan payment or repayment, installment plan, and interest rate. If interested, customers apply online and immediately get a pre-screening result. After giving the bank the basic information, either online or with the bank’s dedicated home loan specialists, they receive the loan that best suits their needs. The interest rate varies based on the type of customer, their job, and the credit limits, which range from 1-2.99M baht, 3–4.99M baht, or more than 5M baht.
The maximum loan amount would normally be 80–90% of the appraised value or the balance of a refinanced loan. The bank evaluated the following information, which was attached to the loan application: 1) the purpose of the loan, 2) the qualifications of the borrowers, 3) their financial history, 4) their capacity to make loan repayments, and 5) the type and value of collateral. All the required documents were listed on the website, with a checklist to help customers speed up the loan application process. Some of the required documents were an ID card, a house registration document, a letter of earnings from the employer, salary slips or a copy of payroll account records, a copy of the land deed or certificate of property ownership, a copy of a settlement agreement, down payment slips, maps showing the location of the collateral, and a document related to proof of financial status and current debt.
Current appraisal problems
Hugo emphasized that his responsibility was to ensure that the appraisal value was accurate and up-to-date, and it seemed that the bottleneck in the process was largely on his part. He added, The appraisal process is time-consuming, and my team can handle only two to three cases a day, or a maximum of 4 cases when they are in the same area. To make the situation even more difficult, the appraisal value from the internal and external appraisers are very different. It’s quite a challenge to come up with a standard price. For instance, the incident that led to our meeting today is that for the same types of houses with similar characteristics, we have seen a discrepancy in the appraisal values up to 257%, which is unacceptable.
Jong seemed to understand the situation and offered his opinion that the discrepancy might be because the appraisal process relied on the opinions and judgements from all appraisal staff both internal and external. The data used to estimate the price of the properties might have been collected manually and depended on the survey reports from the staff. “That’s the point!” Hugo emphasized. Inaccurate appraisal values impacted the bank’s financial structure, both income and expenses. If the property was overvalued, some borrowers might have been approved for loans that were inflated. If they were unable to pay the debt and the bank foreclosed on the houses, the bank had to sell them at auction and would get a significantly lower value than the original loan value. For underpriced estimates, the properties might be undervalued, and the borrowers might receive lower loan offers. As a result, the bank might lose valuable customers to their competitors. Additionally, without a tool or system to aid in the appraisal process, the costs of onsite visits and revisits, the expenses incurred from the repeated process, and the redundant work required to increase the appraisal efficiency, the opportunity costs of inaccurate appraisal values could backfire on the bank either way.
Hugo elaborated on the appraisal process: after receiving the application forms from customers, he would assign the application to the bank appraisal staff and the third-party appraisers with whom the bank had a contract. The appraisers would then make an appointment with the customer to visit the area, collect the data onsite, and estimate the value of the property.
The home loan applicants
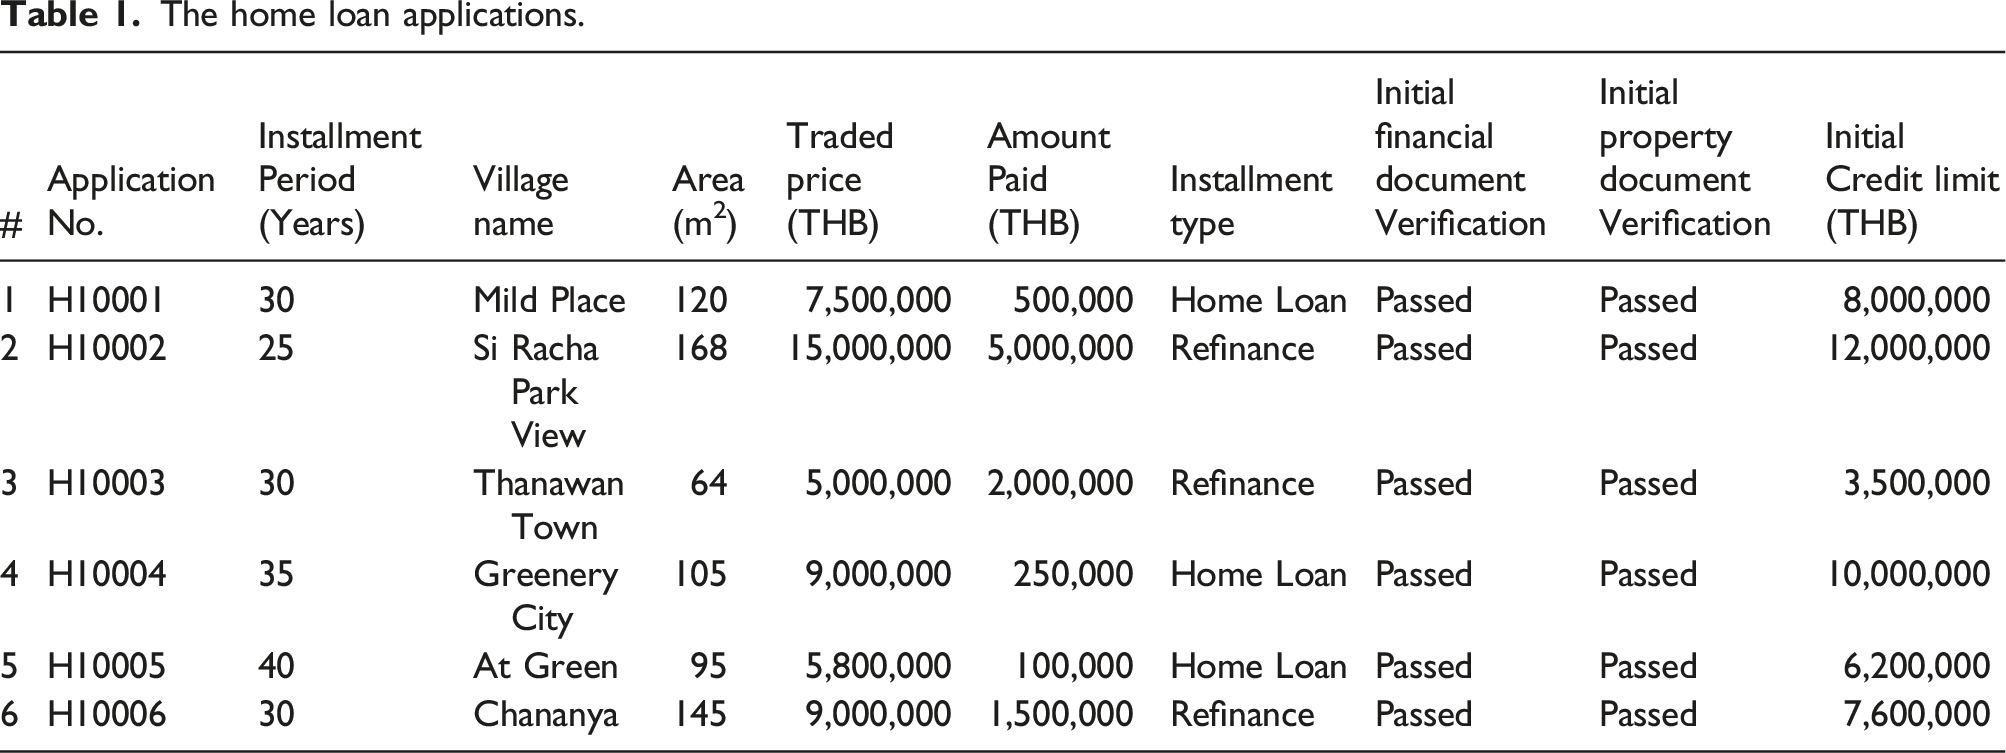
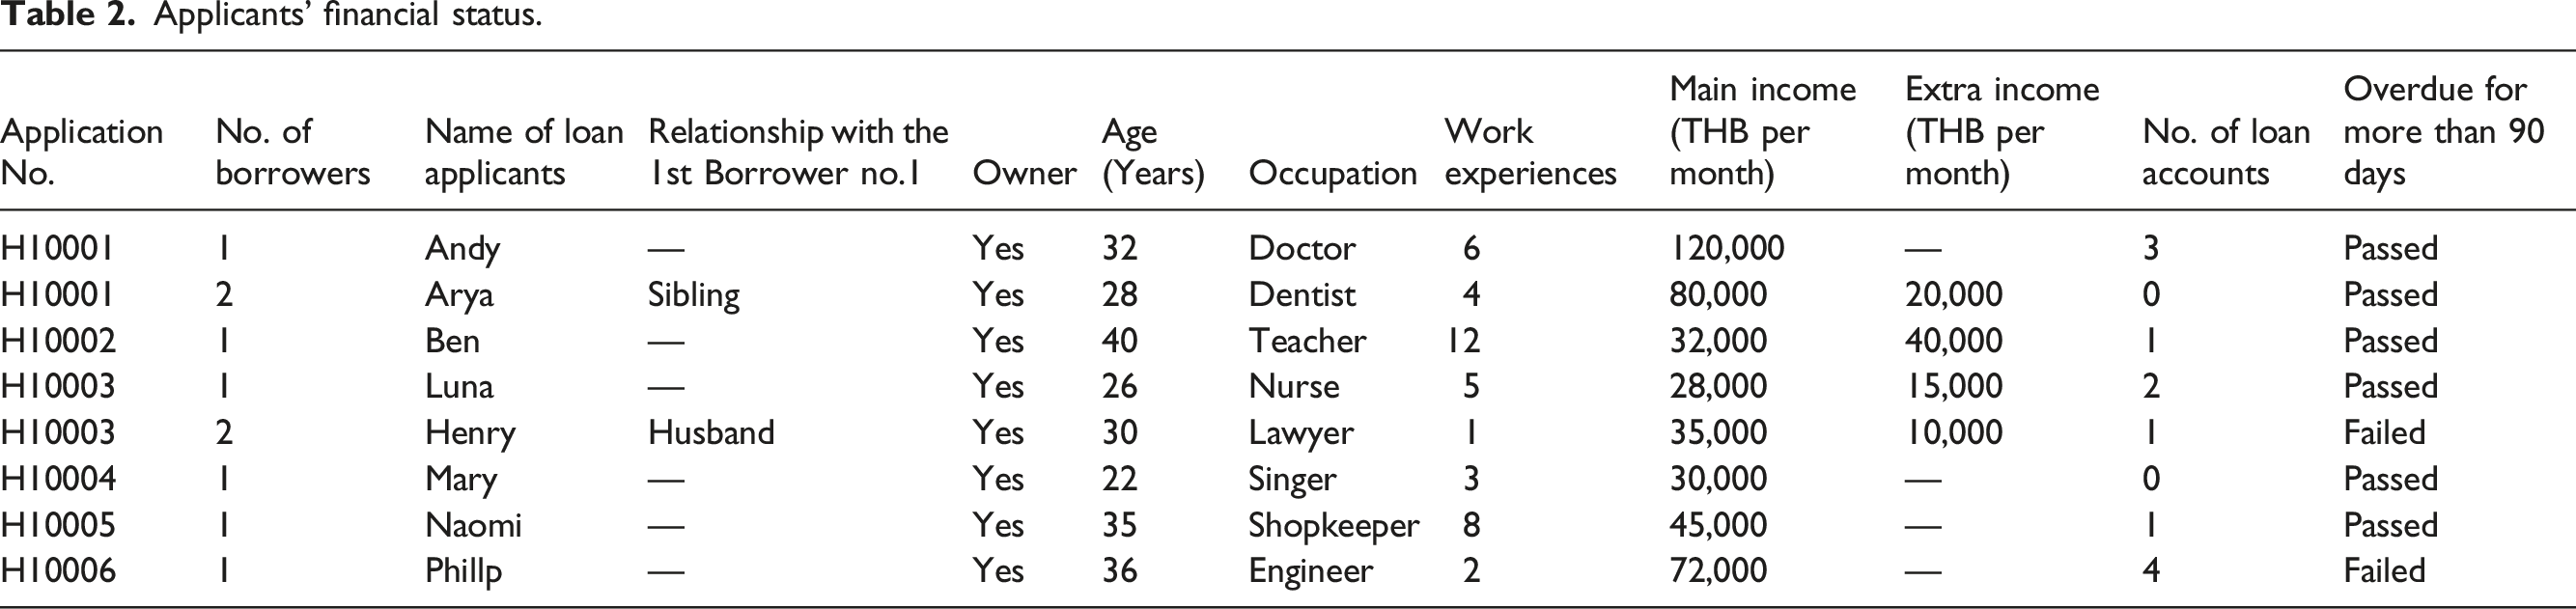
Hugo gave Jong and Kampu a list of the bank’s customers who had just applied for a home loan. All applicants had passed the pre-screening process in terms of financial and property documents (see Table 1). The initial credit limit had also been estimated for each applicant. The existing loan approval process relied heavily on the credit score from the national credit bureau, from which the bank assessed the applicant’s number of collection accounts, foreclosures, bankruptcies, and individual creditworthiness. For example, applicant ID H10006 would be rejected immediately based on the financial information from the national credit bureau. He would be considered a very high-risk customer, with persistent levels of debt. Applicant ID H10003 needed to apply by herself, as her husband had been in arrears for over three months. (See Table 2.) The bank was also strict about following these guidelines: 1. The applicants needed to be over 20 years old. 2. The term (repayment period) could not exceed 30 years and the borrower’s current age and the term combined must not exceed 70 years. 3. A single person requesting a loan must have a net income of 15,000 baht per month or more. 4. In the case of joint borrowers, the main borrower and co-borrower must have a combined net income of 15,000 baht per month. 5. The applicants must have been in their current job for at least 6 months. 6. Self-employed applicants or entrepreneurs must have been in the business for at least 1 year. 7. The borrower must have the title to the collateral. The home loan applications. Applicants’ financial status.
The initial decision
After the meeting, Jong turned the issue over to Kampu and asked her, as a GIS solution expert, to propose how a GIS could help improve the ABC Bank of Thailand’s appraisal process. What factors should Hugo consider when evaluating the property? What data were needed and how should the data be collected? Kampu had about two weeks to prepare a proposal for a geographic information system (GIS)-based appraisal approach for the next team meeting on July 14. This proposal would accordingly be presented to the top management of the bank, which was scheduled to meet on August 1. Eventually, both Jong and Kampu would have to recommend to the ABC Bank of Thailand the appraisal value for each home loan application.
Discussion questions
1. What factors should be considered when evaluating the property? 2. What data was needed and how should the data be collected?
Case B: geographic information systems
Initial appraisal values
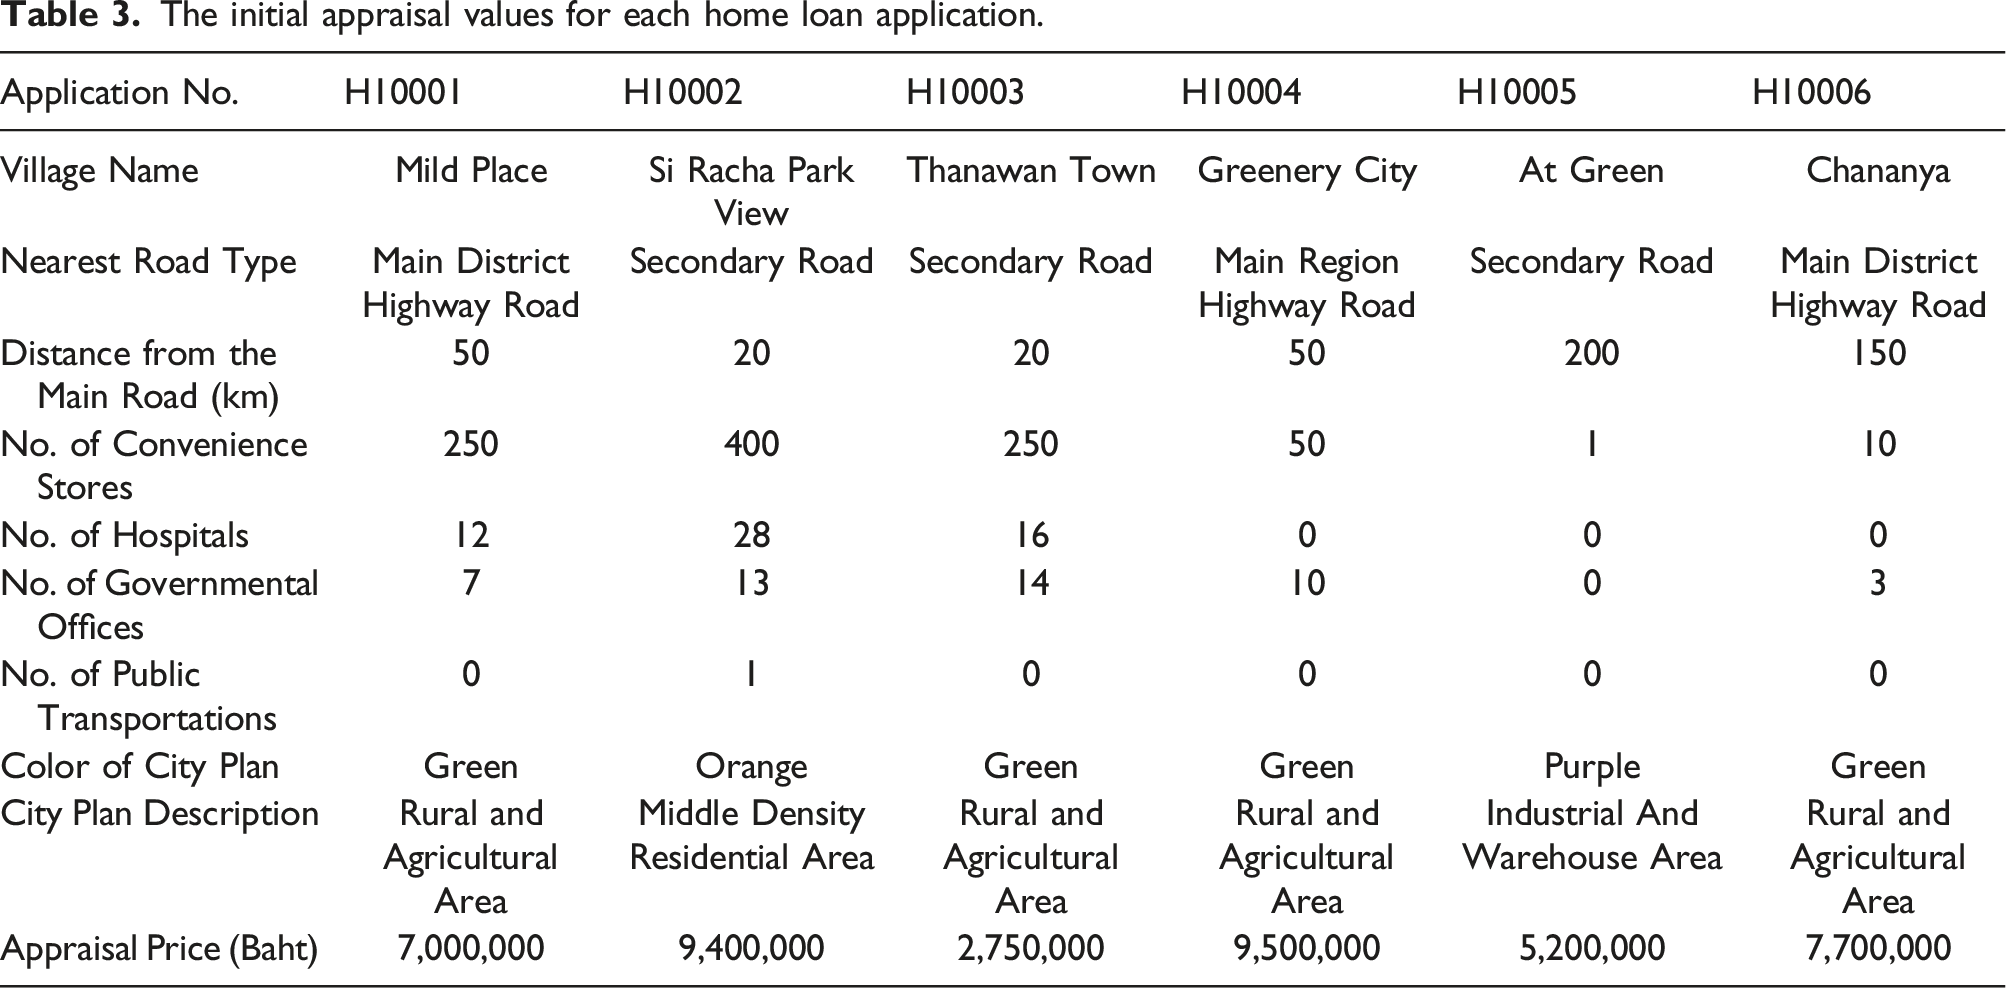
On July 14, Jong started the meeting by reviewing the current factors the bank’s appraisal teams used to evaluate the properties. During the onsite visits, the teams rechecked all the applicant’s required documents, assessed the condition of the house inside and outside, and surveyed the facilities within a 2-kilometer perimeter. The following information was collected based on a manual count and the information the teams could gather from the bank’s database, the website of the properties, and other available sources. 1. The types of roads nearest to the house, such as regional highways, urban streets, or rural, low-speed, low-volume roads. 2. The number of convenience stores or department stores within 2 kilometers 3. The number of hospitals within 2 kilometers 4. The number of governmental offices within 2 kilometers 5. The public transportation available within 2 kilometers
Additionally, the appraisal teams had to compare the location of the property with the city plan by looking at the color-coded categories, as follows: Yellow: Low Density Residential Area Orange: Middle Density Residential Area Brown: High Density Residential Area Red: Commercial Area Purple: Industrial Area Lilac: Warehouse Area Violet: Particular Industrial Area Green: Rural and Agricultural Area Olive Green: Educational Institutions Area White with Green Diagonal: Rural and Agricultural Conservation Area Light Brown: Thai Art and Cultural Conservation Area Gray: Religious Institutions Area Blue: Government Institutes, Public Utilities, and Amenities Area
The initial appraisal values for each home loan application.
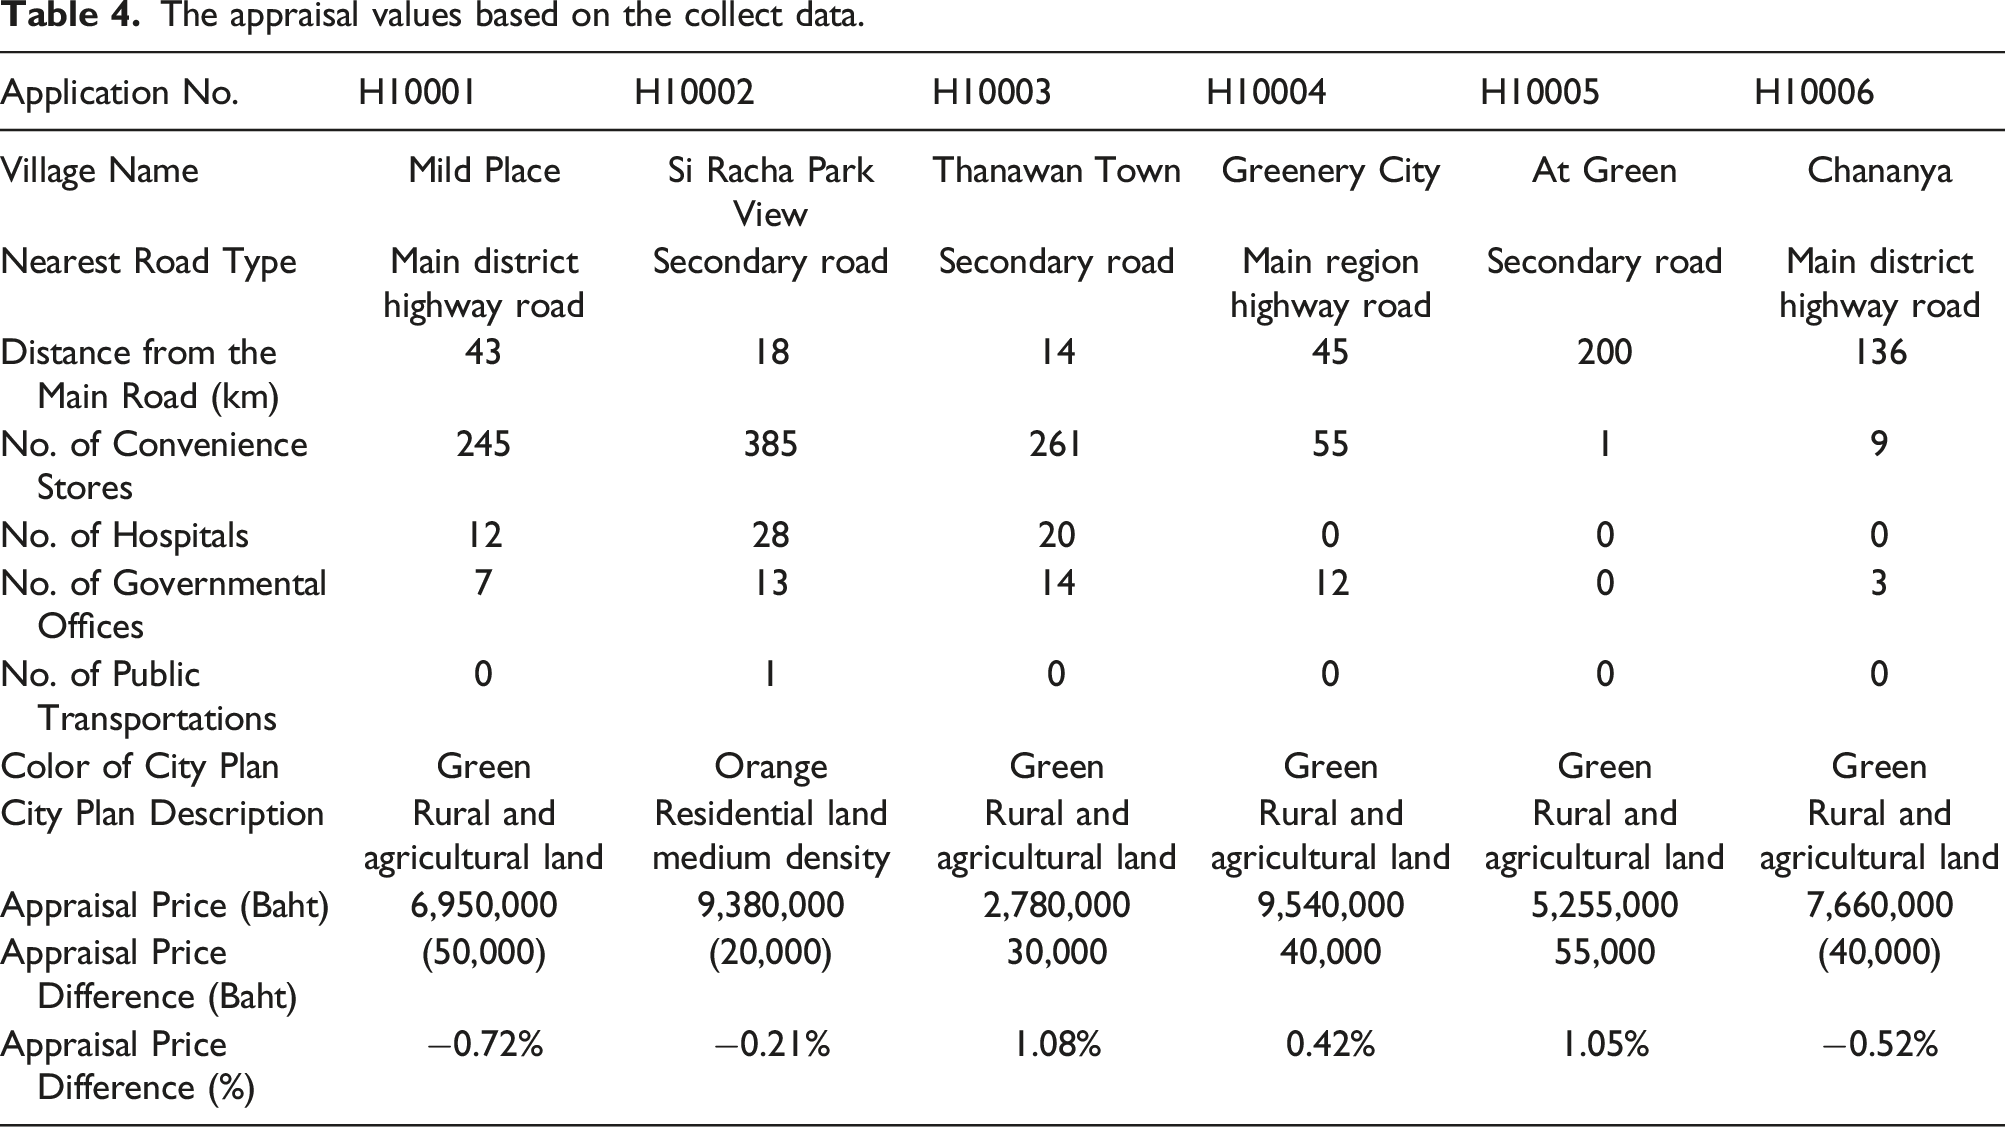
However, Kampu figured out there was a big gap between the GIS data and the data the appraisal teams had collected manually. In other words, the appraiser team’s survey data was based on their observations. The appraisers had to measure the distances, count the points of interest, and take notes themselves, a process that was difficult to complete and lacked creditability. The spatial data from the GIS was correct. Kampu sent Hugo the GIS survey data and asked him to reevaluate the appraisal values for each application. Hugo responded that there had been a lot of inaccurate information regarding the points of interest, which would have led to miscalculation of the value of the property Table 4.
Introduction to geographic information systems
Kampu explained more about the concept of a GIS: A GIS is a system that captures, manages, analyzes, and displays spatial and geographic data in the form of vector and raster data. Vector data represents points, lines, and polygons, which contain information about location attributes. It provides detailed information about objects such as county boundaries and the location of roads and railroads. Raster data represents a spatial data model and is used to define spaces as an array of equally sized cells or a grid matrix, visualizing and analyzing images or features being observed. Examples of raster data, for instance, are elevation, temperature, aerial photography, and satellite imagery. (See Appendix A)
Jong believed that both vector and raster data from a GIS offered dimensions that the bank might have overlooked. Exploring other points of interest near each applicant’s housing location could change the way the appraiser teams estimated the value of the property. Jong asked Kampu to provide more details about the mechanics of a GIS architecture so that Hugo would understand how a GIS worked and the feasibility of implementing it in this project. The architecture of a GIS is designed into 3 levels: 1) an enterprise geodatabase server, which stores geodata and coordinate data and contains both vector and raster data, which requires special software, 2) a GIS hosting server, which relies on the back-end server software to manage and turn data into a suitable form for running GIS applications, and 3) the application server or portal, which is customized to fit the needs and requirements of the users, and is designed to share maps, scenes, applications, and other geographic data to users inside and outside the organization. (See Appendix B)
Jong added that the GIS could be integrated into the bank’s enterprise systems by transmitting data through the application server tier. The front-end application, or user interface, could be constructed to aid in the appraisal process, while the back-end application of the bank would be connected directly to the back-end application of the GIS so that the housing data were analyzed and then integrated into the bank’s home loan appraisal dashboard. Another integration would be in the GIS hosting server tier, so that the back-end application could call the GIS service to ask for geodata that the existing bank system needed to upgrade and add to the GIS function. Hugo began to understand the system design and how a GIS could be implemented into the current banking system. He said that the GIS sounded promising. It could combine all data relevant to the appraisal process into the executive dashboard to aid in decision making. He asked Kampu to provide more examples of data that could help the appraisal teams. He told the team that this might be a serendipitous test case for furthering his intention to improve the appraisal process. It was time to replace the survey data, standardize the traditional appraisal process, and automate any decisions related to the location of properties when customers submitted loan applications.
Potential assessment with GIS
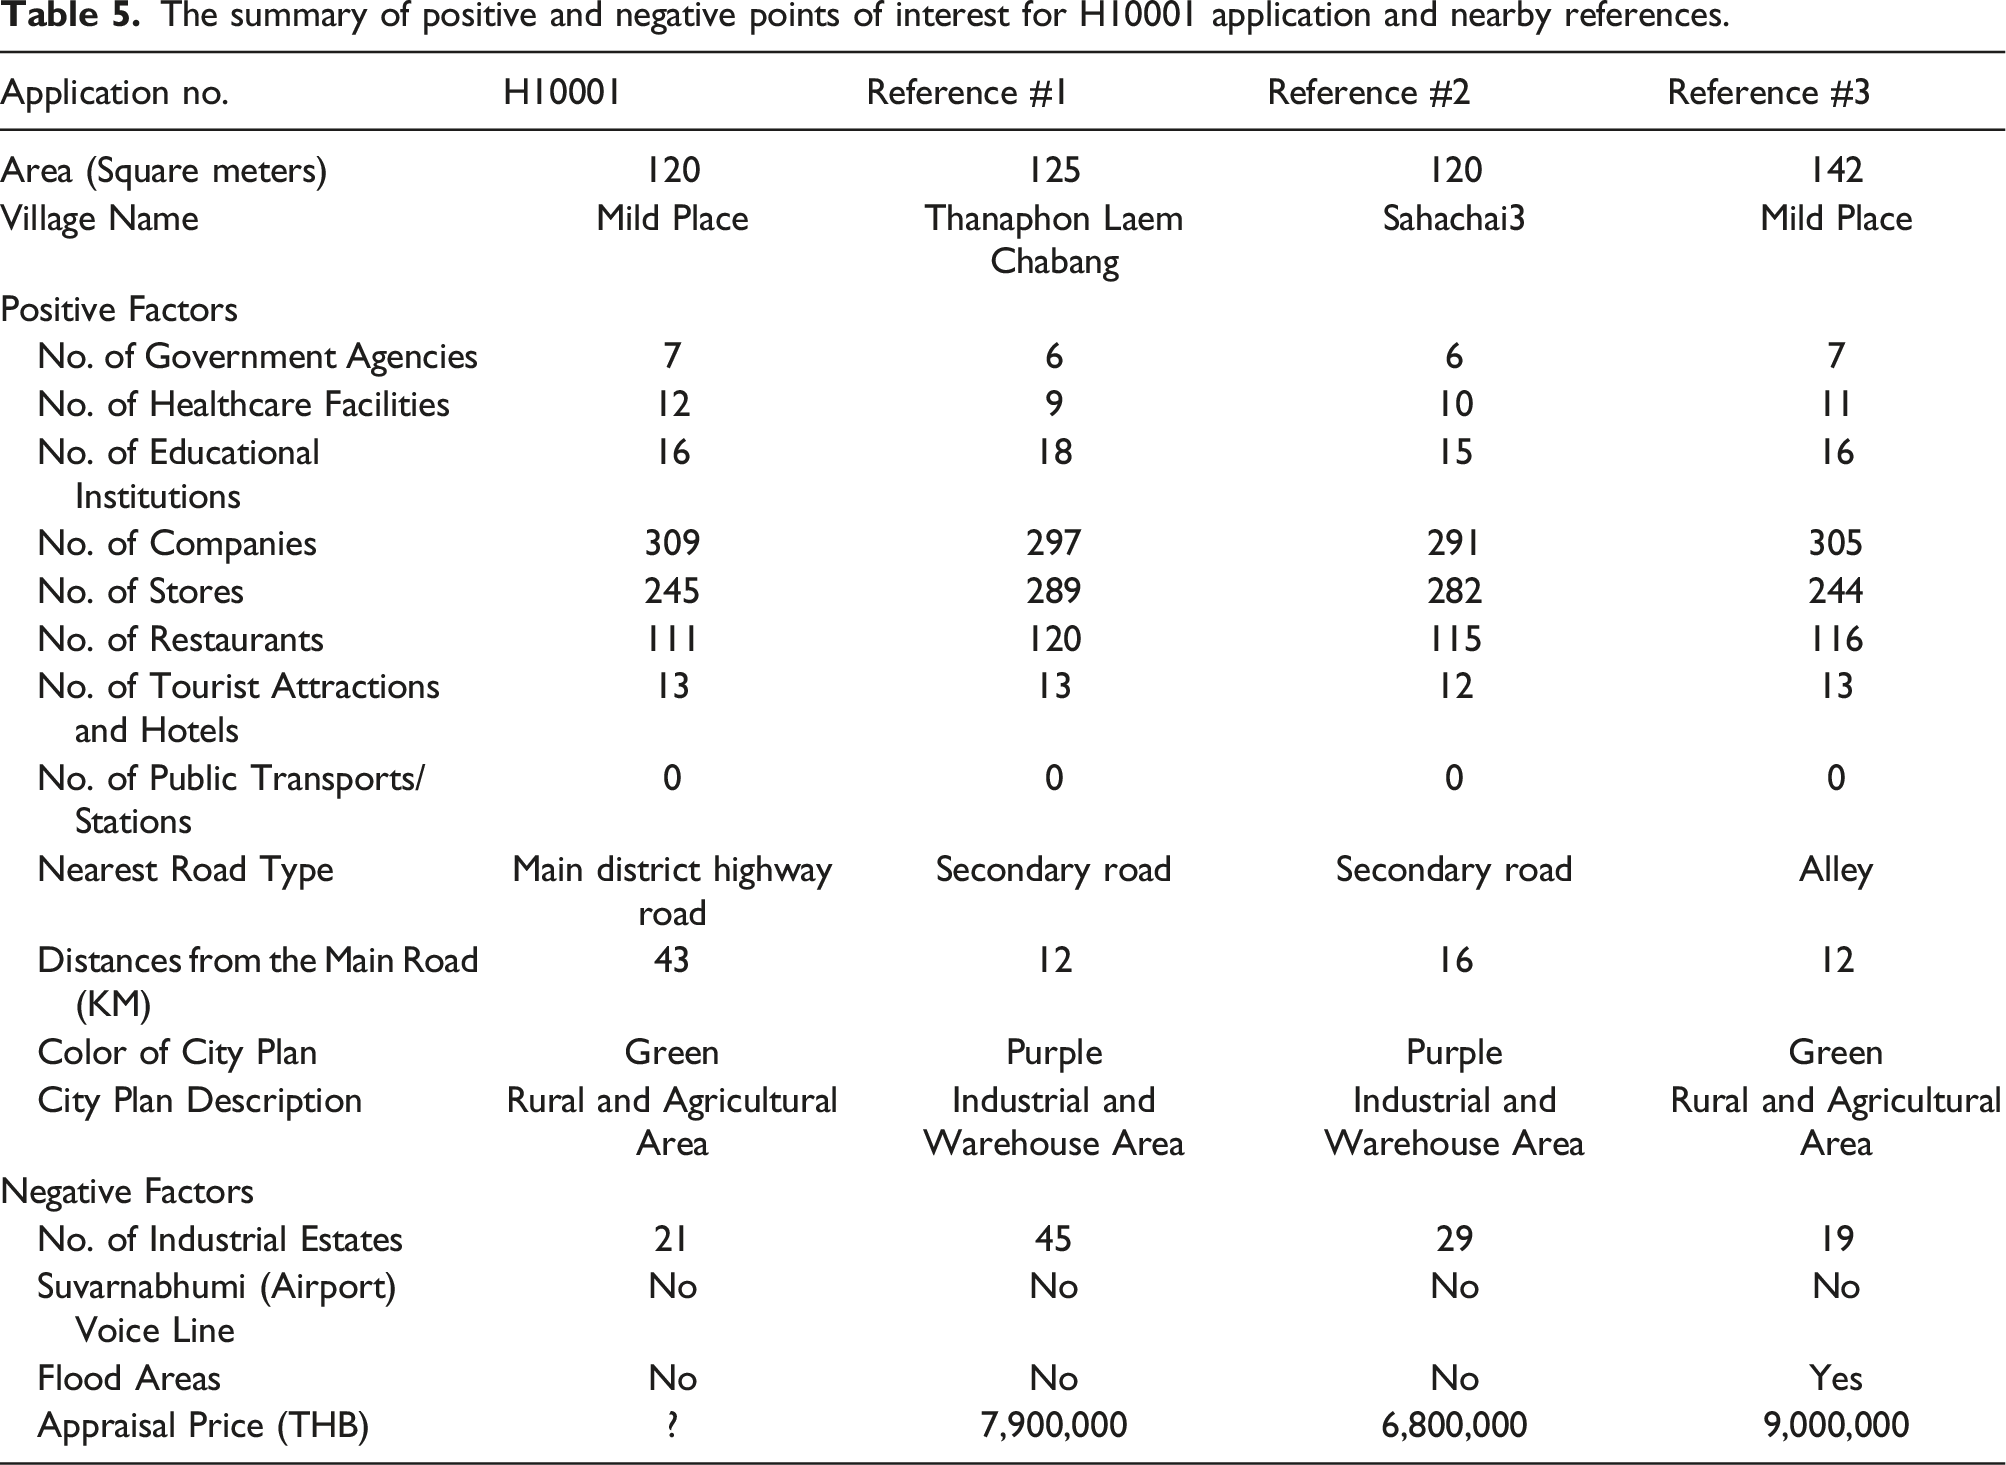
In a GIS, users could select location or points of interest by name, type of location, or area and then the system could provide a summary of the frequency count of each point of interest. Kampu emphasized that these points of interest could impact how the appraiser team estimated the value of the property, either positively and negatively. - Positive factors included government offices, hospitals, schools, universities, companies, convenience stores, supermarkets, markets, shops, restaurants, tourist attractions, entertainment venues, movie theaters, hotels, bus stations, train stations, expressways, and passenger ports. - Negative factors included locations in areas of industrial zones, factories, warehouses, oil depots, gas storage tanks, close to airports, and areas that flood.
The appraisal values based on the collect data.
The summary of positive and negative points of interest for H10001 application and nearby references.
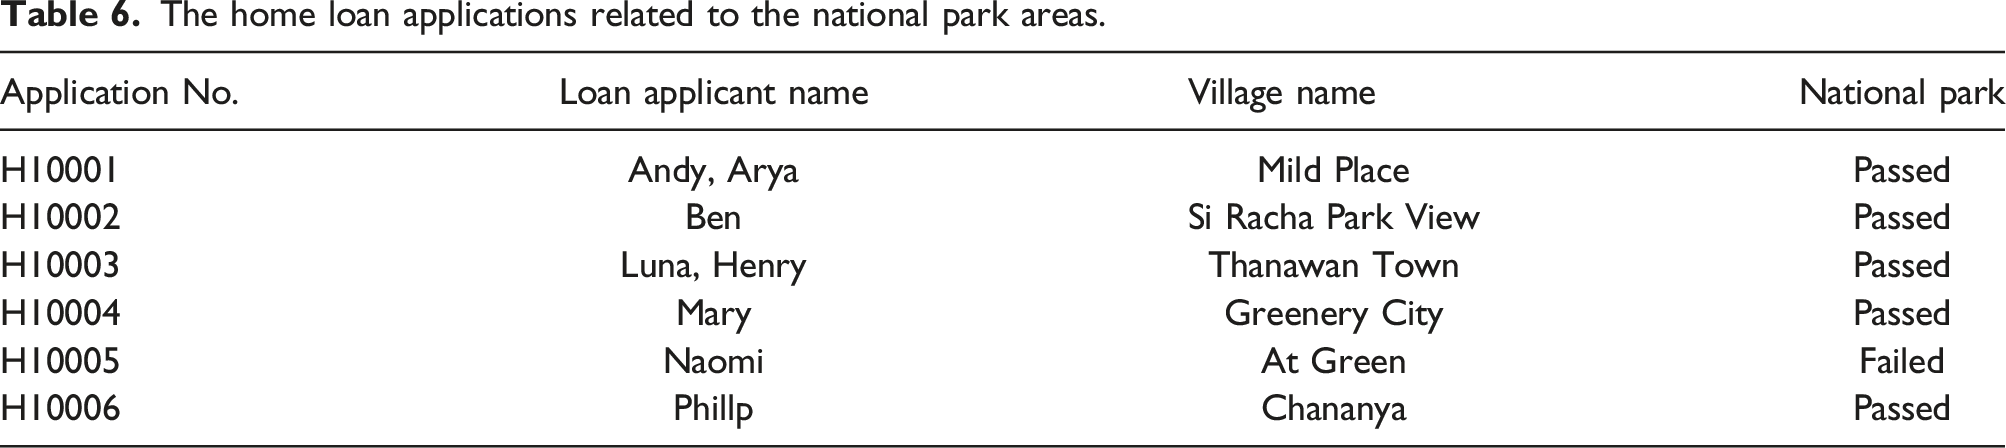
Two scenarios that could have caused damage to the bank were narrowly avoided. - The first case was when one of the home loan applications had already been approved, but it turned out that the property was located in a national park. This happened because the original document regarding the housing information was incorrect. Fortunately, the bank checked with the department of lands before approving the contract. Thus, only the cost of the appraisal was wasted; otherwise, any dispute regarding the land expropriation might have result in the inability for the home loaner to repay the debt. - The second case was about the understated value of the property. The appraised property was located in the city center. The appraiser teams had already assessed the location with three reference locations nearby. The appraiser committees who were responsible for the price approval had on-hand information about a planned land expropriation to build a sky train and that there would be a sky train station in front of the house. As a result, the appraisal value should have been higher. The home loan offer based on the original estimation might not have been high enough and the bank might have lost a valuable customer to a competitor who offered a higher appraisal value.
The home loan applications related to the national park areas.
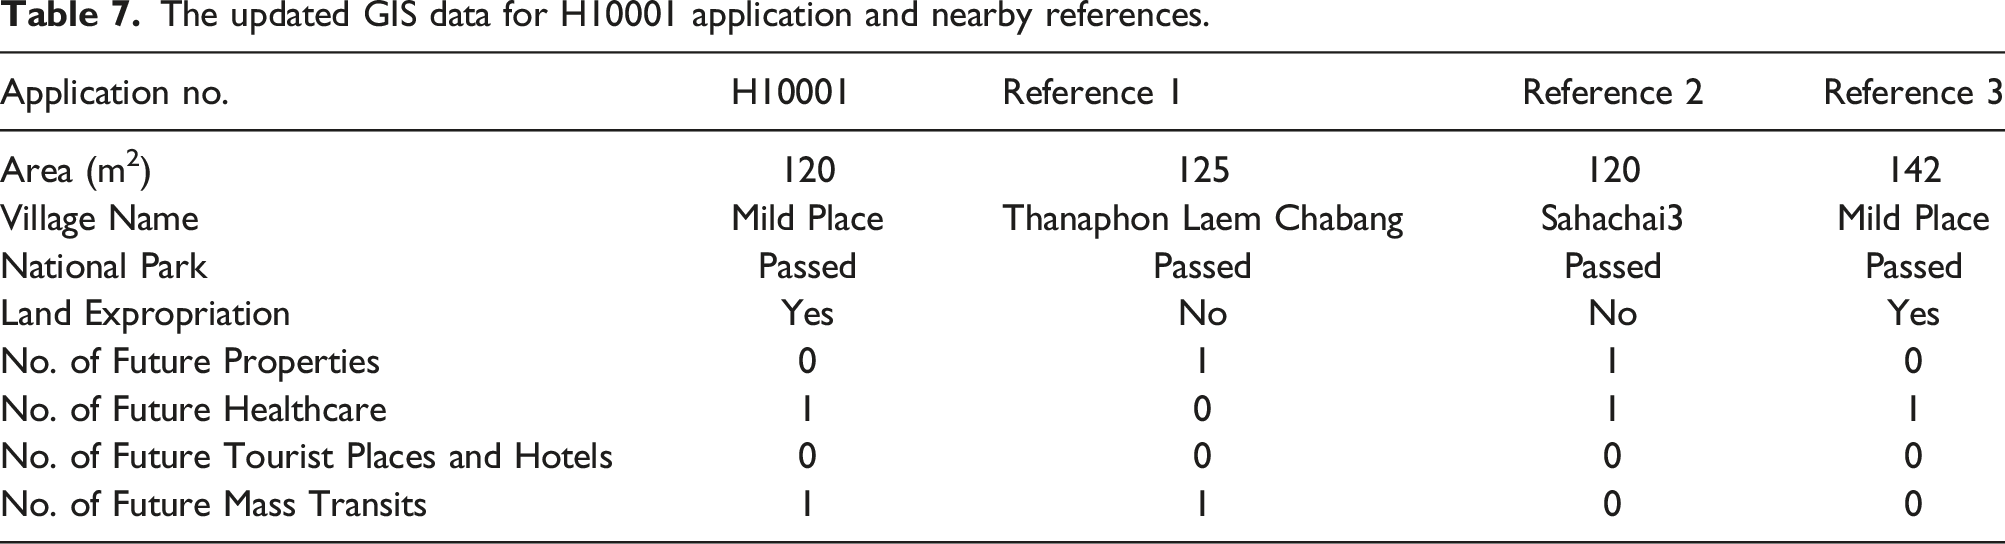
To assess how a GIS could complement the current appraisal process, Jong suggested focusing only on H10001 as a test case for the moment. Hugo believed that the appraisal value should be higher than the original estimation, as there would be an additional healthcare facility and a new mass transit channel in the area. Additionally, the city had given approval for land expropriation in this district, which could be a positive factor meaning that the H10001 applicant could be paid for the seizure of the property, decreasing the chance of defaulting on the loan Table 7.
The end of the meeting questions
Up to this point, Hugo had roughly gotten an idea of how GIS data could aid in the appraisal decision. The GIS looked promising, and he should be able to convince the top management of the bank to invest in a GIS system. Integrating a GIS with the existing enterprise system should be technically feasible. Considering the increased accuracy of the appraisal values, which would save the cost of misestimation and the time the appraisal team spent onsite, Hugo also believed that financial feasibility should not be a constraint. The bigger question for Hugo was how to integrate the GIS data into the appraisal pricing mechanism. How would these positive or negative factors impact the value of the properties? Did anything else need to be included in the appraisal model? He expected Jong to clarify these issues once the team met again on August 30.
Discussion questions
1. How would the positive or negative points of interest impact the value of the properties? 2. What additional factors should be included in the home appraisal process?
Case C: The final verdict
Business intelligence and geographic information systems
On August 30, Jong started the meeting by introducing the concept of business intelligence and analytics to both Hugo and Kampu. Business intelligence (BI) is a broad term that combines methodologies, technologies, applications, analytical techniques, infrastructures, and strategies to help organizations make more data-driven decisions. In some organizations, BI is a technology-driven process that comprises business analytics, data mining techniques, and data visualization tools for analyzing data and delivering actionable insights that help top management make informed business decisions. Other organizations view BI as an initiative that leverages software and services to transform data into useful information that guides an organization strategically and tactically to make better business decisions.
Jong explained further that BI and GIS could be complementary. Many organizations used GIS and BI to help them operate and improve productivity, save costs, and make informed decisions. He added that BI and GIS were becoming more integrated. Hugo admitted that he had thought GIS was like a Google Map getting him from one location to another. He laughed out loud. But many other people as well might understand GIS as GPS or the navigation system for their car. Since the last meeting, he had learned that GIS tools did a lot more than a Google map, especially in adding a spatial dimension to data to make better decisions, like the appraisal cases they were working on.
Kampu agreed with Jong that GIS technology provided greater business intelligence for more success. Several years ago, GIS was mostly just a stand-alone application, focusing on land use or location-related decisions such as where to put the next store or distribution center. But now many business leaders had found more innovative ways to use GIS data, beyond the traditional niches.
The updated GIS data for H10001 application and nearby references.
Machine learning algorithms
Kampu had spent the previous weeks analyzing 30,000 data records of the bank’s home loan appraisal values she had received from Hugo. After going through the data exploration, data cleansing, and data preparation processes, Kampu had built models to predict the percent growth of the value of the properties. She had adopted machine learning techniques such as a decision tree, regression analysis, a support vector machine, and a neural network model to predict the target variable. Jong elaborated, A machine learning algorithm is simply a program (using mathematics, statistics, and logic) that adjusts itself to learn and analyze sample input data, known as training data, improve from experience without human intervention, and predict output values. Machine learning is a type of artificial intelligence that allows software applications to make a prediction or classification or uncover underlying patterns embedded in the data.
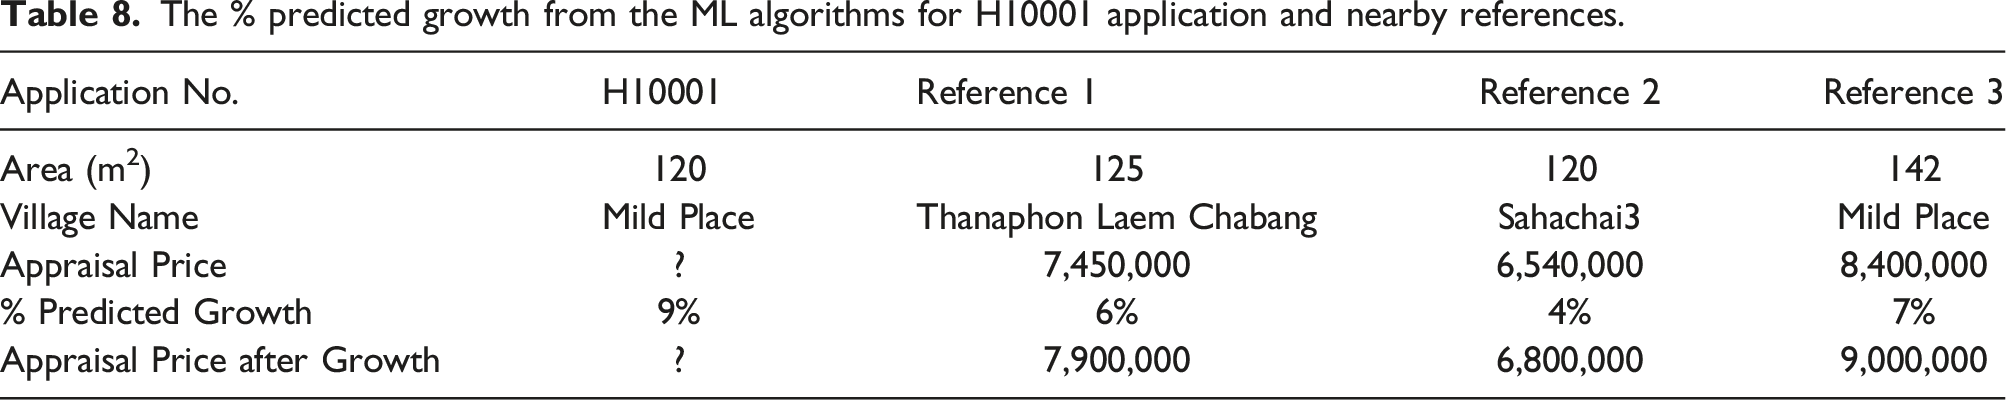
The % predicted growth from the ML algorithms for H10001 application and nearby references.
Weighted quality score dashboard

Input parameters for WQS dashboard.
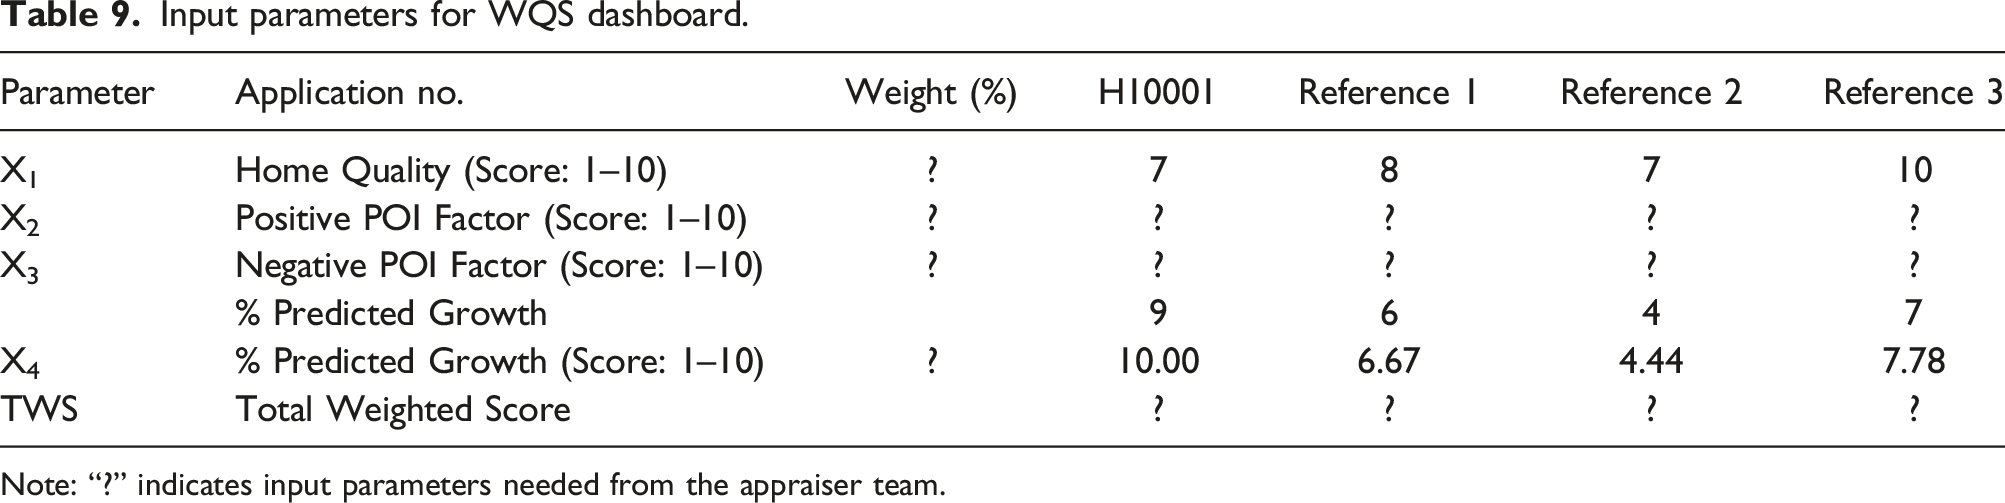
Note: “?” indicates input parameters needed from the appraiser team.
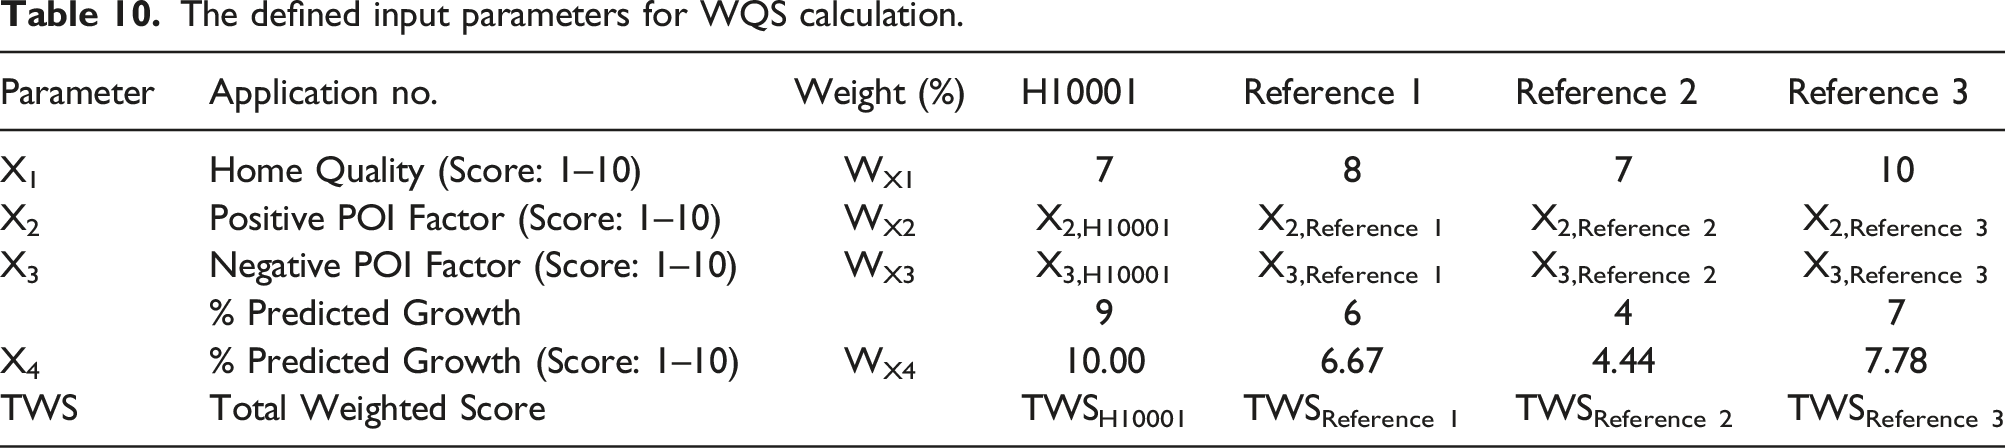
The defined input parameters for WQS calculation.
WQS comparison.
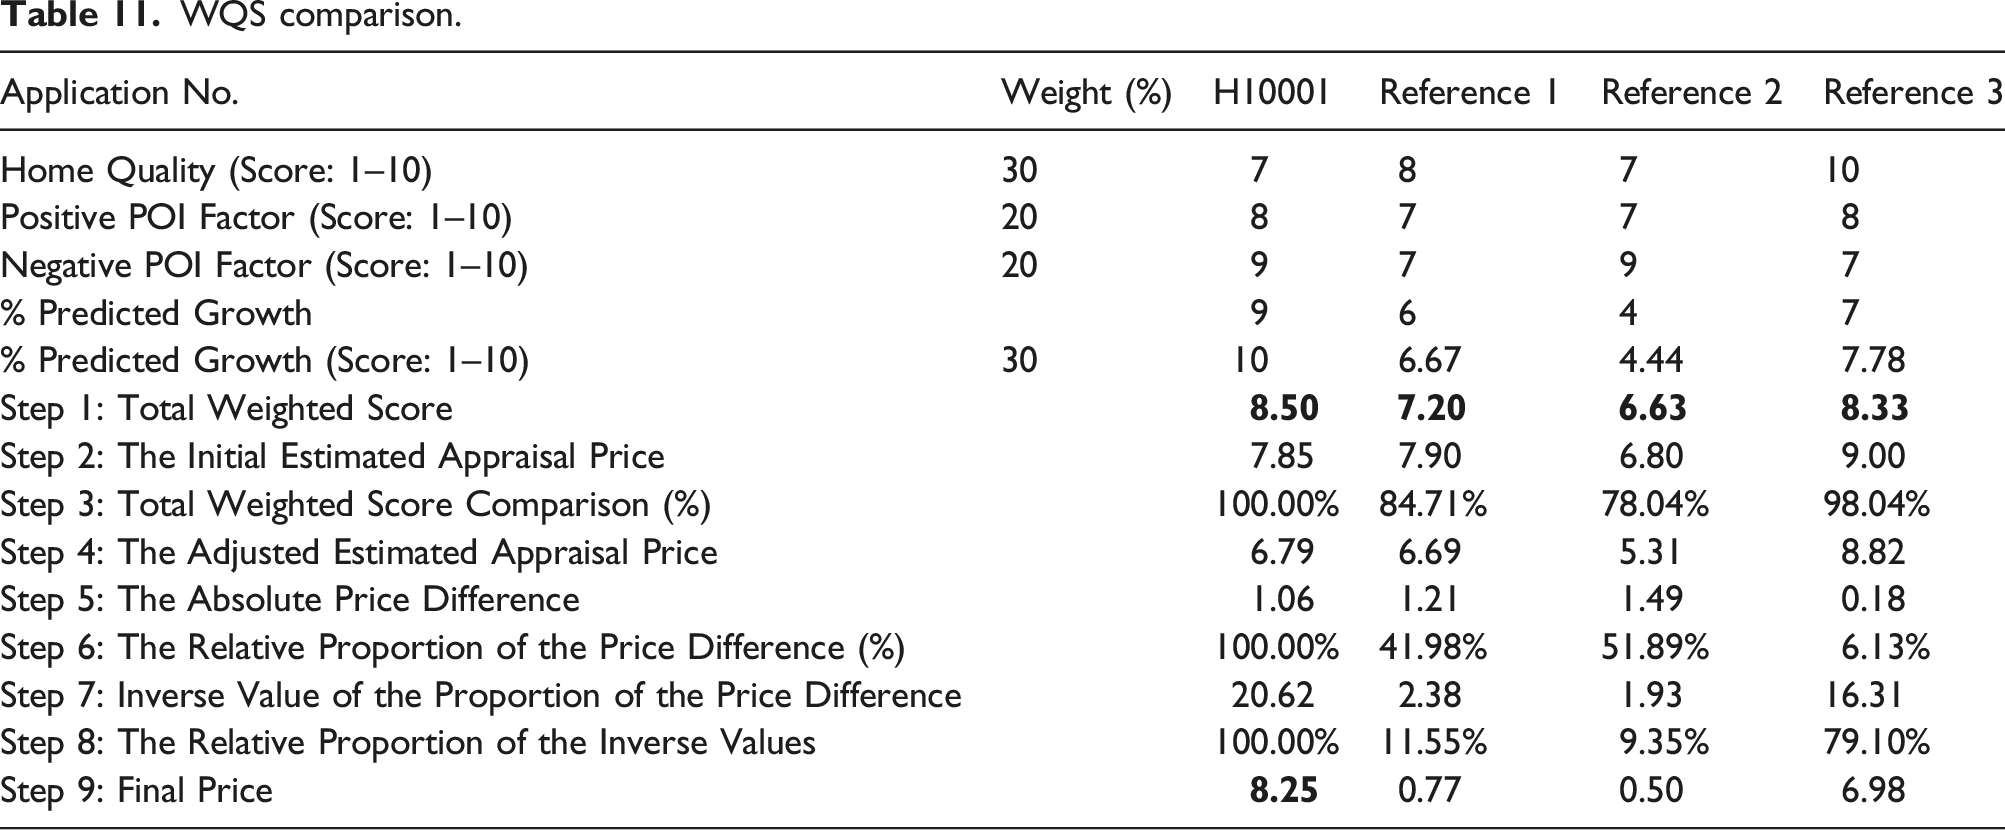
Calculate the total weighted score by multiplying each factor by its weight and then dividing by the sum of the weights. The home qualifying score depends on what information the appraisers gained about the properties, such as lot size, square footage, and no. of bedrooms and bathrooms. They then researched local home sales and determined the home quality score. The predicted percent growth was derived from the machine learning algorithm. Both positive and negative POIs factors were rated based on the GIS data, which gave the appraisers a chance to adjust the scores to reflect the potential value of each location. For instance, the total weighted score of H10001 could be calculated as follows:


Calculate the initial estimated price for the appraisal property from the average of the prices of the referred properties (References 1–3) obtained from both internal and external appraiser teams. The initial estimated price for H10001 equaled 7.85 million baht [(7.9 + 6.8+9)/3]
Compare the total weighted score from all reference properties to the current appraisal property. For instance, the TWS comparison between H10001 and Reference 1 could be calculated as TWSReference1*100%/TWSH10001. The % total weighted score for Reference 1 compared to the TWS for H10001 was 84.71% [7.2*100/8.5]
Recalculate the adjusted estimated price for the appraisal property from the average price of the current reference properties adjusted based on the percent total weighted score in Step #3. The adjusted estimated value for Reference 1 was 6.69 million baht [7.90*84.71%]
Calculate the absolute price differences for each reference property before and after adjusting the total weighted scores. Notice that the focus is on the absolute differences rather than the positive or negative differences. The absolute value difference for Reference 1 was 1.21 million baht [|7.90–6.69|]
Calculate the relative proportion of the appraised price differences among the reference properties by dividing the absolute price difference values in Step 5 for each reference property by the sum of the absolute price difference values for all reference properties. The relative proportion of the appraised value difference for Reference 1 was 41.98% [(1.21 * 100)/(1.21+1.49+0.18)]
Calculate the inverse of the relative proportion of the appraised value difference for each reference property. The inverse of the relative proportion of the appraised value difference for Reference 1 was equal to 2.38 [1/41.98%]
Calculate the relative proportion of the inverse value in Step #7 similar to Step #6. The relative proportion of the inverse value for Reference 1 was 11.55% [(2.38*100)/(2.38+1.93+16.31)]
The final value of the appraisal property is the sum of all of the adjusted estimated appraisal values in Step 4 multiplied by the relative proportion of the inverse value in Step 8. The final price for Reference 1 was 0.7 million baht [6.69 * 11.55%] The final price for Reference 2 was 0.50 million baht [5.31 * 9.35%] The final price for Reference 3 was 6.98 million baht [8.82 * 79.10%] The final price for H10001 was 8.77 million baht [0.77 + 0.50+6.98]
The final verdict
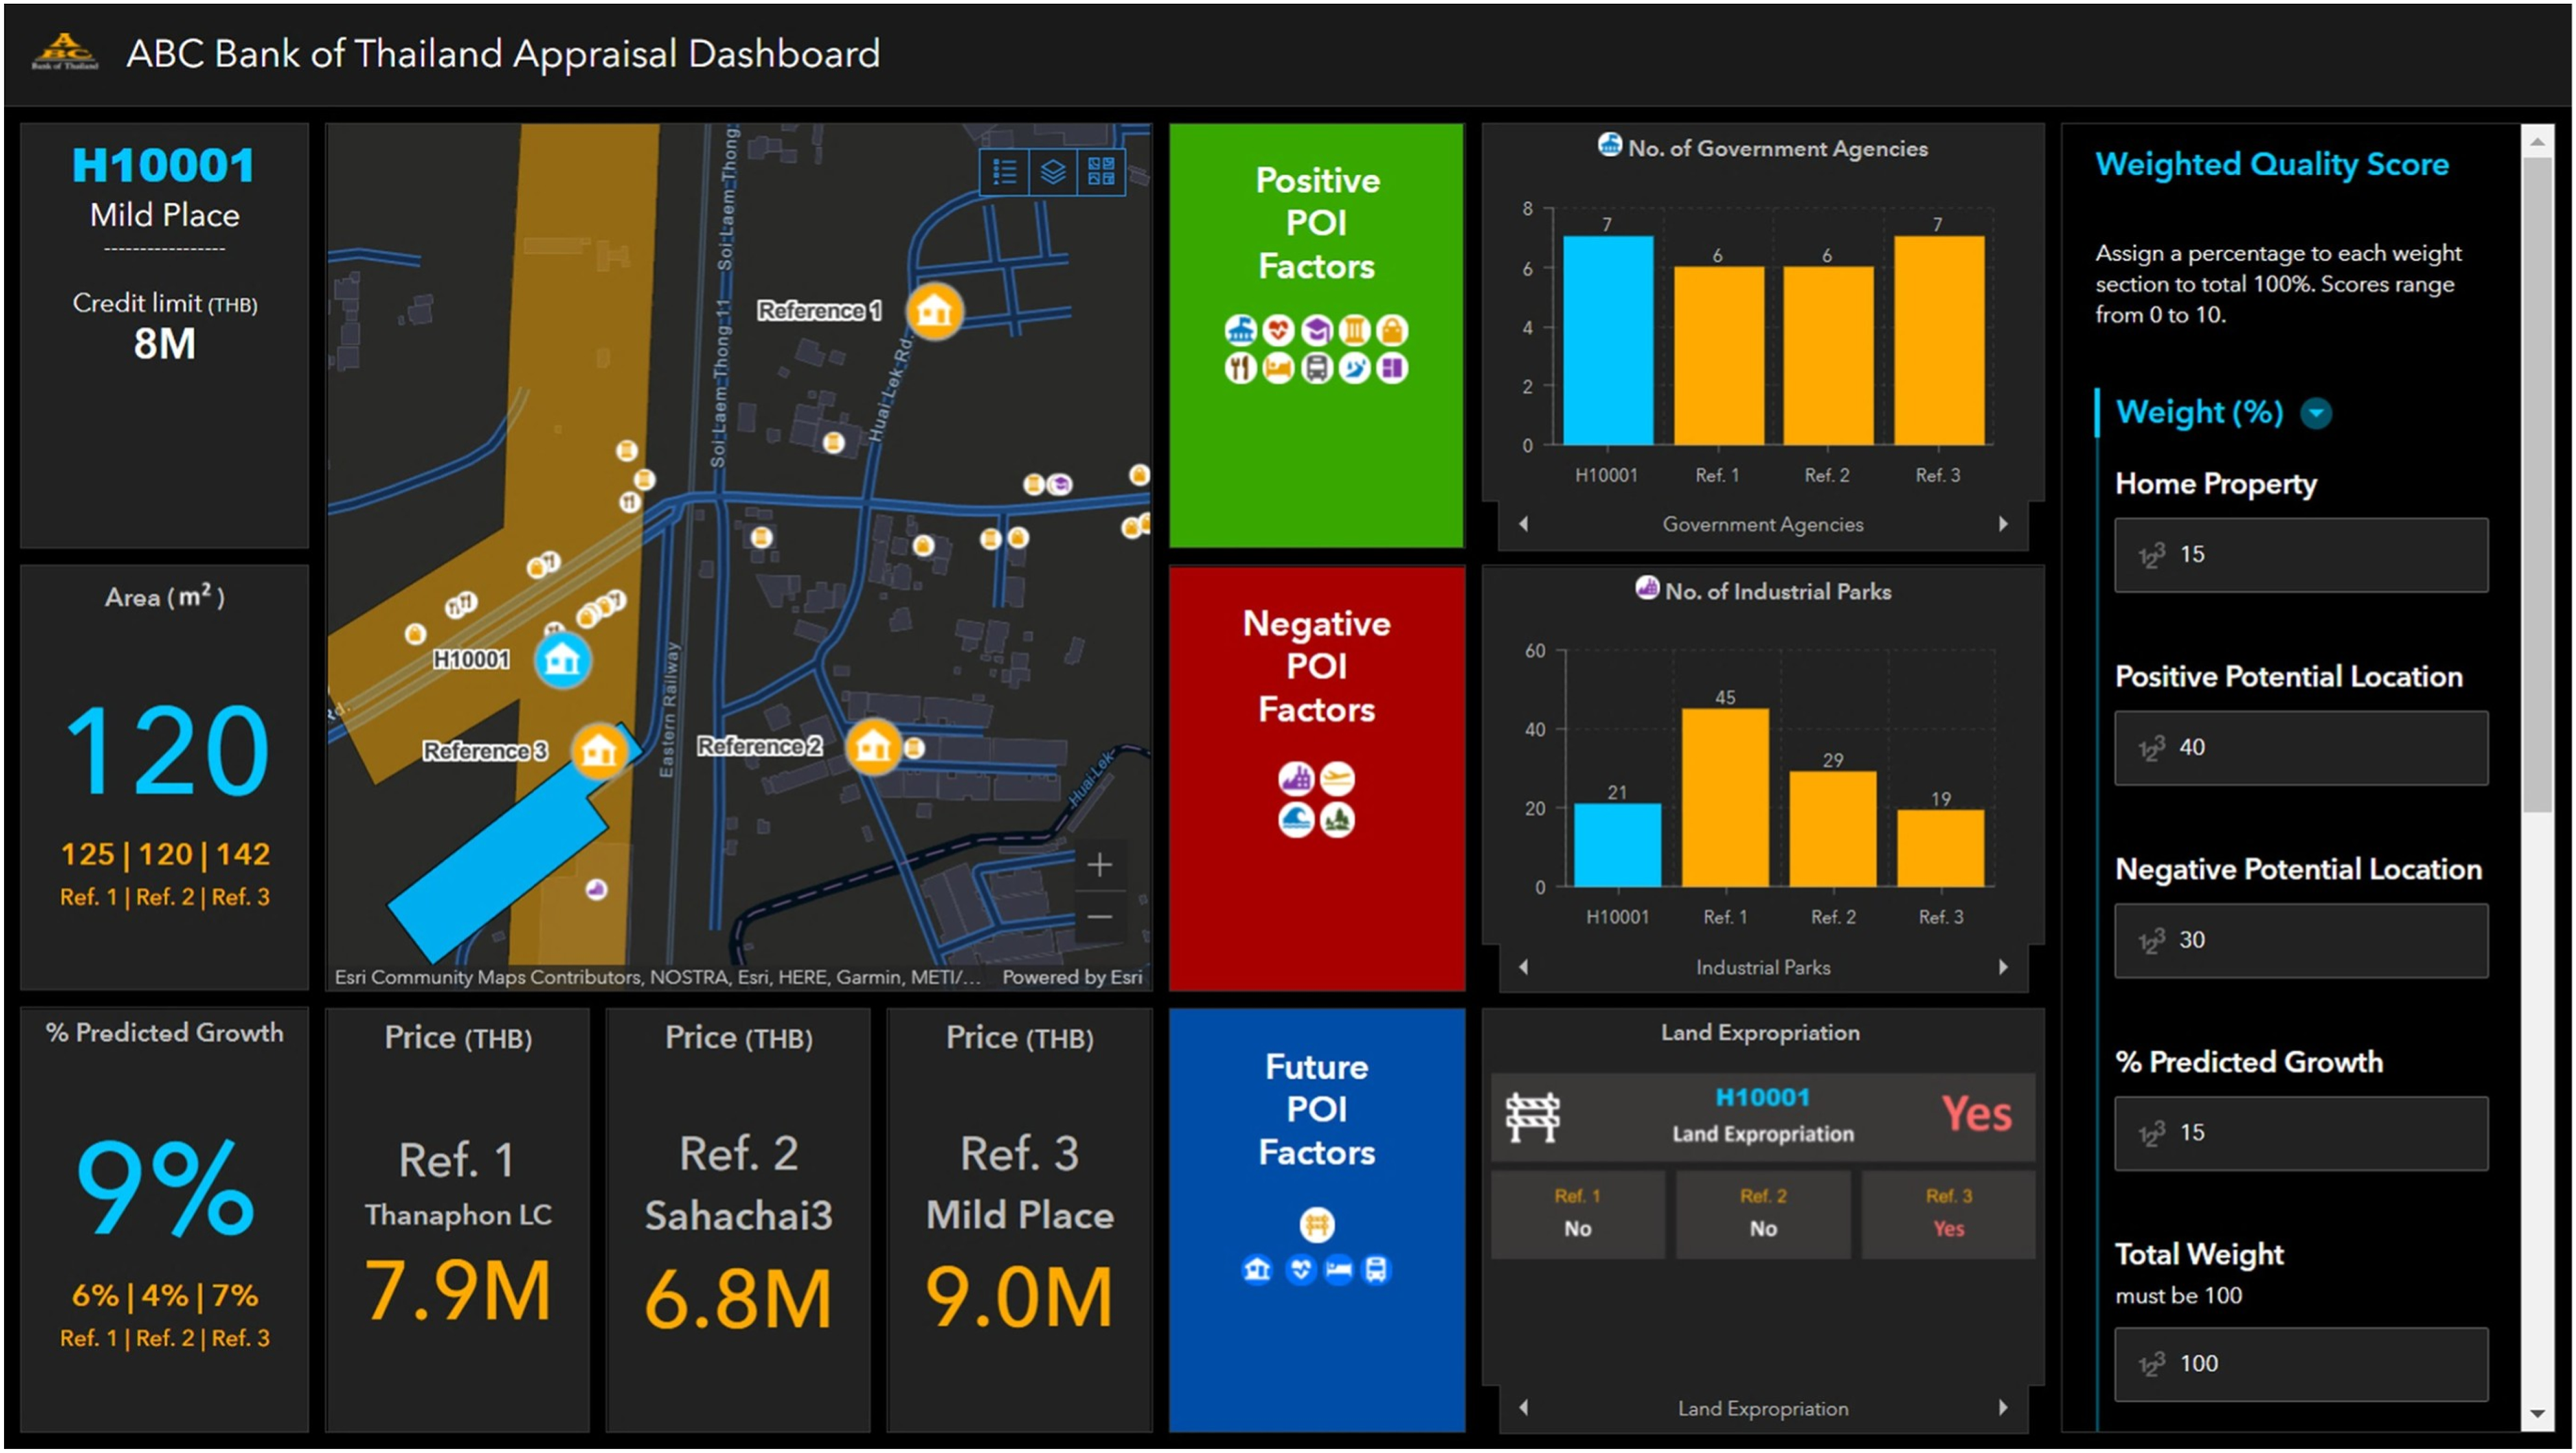
The WQS presented in Table 10 was just an example of how to integrate GIS data with the WQS algorithm to assess the value of the home loan application based on the reference properties that had been appraised by the team. Jong asked Kampu to present the GIS-based business intelligence dashboard (Appendix G) she had designed and developed and allow the appraisal team to interact with the WQS dashboard in real-time. Appraisers could display the location of the houses and other facilities on different types of maps such as topographic, streets, or imagery maps. They could filter out any points of interest for which they would like to collect the statistics, zoom in or zoom out to gather more insights into the properties verify information for a certain aspect, etc. After gathering all information related to GIS data, the dashboard would allow the appraisers to input the positive and negative scores for each property, and adjust the weights of home quality score, positive and negative POI scores, and percent predicted growth factors. Thus, the recommended appraisal values could be calculated automatically.
Taking the case of H10001 as an example, Hugo could insist on using the original appraisal value of 7,000,000 baht recommended by his appraisal team to the home loan committee members and have the contract drawn up at this price. On the other hand, he could utilize this GIS-based BI dashboard to gather more information about the property, adjust related parameters, and try out different scenarios before making the pricing decision. Now, it was time for Hugo to determine the appropriate price for H10001.
Discussion questions
1. What factors should be included in the home appraisal process? 2. Please construct the GIS-based business intelligence architecture for the home appraisal process and identify the components and their interrelated functions. 3. Assume you have been appointed to one of the appraisal teams and your responsibility is to help determine the appropriate appraisal value for H10001, what value should Hugo recommend to the home loan committee members?
Please visit the following URL for a real-time GIS-based business intelligence dashboard for this case study
https://experience.arcgis.com/experience/cc60a12b27d54ebe90dc58b5301daaaf
Footnotes
Declaration of conflicting interests
The author(s) declared no potential conflicts of interest with respect to the research, authorship, and/or publication of this article.
Funding
The author(s) received no financial support for the research, authorship, and/or publication of this article.
Author’s note
This case is based on real data that has been anonymized, and that the case is for educational purposes only.
Appendix
Vector and Raster data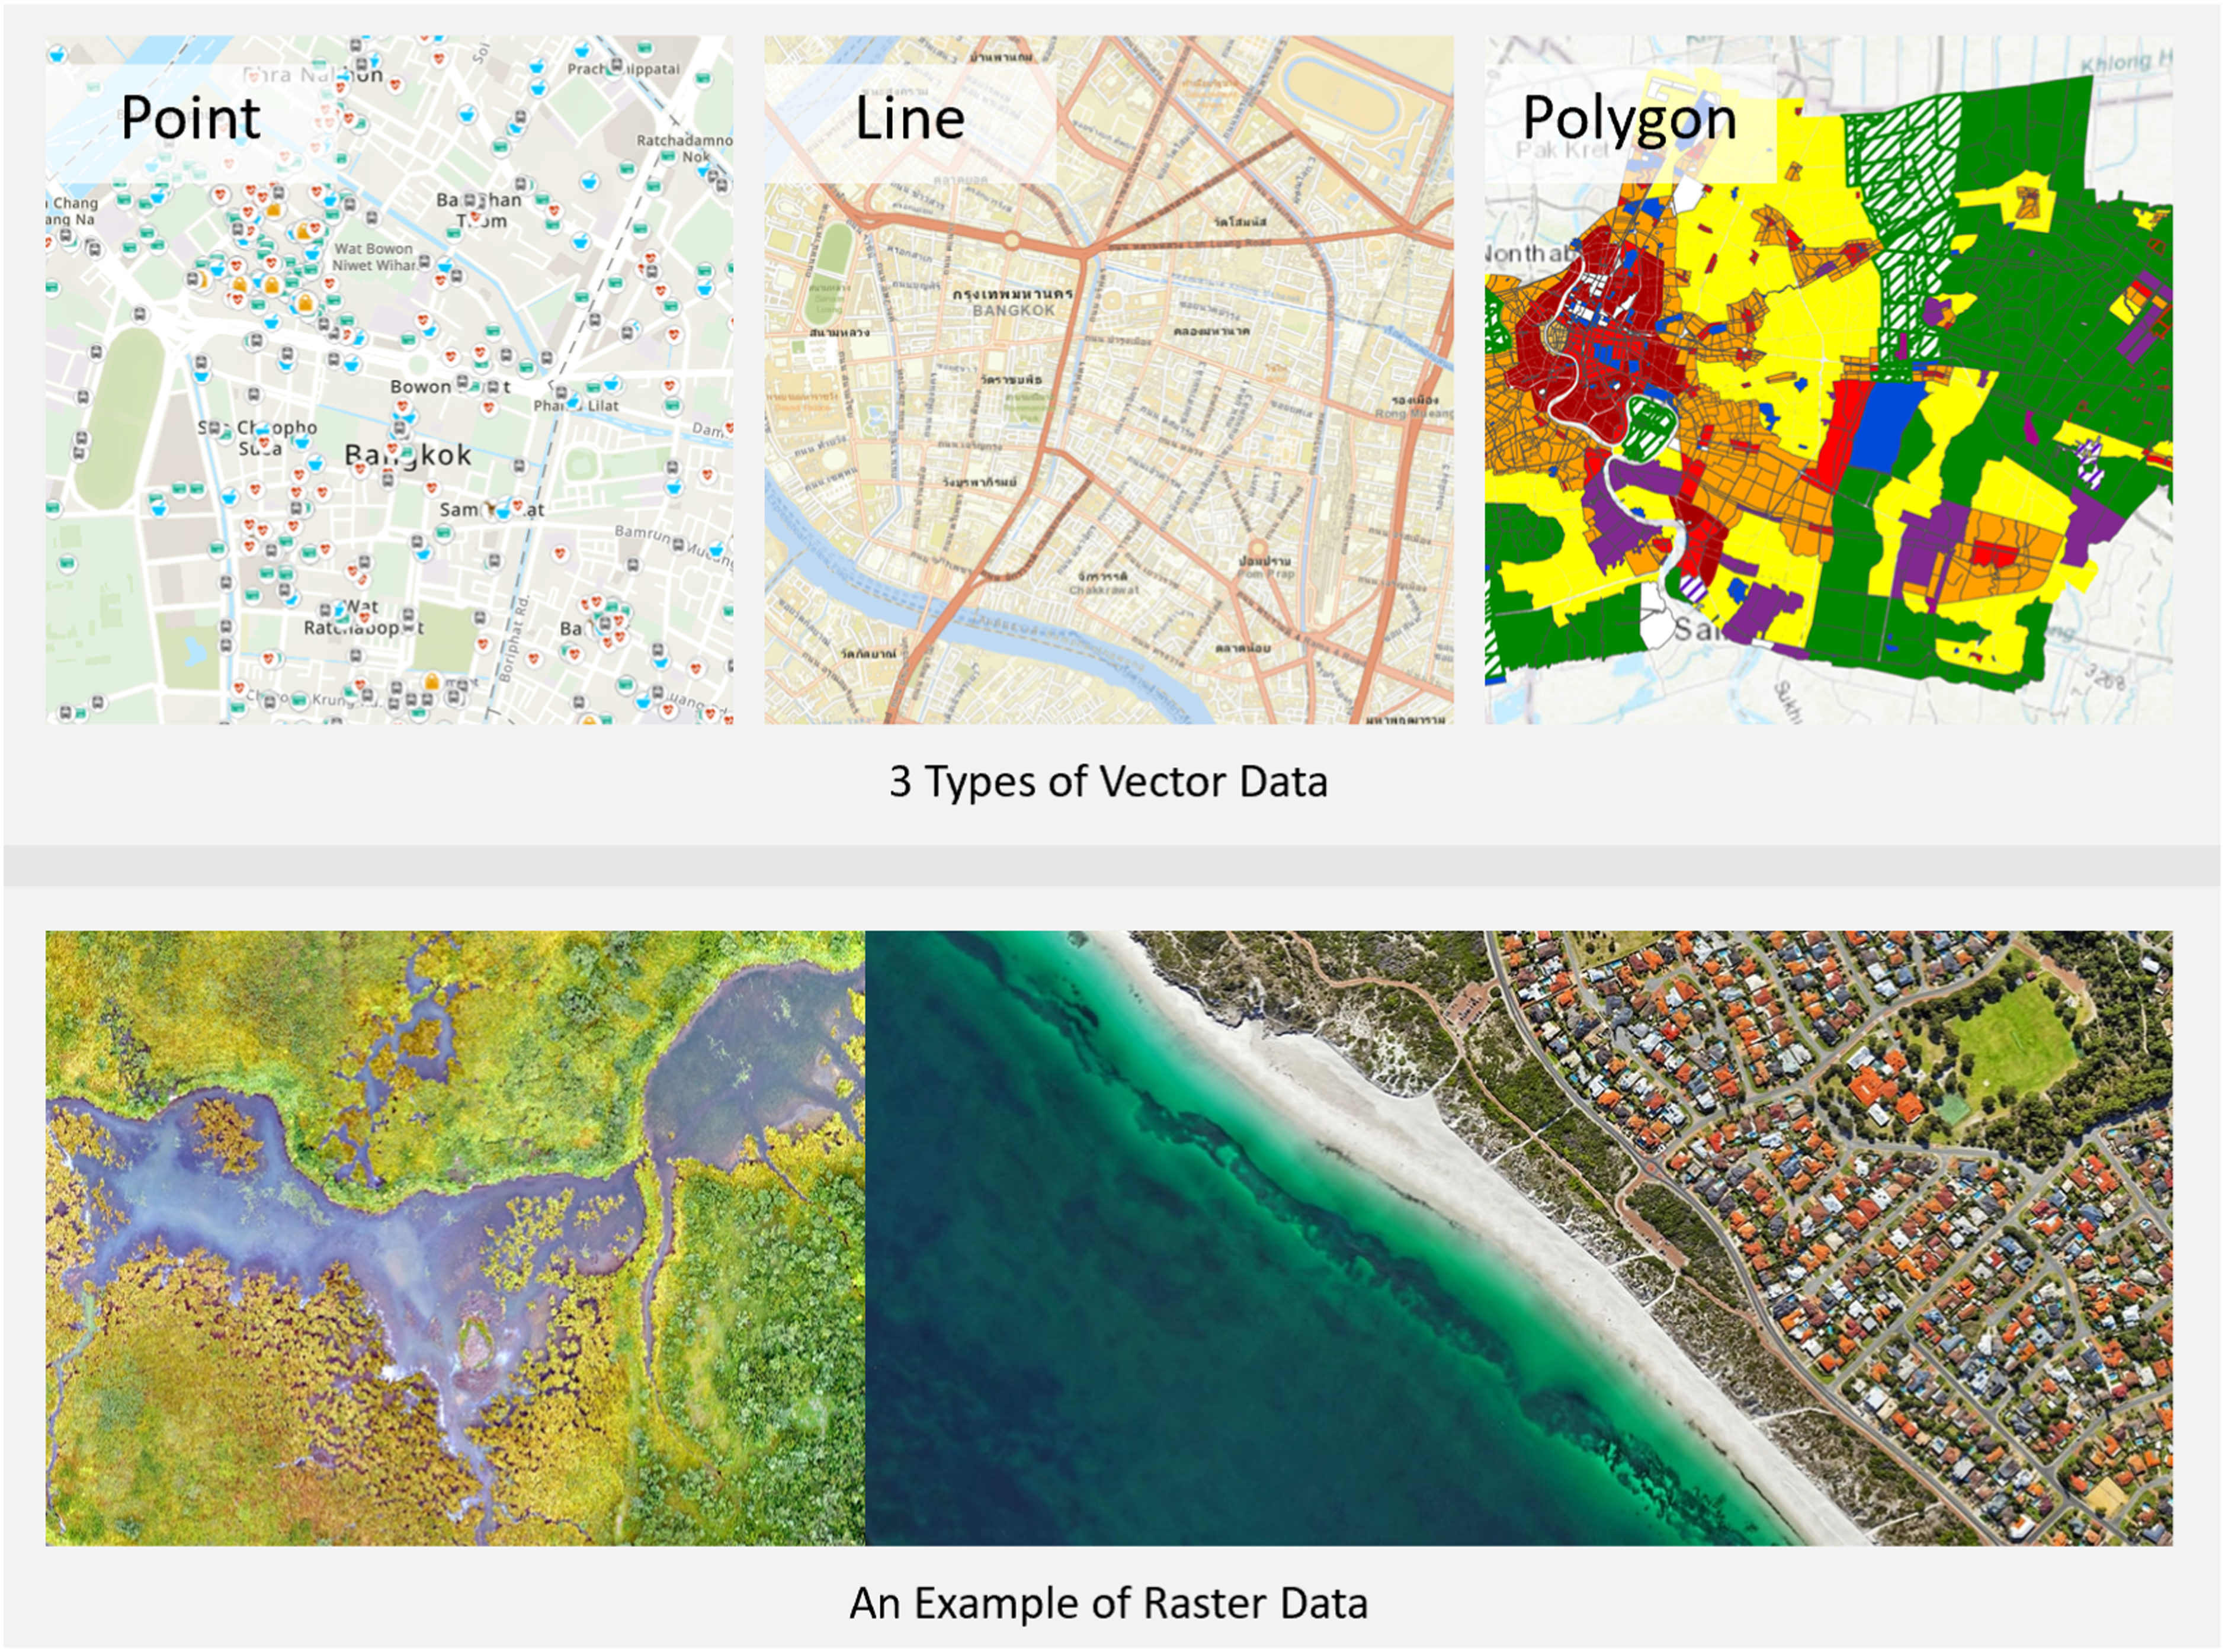
The GIS Architecture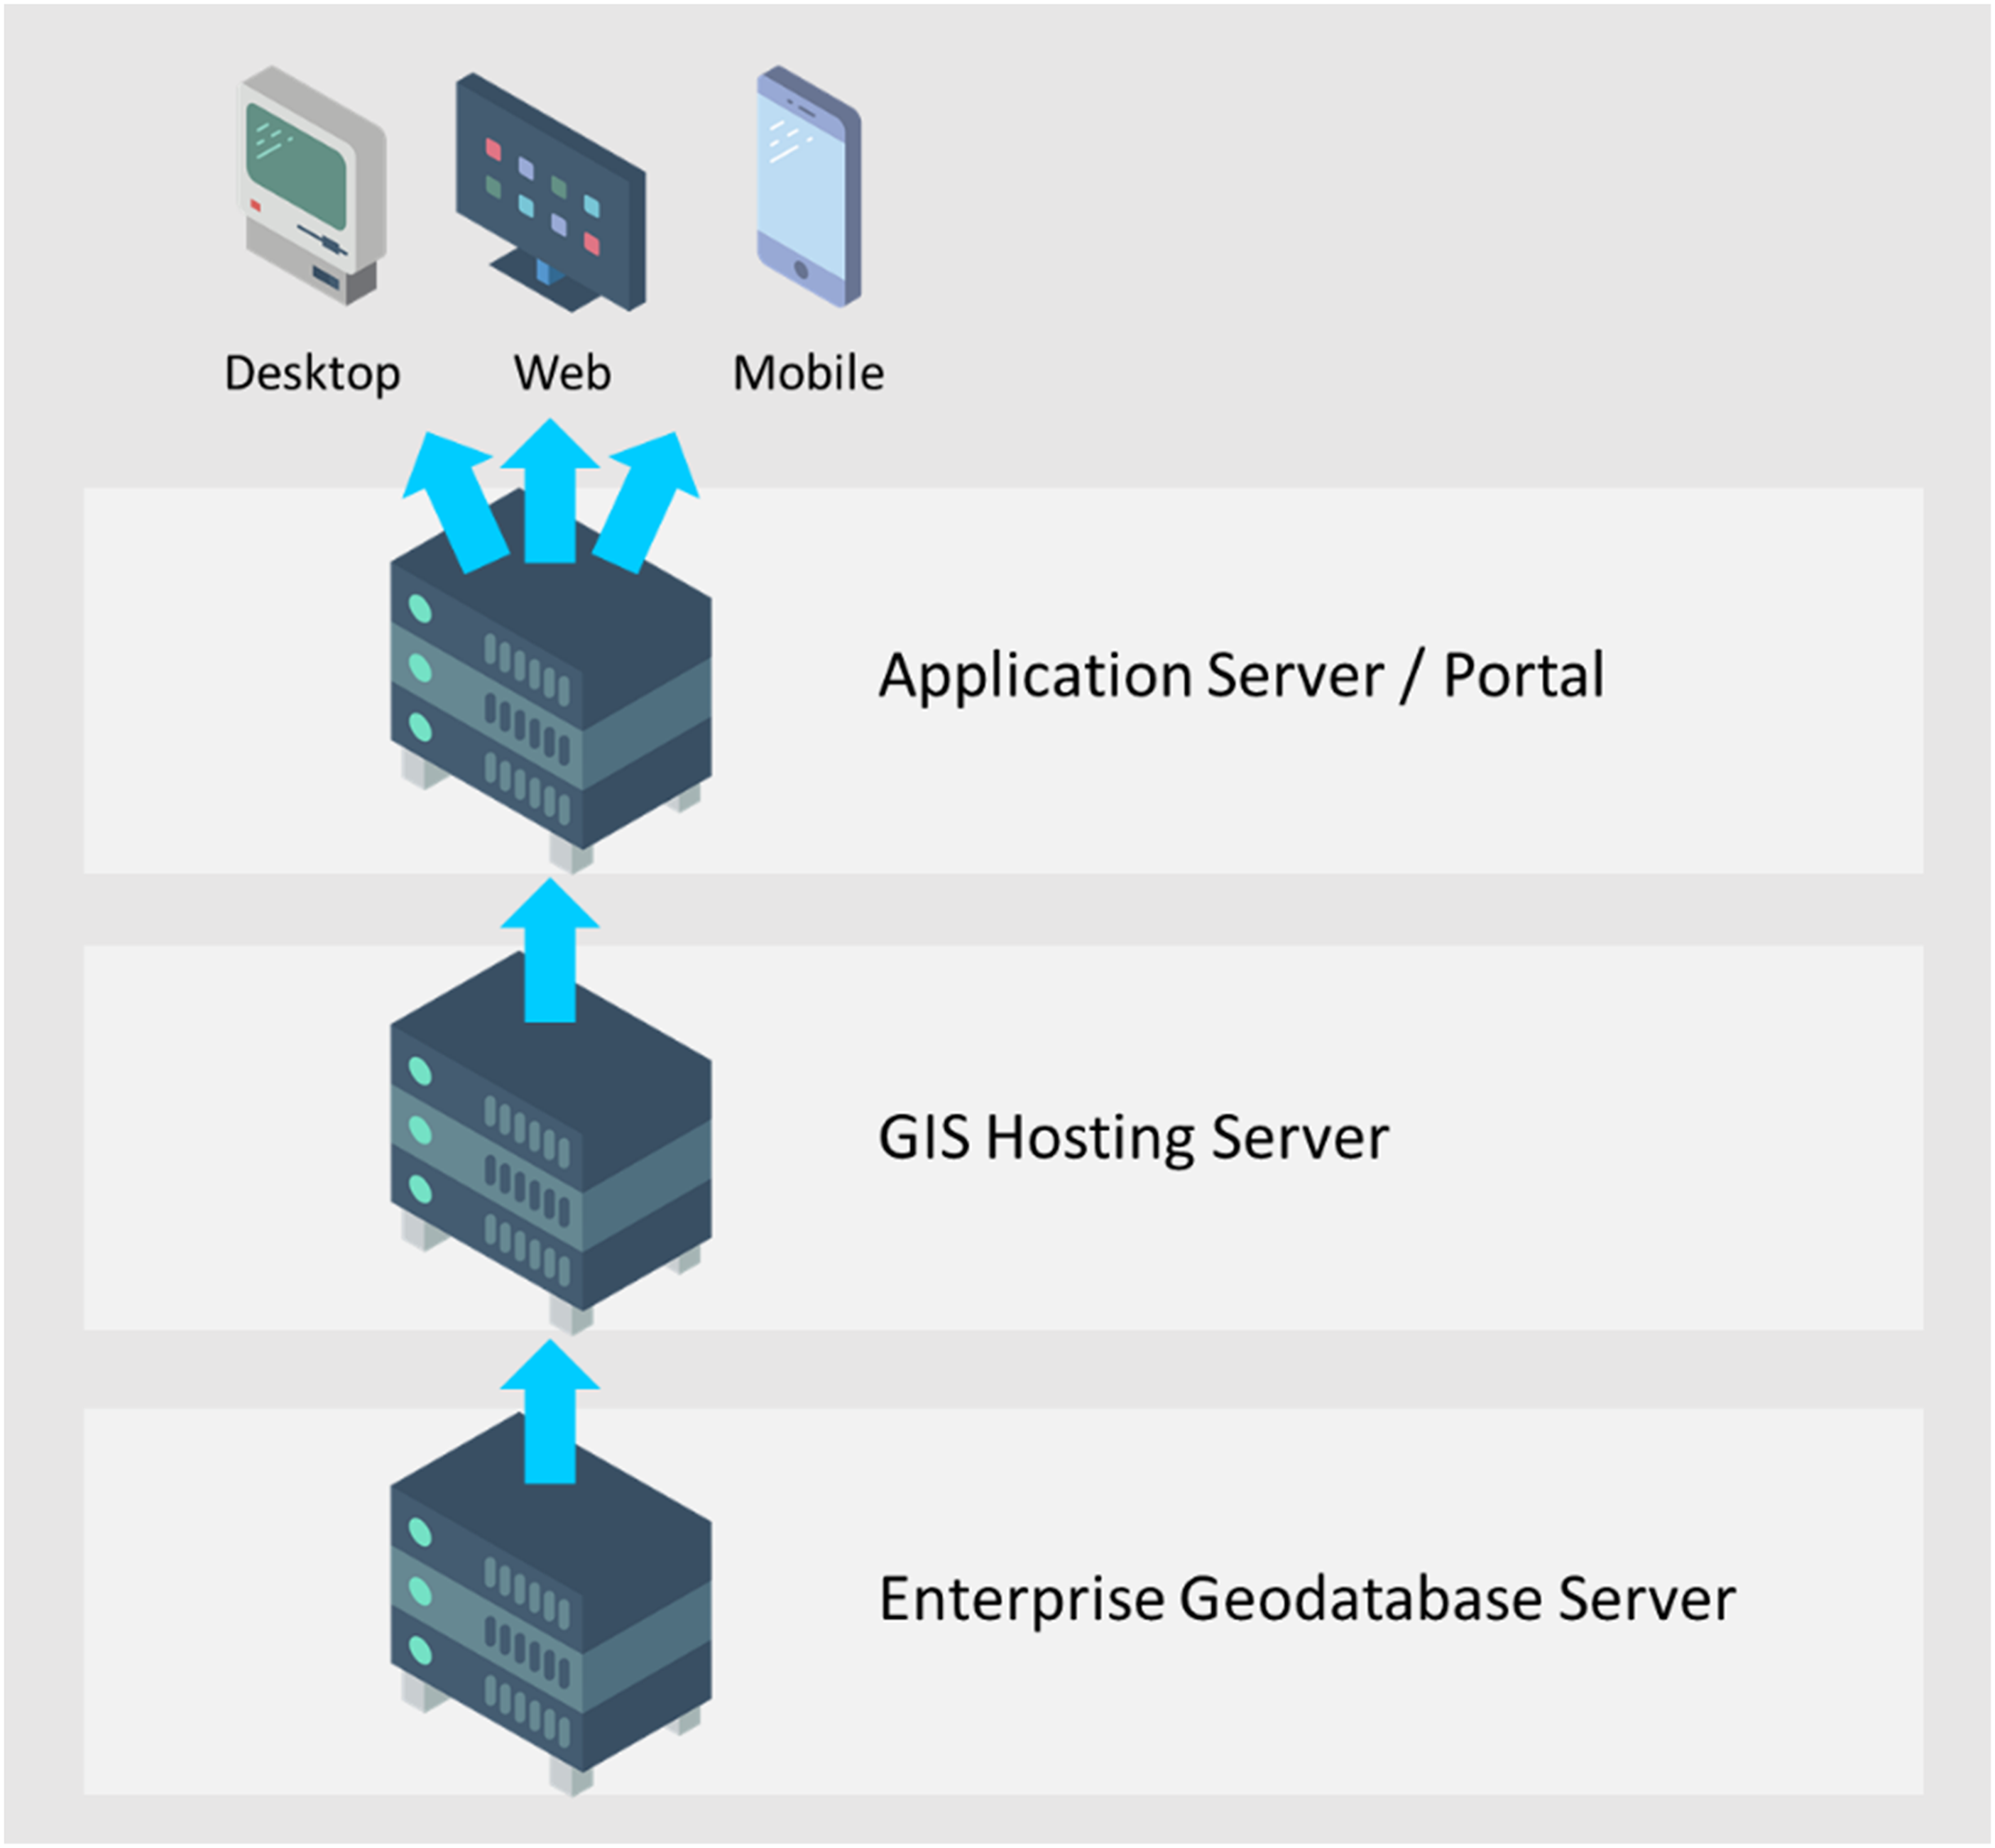
The Positive Points of Interest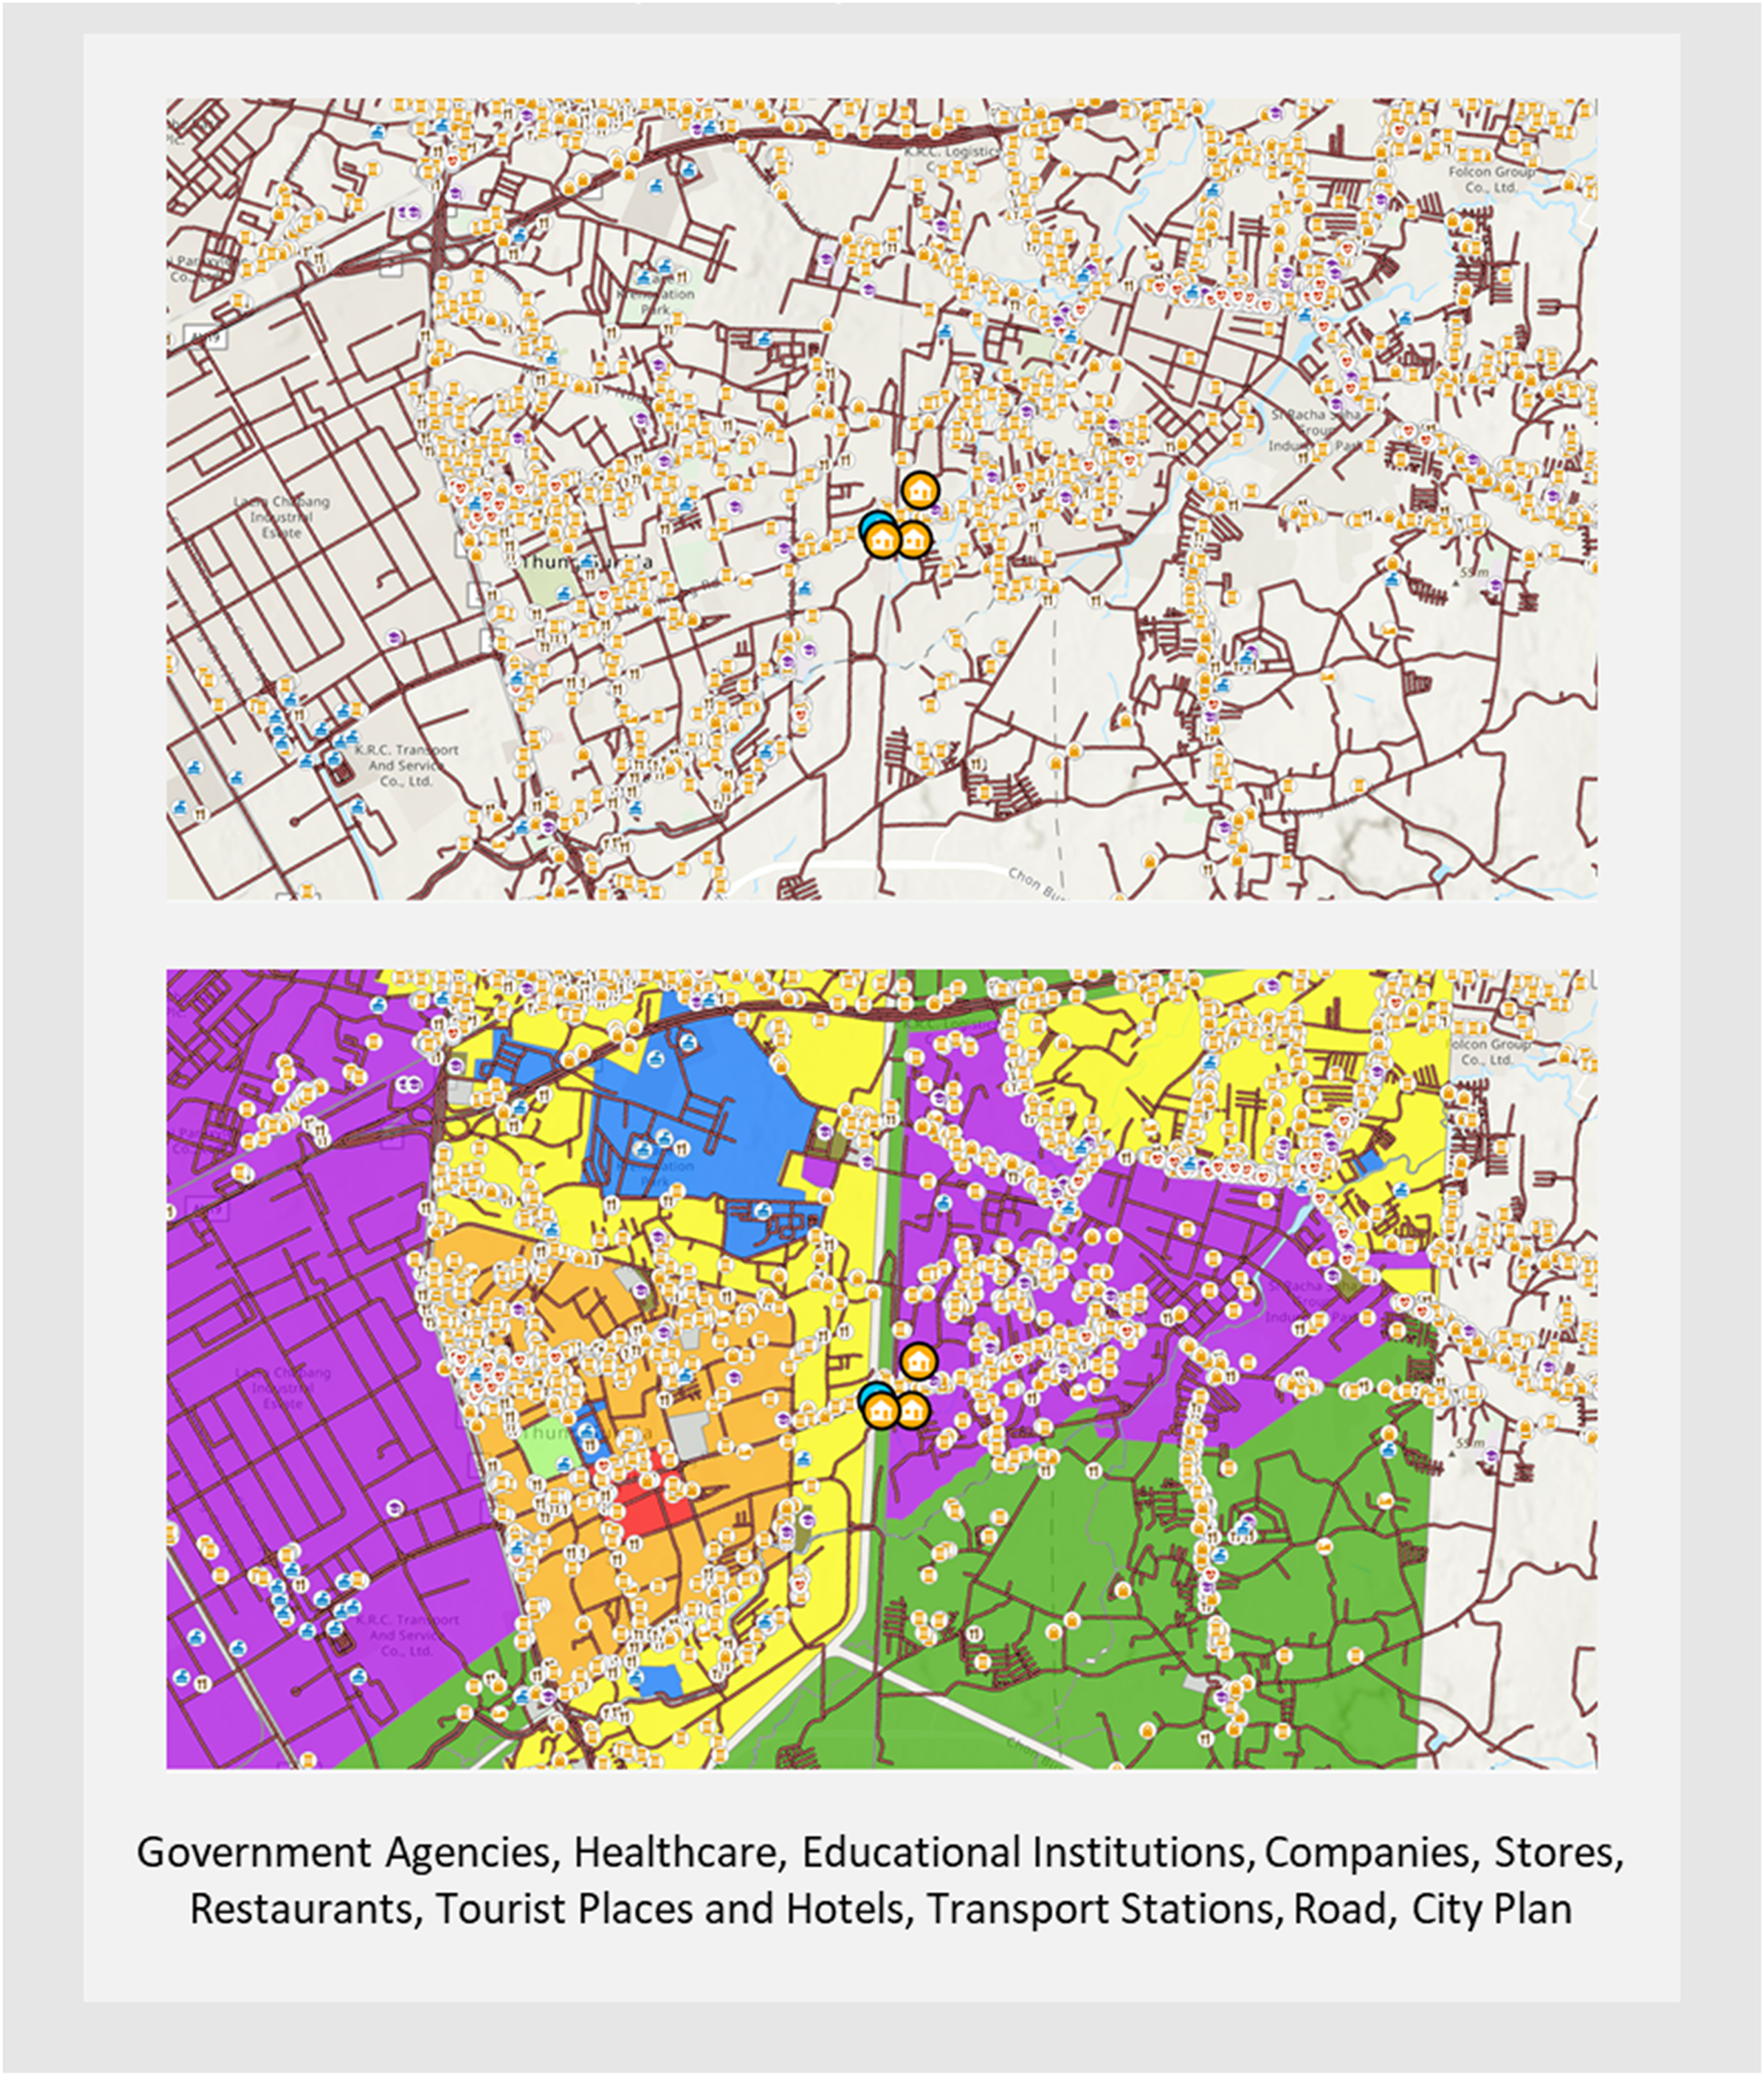
The Negative Factors about Properties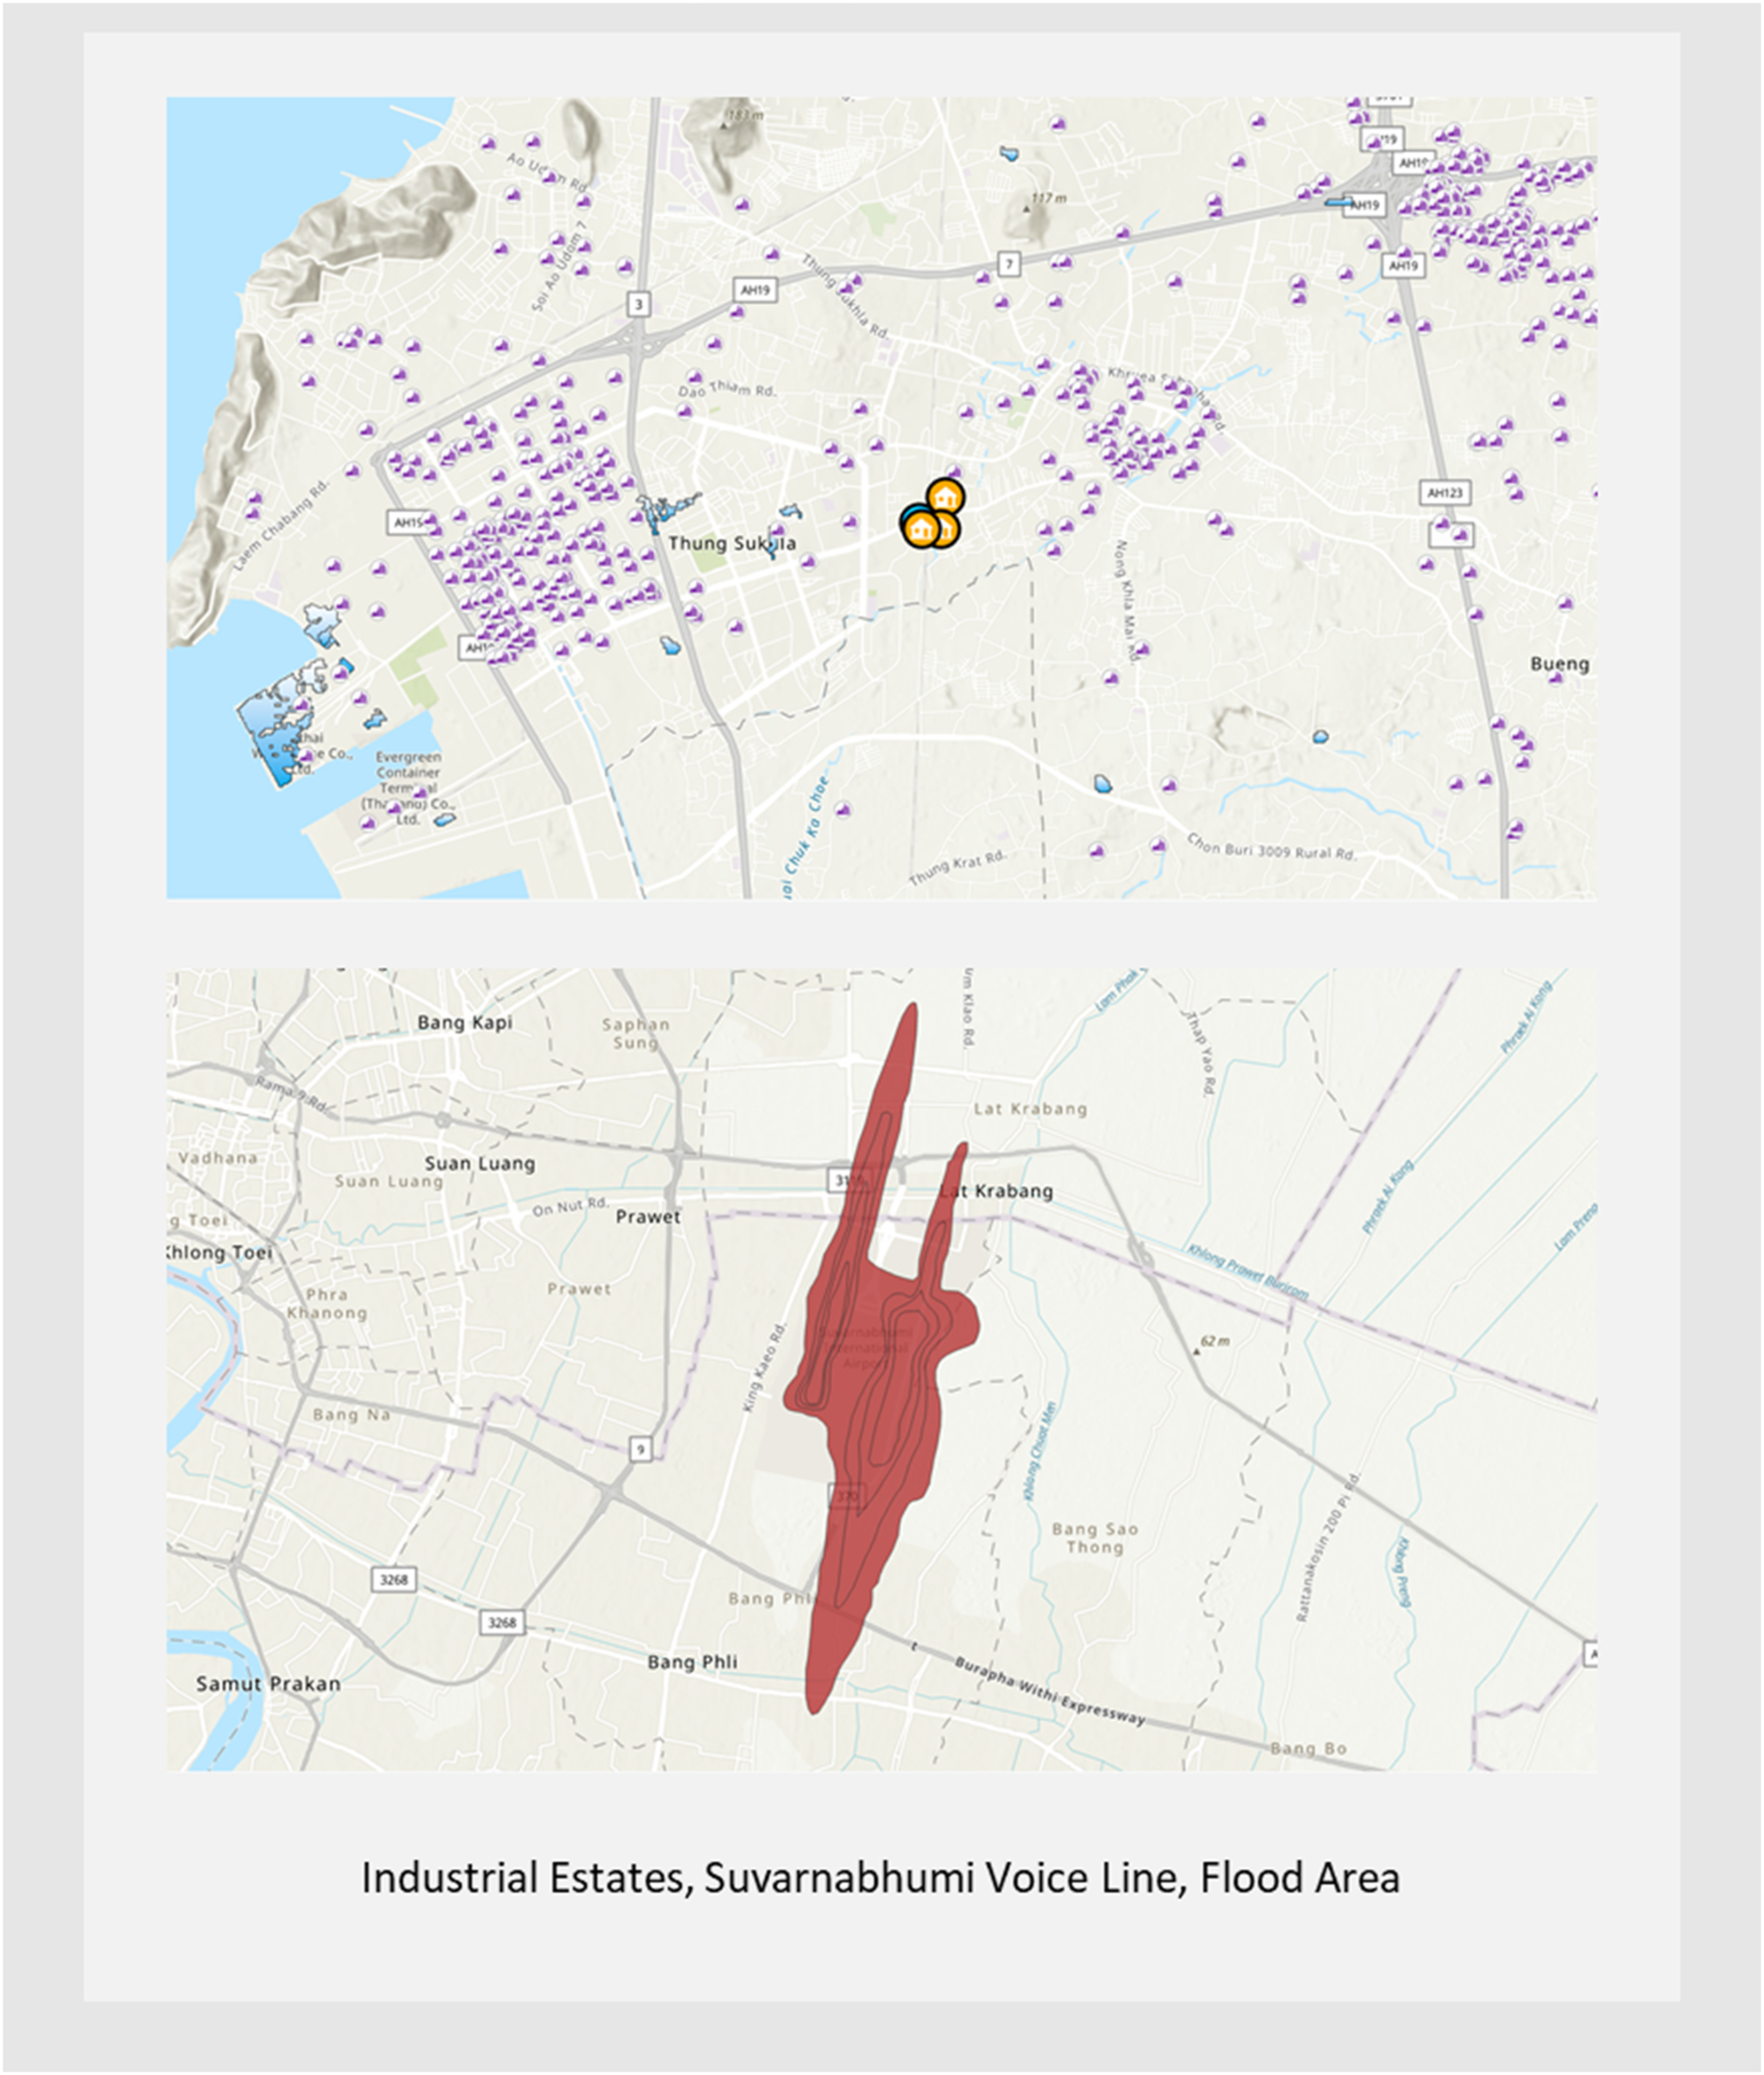
Current and Future Information Drawn from GIS Data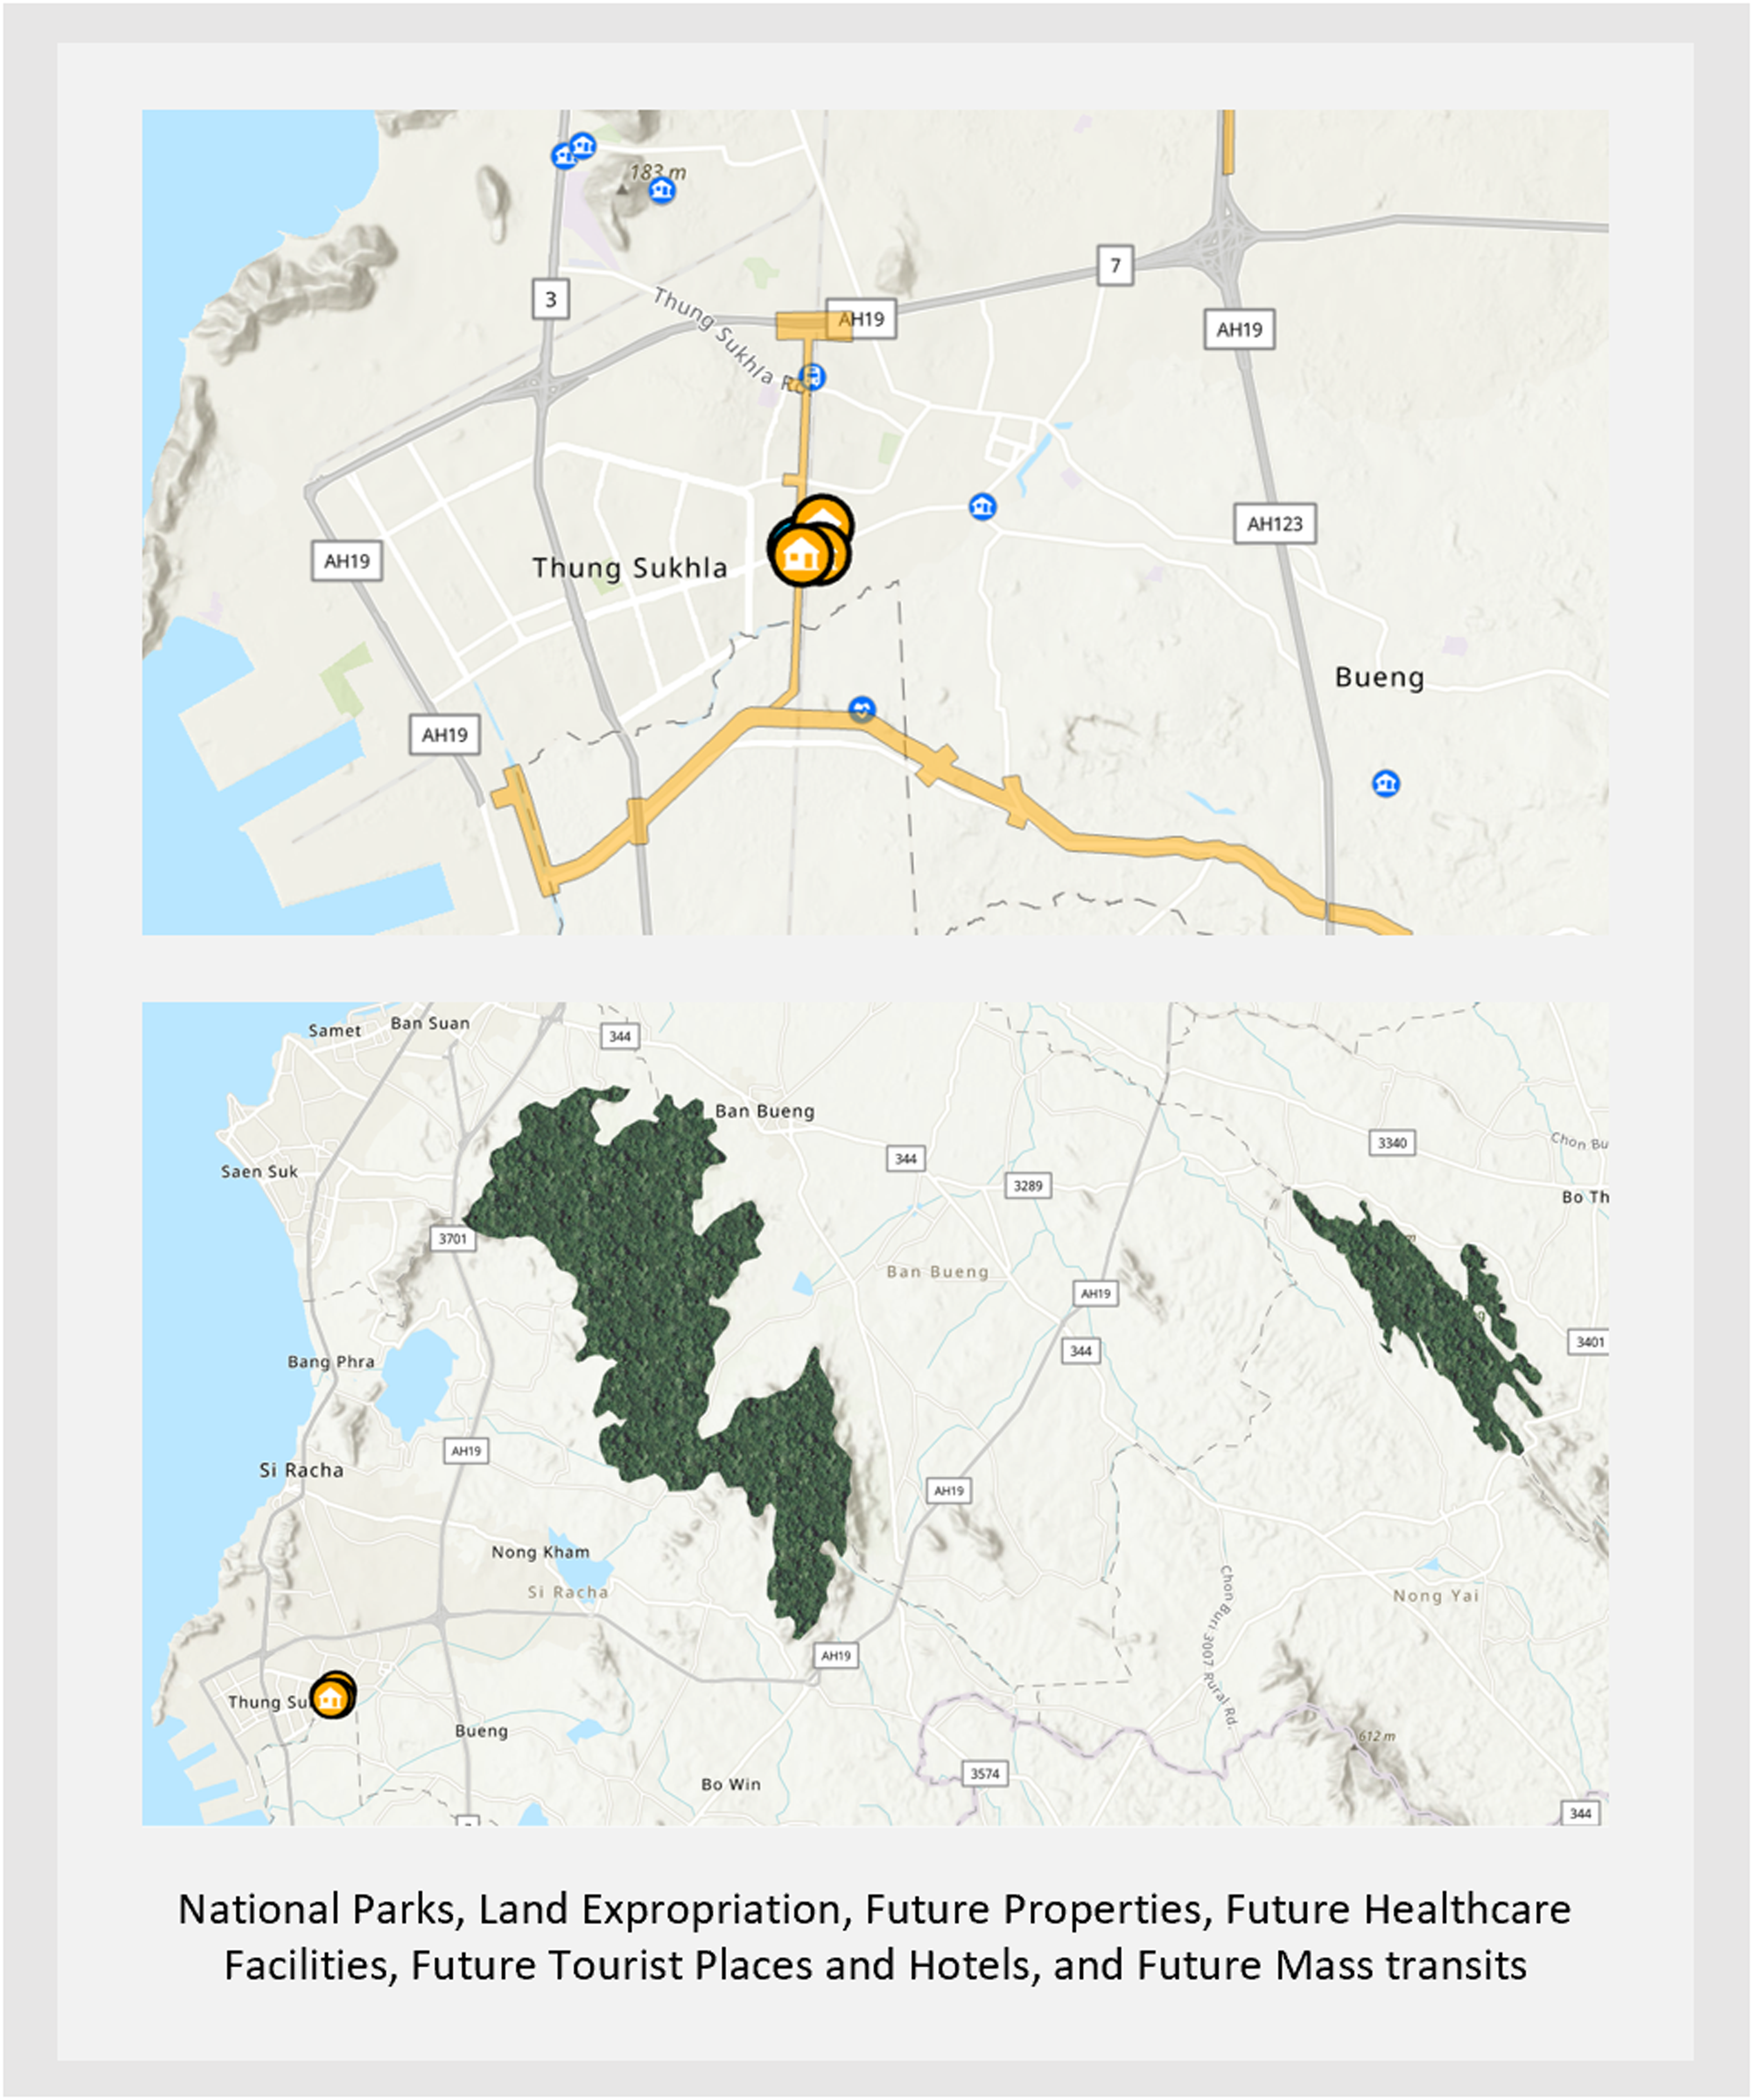
Machine Learning Framework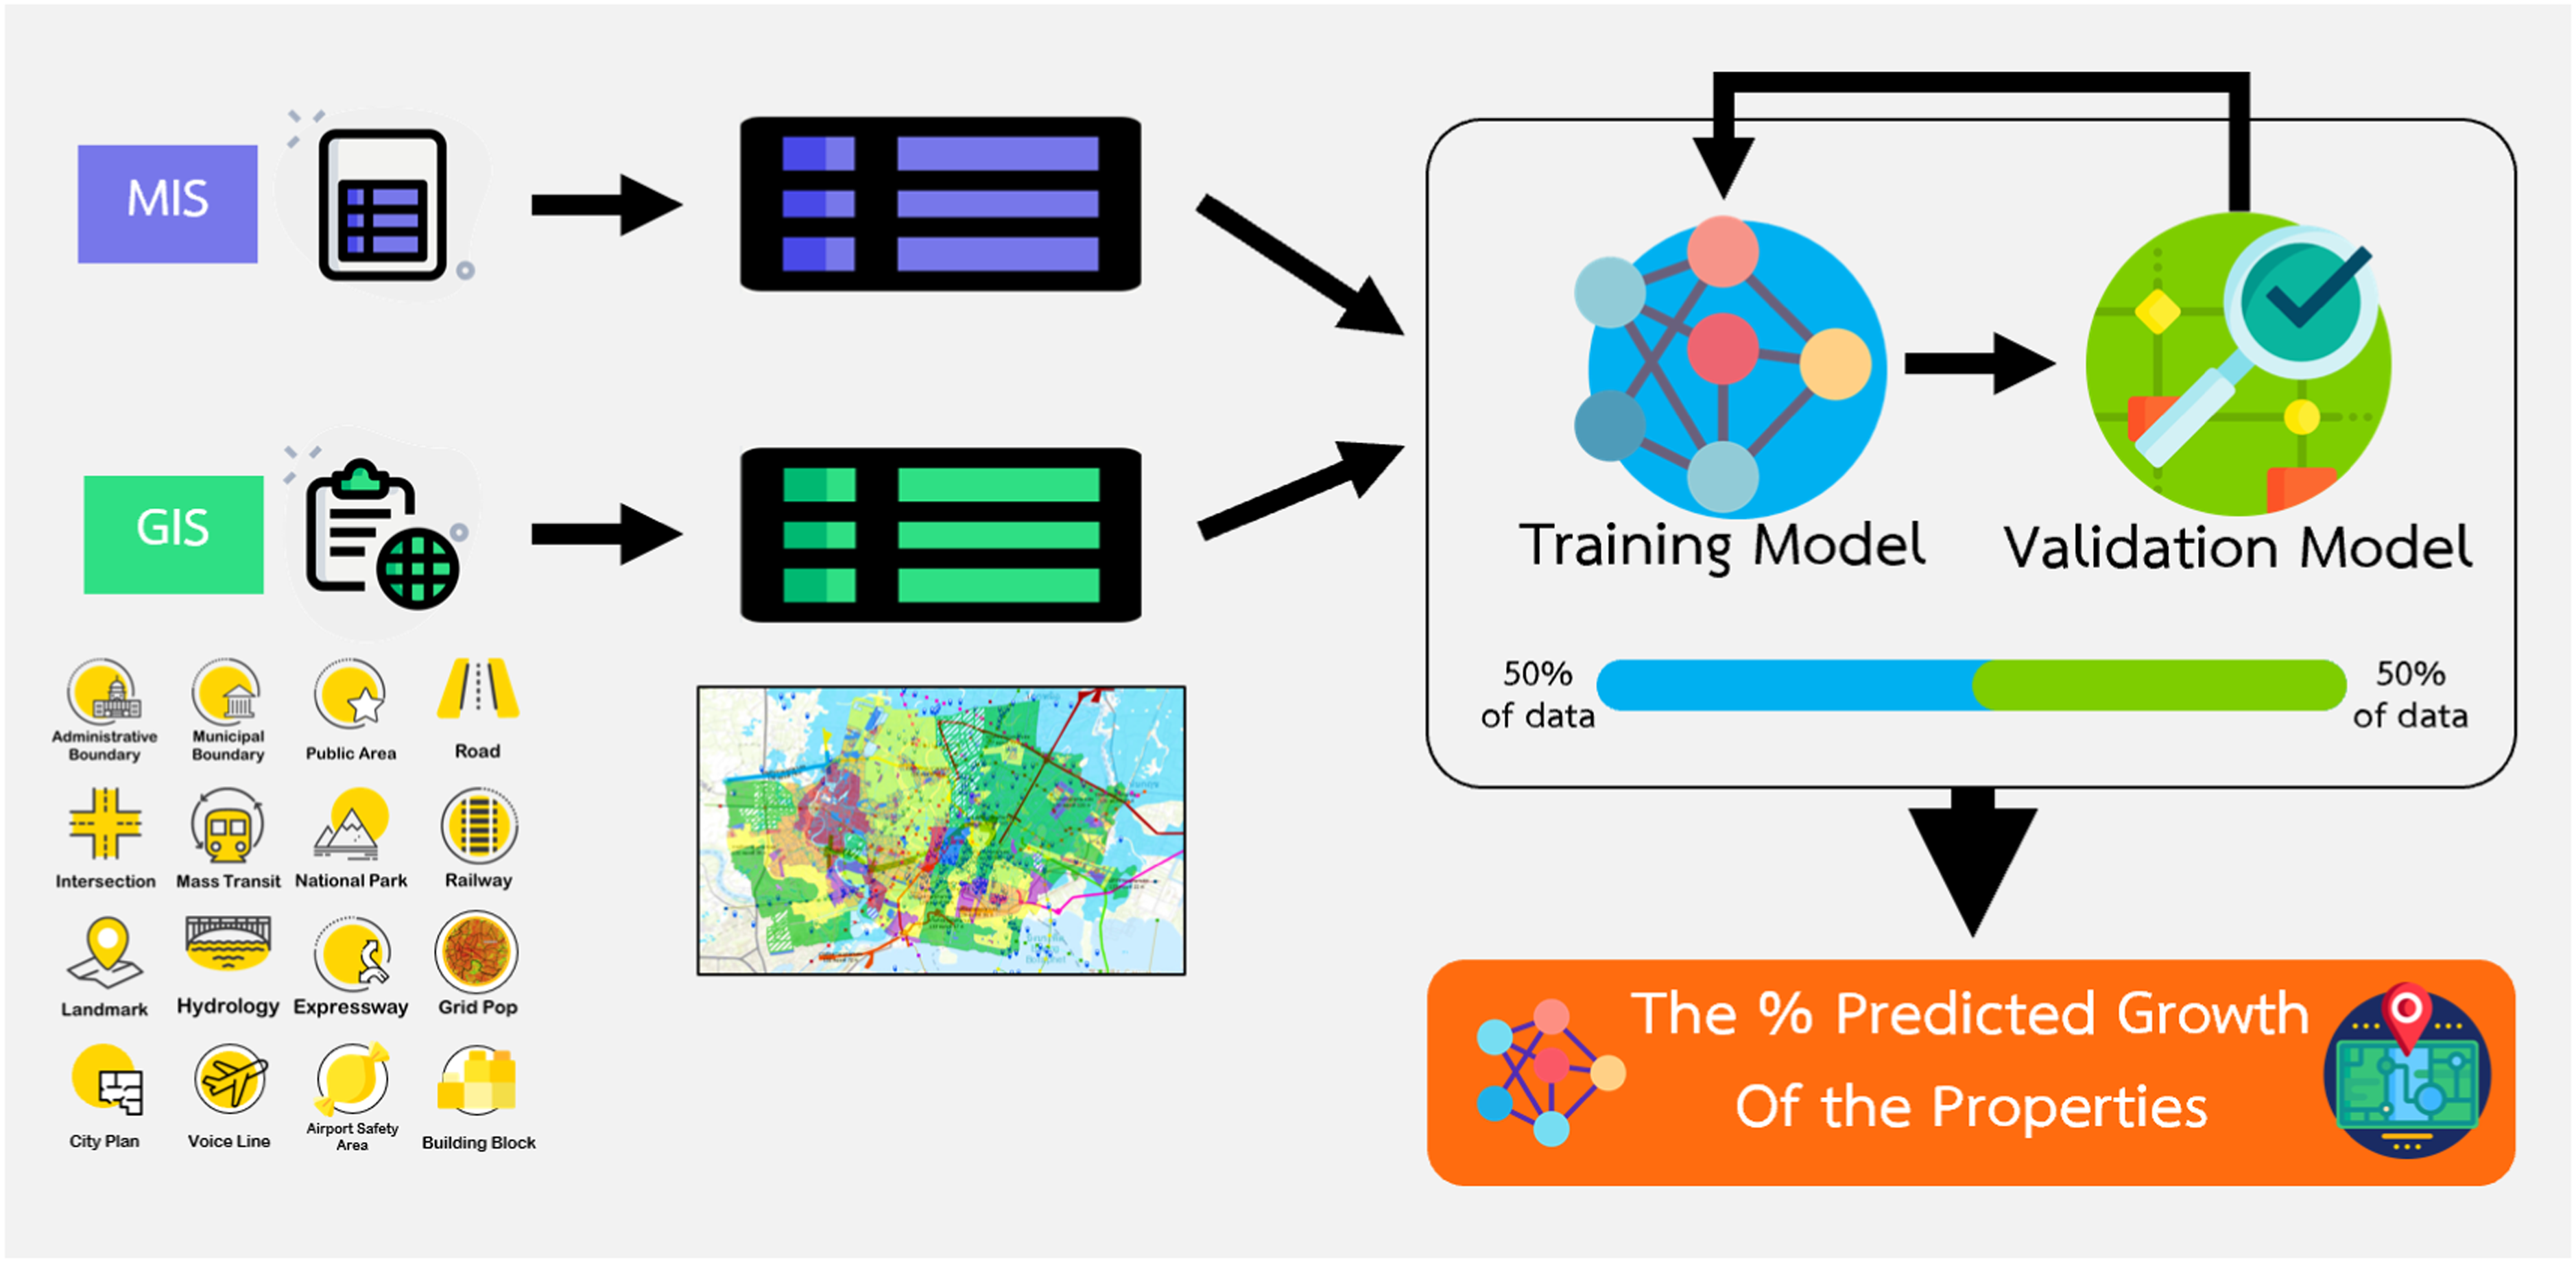
The GIS-based Business Intelligence Dashboard. https://experience.arcgis.com/experience/cc60a12b27d54ebe90dc58b5301daaaf