
Abstract
ADHD and anxiety present high comorbidity, including symptom overlap and related diagnostic and treatment challenges. The current study aimed to extend this area of research by investigating the event segmentation patterns of those with ADHD and anxiety symptoms. Event segmentation is the process of parsing a continuous flow of information into meaningful events, providing the opportunity to examine similarities and differences in how these groups organize their perception of daily experiences. Participants performed an event segmentation task consisting of watching four short movies and identifying large and small events. We used the total number of button presses and segmentation agreement scores in a multivariate analysis, and results indicated that the High ADHD group identified significantly more events in the large condition than the High Anxiety group and had significantly higher agreement scores than the Comorbid group. This study furthers our understanding of the cognitive overlap of ADHD and anxiety symptoms.
Introduction
Attention-deficit/hyperactivity disorder (ADHD) is defined by the Diagnostic and Statistical Manual of Mental Disorders (APA, 2013) as a neurodevelopmental disorder characterized by chronic, developmentally inappropriate inattention and/or hyperactivity-impulsivity that interferes with functioning or development. Symptoms of inattention include distractibility, forgetfulness, difficulty following instructions, and staying organized; symptoms of hyperactivity correspond to physical agitation, such as fidgeting, excessive talking, difficulty waiting their turn, and staying seated; and symptoms of impulsivity refer to acting without thinking, such as interrupting others excessively and making important decision without long-term consideration. It is common for those with ADHD to have other comorbid disorders. For example, ADHD is highly comorbid with both internalizing (13%–51%) and externalizing (43%–93%; Jarrett & Ollendick, 2008; Jensen et al., 1997, 2001) disorders, including anxiety disorders, major depressive disorder, intermittent explosive disorder, personality disorders, and obsessive-compulsive disorder (APA, 2013; Kessler et al., 2006). Because of its higher prevalence, most studies have focused on the comorbidity of ADHD with externalizing disorders. Though less focused in the research to date, internalizing disorders that are comorbid with ADHD are impactful, contributing, for instance, to feelings of discomfort, fear, or dread; overt behaviors including avoidance and withdrawal; and physiological responses like sweating, nausea, shaking, and general arousal (APA, 2013; Merrell, 2008). Within the internalizing domain, anxiety disorders are the most commonly comorbid, with ADHD presenting a rate between 47% and 53% in adults (D’Agati et al., 2019; Kessler et al., 2005). Evidence has shown that generalized anxiety disorder (GAD) and ADHD, in particular, frequently occur together, with estimates ranging from 10% to 45% (Biederman et al., 1993; Kessler et al., 2005; Sobanski, 2006).
The latest findings suggest that GAD is the third most prevalent anxiety disorder associated with ADHD, showing higher symptom severity with a rate between 25% and 30% in adults (Ameringen et al., 2011; Reimherr et al., 2017). GAD is defined by the DSM-5 (2013) as excessive worry (apprehensive expectation) about several events or activities, with intensity, duration, or frequency that is out of proportion to the actual likelihood of the anticipated event. In addition, attention or concentration disturbance is one of the core clinical symptoms of generalized anxiety disorder. Notably, the combined effect of ADHD and anxiety tends to pose diagnostic and treatment challenges. The presence of both ADHD and anxiety tends to lead to more complex symptom presentation of each disorder (Katzman et al., 2017), and those with both disorders may show more elevated symptoms of ADHD (Reimherr et al., 2017). Also, there is concern regarding the treatment of one disorder interfering with the treatment of the other (Reimherr et al., 2017). With high comorbidity, symptom overlap, and related diagnostic and treatment challenges, it is important to consider the cognitive overlap between the two disorders alone and when comorbid.
Both ADHD and anxiety independently impact various cognitive functions (Jarrett, 2016). ADHD is known for its impairments in executive functions, which are the functions involved in higher-order control of cognitive tasks such as planning, regulating behavior, attention and emotions, and managing multiple tasks. Thus, most research on ADHD has focused on these deficits. Fuermaier et al. (2015) also revealed neuropsychological dysfunction in adults with ADHD in domains such as attention (92%), executive functioning (73%–82%), retrospective memory (60%–73%), and prospective memory (64%). Further, adults with ADHD are known to have working memory deficits shown across various neuropsychological tests highlighting the pervasiveness of memory deficits in adults with this disorder (Butzbach et al., 2019; Fuermaier et al., 2013; Hervey et al., 2004).
Similarly, multiple hypotheses about the mechanism of anxiety have predicted atypical executive control of cognition (Korenblum et al., 2007; Pilar Pacheco-Unguetti et al., 2011). Among people with anxiety symptoms, dysregulated attention mechanisms have been linked to attentional bias (Eysenck et al., 2007; Robinson et al., 2013). In particular, individuals with anxiety disorders tend to detect and process threat-related information more readily, interfering with performance in various attentional tasks (Bar-Haim et al., 2007; Robinson et al., 2013). The maintenance of attention is very dependent on attention control; therefore, failure of attentional control leads to attentional lapses and off-task thinking (McVay & Kane, 2010; Robinson et al., 2013).
Jarrett and Ollendick (2008) reviewed many factors contributing to the overlap between ADHD and anxiety, including methodological and diagnostic considerations, genetic, environmental, and temperament factors, as well as neuropsychological functioning. For instance, some degree of anxiety may be secondary to the experience of having ADHD, such as apprehension related to previous experiences of failure. It has also been proposed that ADHD and anxiety disorders are both associated with complex dopaminergic gating disturbances at the level of the ventral striatum and nucleus accumbens, influenced by the hippocampus and amygdala (D’Agati et al., 2019; Levy, 2004). Multiple paradigms concerning ADHD and comorbid anxiety have raised awareness of cognitive processing deficits, dysregulated attentional systems, impaired executive inhibition, impaired executive regulation, poorly coordinated reward systems, and energetic states (Prevatt et al., 2015; Schatz & Rostain, 2006). More specifically, it has been suggested that anxiety associated with ADHD may inhibit symptoms of impulsivity present in ADHD, and anxiety may lead to decreased cognitive efficiency (Prevatt et al., 2015; Sorensen et al., 2011). Roth et al. (2004) suggested that memory dysfunction in adults with ADHD may be due to situational anxiety because of the partial overlap of neural circuitry subserving anxiety and memory. Jarrett (2016) found that adults with ADHD and anxiety symptoms showed significant deficits in self-organization/problem-solving, reflecting the ability to organize thoughts/actions when encountering unexpected events while inventing solutions to problems while pursuing goals. This construct overlaps with working memory deficits and is consistent with the suggestion of increased working memory deficits in those with ADHD and comorbid anxiety (Jarrett et al., 2012; Tannock, 2009). However, Korenblum et al. (2007) concluded that comorbid ADHD and anxiety resulted in patterns of cognitive deficits similar to that observed in ADHD in the absence of anxiety.
In summary, ADHD and anxiety share similar cognitive components but may be explained by different derivatives. For instance, individuals with anxiety have attentional deficits that may be more specific to threatening stimuli than general attentional deficits like those characterized in individuals with ADHD. Furthermore, individuals with anxiety may experience working memory/executive functioning deficits due to the interfering nature of anxiety. In contrast, in individuals with ADHD, these deficits are believed to be core components of the disorder. Despite the high degree of comorbidity between these disorders and the strong common cognitive components of both disorders, further research is needed regarding the similarities in cognitive dysfunctions between ADHD and anxiety that may overlap among those presenting elevated symptoms of both disorders. Additionally, most research about ADHD and comorbid anxiety has focused on children; hence, more research is needed with an older population. We propose using an event segmentation task to help us elucidate differences and similarities between ADHD, anxiety, and their comorbidities.
Event segmentation
Event segmentation is defined as the process in which people parse a continuous flow of information into meaningful events (Kurby & Zacks, 2008; Sargent et al., 2013; Zacks & Sargent, 2010; Zacks & Swallow, 2007). Daily, humans are exposed to an abundance of environmental stimuli, and the brain must organize this continuous flow of activity provided by our senses to understand our experiences (Boggia & Ristic, 2015; Sargent et al., 2013; Zacks & Sargent, 2010; Zacks & Swallow, 2007). Perceptual chunking is a powerful organizational principle that involves grouping information into meaningful cognitive representations (Zacks & Sargent, 2010).
People tend to segment events into hierarchically organized units (e.g., small and large events; Newston & Engquist, 1976; Zacks et al., 2007; Zacks & Sargent, 2010). It has been proposed that boundaries are automatically inserted between discrete events as they occur, making this cognitive process an automatic component of human perception (Bailey et al., 2013; Kurby & Zacks, 2008; Radvansky & Zacks, 2017; Sargent et al., 2013; Schwartz et al., 1995; Zacks et al., 2007; Zacks & Swallow, 2007). For example, if asked to describe baking cookies, you may perceive this activity in separate events: getting the ingredients, making the cookie dough, separating the cookie dough, putting them on a pan, cooking them in the oven, letting them cool down, and eating them. You may also perceive these individual steps as small events involved in a larger event, such as baking cookies. Hence, it is critical to understand the hierarchical structure of activity to develop event schemata, build a representation of what is happening in everyday life, produce actions, and remember past events (Boltz, 1992; Bower et al., 1979; Kurby & Zacks, 2011; Newston & Engquist, 1976).
Most research on event segmentation has used an event perception task initially developed by Newston and Engquist (1976). Participants watch movies and press a button when they judge one meaningful event ends, and another begins. This task results in a series of timestamps known as event boundaries representing an individual’s perception of events at a point of change in the sensory input ranging from physical changes (e.g., actor’s movements) to conceptual changes (e.g., goals or causes; Kurby & Zacks, 2008). This methodology has been utilized in various types of ongoing information like everyday activities (Boggia & Ristic, 2015), dance movements (Blästing, 2015), visual and verbal narratives (Magliano & Zacks, 2011), and virtual reality (Serrano et al., 2017).
Event Segmentation Theory (EST) describes how and why our nervous system segments ongoing information into meaningful events (Zacks et al., 2007; Zacks & Sargent, 2010). Even though people interpret these activities slightly differently, everyone can explain their experiences across time in an organized manner with a significant agreement regarding those units. When describing the same activity, most people commonly agree on some events. According to EST, human experiences are interpreted using event models; multimodal mental representations are maintained in working memory describing in the moment activity (Grafman, 1995; Schwartz et al., 1995; Wood & Grafman, 2003). Event models facilitate predictions about what will happen in the near future, which are the basis of perception and comprehension (Zacks et al., 2007; Zacks & Sargent, 2010). When ongoing activity changes, event models become dated, leading to prediction errors (mismatch between previous expectations and reality; Ouden et al., 2012). Consequently, a mechanism detects this transient increase in prediction errors and reacts by updating the event models and returning to a new stable state (Zacks et al., 2007; Zacks & Sargent, 2010). The interchange between periods of stability and periods of change explains what individuals perceive as events and boundaries between events, respectively. Thus, the change in event models results in what is produced during event segmentation processing and what is measured in a unit marking task. In addition, previous research suggests that EST is implemented simultaneously on a range of timescales from a few seconds to tens of minutes (Zacks et al., 2007). Consequently, differences in predictability between finer and coarser timescales (e.g., small and large events) exist.
Prior research has found disturbances in various forms of event segmentation in individuals with cognitive deficits such as normal cognitive decline/Alzheimer’s disease (Zacks et al., 2006), schizophrenia (Zalla et al., 2004), and Parkinson’s disease (Zalla et al., 2000). Ryan and Rogers (2018) have also investigated event segmentation deficits in young adults with ADHD, determining that individuals with ADHD identified more events in the large (coarse-grained) condition. This suggests that people with ADHD experience prediction errors on a smaller timescale than non-ADHD individuals. They indicated that this finding could be explained by the event model updating process proposed by EST, which is supported by working memory, a known impairment associated with ADHD.
Similarly, Sherrill et al. (2019) reported that state anxiety influenced segmentation performance by increased segmentation agreement (agreement between individuals) when young adult participants were exposed to a stressful film. They further suggest that stressful experiences generate greater attention to perceptual processing; individuals under stress are more sensitive to perceptual change and are more likely to perceive event boundaries. They also speculated that segmentation behavior might be facilitated by moderate anxiety levels but diminished at extreme anxiety levels. Support for this assertion was demonstrated in a study of post-traumatic stress disorder (PTSD) and event segmentation (Eisenberg et al., 2016). Results indicated lower segmentation agreement scores for individuals with higher levels of PTSD symptoms when watching non-threatening movies, suggesting that the effects of PTSD (severe anxiety) influence everyday cognition.
Current study
The neurocognitive deficits characterized by ADHD and anxiety appear to overlap those involved in event segmentation, such as attention, working memory, and perceptual processing. As mentioned previously, the high rates of comorbidity between ADHD and anxiety suggest a need for continuous research about their cognitive overlap. Event segmentation is an appealing approach to this research for multiple reasons. It involves cognitive processes that overlap those of ADHD and anxiety while also providing increased ecological validity via the continuous nature of the stimuli used. Also, past research has found differences in segmentation behavior related to cognitive impairments and with both ADHD and anxiety, separately. In this study, we investigate the combined effect of ADHD and anxiety on event segmentation compared to the effect of either alone.
Method
Participants
1148 participants were recruited from Carleton University through the online application for Participating in Psychology Research (SONA) as part of a broad research program. For the purpose of this study, 88 participants (n = 30 Comorbid, n = 27 High ADHD, n = 31 High Anxiety) were included in the analysis. The Carleton University Research Ethics Board has approved this research (#112930), and all participants gave their online informed consent to participate.
Measures/materials
Adult ADHD Self-Report Scale (ASRS) Symptom Checklist
This questionnaire was used to assess ADHD symptoms. The ASRS is a self-rated scale consisting of 18 items that assess DSM-IV criteria in individuals 18 years of age or older (Adler et al., 2019; Kessler et al., 2007). The questionnaire is divided into two parts; Part A (six total questions) has been found to be the most predictive of symptoms consistent with ADHD, whereas Part B (twelve total questions) assesses additional cues (Kessler et al., 2007). For this study, individuals were placed in groups according to Part A. To be placed in the ADHD group, participants needed at least four symptoms of the six present in Part A. Items consist of questions related to signs and symptoms of ADHD in adults (e.g., “How often do you have trouble wrapping up the final details of a project, once the challenging parts have been done?” and “How often do you have problems remembering appointments or obligations?”), and participants answered how frequently they had experienced these symptoms in the past 6 months on a five-point Likert scale from 0 (Never) to 4 (Very often). This self-administered questionnaire has been shown to have adequate psychometric properties (internal validity: Cronbach’s α = 0.63–0.72; test-retest reliability: 0.58–0.77; criterion validity: sensitivity = 68.7% and specificity = 99.5%; Kessler et al., 2007). It has been determined that ASRS quickly identifies most cases, with negligible inclusion of non-cases. Consequently, the screener is a useful tool for epidemiological research and clinical outreach.
Generalized Anxiety Disorder 7-item (GAD-7) Scale
This questionnaire was used to assess anxiety symptoms. The GAD-7 is a self-rated scale comprised of 7 items that assess GAD symptoms of individuals 14 years of age and over (Tiirikainen et al., 2019). The items consist of statements describing the most salient symptoms of GAD (e.g., “Feeling nervous, anxious, or on edge” and “Worrying too much about different things”). Participants answered how frequently they had experienced these symptoms in the last two weeks based on a four-point Likert scale from 0 (Not at all) to 3 (Nearly every day). Three score cut-off points are used to indicate mild (5), moderate (10), and severe (15) anxiety. For this study, participants were placed in groups according to moderate symptom levels. This self-administered questionnaire has been shown to have good psychometric properties (internal validity: Cronbach’s α = 0.89; test-retest reliability: 0.85; Löwe et al., 2008; Rutter & Brown, 2017). However, the moderate anxiety cut-off score has been identified as the optimal point for sensitivity (89%) and specificity (82%; Rutter & Brown, 2017). Previous research has suggested GAD-7 as a valid screening tool for assessing the severity of GAD in clinical practice and research and also screens for panic disorder, social anxiety disorder, and post-traumatic stress disorder (Kroenke et al., 2007; Löwe et al., 2008). As such, it is being used here as a measure of broad anxiety symptoms.
Group cut-off scores
For this study, participants were divided into groups based on these cut-off scores: Comorbid (ASRS: 4+/GAD-7: 10+), High ADHD (ASRS: 4+/GAD-7: 9 or -), and High Anxiety (ASRS: 3 or -/GAD-7: 10+). These cut-off scores were taken from the measures themselves. A cut-off score of ≥4 on the ASRS part A items indicates symptoms highly consistent with ADHD (Adult ADHD Self-Report Scale (ASRS-V1.1) Symptom Checklist Instructions, 2003; Dunlop et al., 2018). Scores between 10–14 and ≥15 on the GAD-7 indicate moderate and severe levels of GAD, and scores of ≥10 are considered to be in the clinical range (Johnson et al., 2019; Spitzer et al., 2006).
Event Segmentation Task
Due to COVID-19, the methodology was adapted to be used via Zoom Video Conference (version 5.6.1), which was validated in the summer of 2020 using similar psychometrics as per Sargent et al. (2013; Ryan & Bubna, 2021). Participants completed an event segmentation task to measure event perception, consisting of watching four short movies portraying an actor performing everyday activities. These activities included assembling Legos, decorating for a party, making breakfast, and filling window planters (Sargent et al., 2013). Pictures representing the scene from the different short movies are presented in Figure 1. (a) Legos, (b) decorating for a party, (c) making breakfast, and (d) filling window planters.
These movies were filmed from a specific angle and focus to mimic the experience of observing a live event. Movies were presented to participants by screen sharing, and participants indicated their answers by responding in the private message chat box provided. Participants were asked to identify large and small events in the same viewing, which differed from Sargent et al. (2013). More specifically, we asked them to put their Caps Lock on and place one finger from their right hand on the L button, one finger from their left hand on the S button, and another finger from their right hand on the Enter button. The instructions were stated as follows: “Enter the “L” key into the chat box when one large, meaningful event ends and another begins” and “Enter the “S” key into the chat box when one small meaningful event ends and another begins.” We also specified to press Enter after each individual response. Participants were then given a chance to familiarize themselves with the task by watching a practice movie, Lego (duration 155 s). They watched the practice movie once, following the instructions previously explained. As per Sargent et al. (2013), a second practice viewing was used with specific instructions to identify at least three large events and at least six small events. Participants then watched the three remaining movies once each and followed the exact instructions given for the first viewing of the practice video.
The movies were presented in this specific order: Party (duration 376 s), Breakfast (duration 329 s), and Windows (duration 354 s). Even when asked by participants, the definition of “meaningful” was not explicitly given in order to induce unpremeditated event segmentation behavior. Examples of replies given to this question are: “It is up to your perception” and “It is up to you to decide what a small and large event is.” Despite minimal instructions, prior research has suggested that participants make consistent responses and identify boundaries in movies reliably (Boggia & Ristic, 2015; Kurby & Zacks, 2008; Newston & Engquist, 1976; Zacks & Sargent, 2010; Zacks & Swallow, 2007).
The data collected from the event segmentation task was participants’ small and large button-pressing behavior throughout the viewing of each movie which can be represented and manipulated in different ways. Multiple steps were taken to create a norm for the sample, and calculations for the total number of button presses and segmentation agreement scores for both grains (e.g., small and large) were identical. Using Python programming (version 3.8.2), we divided each movie separately into one-second bins and coded each participant’s segmentation into ones, twos, and zeros; a bin contained a one if the participant segmented a small event during that second, a bin contained a two if the participant segmented a large event during that second, and a bin contained a zero if they did not segment during that second.
Total number of button presses. This variable informs us about event models, specifically the size of participants’ event models (e.g., small or large) and the number of times an event model is updated (Newston & Engquist, 1976; Zacks et al., 2007). Therefore, this variable indicates the number of small and large event models formed by a participant, giving us a detailed overview of their segmentation behavior without sensitivity to event location or content. The following steps were taken using Excel software (version 16). We calculated the total small and large event boundaries identified for each participant per second in the movies with the COUNTIF function. Subsequently, we obtained the total number of small button presses, and large button presses for each participant on all four movies separately.
Segmentation agreement scores. In spite of the subjectivity in event segmentation processing, a high degree of inter-rater agreement regarding the placement of event boundaries typically exists (Newston & Engquist, 1976; Sargent et al., 2013; Speer et al., 2003). Accordingly, segmentation ability was measured by segmentation agreement, defined as the degree to which an individual agrees with the group norm regarding the placement of event boundaries in movies (Kurby & Zacks, 2011; Sargent et al., 2013; Zacks et al., 2006). Based on previous research, if one’s segmentation pattern (segmentation agreement scores) differs from the segmentation norm, this may indicate deficits in event segmentation processing (Eisenberg et al., 2016; Sherrill et al., 2019). For each movie, the following steps were taken using Excel software (version 16): 1. Using the COUNTIF function, we calculated the total event boundaries identified by the whole sample for each second in the movie to determine the proportion of participants who segmented in a given one-second bin. 2. Using the Pearson correlation function, we calculated an observed correlation (Obs R) between each participant’s segmentation and the proportion of participants that segmented at each one-second bin. 3. Using the Pearson correlation function, we computed the minimum and maximum correlations (rmin and rmax, respectively) based on the number of event boundaries identified by the whole sample.
The following equation was used.

Consequently, a segmentation agreement score ranging from 0 to 1 was obtained, independent of the number of segmentations and event duration, with larger correlations denoting a better agreement with the group (Kurby & Zacks, 2011; Sargent et al., 2013).
Procedure
The study occurred in two parts: an online non-interactive questionnaire-based study and a second online interactive study. The questionnaire-based study involved completing the ADHD and anxiety measures via Qualtrics (https://www.qualtrics.com). This data was used to organize the participants into groups and ensure adequate participant numbers in each group: (a) Comorbid; (b) High ADHD; and (c) High Anxiety.
Participants were then invited to a Zoom meeting (at some phases of data collection, participants were explicitly invited based on their questionnaire score profile to distribute the groups evenly). Once entered in the Zoom meeting, participants were asked to give their online consent by sending “I agree” into the message chat box directly to the experimenter. Afterward, they received instructions for the event segmentation task. In the same Zoom meeting, up to six students could complete the experiment simultaneously by sending private messages to the host. Each experimental session lasted approximately 30 minutes.
Overview of statistical analyses
The data collected for this study were analyzed using a multivariate analysis of variance (MANOVA; Grice & Iwasaki, 2007; Haase & Ellis, 1987). The MANOVA helped us determine wether differences existed between the independent groups on multiple continuous dependent variables. The Statistical Package for the Social Sciences (SPSS; version 27) was used to conduct this analysis. For this study, the independent variable was the symptom group which consisted of three levels: (a) Comorbid; (b) High ADHD; and (c) High Anxiety. The dependent variables were as follows: (a) total number of large button presses; (b) total number of small button presses; (c) large segmentation agreement scores; and (d) small segmentation agreement scores. It is important to note that we decided to average all four movies to create these four dependent variables, and to do so, we used the compute variable function in SPSS.
Before running the MANOVA, assumptions needed to be considered (Laerd Statistics, 2015; Stahle & Wold, 1990); we took multiple steps for the violation of the multivariate outliers assumption and included adjusted values in the final analysis. However, other assumptions were violated in which no additional steps were taken (e.g., multivariate normality); as such, the MANOVA was interpreted based on the Pillai’s trace value (p < .05). Results reached statistical significance. Therefore, we continued with follow-up tests such as the tests of between-subjects effects table to identify how the dependent variables differed from the independent variable. A post hoc test was conducted, allowing us to locate those specific differences.
Results
Preliminary analyses
Means, standard deviations, and follow-up univariate ANOVAs for study variables.

*p < .05.
We encountered technical difficulties during one of the Zoom sessions; two participants from the Comorbid and High Anxiety groups had missing data for the fourth movie viewing. All missing data were coded into zeros using the compute as same variable function in SPSS.
Main analyses
Assumption testing
Correlations for event segmentation variables.

**p < .01.
Multivariate analysis of variance MANOVA: Multivariate tests
There was a statistically significant difference between the comorbidity groups on the combined dependent variables, F(8, 166) = 2.19, p = .030; Pillai’s V = .191; partial η2 = .01. This result indicates that differences exist between the Comorbid, High ADHD, and High Anxiety groups on one or more dependent variable(s): (a) total number of large button presses; (b) total number of small button presses; (c) large segmentation agreement scores; and (d) small segmentation agreement scores. A test of between-subjects effects was used to identify where these differences lie on the combined dependent variables.
Univariate one-way ANOVAs: Test of between-subjects effects
Follow-up univariate ANOVAs showed that each total number of large button presses F(2, 85) = 3.14, p = .048; partial η2 = .07, and large segmentation agreement scores F(2, 85) = 4.79, p = .011; partial η2 = .10 were statistically significantly different between individuals from different ADHD and anxiety comorbidity groups, using a computed α level of .05; results are shown in Table 1. A post hoc power analysis conducted using G*Power (version 3.1.9.7) indicated a power of 0.647 for the button press finding and .850 for the agreement finding.
Analyses for the interaction of event segmentation variables on ADHD and anxiety comorbidity groups.

*p < .05.

Simple bar mean of total number of large button presses by comorbidity groups.
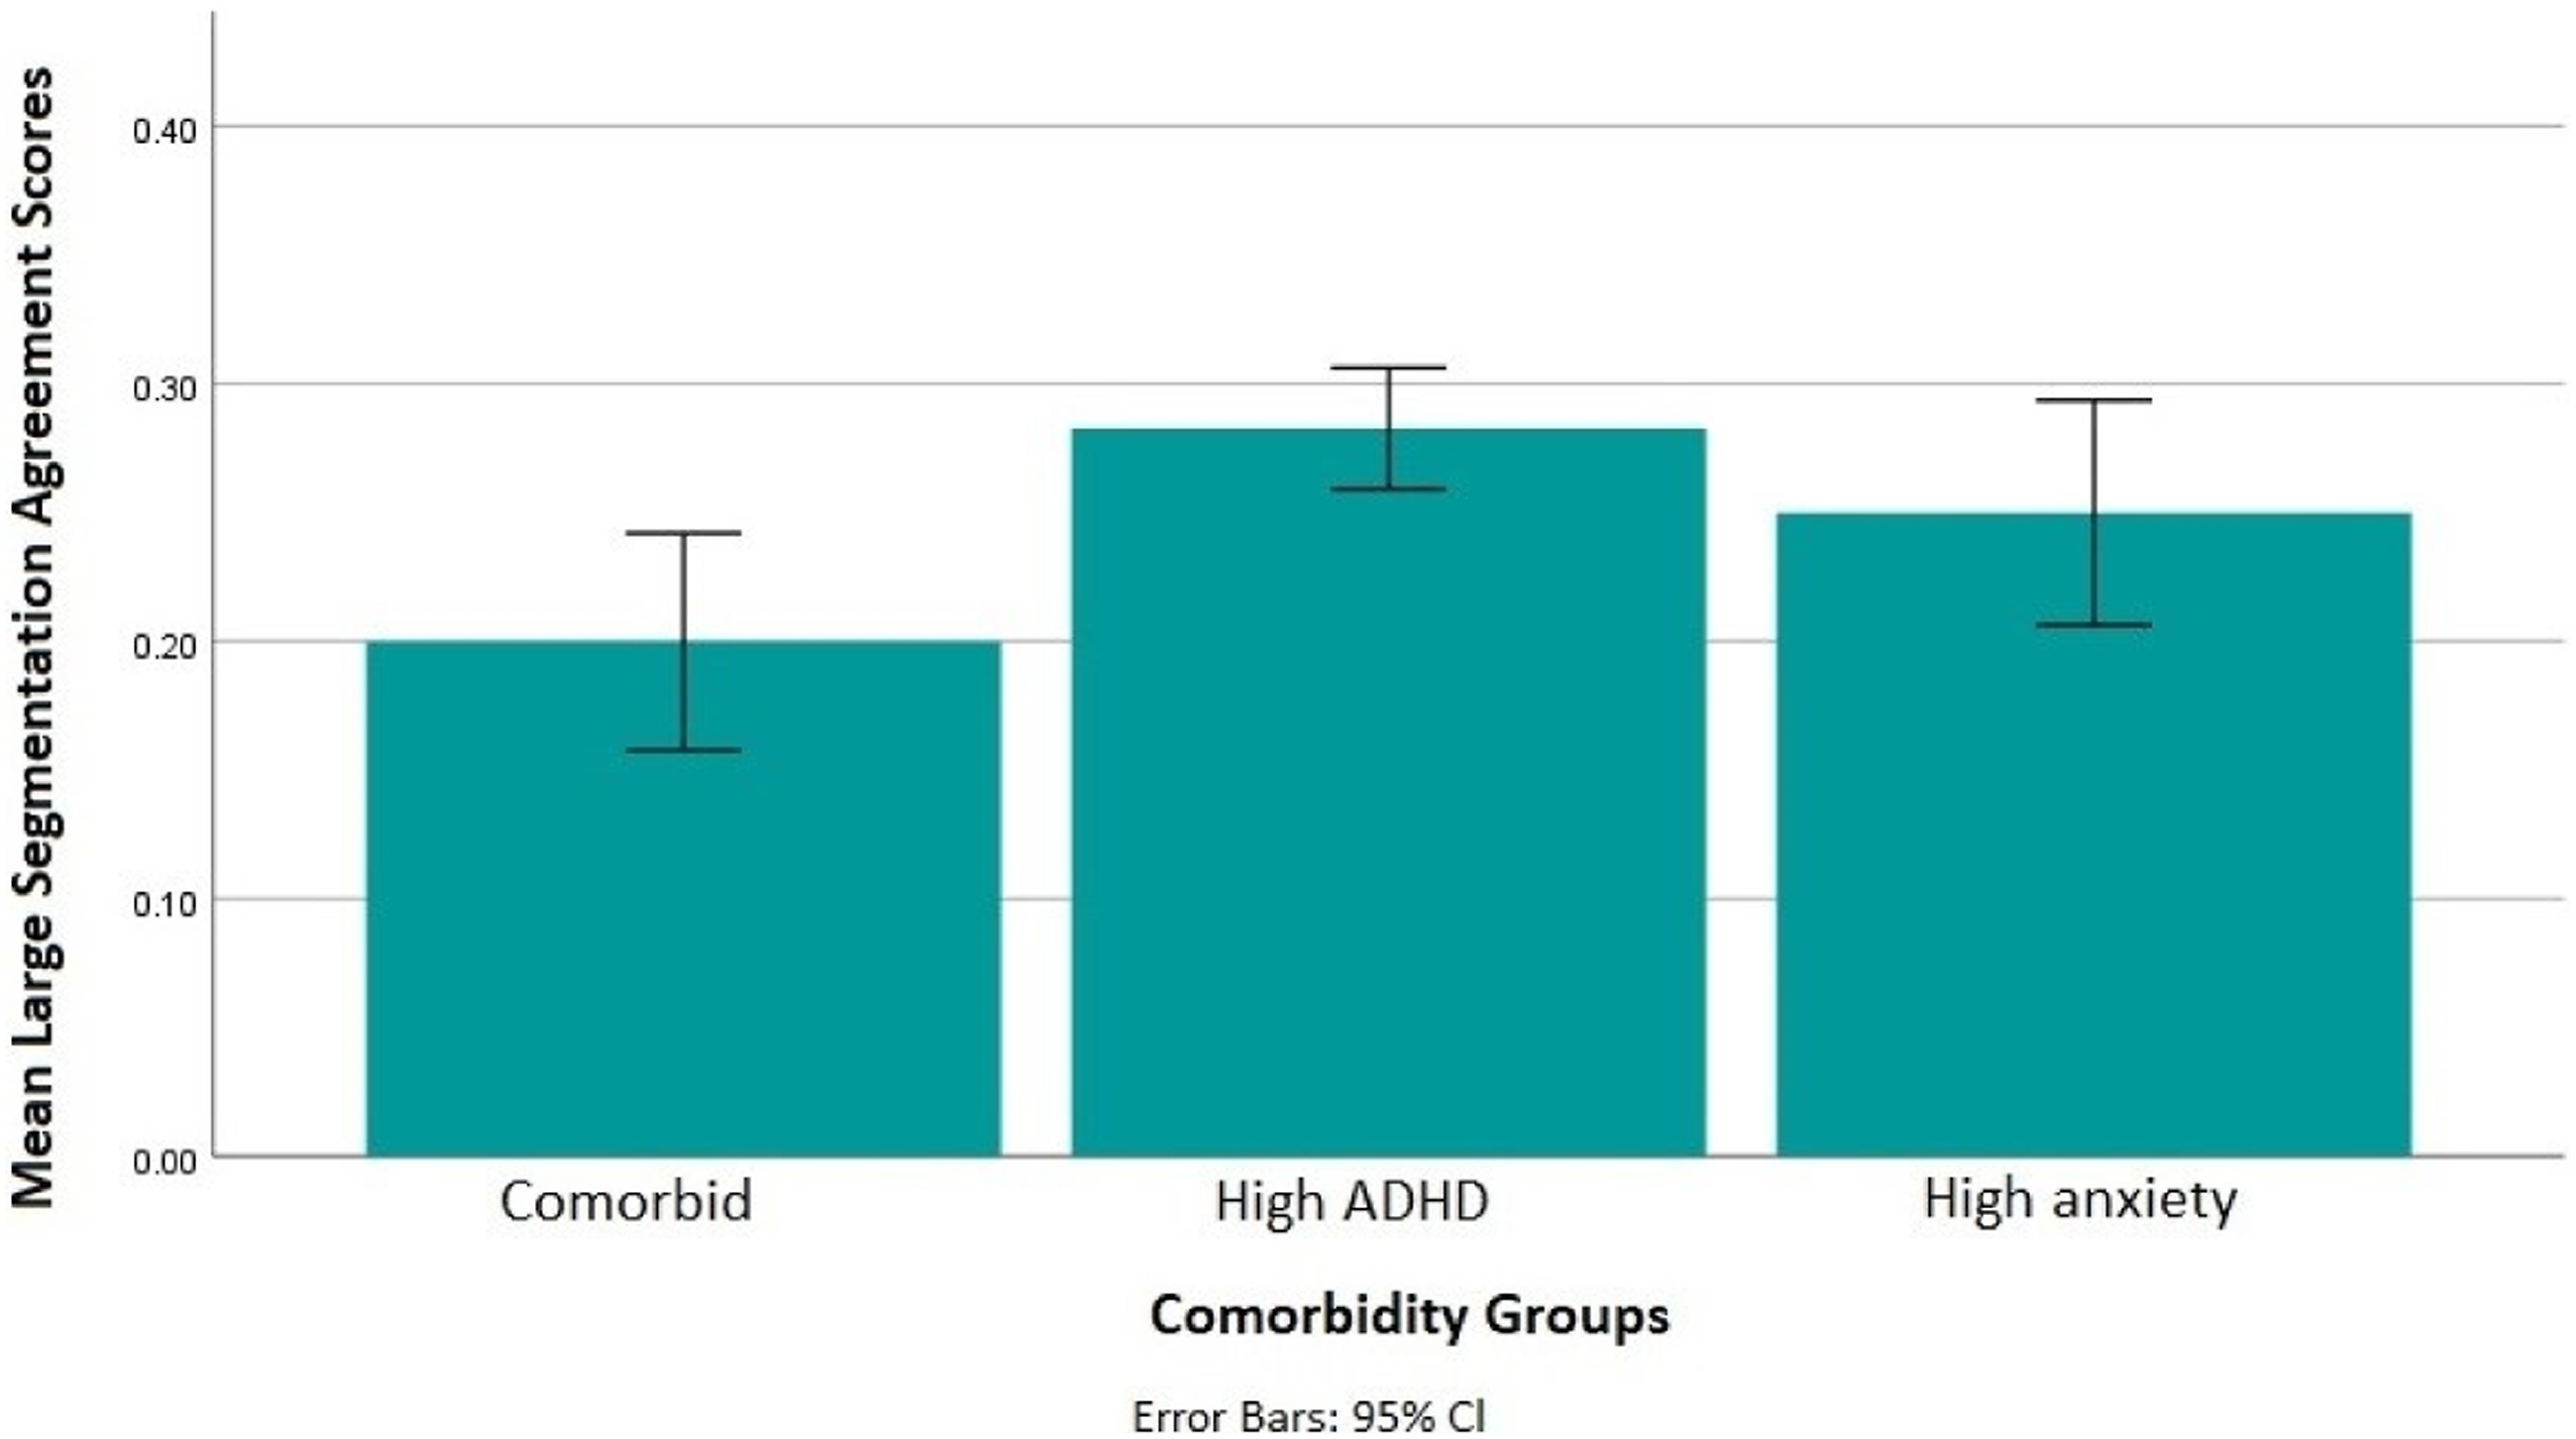
Simple bar mean of large segmentation agreement scores by comorbidity groups.
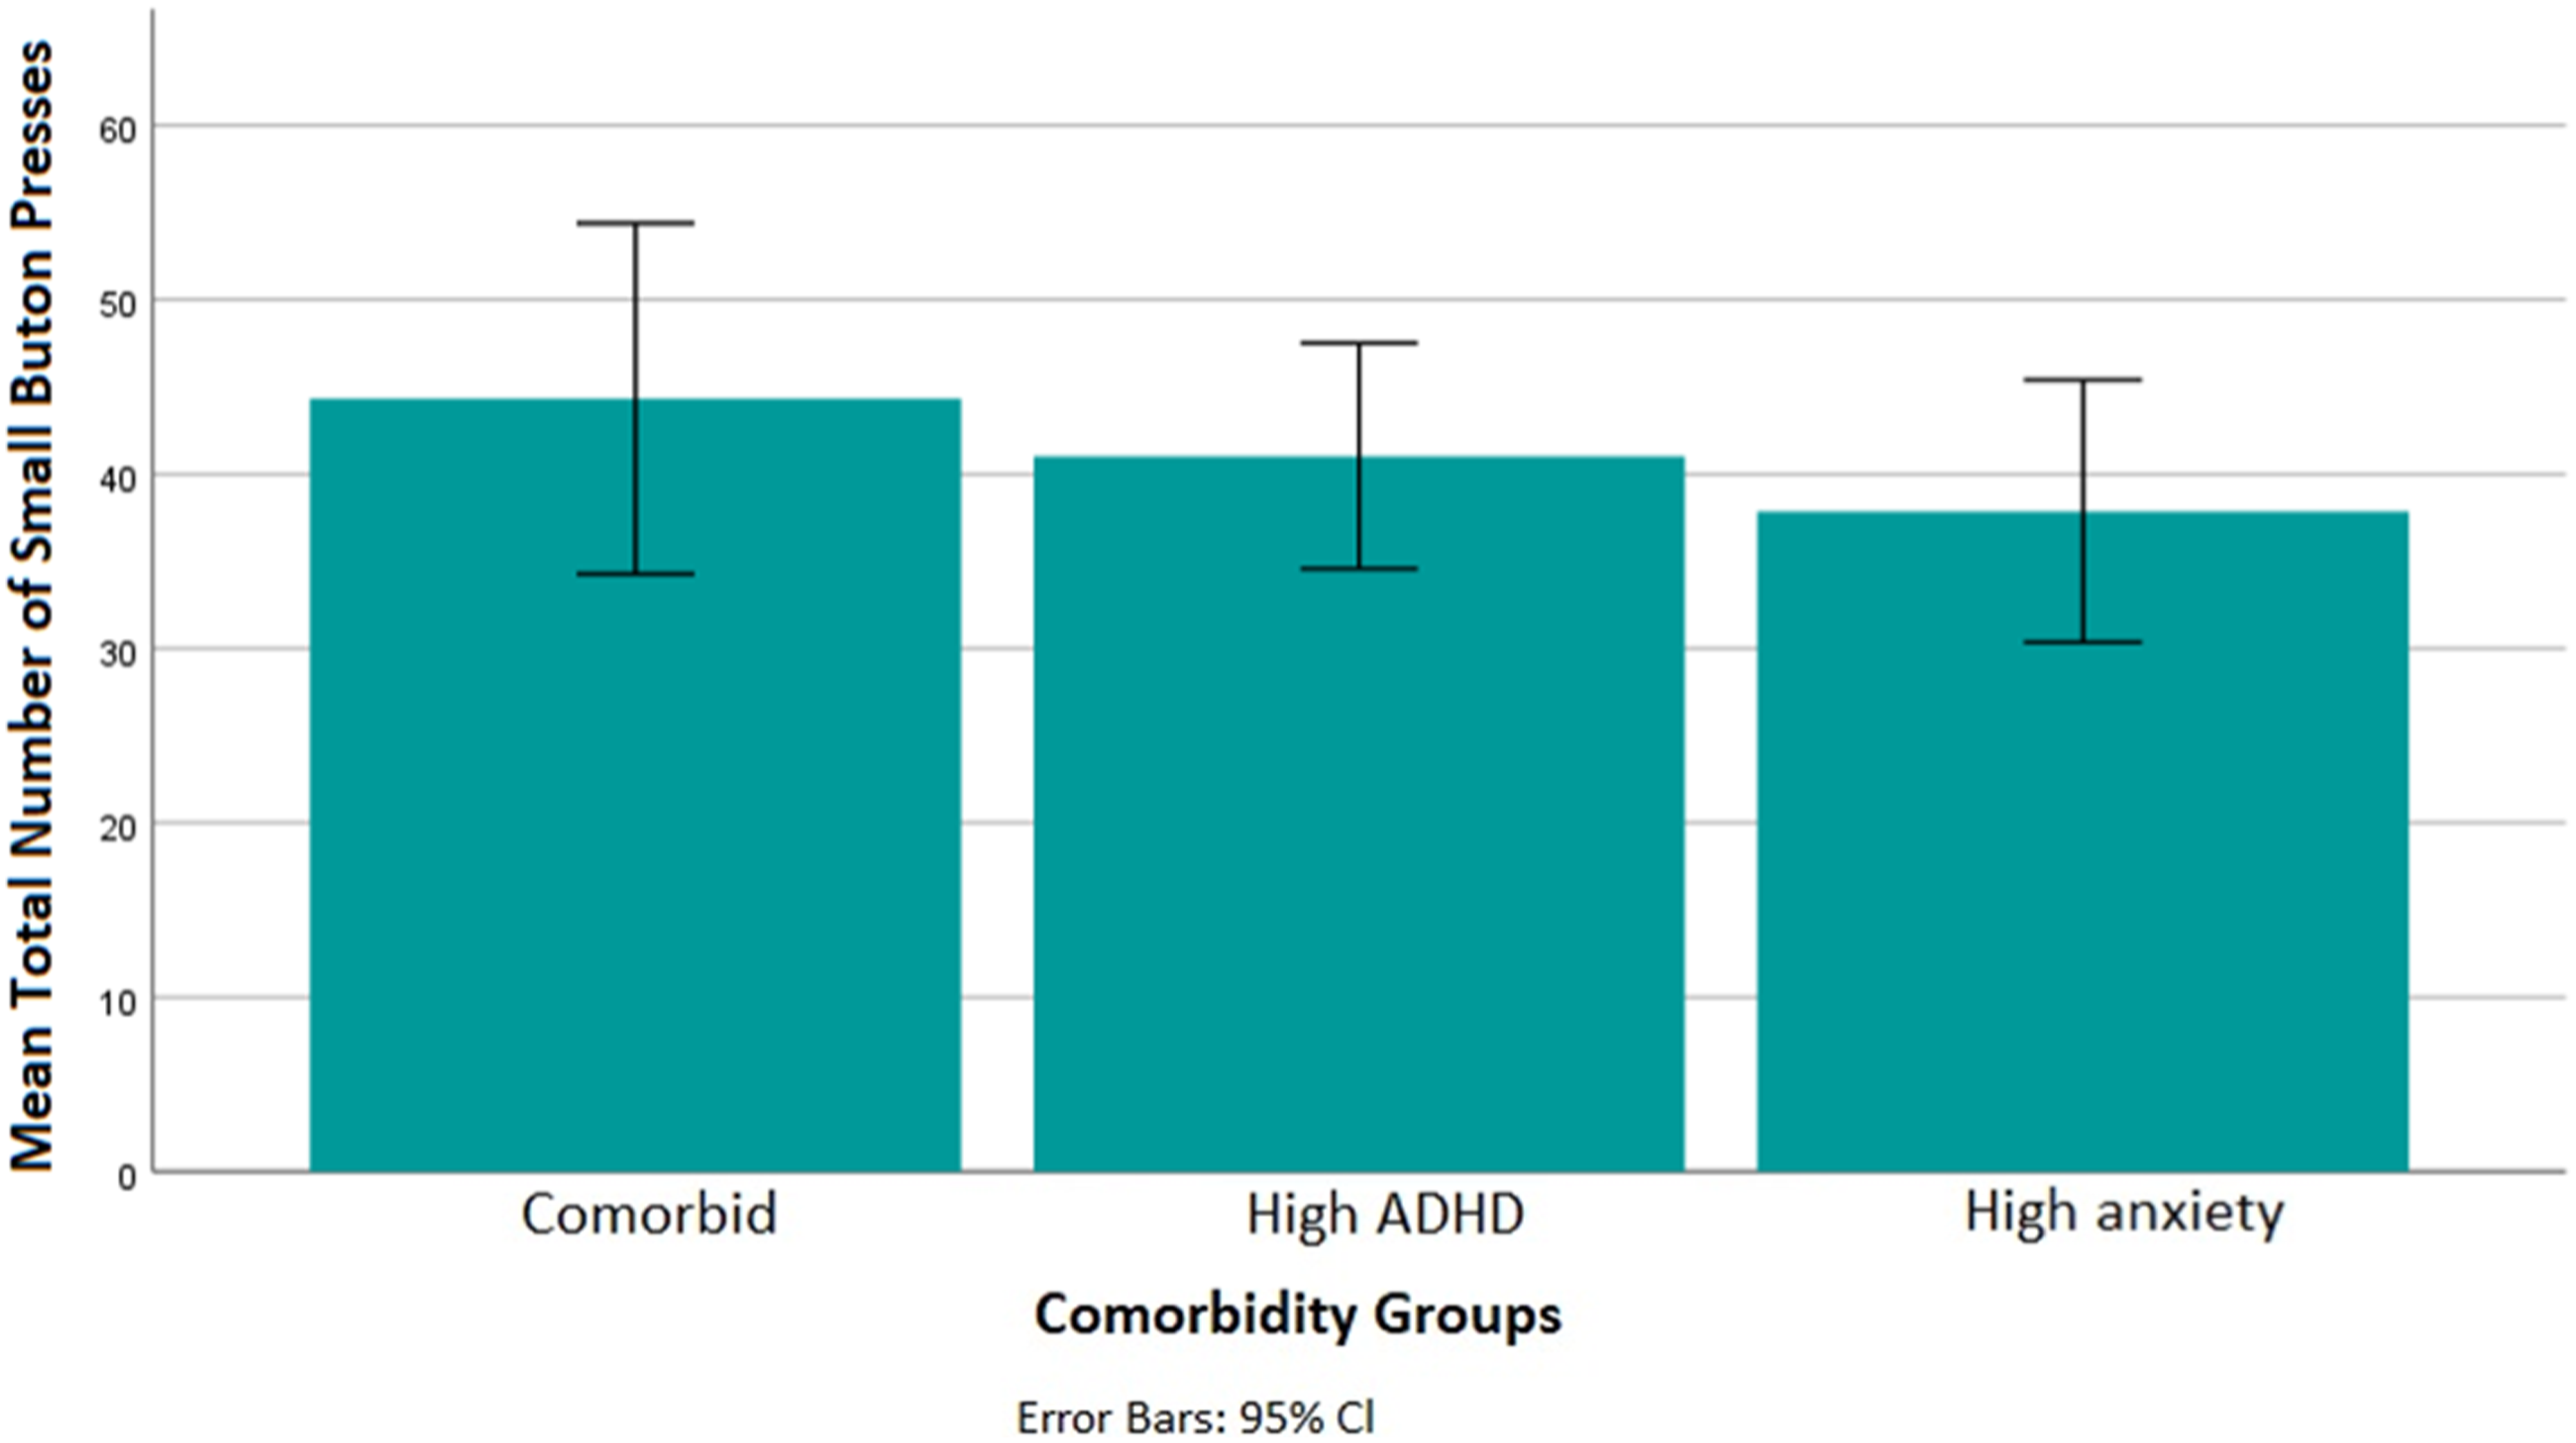
Simple bar mean of total number of small button presses by comorbidity groups.

Simple bar mean of small segmentation agreement scores by comorbidity groups.
Discussion
The primary aim of this study was to assess the comorbid effect of ADHD and anxiety on event segmentation. Overall, results suggested both similarities and differences between the individual and comorbid effects of anxiety and ADHD symptoms.
Significant effects were observed in the large condition, suggesting that the identification of large, but not small, events may be differentially impacted by ADHD and anxiety symptoms. Results specifically revealed that the High ADHD group identified more large events than the High Anxiety group but not significantly more than the Comorbid group. The total number of button presses refers to the number and size of events perceived (Newston & Engquist, 1976; Zacks et al., 2007). Although the effect size associated with this significance was quite small, the finding resembles that of Ryan and Rogers (2018) which showed that ADHD symptoms produce a higher frequency of large event identification. These authors suggested this was due to impaired working memory impacting the ability to hold event models in mind for longer periods, though the effect could also reflect hyperactivity/impulsivity symptoms. The findings here suggest that this effect is pronounced when comparing the ADHD symptoms to anxiety symptoms but that the effect of both symptoms together is similar to ADHD alone (e.g. Korenblum et al., 2007). This could suggest that ADHD symptoms are driving the increased identification of large events in the comorbid group.
The High ADHD group also had significantly higher agreement scores than the Comorbid group in the large condition, but not when compared to the High Anxiety group. Segmentation agreement scores represent the degree to which an individual agrees with the group norm regarding the placement (location) of event boundaries in movies (Kurby & Zacks, 2011; Sargent et al., 2013; Zacks et al., 2006). Hence, segmentation agreement scores refer indirectly to the content of event models, such as sensory components of the stimuli and related event schemata. Therefore, the higher agreement with the ADHD group could be due to similarities in which cues attract their attention (e.g., perceptual) compared to the comorbid group, which introduces further symptoms that can affect attention in varying ways. In other words, people with ADHD may show higher agreement than those with both ADHD and anxiety due to the addition of anxiety symptoms that orient attention towards many different stimuli. This interpretation is supported by known attentional deficits associated with ADHD (McCarthy et al., 2013; Salmi et al., 2018) and by the notion that those with anxiety symptoms may differ drastically in the type of stimuli that causes them to worry, as per the symptom profile itself (e.g., “worrying about many different things”).
Conclusions
The present study adds to the research investigating the cognitive impacts of ADHD and anxiety symptom comorbidity. The results demonstrate a specific event segmentation effect when identifying coarse-gain (large) events among those with ADHD symptoms, broadly replicating Ryan and Rogers (2018), and suggest that the presence of anxiety does not exacerbate this effect. However, given that anxiety-based attention differences are believed to be driven by the presence of threatening stimuli, it is possible that event segmentation differences related to anxiety would be more apparent with the inclusion of movies with content that would activate the anxiety system. Further, our effect sizes were small, and our study was underpowered, highlighting that these findings are exploratory.
This study helps establish the need to continue investigating ADHD and anxiety comorbidities through a cognitive lens to further elucidate the similarities and differences between both disorders. This area of research could be furthered with the use of varying movie stimuli, replication in-lab (rather than online), the inclusion of higher sample sizes, and extending this topic to different populations (clinic settings, ages, etc.) while controlling for gender to more specifically identify the source of the differences observed in this study.
Footnotes
Declaration of conflicting interests
The author(s) declared no potential conflicts of interest with respect to the research, authorship, and/or publication of this article.
Funding
The author(s) disclosed receipt of the following financial support for the research, authorship, and/or publication of this article: This research was supported by the Social Sciences and Humanities Research Council.