
Abstract
The present study examined attentional biases to female body images in young adult (aged 17–30 years) Caucasian females with high versus low levels of shape/weight-based self-worth. Using an inhibition of return (IOR) task, we measured how readily participants were able to disengage attention from nonthin and thin-ideal body images. In response to nonthin body images, the Low group (i.e., participants with low levels of shape/weight-based self-worth) displayed increased IOR toward the body images relative to the High group (i.e., participants with elevated shape/weight-based self-worth). Our results suggest that women with low levels of shape/weight-based self-worth possess a potential protective mechanism that allows them to more readily disengage attention from nonthin images compared to women who base their self-worth on shape/weight. These findings provide a new focus for investigating attentional processes in individuals at risk of eating disorders, as they relate to the ongoing processing of body-related imagery beyond initial attentional capture.
Introduction
Eating disorders are defined as a disturbance of eating and other behaviors with the intention to control weight, resulting in clinically significant impairment of physical, psychological, and social functioning (Fairburn & Harrison, 2003; Klein & Walsh, 2004). They are complex, poorly understood, have a high rate of mortality, and are difficult to treat (Stice, 2002). The diagnostic criteria for both anorexia nervosa and bulimia nervosa require that individuals display an undue influence of shape and weight on self-evaluation (American Psychiatric Association, 2013; Fairburn & Harrison, 2003), which has been conceptualized as the core psychopathology of eating disorders (Fairburn, Cooper, & Shafran, 2003; Fairburn & Harrison, 2003). In contrast to individuals without eating disorders who assess their self-worth across a number of different domains, such as work, family, relationships, and sport, individuals with eating disorders judge their self-worth largely, if not entirely, in terms of their weight and shape (Fairburn et al., 2003). Most other features of eating disorders, such as starvation and compensatory behaviors, are proposed to stem from this shape/weight-based self-worth. When shape and weight become a basis for self-worth, dietary restraint, thinness, and weight loss are actively pursued (Fairburn et al., 2003). Self-worth unduly influenced by an individual’s shape and weight has also been implicated in the high rate of relapse from eating disorders (Fairburn & Harrison, 2003).
Thus, cognitive models of eating disorders propose that eating disorder symptoms are maintained through characteristic beliefs about the meaning of shape and weight for self-worth (Fairburn & Harrison, 2003; Vitousek & Hollon, 1990). Specifically, cognitive models of eating disorders propose that this overevaluation of shape/weight comprises a maladaptive schema that unites beliefs about self-worth and ideas about shape and weight. A schema is a cognitive structure that develops from past experience and influences an individual’s interpretation of experiences through its influence on information processing (Vitousek & Hollon, 1990). Schemas produce systematic errors in attention, memory, perseverance, and confirmatory bias when processing information relevant to that schema (Vitousek & Hollon, 1990). As a result, the shape/weight-based self-worth schema is proposed to maintain eating disorder behaviors and be maintained by systematic errors in the processing of information related to shape and weight (Vitousek & Hollon, 1990). As such, cognitive models predict that individuals with shape/weight-based self-worth, whether or not it has resulted in an eating disorder, will demonstrate systematic biases in attention regarding shape and weight information in their environment (Cooper, 1997; Faunce, 2002; Vitousek & Hollon, 1990).
Researchers have investigated the role of selective attention toward shape/weight information in eating disorders for approximately 20 years (Dobson & Dozois, 2004; Faunce, 2002; Rieger et al., 1998; Sackville, Schotte, Touyz, Griffiths, & Beumont, 1998; Shafran, Lee, Cooper, Palmer, & Fairburn, 2007). Consistent with cognitive models, this research has demonstrated that individuals with eating disorders display biases in attention in the processing of shape and weight information.
Selective attention was first investigated through the use of the modified Stroop color-naming paradigm (Lee & Shafran, 2004). This research demonstrated biases in processing interference for food, body shape, and weight-related words in individuals with eating disorders (Ben-Tovim & Walker, 1991; Ben-Tovim, Walker, Fok, & Yap, 1989; Cooper & Fairburn, 1992; Dobson & Dozois, 2004; Faunce, 2002; Lee & Shafran, 2004; Sackville et al., 1998). Overall, the results and associated effect sizes suggest that women with eating disorders demonstrate a moderate degree of preferential processing of weight/shape words. Control participants without eating disorders have been found to demonstrate a small degree of preferential processing for weight/shape words, with no difference between those with high levels of dietary restraint and healthy controls.
Using a modified dot-probe task, Rieger et al. (1998) investigated biases in attentional capture in individuals with eating disorders. It was found that, unlike control participants (including those high in dietary restraint), individuals with eating disorders displayed an attentional bias toward body words connoting a large physique (although this finding only demonstrated a trend toward significance) and away from body words connoting thinness. Shafran et al. (2007) partially replicated these findings using photographs rather than words. They found that participants with eating disorders displayed increased attention toward images depicting larger physiques, including images of larger bodies or body parts such as thighs or stomachs. Participants with eating disorders also displayed a significant attentional bias toward weight stimuli, which included images of scales, people being weighed, or people weighing themselves. However, a meta-analysis of dot-probe research highlights inconsistencies in results investigating attentional biases regarding stimuli connoting thin versus larger physiques between individuals with eating disorders and healthy controls (Aspen, Darcy, & Lock, 2013).
The findings are also contradictory in research using an eye-tracking paradigm (Blechert, Nickert, Psych, Caffier, & Tuschen-Caffier, 2009; Janelle, Hausenblas, Fallon, & Gardner, 2003). One such study found that individuals with high levels of body dissatisfaction displayed an attentional bias toward thin body images (Cho & Lee, 2013). Consistent with this research, Blechert et al. (2009) report that individuals with bulimia nervosa fixated longer on images of women with lower body mass indices (BMIs) than on images of women with higher BMIs. This attentional preference for images with lower BMIs was not observed in the healthy control group. Yet other research using eye tracking suggests that individuals at high risk of eating disorders (i.e., those with a high drive for thinness and body dissatisfaction) display avoidance of all types of body images when compared with individuals at low risk (Janelle et al., 2003).
In attempting to account for the mixed findings in their systematic review, Rodgers and DuBois (2016) propose that differences in attentional biases are observed depending on the type of stimulus used (e.g., stimuli referring to the self or other) as well as the type of cognitive task employed. Regarding the latter, different cognitive tasks measure different stages of attention (Cisler & Koster, 2010). Attentional biases may be due to facilitated attention, difficulty disengaging, or attentional avoidance. It has been proposed that the attentional biases as measured by a dot-probe task may be assessing both facilitated attention and difficulty disengaging attention depending on the presentation times used (Cisler & Koster, 2010). One experimental method that can be employed to overcome this difficulty is the spatial cueing task that specifically measures just the disengagement of attention or attentional maintenance (Cisler & Olatunji, 2010).
Early studies investigating attentional biases in eating disorders primarily measured the capture of attention (Faunce, 2002). While attentional capture provides information about where attention is being oriented, attentional maintenance provides information about what is holding attention and preventing attention from being allocated to another stimulus (Gao et al., 2013; Klein, 2000). Through investigating attentional maintenance, it is possible to ascertain whether individuals display a difficulty in switching attention between stimuli (Cisler & Koster, 2010). Attentional maintenance is proposed to play a significant role in the etiology and maintenance of anxiety disorders (Cisler & Koster, 2010). Therefore, an understanding of the attentional maintenance toward shape/weight information may provide further information about the role of these attentional biases in the development and maintenance of the core psychopathology of eating disorders.
There has been limited research into the later stages of attentional processing of shape/weight stimuli. In one such study using an eye-tracking paradigm, Gao et al. (2014) found that women with elevated body dissatisfaction displayed increased sustained attention toward both thin and larger body images, when compared with women with low body dissatisfaction. While the eye-tracking paradigm provides a good measure of where attention is being directed, through eye gaze and fixture, it has limited ability to assess what is being perceived or how saliently, quickly, or effectively it is perceived. Thus, without a performance metric such as reaction time, the eye-tracking task only provides an indirect measure of what an individual has perceived. Therefore, the use of behavioral data complements eye-tracking research by providing a further measure of what, when, and how information is processed. Nevertheless, the eye-tracking results do suggest disturbances in attentional maintenance regarding body-related information in vulnerable individuals.
A difficulty disengaging attention from shape and weight information would lead to an individual being continuously reminded of this information and reduce his/her cognitive capacity to attend to other more adaptive information. For individuals with the core psychopathology of eating disorders (i.e., shape/weight-based self-worth), this could contribute to an ongoing preoccupation with this information, thereby increasing their vulnerability toward developing eating disorder symptoms. One spatial-cueing paradigm used to investigate the disengagement of attention is the inhibition of return (IOR) paradigm (Klein, 2000).
IOR is a mechanism of the visual system that encourages attending to novel information in the environment, through inhibiting attention from returning to previously attended locations (Posner & Cohen, 1984). As such, the IOR paradigm provides a means of investigating whether individuals with high shape/weight-based self-worth have a reduced ability to disengage attention from shape/weight information. As displayed in Figure 1, the IOR task involves the presentation of a central fixation cross, followed by a peripheral cue, presented to the left or right, then the reappearance of the fixation cross, and finally the presentation of a target cross in the location previously occupied by the cue (valid trial) or the opposite location (invalid trial). The duration between the cue onset and the target onset is known as the stimulus-onset asynchrony (SOA). At shorter SOAs, facilitation, or attentional cueing, occurs, where reaction times on the valid trial are faster than the invalid trial. At longer SOAs, IOR is present when there is a slower reaction time for valid compared to invalid trials. The IOR effect is robust (Klein, 2000) and is widely used in the investigation of attentional maintenance (Lupiáñez, Klein, & Bartolomeo, 2006). The IOR paradigm provides a way to investigate differences in disengagement of attention to different stimuli, with lower IOR reflecting reduced disengagement and greater attentional maintenance regarding that stimulus.
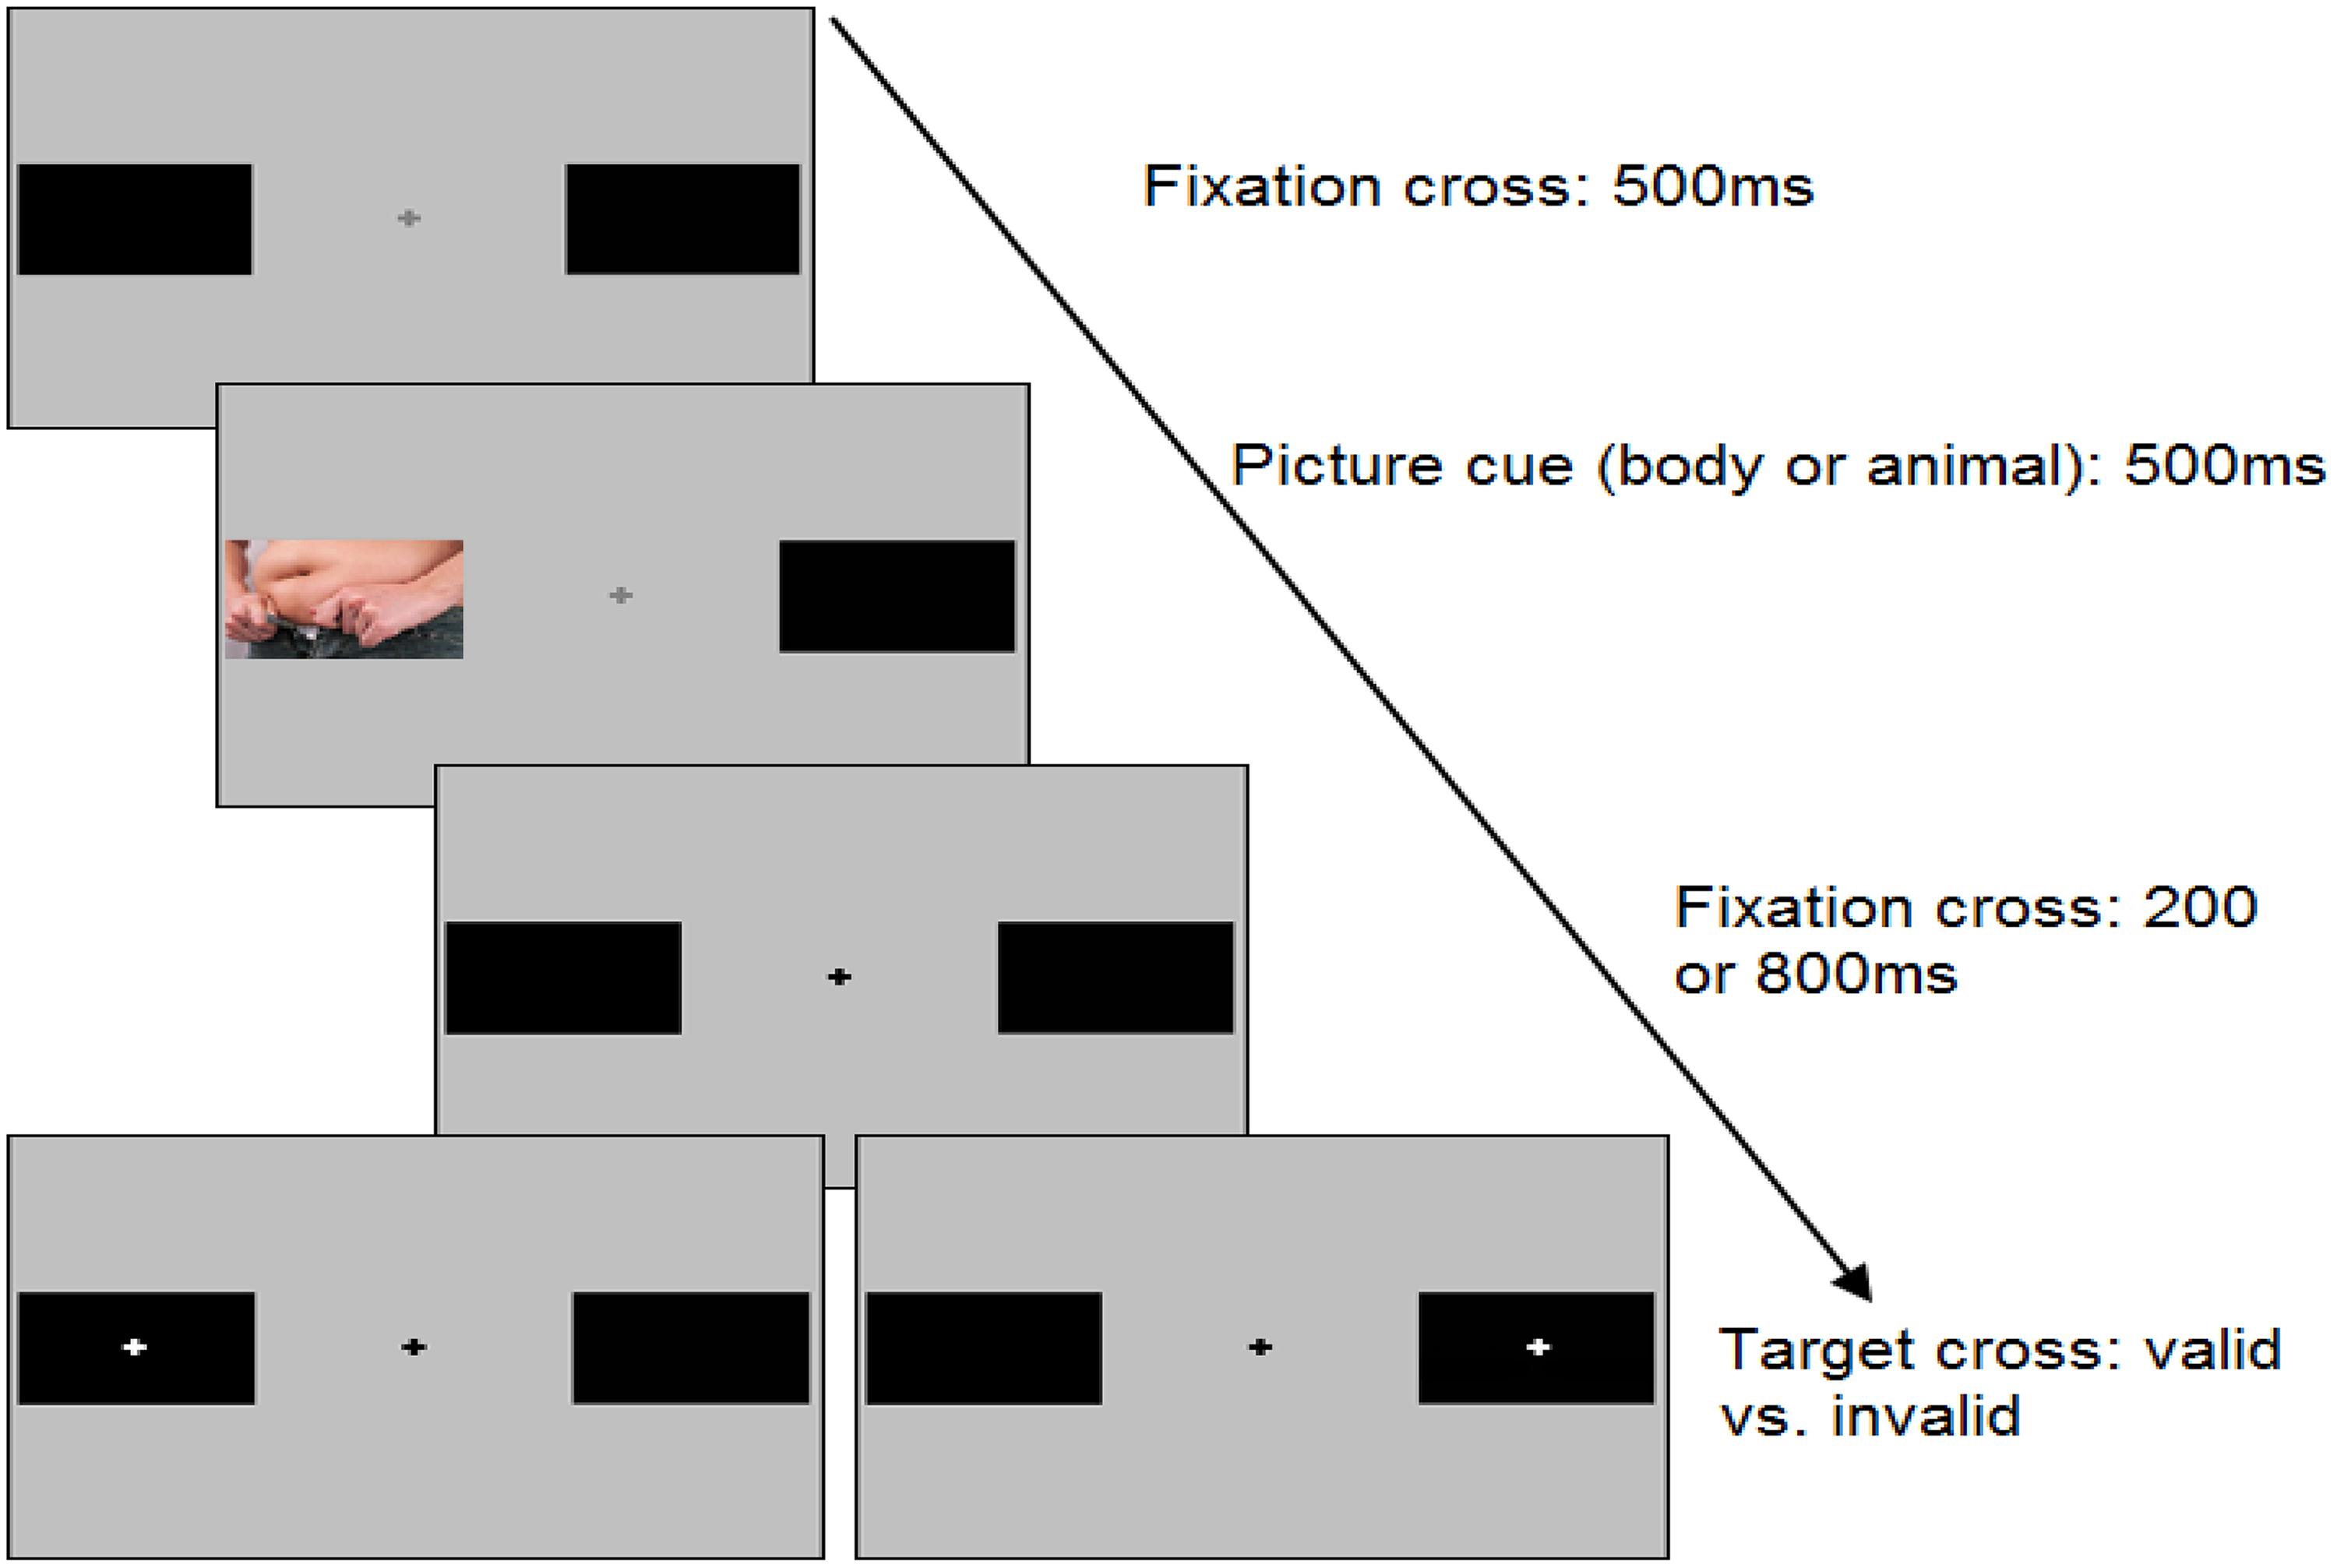
Example of typical IOR paradigm trial sequence. IOR = inhibition of return.
The aim of the current study is to utilize the IOR task to examine biases in disengaging attention from shape and weight information (both thin-ideal and nonthin body images) in individuals with elevated shape/weight-based self-worth. Based on cognitive theories of eating disorders and previous research, it is hypothesized that individuals with high shape/weight-based self-worth (the High group) will display differences in disengaging attention compared to individuals with low levels of shape/weight-based self-worth (the Low group), when exposed to nonthin and thin-ideal body images. The predicted direction of these differences is not clear, given the current inconsistencies in the research regarding processing of stimuli connoting nonthin and thin-ideal physiques.
Method
Participants
Female participants aged 17–30 years were recruited via flyers distributed throughout the Australian National University. A young adult, female-only sample was recruited as body image, and eating disorder symptoms are elevated in this group (Bucchianeri et al., 2013; Stice, 2002; Swami et al., 2010). A Caucasian-only sample was used, given that, firstly, Caucasian female body images were used in this study and, secondly, research suggests cultural differences in the cognitive processing of body imagery (Chen & Jackson, 2005).
Several criteria were used to exclude participants from the initial sample of 57 participants. Firstly, participants’ data were excluded if they had a BMI in the obese weight range (BMI ≥ 30 kg/m2) (World Health Organization, 1998). Three participants were removed on this basis. This exclusion criterion was utilized due to research that has demonstrated differences in IOR for disorder-salient images between participants in the normal and obese weight ranges (Carters, Rieger, & Bell, 2015). Secondly, participants’ data were excluded if they did not endorse either high or low levels of shape/weight-based self-worth based on their responses to two items from the Eating Disorder Examination Questionnaire (EDE-Q; further information about this exclusion criterion is provided below in the section on EDE-Q). The data from four participants were excluded for this reason. Finally, a mean accuracy score of 75% or above on the IOR task was required for inclusion in the analysis, with one participant’s data from the nonthin trials excluded on this basis. The mean accuracy was 98.92% (SD = 1.28) for the nonthin ideal images and 99.71% (SD = 1.25) for the thin-ideal images. In addition, the catch trials had a mean accuracy of 99.69% (SD = 1.23) for the nonthin ideal images and 99.90% (SD = 0.71) for the thin-ideal images.
The final sample consisted of 50 participants aged 17–23 years (M = 19.22, SD = 1.34). Participation was voluntary, and informed consent was gained prior to testing. Participants received AUS$10 or 60-min course credit as compensation for their participation. This study had full ethics approval from the Australian National University Human Research Ethics Committee (Protocol 2014/219).
Measures
Eating Disorder Examination Questionnaire
The EDE-Q was administered primarily to categorize participants according to their reported levels of shape/weight-based self-worth (Fairburn & Beglin, 1994). The EDE-Q is a 28-item self-report questionnaire focusing on the occurrence and frequency of eating disorder symptomatology over the past 28 days. The EDE-Q is a widely used instrument due to its sound psychometric properties (Luce & Crowther, 1999; Mond, Hay, Rodgers, Owen, & Beumont, 2004a, 2004b). In the current study, the Cronbach’s α values were .80, .85, .92, .85, and .96 for the Dietary Restraint, Eating Concern, Shape Concern, Weight Concern, and total EDE-Q, respectively.
Of particular interest in the present study were the two items assessing shape- and weight-based self-worth. Specifically, participants were allocated to the Low group if they scored 0 to 2 (not at all to slightly) or the High group if they scored 4 to 6 (moderately to markedly) on either of the following EDE-Q items: “Over the past 28 days, has your weight/shape influenced how you think about (judge) yourself as a person?” If participants scored 3 on both items, they were not allocated to a group and their data were excluded from the final analyses. There were 26 participants in the Low group and 24 participants in the High group. These two items from the EDE-Q were selected since research shows that single-item measures of shape/weight-based self-worth are comparable to longer measures such as the Shape and Weight Based Self-Esteem Inventory (Geller et al., 1998; Mitsui, Yoshida, & Komaki, 2017; Tchanturia, Troop, & Katzman, 2002).
Materials
Distractor task
To minimize any carry over effect, a distractor task was completed between the two (thin and nonthin images) IOR computer tasks. The distractor task consisted of three short music film clips, lasting a total of 187 s. The film clips were selected from the Data Set for Emotion Analysis (Koelstra et al., 2012) and had previously been rated neutral in terms of valence and arousal; additionally, these clips had a nonbody focus. To ensure that the participants were engaged in the distractor task, they were required to answer three short questions after the clips were completed.
Picture stimuli
Images were used as cues in the IOR task. Two separate IOR experiments were run in random order across participants. In one IOR task, 20 images depicting thin-ideal body shapes were paired with 20 animal images. Thin-ideal images were defined as images of weight-related female body parts that were slender and had little/no body fat. In the other IOR task, 20 nonthin images were paired with 20 animal images. Nonthin stimuli consisted of realistic images of weight-related female body parts defined as representing BMIs in the upper normal to overweight range as the mean BMI of Australian women is 26.7 kg/m2 (Australian Bureau of Statistics, 2013).
Images were sourced from the Internet to reflect images women are exposed to in popular media so as to maximize ecological validity. All images were standardized to 300 × 200 pixels and were 5.4° in width and 3.4° in height. For each IOR task, the relevant sets of body and control images were matched on valence (positive/negative) and arousal (level of interest) to control for the effect these factors have on attentional biases (Fox, Russo, & Dutton, 2002). These matchings were based on a pilot study undertaken with 40 female participants who had a mean age of 18.3 years (SD = 1.63). The thin-ideal body images and their paired control animal images did not significantly differ on valence, t(38) = −1.76, p = .086, or arousal, t(38) = −.66, p = .510. Similarly, there was no significant difference between the nonthin body images and their paired animal images on valence, t(38) = −1.75, p = .088, or arousal, t(38) = −1.674, p = .102. As anticipated, there was a significant difference between the thin-ideal and the nonthin images on valence, t(38) = 10.27, p <.001, whereby the thin-ideal images were rated as significantly more positive than the nonthin images. There was no significant difference between the thin-ideal and the nonthin images on arousal, t(38) = 1.61, p = .115.
IOR tasks
The IOR tasks were administered on a computer using MatLab R2012b and the Psychophysics Toolbox software version 3 (Brainard, 1997). Separate IOR tasks, with identical designs for the nonthin and thin-ideal images, were run in accordance with previous implementations of the IOR task (Carters et al., 2015). Participants sat approximately 50 cm from the monitor.
For each IOR task, the computer display was set to a mid-level gray and throughout the task, black rectangle picture frames were presented 3° to the left and right of the central fixation cross. Each trial began with the presentation of a central dark gray fixation cross for 500 ms, followed by a body or an animal image for 500 ms, in either the left or the right frame (center of image = 3° away from the fixation cross). Following the image presentation, the central fixation cross changed brightness to cue the participant’s attention back to the center of the screen. Following a randomly designated SOA for that trial (either 1,200 ms or 1,800 ms), a white target cross appeared in either the left or the right picture frame. The target cross appeared either in the cued location (same location as the image; termed a valid trial) or in the un-cued location (opposite location as the image; termed an invalid trial). The image and target appeared an equal number of times on each side of fixation and equally in terms of being matched or unmatched in location. Participants responded by indicating the position of the target cross using the left or right arrow keys on the computer keyboard using their dominant hand. The next trial began after a response or after 2,000 ms.
The decision to use the SOAs of 1,200 and 1,800 was partly based on previous research (Carters et al., 2015). The decision was also based on an understanding of IOR data from a review by Klein (2000) who showed that IOR increases with SOA and that IOR begins at longer SOAs when using more complex cues (e.g., pictures) than it does for simple cues (e.g., spots of light). Therefore, the current study did not include shorter SOAs as they would not be expected to reliably produce IOR.
Five practice trials were followed by 200 trials, separated into two blocks of 100 trials with a minimum rest period of 5,000 ms between the blocks. Each IOR task contained nine conditions, body and animal image conditions (2×), a valid and invalid location (2×) at each SOA (2×), and a no target condition (1×) where no target was presented. The latter condition was included to ensure that the participant was not automatically responding in a rhythm. No target trials occurred on 20% of all trials. Each other condition was presented 20 times in random order. The participants’ reaction times and accuracy on each trial were recorded in a data file within MatLab. Each task took approximately 12 min.
Procedure
Following expressing interest in participating in the study, each participant was allocated to an individual testing session that lasted approximately 1 hr. On arrival, participants read the study information sheet and provided written consent. Participants then completed the two IOR tasks, with a distractor task in between. The order of the IOR tasks was counterbalanced across participants to minimize order effects. After completing the second IOR task, the participants were administered the EDE-Q and then had their height and weight measured to calculate BMI.
Statistical analysis
Data were analyzed using SPSS, version 22. Screening revealed that one participant had missing data for the nonthin IOR trials due to a computer malfunction and one other participant had missing BMI data due to issues with the scales. Screening of the IOR task data at the individual level was undertaken via MatLab and involved excluding reaction times on correct trials less than 200 ms (Gao et al., 2011; Stoyanova, Pratt, & Anderson, 2007).
IOR index scores were calculated by using the mean correct reaction time data for the valid and invalid trials. The IOR index score is calculated by subtracting the mean reaction time on invalid trials from the mean reaction time on valid trials. As a result, a positive index score indicates IOR (i.e., reluctance to return attention to the previously attended location), whereas a negative IOR index score indicates an absence of IOR (i.e., a facilitation effect for returning attention to the previously attended location, thereby indexing attentional maintenance).
For the computerized IOR task, two mixed between–within-subject analyses of variance (ANOVAs) were conducted to examine whether shape/weight-based self-worth (Low vs. High) influenced IOR at the two SOAs (1,200 and 1,800 ms) for each image set, that is, (1) thin-ideal compared with the control images or (2) nonthin images compared with the control images. Separate ANOVAs were conducted for thin-ideal and nonthin body images, with group (High vs. Low) as the between-subject variable and picture type (body vs. control image) and SOA (1,200 and 1,800) as within-subject variables. Significance was assessed using an α level of .05 (with no adjustment for multiple comparisons to maximize power; Rothman, 1990) and effect sizes were based on Cohen (1988).
Results
Data screening and cleaning
Analysis of univariate outliers at the group level (High vs. Low) revealed three extreme values with standardized scores exceeding 3.29 (p < .001, two-tailed test). These were on the 1,200 nonthin IOR, 1,200 thin control IOR in the Low group, and 1,800 nonthin control IOR in the High group. The data were analyzed both with and without these extreme values. These analyses revealed that all of these outliers had a significant effect on normality. As such, they were removed from further analysis. Analysis of multivariate outliers using the Mahalanobis distance revealed no cases (p < .001) that were not deemed to be legitimate parts of the target population. Following the exclusion of the outliers, all conditions met the assumptions of normality, as assessed by normal-weighted plots and the Kolmogorov–Smirnov statistic. Levene’s test for equality of variance indicated that homogeneity of variance was present for all analyses.
Sample characteristics
Table 1 displays the descriptive data for the High and Low groups. Independent samples t-tests revealed no significant differences for age, t(47) = 0.92, p = .361, or BMI, t(47) = 0.33, p = .741, between the High and Low groups. However, the High group was significantly higher than the Low group in terms of dietary restraint, t(47) = −3.14, p = .003, eating concern, t(31.33) = −4.26, p < .001, shape concern, t(47) = −6.96, p < .001, weight concern, t(35.90) = −3.11, p < .001, and global eating disorder pathology, t(37.17) = −5.81, p < .001.
Characteristics of the Low and High shape/weight-based self-worth groups.
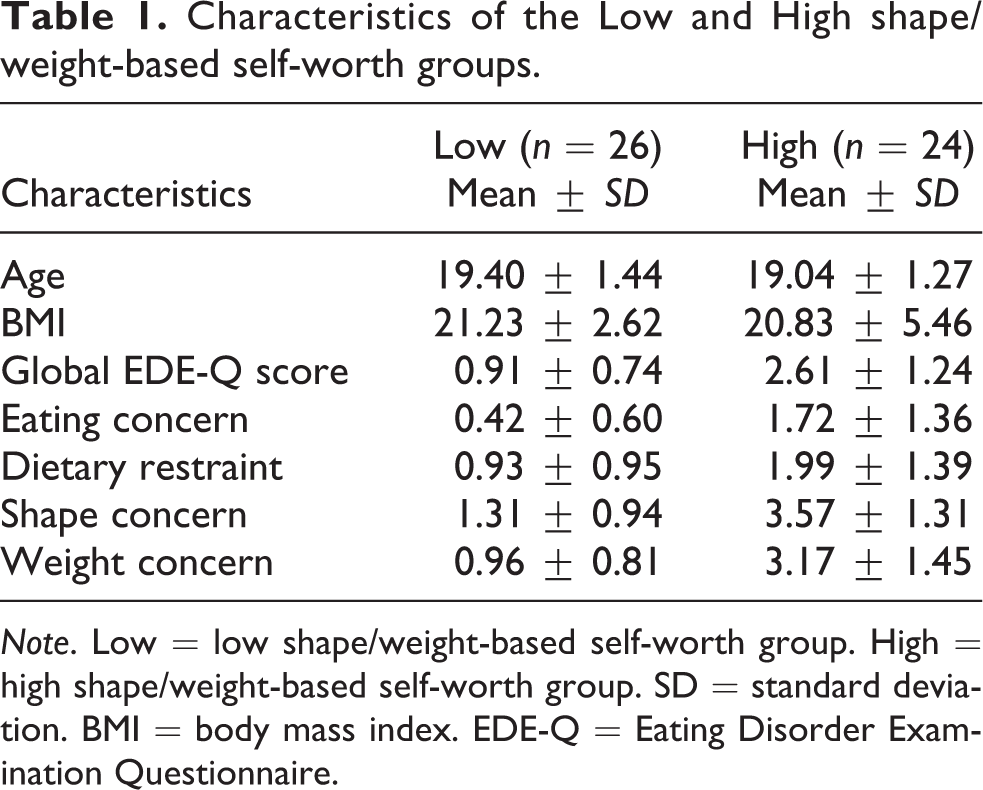
Note. Low = low shape/weight-based self-worth group. High = high shape/weight-based self-worth group. SD = standard deviation. BMI = body mass index. EDE-Q = Eating Disorder Examination Questionnaire.
The global EDE-Q scores of the Low group were comparable to other normative samples where women with current diagnosed eating problems were excluded (Aardoom, Dingemans, Slof Op’t Landt, & Van Furth, 2012; Rø, Reas, & Stedal, 2015). Additionally, the mean global EDE-Q score of the High group was above the recommended cutoff score of 2.50 to discriminate between the clinical and the control groups (Rø et al., 2015). Therefore, based on EDE-Q scores, the Low group was comparable to the normal population and the High group was similar to a clinical sample.
IOR for nonthin body images
To assess whether the High versus Low groups displayed a difference in IOR toward the nonthin stimuli compared with the control stimuli, a three-way, 2 (SOA: 1,200 and 1,800 ms) × 2 (image: nonthin and control image) × 2 (shape/weight-based self-worth group: Low and High) mixed-design ANOVA on IOR index scores was conducted.
The ANOVA revealed no main effects for SOA (Wilks’ λ = .987), F(1, 44) = 0.57, p = .452, (η2 = .013); image (Wilks’ λ = .930), F(1, 44) = 3.29, p = .076, (η2 = .070); or shape/weight group, F(1, 44) = 0.57, p = .454, (η2 = .013). However, these main effects need to be interpreted in the light of a significant two-way interaction between the image type and the shape/weight group (Wilks’ λ = .862), F(1, 44) = 7.04, p = .01, (η2 = .138), indicating that the IORs between the two groups differed across image type.
There were no significant two-way interactions between SOA and shape/weight group (Wilks’ λ = 1.00), F(1, 44) = 0.00, p = .989, (η2 = .000); or image and SOA (Wilks’ λ = .954), F(1, 44) = 2.12, p = .153, (η2 = .046); and no three-way interaction between SOA, image, and shape/weight group (Wilks’ λ = .999), F(1, 44) = 0.03, p = .864, (η2 = .001). Figure 2 shows the significant interaction between the image type and the shape/weight group on IOR indices.
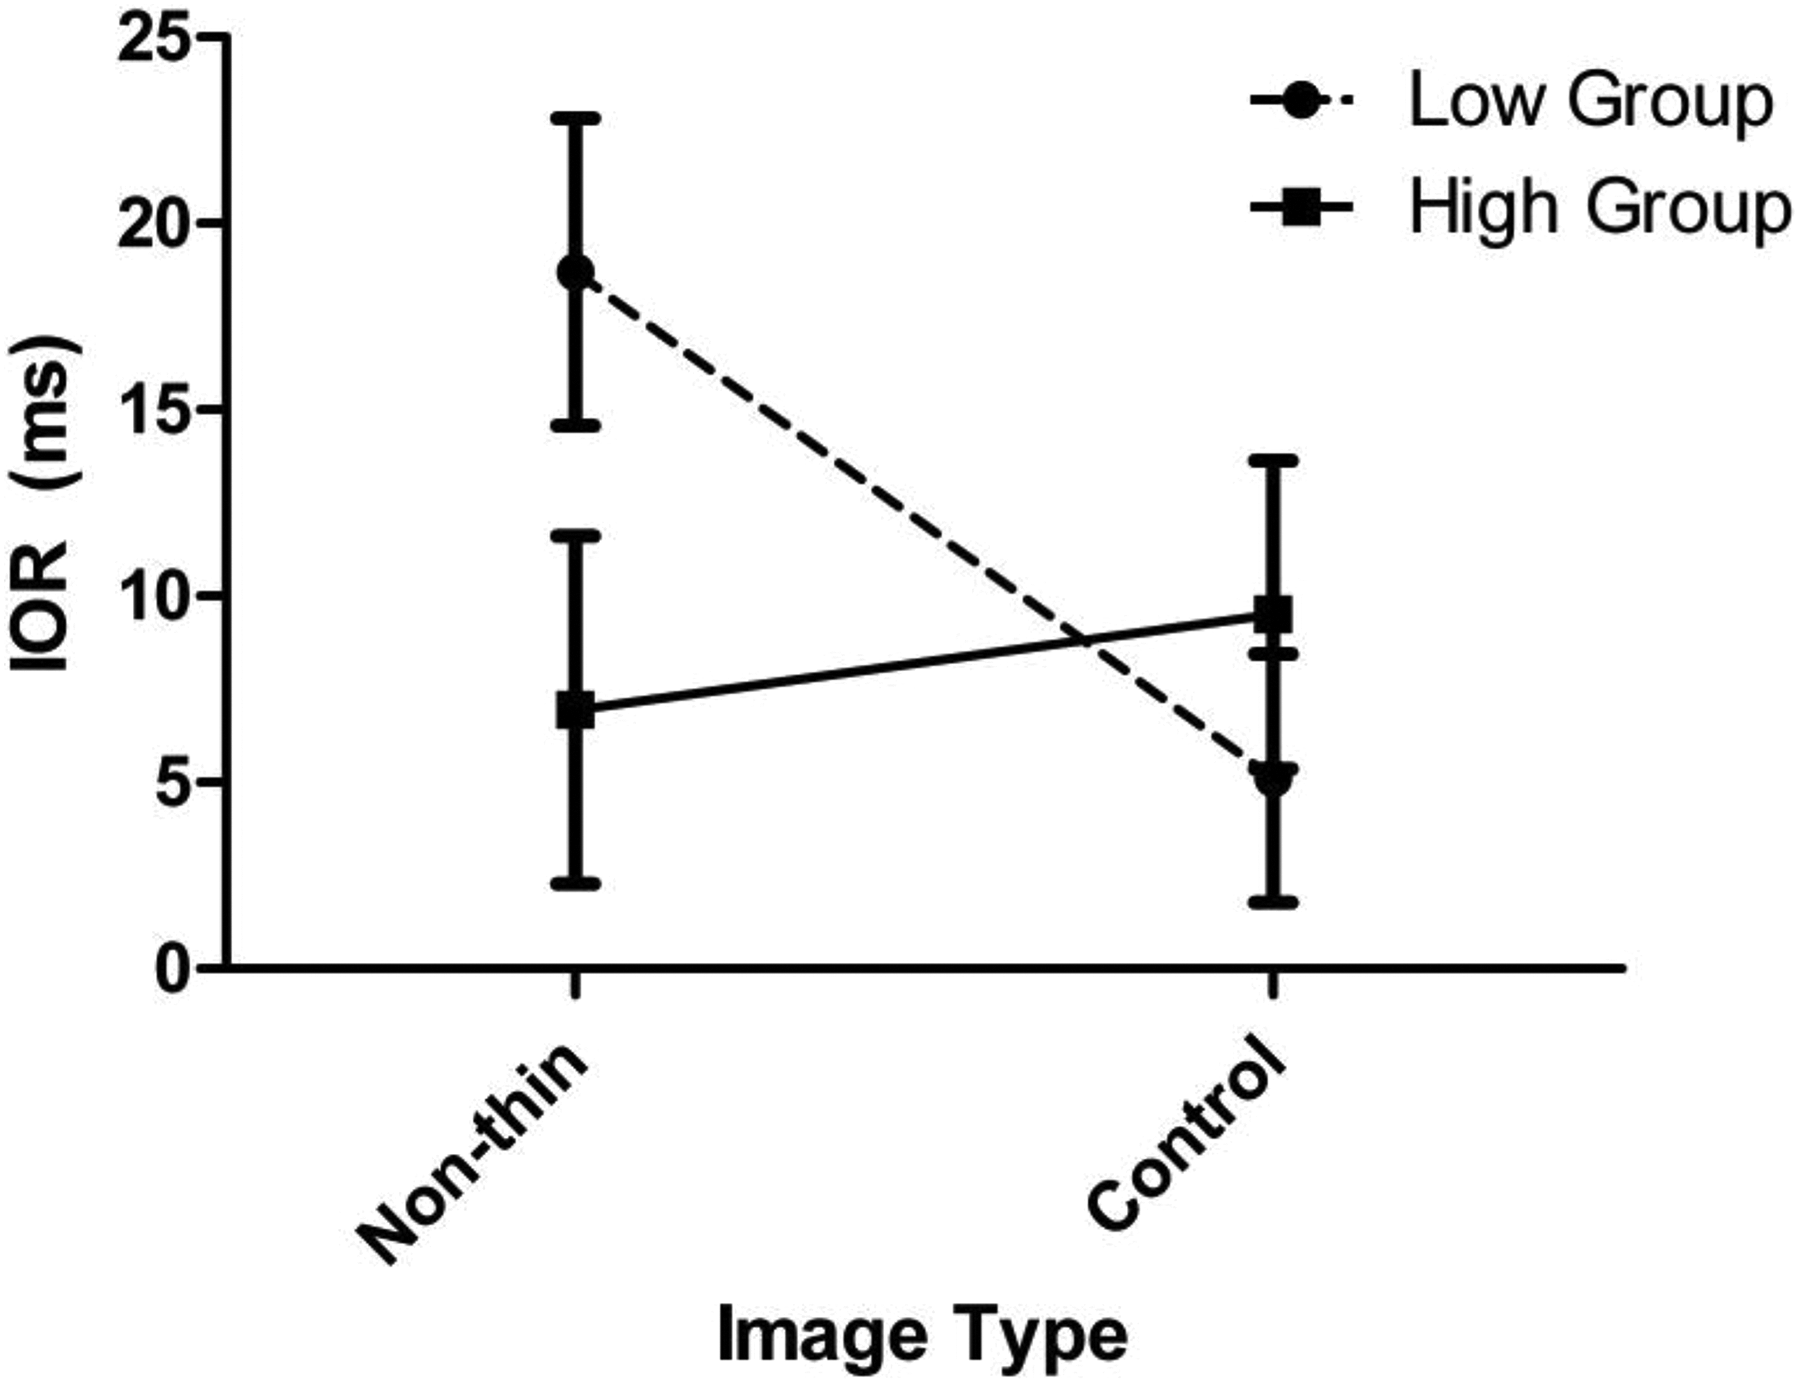
Mean IOR index scores (in milliseconds) for the nonthin and control images across the High and Low groups. Error bars display ± 1 SEM. IOR = inhibition of return; SEM: standard error of the mean.
To clarify the nature of the significant interaction between the group and the image type, simple effects analyses were undertaken. An independent samples t-test revealed a marginally significant difference between the IOR for the nonthin body images in the Low group (M = 18.70 ms, SD = 20.63 ms) and the High group (M = 6.95 ms, SD = 21.36 ms), t(44) = 1.89, p = .065 (mean difference = 11.75, 95% confidence interval (CI) = −.76 to 24.25), whereby the High group displayed less IOR for the nonthin body images compared with the Low group. No significant difference was observed in IOR for control images between the Low group (M = 5.12 ms, SD = 16.68 ms) and the High group (M = 9.50 ms, SD = 18.93 ms), t(44) = −0.83, p = .414 (mean difference = −4.38, 95% CI = −14.96 to 6.20). A paired samples t-test revealed a significant difference between the IOR for the nonthin body images versus the control images in the Low group, t(24) = 3.92, p < .001 (mean difference = 13.58, 95% CI = 6.43 to 20.73), whereby there was greater IOR toward the nonthin body images than the control images. By comparison, there was no difference between the IOR for the nonthin body images versus the control images in the High group, t(20) = −.49, p = .629 (mean difference = −2.55, 95% CI = −13.39 to 8.30).
IOR for thin-ideal body images
To assess whether the High and Low groups displayed differences in IOR toward the thin-ideal stimuli compared with the control stimuli, a three-way, 2 (SOA: 1,200 and 1,800 ms) × 2 (image: thin-ideal body image and control image) × 2 (shape/weight-based self-worth: low and high) mixed-design ANOVA on IOR index scores was conducted. This revealed no main effects for SOA (Wilks’ λ = .999), F(1, 46) = 0.02, p = .860, (η2 = .001); image type (Wilks’ λ = .998), F(1, 46) = 0.11 p = .742, (η2 = .002); or shape/weight group, F (1, 46) = 0.57, p = .454, (η2 = .012). Additionally, the two-way interactions between image type and shape/weight group (Wilks’ λ = .990), F (1, 46) = 0.45, p = .51, (η2 = .010); SOA and shape/weight group (Wilks’ λ = 1.00), F(1, 46) = 0.02, p = .893, (η2 = .000); or image type and SOA (Wilks’ λ = .968), F(1, 46) = 1.51, p = .225 (η2 = .032), were not significant. The three-way interaction between SOA, image type, and shape/weight group was trending toward significance (Wilks’ λ = .931), F(1, 46) = 3.40, p = .072, (η2 = .069). To understand this interaction, the data for each group were examined separately.
Low shape/weight group
A repeated-measures ANOVA revealed no significant main effect for image (Wilks’ λ = .966), F(1, 23) = 0.82, p = .375, (η2 = .034); or SOA (Wilks’ λ = .996), F(1, 23) = 0.08, p = .778, (η2 = .004). This needs to be interpreted in the light of a significant interaction between image and SOA (Wilks’ λ = .818), F(1, 23) = 5.12, p = .034, (η2 = .182). This interaction is shown in Figure 3.

Mean IOR index scores (in milliseconds) for the thin-ideal and control images across 1,200 and 1,800 SOA for the Low group. Error bars display ± 1 SEM. IOR = inhibition of return. SOA = stimulus onset asynchrony; SEM: standard error of the mean.
To clarify the nature of this interaction, simple effects analyses were conducted. A two-tailed paired samples t-test revealed no difference between IOR for the thin-ideal images at 1,200 SOA (M = 10.13, SD = 25.50) and 1,800 SOA (M = 20.00, SD = 20.64), t(23) = −1.76, p = .092 (mean difference = −9.87, 95% CI = −21.479 to 1.73). Similarly, there was no significant difference between IOR for the control images at 1,200 SOA (M = 15.42, SD = 22.69) and 1,800 SOA (M = 7.96, SD = 21.65), t(23) = 1.28, p = .212 (mean difference = 7.46, 95% CI = −4.57 to 19.48) nor between the thin-ideal images and control images at 1,200 SOA, t(23) = −1.11, p = .278 (mean difference = −5.29, 95% CI = −15.13 to 4.55).
However, there was a marginally significant difference in the IOR for thin-ideal images and control images at 1,800 SOA, t(23) = 2.05, p = .052 (mean difference = 12.04, 95% CI = −.13 to 24.21), whereby participants displayed more IOR toward the thin-ideal body images compared with the control images at 1,800 SOA. This pattern of results shows that individuals with low weight/shape-based self-worth, IOR to thin-ideal body imagery builds with SOA, consistent with increasing attentional disengagement from this specific type of image content.
High shape/weight group
A repeated-measures ANOVA revealed no significant main effect for image (Wilks’ λ = .998), F(1, 23) = 0.04, p = .839, (η2 = .013); or SOA (Wilks’ λ = 1.00), F(1, 23) = 0.00, p = .983, (η2 = .000). Further, there was no significant interaction between image and SOA (Wilks’ λ = .992), F(1, 23) = 0.18, p = .680, (η2 = .008). These results indicate that there was no difference in IOR to the thin-ideal and control images at either SOA in the High group.
Discussion
The current study used an IOR task to investigate disengagement of attention from shape and weight stimuli in individuals with high and low levels of shape/weight-based self-worth. With regard to processing nonthin images, the High and Low groups displayed significant differences in IOR. Firstly, individuals in the High group showed a trend (p = .065) toward less IOR for the nonthin body images than the Low group. This difference in IOR was specific to the nonthin body images, suggesting that individuals who base their self-worth heavily on their shape and weight may have more difficulty disengaging attention from nonthin body images compared to individuals who do not base their self-worth on their body shape/weight. This tendency to maintain their attention on, or return their attention to, nonthin body images could play a role in these individuals becoming preoccupied with weight gain and having difficulty attending to other information in their environment. This is consistent with Vitousek and Orimoto’s (1993) claim that individuals who possess a shape and weight self-worth schema preferentially process schema relevant information, which serves to maintain their concerns about their body weight and shape. Despite this interesting finding, it must be noted that this result did not reach significance and, therefore, would require replication to confirm.
The second main result for the nonthin images was that individuals in the Low group displayed increased IOR (i.e., increased disengagement of attention) regarding nonthin body images compared with the control images. This pattern of increased disengagement from the nonthin body images, in comparison with the control images, was not present in the High group. This suggests that individuals who do not invest their self-worth in their shape/weight may have a protective mechanism against the ongoing attentional processing of nonthin images, which may serve to minimize their risk of becoming preoccupied with concerns regarding weight gain. Because the High group did not display this potential protective factor, they may be at increased risk of overprocessing images depicting weight concerns, given an environment saturated with such imagery.
The finding that individuals with low levels of shape/weight-based self-worth display an increased IOR for nonthin body images is consistent with research investigating IOR in anxiety. Specifically, Waters, Nitz, Craske, and Johnson (2007) found that individuals with low levels of trait anxiety displayed an increase in IOR toward aversive, compared with neutral and pleasant, images. They suggested that this was due to individuals low in trait anxiety inhibiting excessive attention of unpleasant material. This differential pattern was not found in the high trait anxiety group, suggesting that they had difficulty inhibiting ongoing processing of such material.
With regard to the thin-ideal body images, individuals in the Low group displayed a trend (p = .072) toward increased IOR (i.e., increased disengagement) from the thin-ideal body images compared with the control images, at least for longer SOAs (1,800 ms). This is suggestive of a pattern similar to that found for the nonthin images whereby the Low group exhibited evidence of a protective mechanism that inhibits attention from returning to thin-ideal body images. However, there was only a trend for this tendency toward increased attentional disengagement from the thin-ideal body images compared with the control images such that some caution is needed in interpreting this result.
The present study extends the research demonstrating biases in attentional maintenance to disorder-relevant stimuli in other clinical populations (Dai & Feng, 2009; Koster, De Raedt, Goeleven, Franck, & Crombez, 2005; Pérez-Dueñas, Acosta, & Lupiáñez, 2009; Verkuil, Brosschot, Putman, & Thayer, 2009) to demonstrate differences in attentional disengagement to body images in individuals with high and low levels of shape/weight-based self-worth. Only one previous study has utilized the IOR in an eating disorder context (Gao et al., 2013). In that study, it was found that individuals with elevated weight dissatisfaction had reduced disengagement from images depicting larger physiques. That finding accords with the results of the current study whereby individuals in the High group displayed reduced disengagement from nonthin ideal body images. In addition, Gao et al. (2013) found that elevated body dissatisfaction was related to reduced disengagement from images depicting thin bodies at shorter SOAs (760 ms), which they proposed would function to intensify shape/weight concerns. In the present study, the Low group manifested increased disengagement from thin-ideal images, which could serve to protect them from shape/weight concerns. Thus, the findings across the two studies are comparable, with Gao et al. (2013) suggesting the presence of a pathological factor in the high body dissatisfaction group and the present study suggesting the presence of a protective factor in the low shape/weight-based self-worth group.
The current study had a number of strengths including its use of the widely used and robust IOR paradigm to assess a largely unexplored component of attention in this population, that is, the disengagement of attention. By assessing a single component of attention, our research represents an important and significant extension to the current literature which has focused on attentional biases in the initial capture of attention. Another strength of the study was its investigation of differences in attentional bias in individuals with differing levels of shape/weight-based self-worth. While this construct has been neglected in previous research, which has largely focused on body dissatisfaction, it is proposed to be the core psychopathology of eating disorders and is a key maintenance factor contributing to eating disorder symptoms.
Despite these strengths, the current findings need to be interpreted in the light of a number of methodological limitations. Firstly, the small sample size would have limited the study’s power, which may have contributed to the fact that several findings only entailed a trend toward significance (i.e., the High group showing less IOR to the nonthin body images than the Low group, and the Low group displaying increased IOR for the thin-ideal body images compared with the control images at 1,800 SOA). As such, it would be of benefit to replicate the study in a larger sample of young women as well as extending the study to diverse populations such as males (especially given the emerging evidence of parity in body image concerns among males and females; McCabe & Ricciardelli, 2004; Murray et al., 2012) and different ethnicities. Secondly, a community sample was utilized. While this provides insight into the possible attentional biases in individuals with elevated levels of shape/weight-based self-worth, care should be taken when extrapolating from these results to individuals with eating disorders, given the research indicating differential patterns of attention in those with clinical levels of eating disorder symptomatology versus those at risk for eating disorders (e.g., Rieger et al., 1998). Employing the current paradigm with a sample of individuals diagnosed with an eating disorder is, therefore, warranted. Thirdly, shape/weight-based self-worth is highly correlated with other aspects of eating disorder symptomatology (Cooper, 1997; Fairburn & Harrison, 2003) and general psychopathology (e.g., anxiety and depression) and, therefore, these factors may have also contributed to the current group differences (Thompson, Heinberg, Altabe, & Tantleff-Dunn, 1999). Finally, cognitive models of eating disorders propose that attentional biases stem from dysfunctional schema about shape and weight, yet the EDE-Q is not a direct measure of this schema. Future research investigating differences in attention in individuals with varying levels of this schema would benefit from considering alternative, more direct schema measures, such as the eating disorder version of the sentence completion task (Rawal, Park, & Williams, 2010).
In summary, the present findings suggest that healthy individuals possess a protective mechanism that inhibits the overprocessing of nonthin and thin-ideal body information. The reduction, or absence, of this protective mechanism in those with higher shape/weight-based self-worth may pose a risk factor in the development of eating disorder pathology.
Footnotes
Authors’ note
The research was conducted at the Australian National University.
Declaration of conflicting interests
The author(s) declared no potential conflicts of interest with respect to the research, authorship, and/or publication of this article.
Funding
The author(s) disclosed receipt of the following financial support for the research, authorship, and/or publication of this article: This research was supported by an Australian Government Research Training Program (RTP) Scholarship but did not receive any specific grant from funding agencies in the public, commercial, or non-for-profit sectors.