
Abstract
The sudden outbreak of COVID-19 has forced teachers at all levels to adjust their teaching styles. Nearly every instructor is teaching in ways that are entirely new (at least to them). Online methods have jumped suddenly from à la carte options to essential components of instructional delivery at all levels from pre-kindergarten to higher education. There is a limit to the relevance of current education research literature for the unprecedented move to online learning precisely because it is unparalleled. However, with thoughtful planning and only a modest increase in effort, teachers working in these unprecedented situations can extend the lessons learned from this quantitative study to benefit their own student populations. The research presented will show the effectiveness of an instructor-created video segment to support student learning outcomes in an asynchronous online, graduate-level K-6 mathematics teaching methods course.
Keywords
Introduction
Online learning has evolved from its early roots grounded in niche programs. Even before the COVID-19 pandemic of 2020, the academy had witnessed a growing and widespread interest in online programming (O’Connor, 2014). Colleges and universities have embraced online learning as they compete to attract students and provide a more diverse array of subject matter. Notably, in the most recent 2018 data reported by National Center of Educational Statistics, the number of students enrolled in at least one online class has grown to 35.3% of the overall postsecondary population, totaling nearly 7 million students (NCES, 2018).
Institutions of higher learning have invested billions of dollars in technology infrastructure, including computers, network capacity, and learning management systems (LMS) in response to online learning. While each LMS (e.g. Blackboard, BrightSpace, Canvas, Moodle) offers a host of integrated and embedded instructional tools, it is not at all clear which are effective at communicating specific facts, concepts, and practices that inform effective teaching. The instructor is confronted with mixed perceptions related to the effectiveness of online learning in the literature, instructional delivery methods used in online learning, and evolving LMS platforms. Lurking behind them all is the practical question “What works?”. As Mishra and Koehler state, “Part of the problem, we argue, has been a tendency to only look at the technology and not how it is used. Merely introducing technology to the educational process is not enough” (2006: p. 1018).
While colleges and universities have no choice but to invest heavily in integration technology and their institution’s selected learning management system, investment in faculty professional development and training has not always kept pace (Venkatesh et al., 2016). Studies have shown that faculty often must fend for themselves to make implementation and instructional decisions (Nilson and Goodson, 2018). Faculty are often under-equipped with the tools necessary to implement tangible, evidence-based practices in online learning platforms, or they may be given a bewildering array of alternatives with no guidance how to choose among them. As a result, students may not receive the resources necessary for optimal online learning outcomes. Similarly, it has been observed that while learning management systems provide a host of technological capabilities, such tools often are “not fully exploited to the learner’s advantage” (Kishore et al., 2009: p. 401). Similarly, Koh (2020) commented that university faculty lack the necessary skills to effectively implement technology in instruction.
It is no surprise, then, that many faculty members remain skeptical despite the steadily growing popularity of online courses. Miller observed that “there is deep-seated ambivalence among faculty about online teaching and learning, and for faculty to be maximally effective online, this ambivalence has to be addressed” (2016: p. 20). A large proportion of college and university faculty are engaged in online instruction, but Allen (2011) found that about 70% consider it an inferior approach.
It is understandable that teachers who may have 25 years of experience in traditional classroom settings would have difficulty envisioning how to retool their courses for online delivery (Harasim et al., 1995). Even in the early days of online learning, Anderson pointed out that “it is not enough to simply take a traditional course and attempt to convert the content to a different delivery mechanism” (1998: p. 383). In a related sense, Ertmer (2005) and Park et al. (2008) stated that technology will only be used when its use aligns with instructors’ existing views of knowledge acquisition and learning. Since training with technology focuses solely on the technology itself (also known as technocentricity), there is little in the educational training and literature related to effective uses of instructional and online technologies (Avci, et al., 2019; Wang 2020).
The COVID-19 pandemic brought into sharp focus the need to better understand online learning. It is estimated that over 1.6 billion students were interrupted during the Spring 2020 semester alone (Dorn, et al., 2020). Innovations for online delivery that would have previously taken months, if not years, of careful development had to be implemented in a matter of days. Subsequently, many instructors teaching traditional face-to-face courses struggled to conceive of an effective classroom in cyberspace. Institutional infrastructure was stressed by this unforeseen increase in demand. The pandemic posed entirely new challenges for all stakeholders involved in providing or receiving education.
Online learning has been catapulted into widespread use, yet many questions related to best practices for online teaching and learning still linger. Many faculty members remain skeptical about the utility of online learning despite research positing the merits of student learning in online environments (e.g. Christmann, 2017). As the research literature has predicted, the tide of online learning has overwhelmed longstanding teaching practices (Kolb, 2020). Courses of study not designed for online learning must be retooled. This paper contends that a mindset of continuous improvement based on quantitative data can be used to support actionable best practices for online learning. While “eating the elephant” of adapting courses online can seem overwhelming, practical improvements can support the conceptualization of effective online instruction. These improvements also offer students supportive channels to engage in course content.
We turn now to illustrate these ideas with practical example. We start by focusing on the context: the specialized knowledge for teaching, our virtual classroom setting, the material being taught, how students are assessed, and the practical innovation under study.
Specialized knowledge for teaching
The scholarship of Lee S. Schulman provided the backdrop for over three centuries of research in education. Schulman’s work also has deep roots to the very nature of enacting impactful online instructional practices (Kaden, 2020). Schulman contended that there are particular skills required to effectively teach. His contention stood in stark contrast to an era of teacher preparation standards that focused on “silver bullet” teaching practices. Schulman contended that a one-size-fits-all approach to effective teaching strategies minimized the professional aspects of teaching down to flabby classroom management techniques and general teaching tips (Shulman, 1986). In other words, Shulman contended there is a praxis that unifies effective teaching grounded in a rich understanding of the mathematical content contained in the learning sequence and a knowledge of the students that culminates into what he identified as pedagogical content knowledge (Shulman, 1987b).
Schulman argued that teachers must hold a foundational knowledge base separate from the knowledge of the content itself. He described this knowledge base as “a codified or codifiable aggregation of knowledge, skills, understanding, and technology...as well as a means for representing and communicating it” (Shulman, 1987a: p. 4). Schulman witnessed the challenge and struggle of many preservice and in-service teachers, noting marked differences between their more competent peers. He observed: The actions of both policymakers and teacher educators in the past have been consistent with the formulation that teaching requires basic skills, content knowledge, and general pedagogical skills…In this manner, I would argue, teaching is trivialized, its complexities ignored, and its demands diminished. (1987a, p. 6)
Thus, teaching necessarily starts with the notion that preservice teachers must have experiences that support student learning. In order to carry out effective teaching, the teacher assumes the role of an artesian. To this end, classroom learning experiences remain in an important balance between both content presentation and instructional practice. Knowledge of pedagogy (how to teach) and content knowledge (what to teach) are married in specific and exacting ways specific to teachers. Shulman added significantly to the juxtaposition of content and pedagogy, defining areas that detail the knowledge required for effective teaching: • content knowledge; • general pedagogical knowledge, with special reference to those broad principles and strategies of classroom management and organization that appear to transcend subject matter; • curriculum knowledge, with particular grasp of the materials and programs that serve as “tools of the trade” for teachers; • pedagogical content knowledge, that special amalgam of content and pedagogy that is uniquely the province of teachers, their own special form of professional understanding; • knowledge of learners and their characteristics; • knowledge of educational contexts, ranging from the workings of the group or classroom, the governance and financing of school districts, to the character of communities and cultures; and • knowledge of educational ends, purposes, and values, and their philosophical and historical grounds. (1987a, p. 8)
Teaching is, therefore, a delicate balance between: • subject matter content, • conceptual organization of content, • fundamental enactment of inquiry that orchestrates students' experiences, • (mis)understandings, and • Student engagement with the material.
Beyond robust experiences with content knowledge grounded in sound pedagogical practices, it is essential for preservice teachers to have active experiences in lesson development. Formative experiences include lesson planning to support the development of student understanding. It is also important for preservice teachers to discern individual differences among students. Flexible and responsive methods to present and represent content must be deployed (e.g. Danielson, 2009). Within the scope of preservice and in-service teaching and learning literature, Schulman’s seminal works provide a strong foundation for this study by framing the importance of planning lessons focusing on the intersection of content and pedagogy that uniquely captures the professional skills that define effective teaching (Hill et al., 2008).
Synchronous versus asynchronous learning
Since online learning now has a firm foothold at institutions across the nation and around the world, it is not surprising that it has been implemented in many different ways to achieve quite different goals. Synchronous and asynchronous learning are one important delineation. In the synchronous tradition, students are virtually connected to live learning materials, for example “attending” online a live class with an instructor and fellow students. Synchronous learning environment shares many common features with a face-to-face classroom: learning takes place in real time with interactions between students and the instructor. Yet, the overwhelming majority of online learning in higher education is asynchronous (Garone et al., 2019), in which students are typically provided with assignments largely through LMSs. Information is often provided in text form, often with little variation (Darby, 2019). Written communication accomplishes managerial and instructional tasks such as information about readings, assignments, and upcoming assessments. Asynchronous online learning platforms pose fewer demands on technology infrastructure compared with synchronous learning, but students often experience a lack of connectedness to the environment. Disconnected from their instructor and unable to interact with fellow students, much of the depth and richness of education can be lost through the asynchronous model (Rodrigues, 2020). Studies have found that many online class environments are largely reduced to written correspondence, where information is shared and uploaded in various forms of communication between the instructor and students (e.g. Li et al., 2019). Of particular importance to this study, research conducted by Afolabi and Akerele (2012) indicate that using a single medium for instructional delivery can be improved by using multiple mediums.
In light of this, the online classroom in our case study employs a hybrid model with both synchronous and asynchronous components. Live web meetings are coupled with course discussion board prompts and learning materials to offer students real-time interactions, perhaps more varied but less frequent compared with a purely synchronous approach.
Interactive-Constructive-Active-Passive framework
The innovation for this research study was conceived in light of the Interactive-Constructive-Active-Passive (ICAP) Framework for technology-based instruction implementation. The ICAP Framework suggests learning media that place the student in a passive stance (e.g. reading text) will be less effective compared with media that is engaging and diverse (Zhang et al., 2016). These researchers point out that “When learners are actively (emphasis by authors) engaged with the learning materials, they will engage in forms of overt physical activities, such as selecting from a variety of choices, repeating the lecture content, or pausing, fast-forwarding, or rewinding the video (Zhang et al., 2016: p. 888).” While literature does not conclusively show that the ICAP framework improves outcomes when applied to online instruction, it is strongly supportive (Saubern et al., 2020).
Online teacher education
For quite some time, online learning has been a major player in departments and colleges offering graduate programs in education. Dating back decades, stand-alone graduate programs targeting upwardly mobile-minded candidates have proven to be a deep financial well for many institutions of higher learning (Allen, 2011). More recently, individuals in some states have had the ability to acquire their initial teaching certification through entirely online programs, with field-based and student teaching supervision taking place through distance-based supervision. This impressive growth in online programs has happened in spite of a lack of empirical evidence demonstrating their effectiveness when applied to teacher preparation and education programs (Mitchell and Romero, 2010).
For the online teacher preparation program presented in this paper, what online instructional strategies delivered through the LMS infrastructure promote a learning experience consistent with sound teacher education standards (e.g. CAEP, 2013)? How do we gain age- and content-appropriate insights concerning instructional delivery methods, and how can we communicate those insights to future teachers? Specifically, we report on a graduate course in education required for teacher certification. In this paper, we apply the recommendations in Nilson and Goodson (2018) to construct a video within our LMS. Does this embedded video yield a measurable difference in the learning outcome of our students, future elementary and middle level teachers? Specifically, does the embedded course video enable these novice educators to design better mathematics lesson plans?
Methods
Subjects
The subjects were 230 graduate students enrolled at a large, private comprehensive university with a wide offering of fully online undergraduate and graduate degree programs. All subjects were students in the School of Education, enrolled in the same course on K-6 mathematics teaching methods. Approximately 95% of the subjects were seeking initial certification in the areas of elementary education and special education. This course is compulsory for graduate students seeking initial teacher licensure in these certification areas. The remaining 5% of subjects were seeking a graduate degree within the field of education but were not explicitly seeking initial teacher certification.
Class description, teaching Methods, and intervention
The course was taught in one quarter consisting of 8 weeks. Since demand for the course was high, it was taught in successive quarters and with multiple sections of students in each quarter. This paper reports results for all sections taught between Fall 2019 and Summer 2020. As part of the course requirements, each student was required to complete two mathematics lesson plans reflecting K-6 mathematics content, designed around state and national mathematics standards. Students were required to utilize the required lesson plan template published in the course shell of the LMS. The first lesson plan, Lesson 1, was assigned in week 3 after the instructor fully explained requirements and best practices. Lesson 1 was due in week 4. The instructor provided individual written feedback to each student on their first lesson plan. Each student then wrote a second lesson plan, Lesson 2, which was due in week 6. Each lesson plan was uploaded to the LMS as a document file.
Starting in the third quarter of 2020, an instructor-created video segment was introduced to reinforce best practices and assignment instructions in the development of the lesson plans. The video was approximately 20 min in length and was created using a PC and screencast software. The video included the instructor explaining the learning outcomes, template, and grading rubric for the lesson plan assignment. The video was provided prior to students preparing Lesson 1. When the instructor made constructive written comments to each student on their Lesson 1, he referred them to the relevant segments of the video to consider as they prepared Lesson 2. This video is the intervention.
Since the intervention was started mid-way through the data series, the case study may be viewed as a retrospective observational study to assess whether the video segment was effective, and if so, for which students. Our “control group” is the first 7 Sections that did not have access to the video, and our “treatment group” is the remaining 4 Sections that did. All data were collected in the process of teaching the course and providing student evaluations. The observational study amounts to looking carefully at what we can learn from the experience of teaching these 230 students.
Quantitative Measurement
An analytic rubric was used to evaluate each lesson plan according to elements contained within the National Council of Teachers of Mathematics (NCTM) Standards for Teacher Preparation (NCTM, 2012). The analytic rubric included 11 components for the evaluation of each lesson plan: 1. State and National Standards 2. Instructional Objectives 3. Lesson Considerations 4. Teaching Materials 5. Lesson Introduction 6. Learning Activities 7. Lesson Closure 8. Lesson Extension 9. Evidence of Formative Assessment 10. Utilizing Knowledge of Students 11. Technology Integration
The evaluation of each lesson plan occurred within the LMS, where an embedded analytic rubric was displayed beside the submitted lesson plan. Corresponding descriptions accompanying each of the 33 total categories (11 elements across 3 rating levels) provided detailed language to assess the lesson plan document. Each of the 11 lesson plan elements was evaluated on a 10-point scale (target = 10, acceptable = 5, unacceptable = 0). Thus, the instrument yielded a score between 0 and 110 for each lesson plan.
Null hypothesis
Students with access to the online video will have no measurable systematic differences in outcome when compared with those who did not have access to the video. Outcome here means their score on Lesson 1 and Lesson 2.
Controlling variation in lesson plan score
Multiple strategies were used to control variability in scores. Sources of variation that differ between control and treatment groups could lead to differences between treatment and control groups not due to the intervention. Random variability could prevent genuine treatment effects from reaching statistical significance.
First, treatment and control groups were as comparable as possible. Both the control and treatment groups in the K-6 mathematics methods class were taught by the same course instructor utilizing the exact same learning materials, assignments, and assessments. Students in each section within this study were provided the exact same lesson plan template, written lesson plan instructions, and lesson plan rubric. Each of these documents were contained electronically within the LMS for the students to view and utilize.
Second, as noted above an objective quantitative instrument was defined to assess the lesson plans. Use of an objective instrument is an important means to control variation between observers, or even drift in the same observer’s assessments over time. In this study a single observer (the instructor) did all evaluations. Additional benefits of an objective scoring instrument include clear communication to students of the important components of a lesson plan and, not least, reduced evaluation time for the busy instructor with many students.
Third, as every experienced teacher knows, there are often substantial differences between sections, with some sections having many particularly strong students and other sections many weaker students. Since treatment was assigned to entire sections, not to students individually, the statistical analysis modeled two levels of variation: variation between sections and variation between students in the same section. If both levels of variation are not taken into account, statistical analysis can yield misleading p-values (e.g. Flora 2018).
Results
The data consisted of seven control and four treatment Sections with a total of 230 students. Four students did not submit any Lesson plans, and an additional six submitted Lesson 1 but not Lesson 2. These 10 students (4%) were dropped from the analysis for simplicity. Omission of these students was not deemed to have much impact on generalization of results since there were few students and they were scattered evenly among the ten sections. 220 students remained for analysis.
The presentation of data begins with an assessment of Lesson 1. Figure 1 shows the mean for each Section plus or minus one standard error. Control Sections are in blue with circles for the mean, while Treatment Sections are in red with crosses. All four of the Treatment Sections have mean scores of at least 100, while six of the seven Control Sections have mean scores below 100. Overall, students in Treatment Sections scored 4.6 points higher on average compared with students in Control Sections, and this difference was statistically significant (F(1,209)=12.85, p < 0.001) using analysis of variance that allowed for both variation between sections and variation between students within sections. The average variation between students, the root mean square error, was 9.2. Variation between sections was not measurably larger than zero (F(9,209)=0.91, p > 0.50). In other words, we did not observe that students in some Sections appeared stronger compared with students in other sections. As far as scores on Lesson Plan 1 are concerned, the students appeared randomly assigned to Sections. In summary, the video intervention was associated with an average increase of 4.6 points on Lesson Plan 1, about one step on the instrument. Lesson one mean plus or minus one standard error for each section.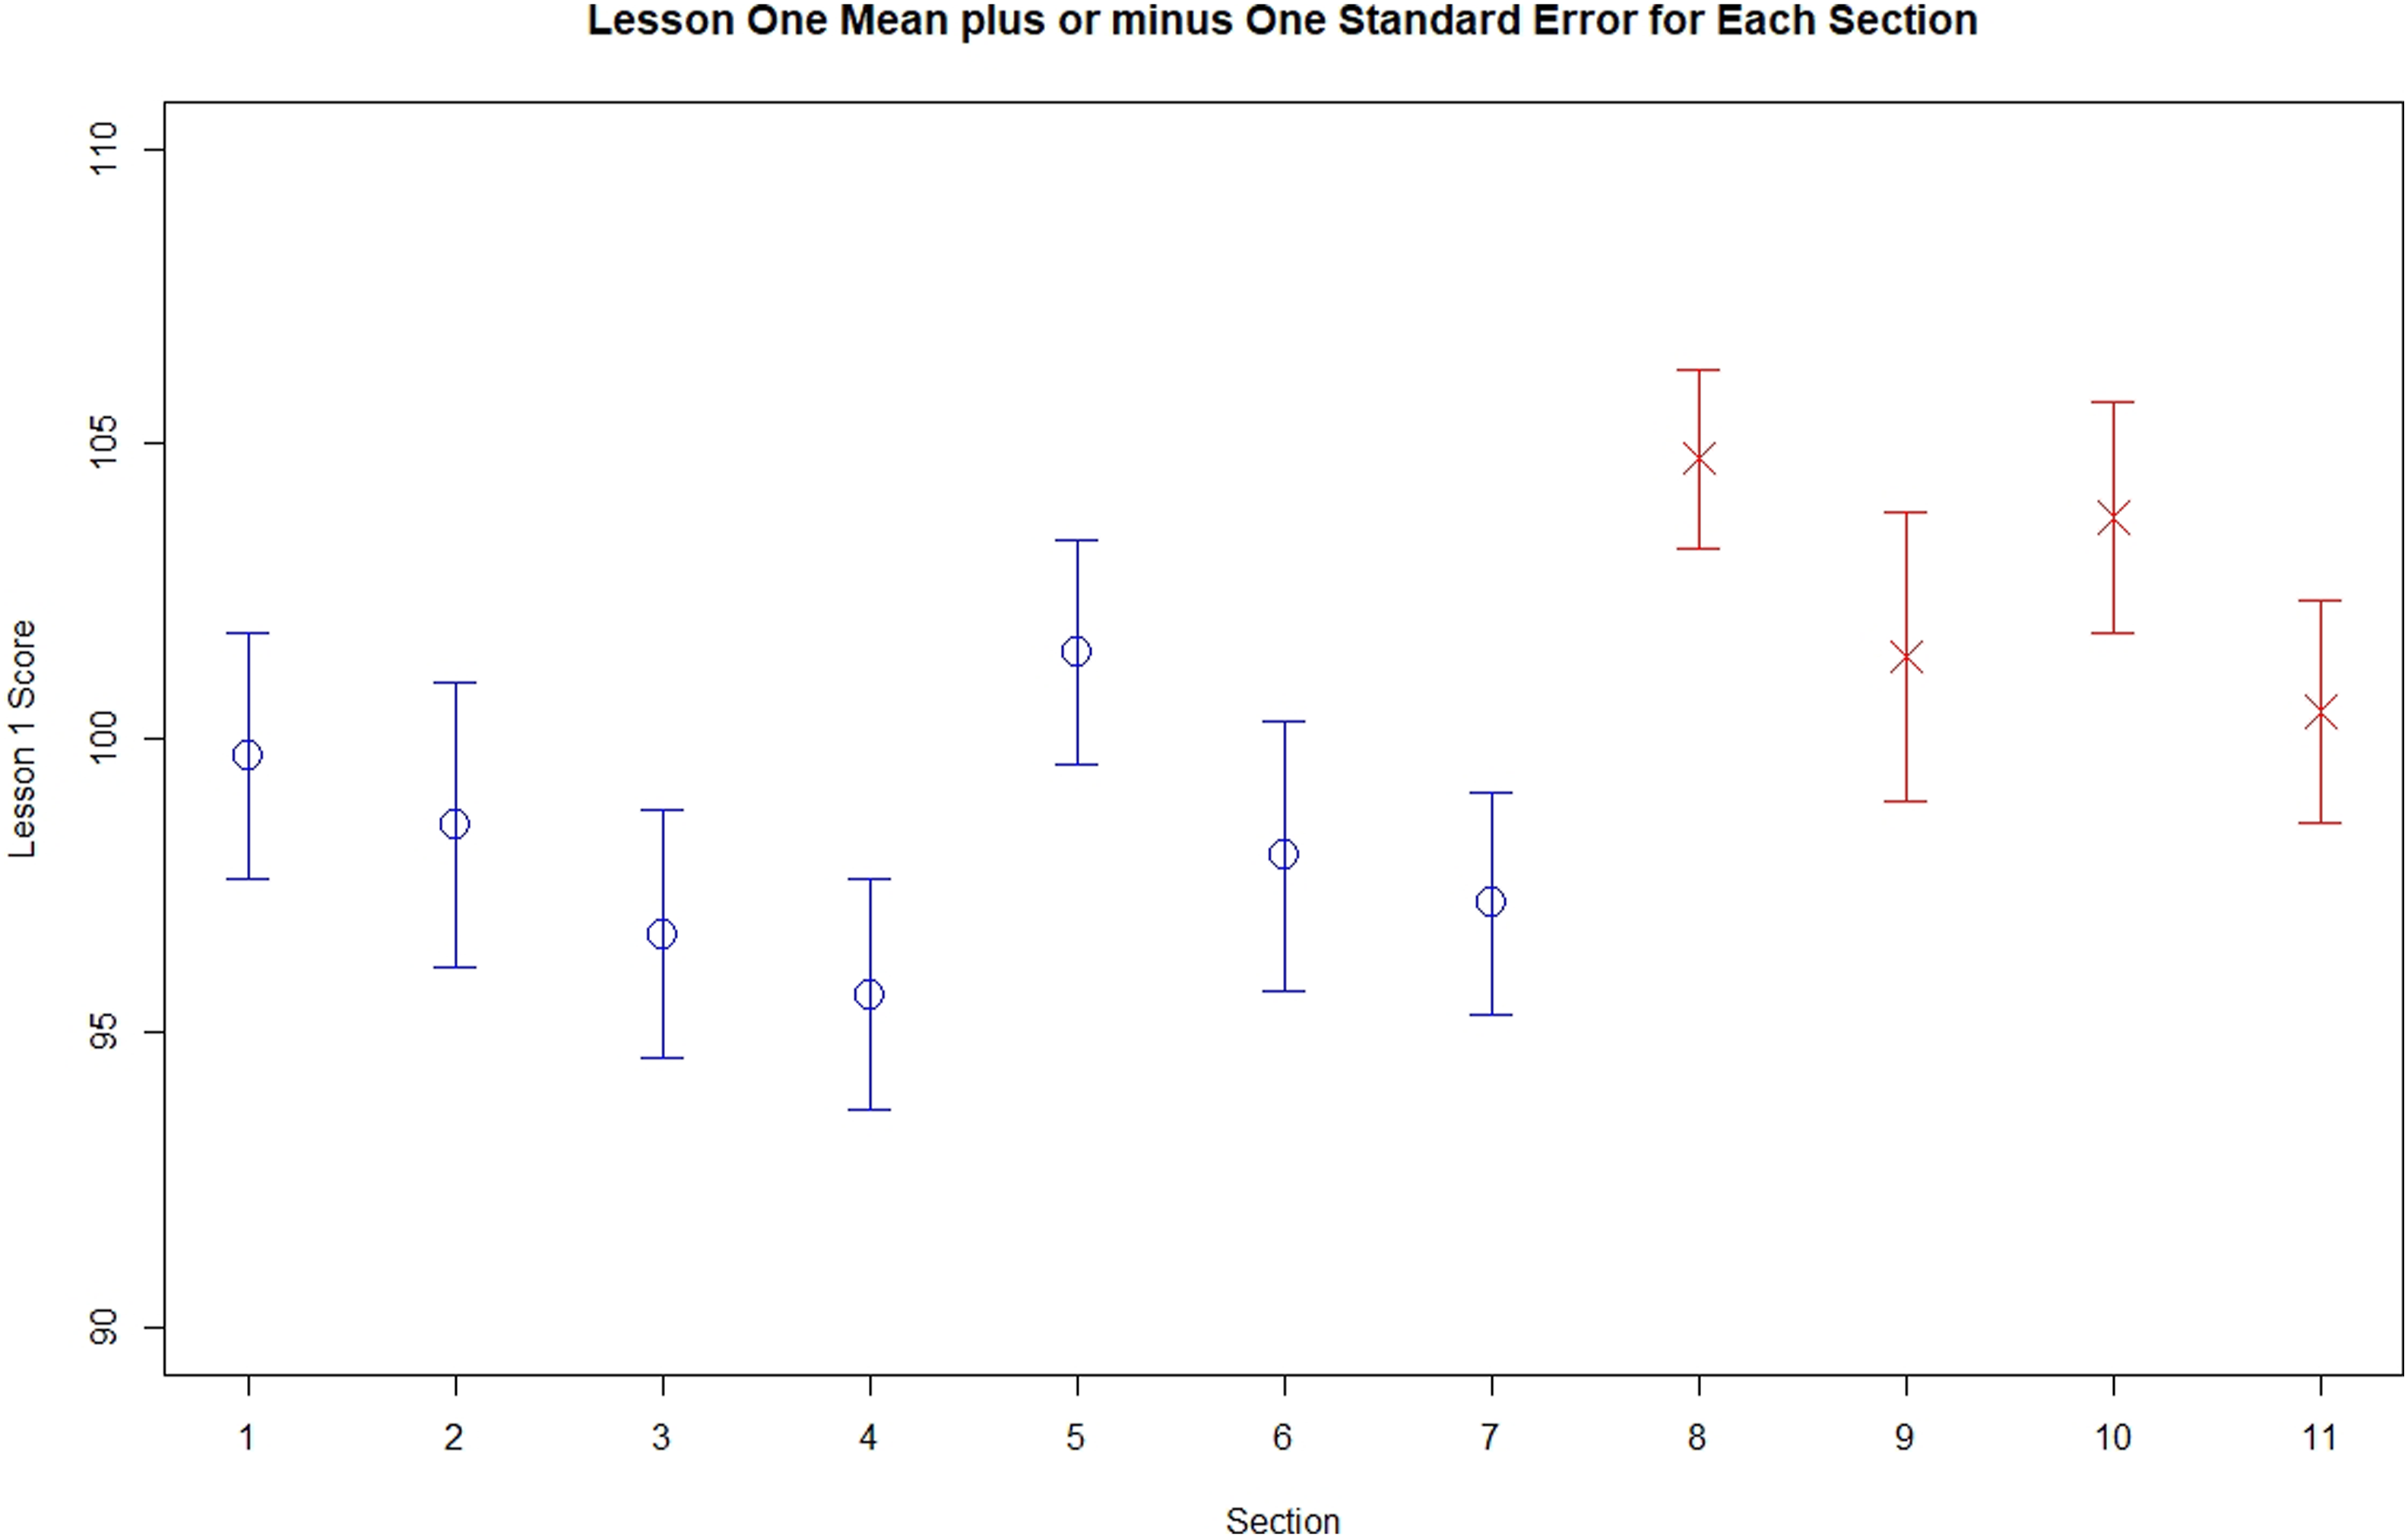
Figure 2 shows the corresponding data for Lesson 2. By comparing Figure 2 with Figure 1 we can see that all Sections tended to have improved scores on Lesson Plan 2. As an instructor would hope, students are doing better with practice. The standard error bars also appear smaller. In Figure 2 the difference between Control and Treated Sections appears larger, since every Treatment Section has mean score higher than any of the Control Sections. Using the same analysis of variance model from Lesson 1, students with access to the video scored statistically significantly higher compared with students from Control Sections (F(1,209)=27.6, p < 0.001). The difference averaged 6.1 points on Lesson Plan 2. Once again variation between Sections was not measurably greater than zero (F(9,209)=0.81, p > 0.50). Variation between students on Lesson Plan 2 was 8.3 as measured by root mean square error. Lesson two mean plus or minus one standard error for each section.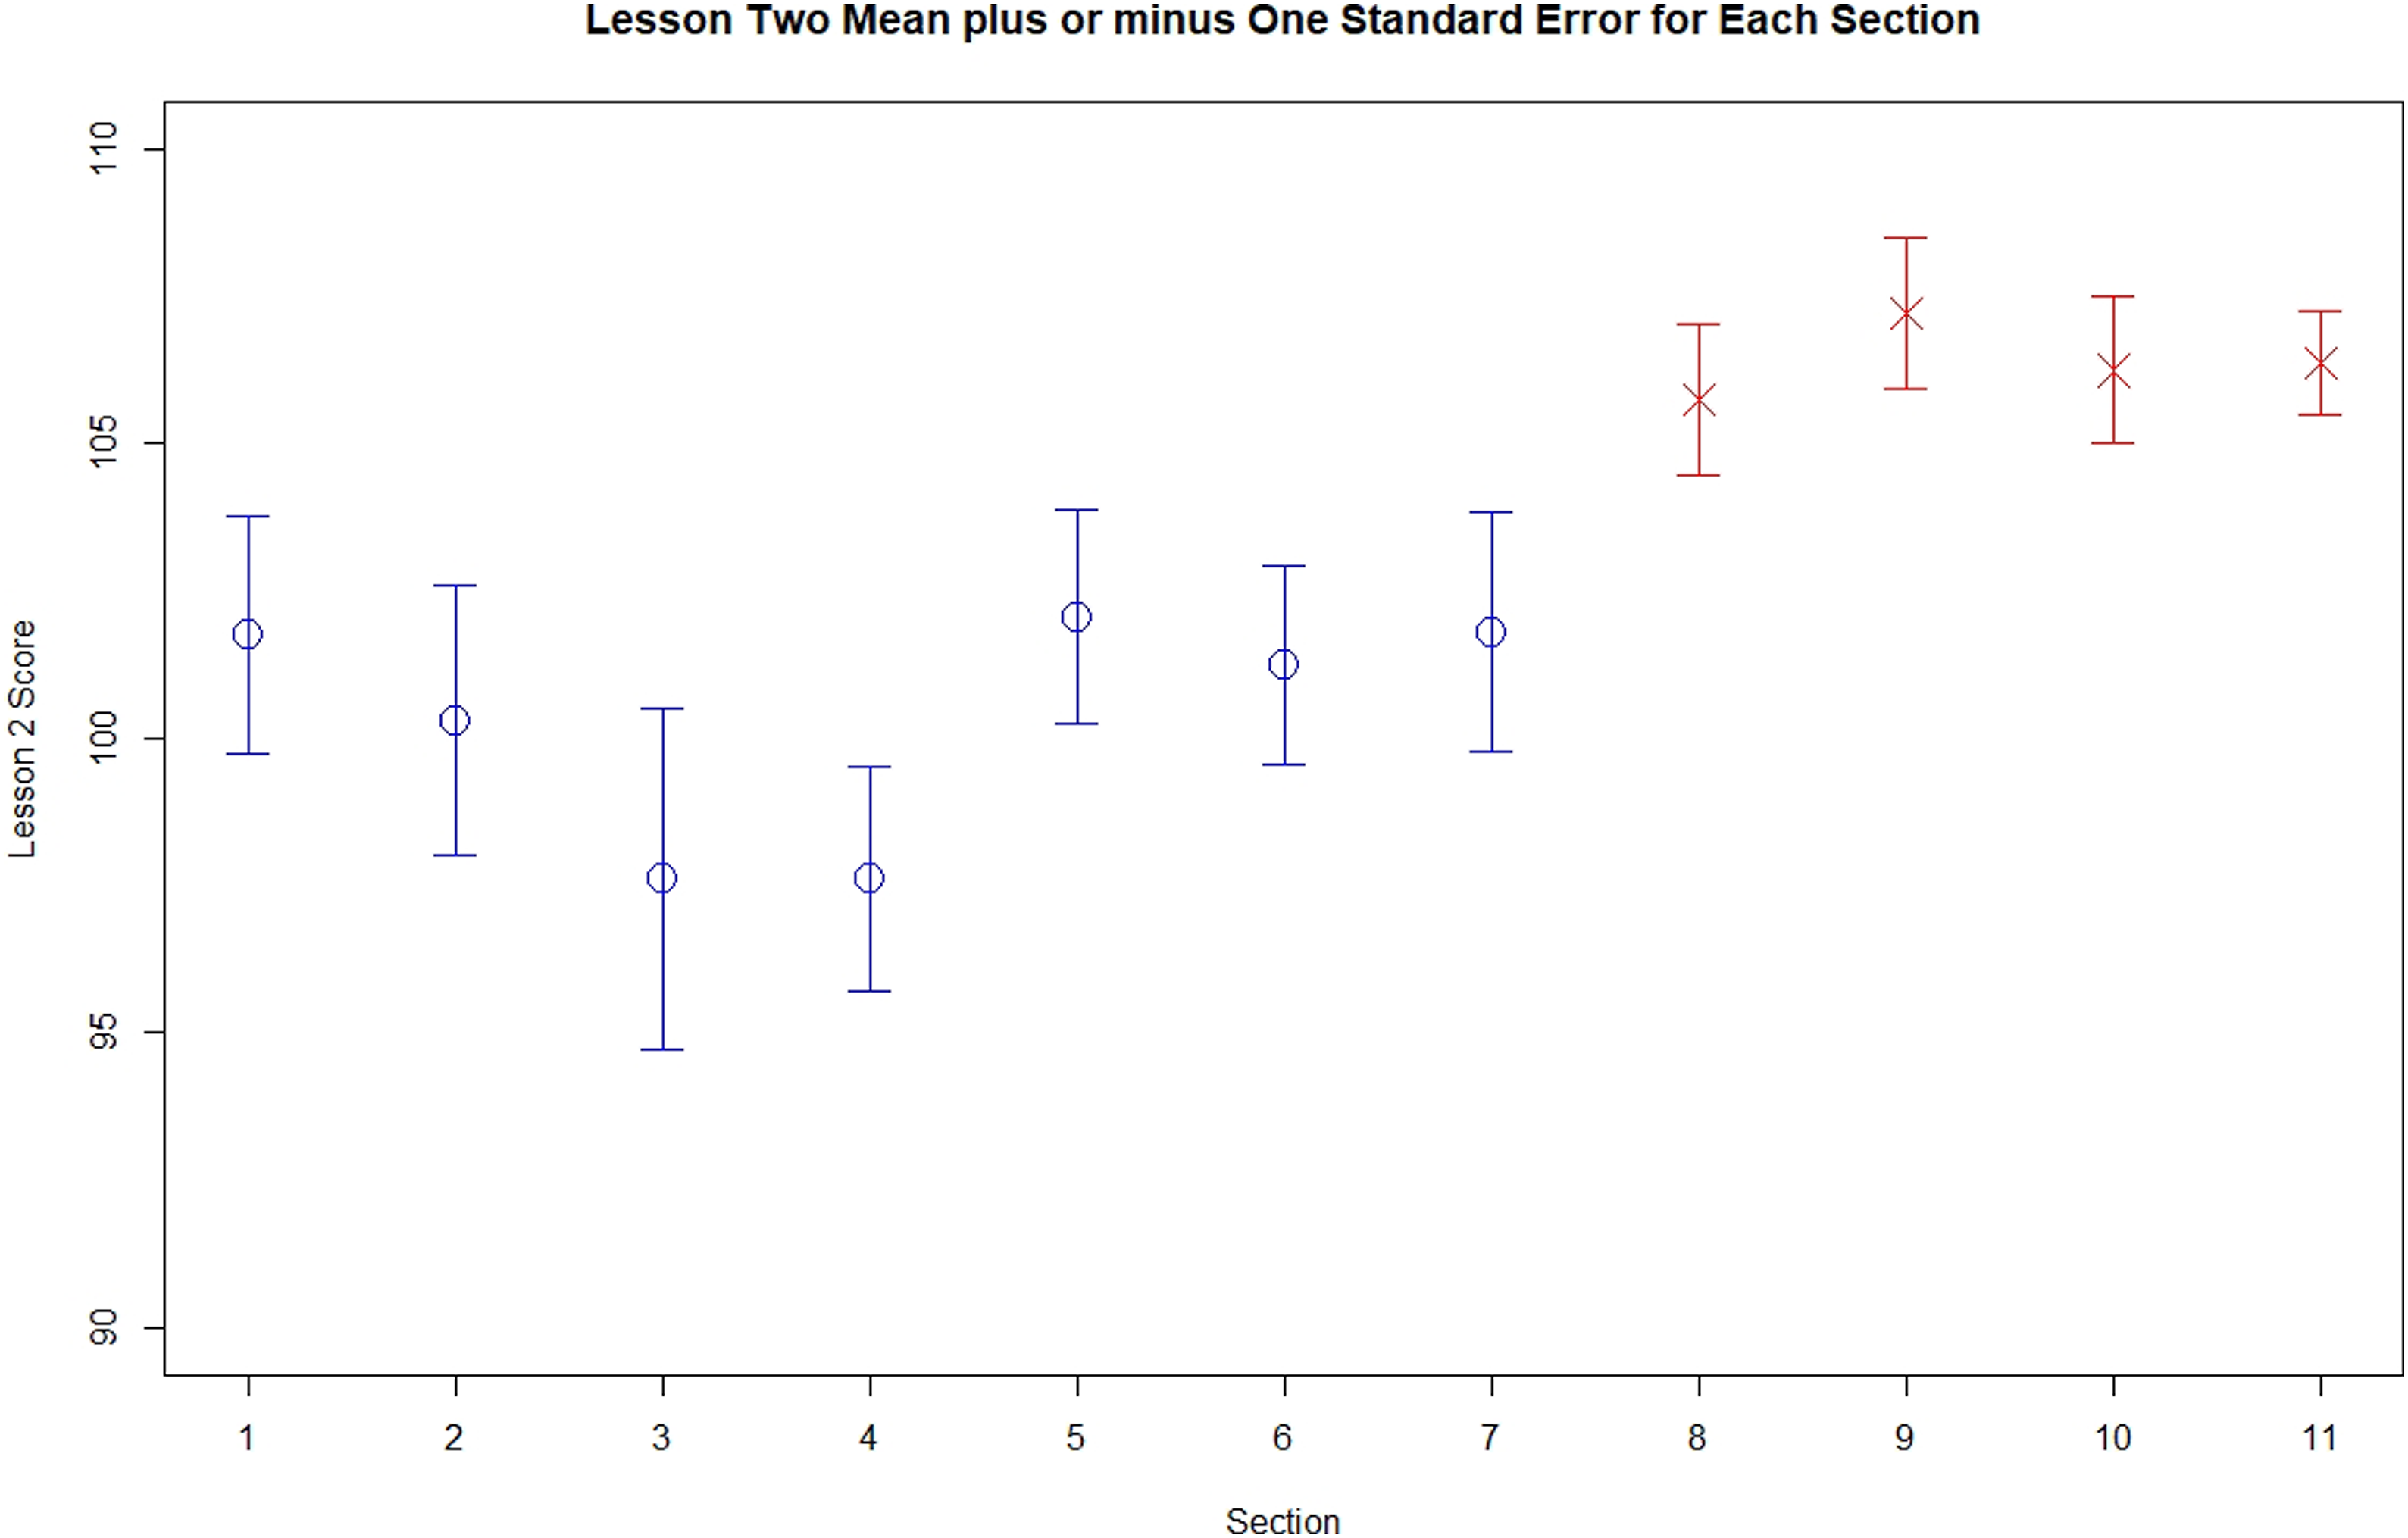
These results give an overall summary for each section, but they do not tell us whether some students benefited more from the intervention than others. To examine this question, we compared the Lesson 1 and Lesson 2 scores for each student. These are not “pre-test” and “post-test” scores since the intervention was applied prior to preparation of the Lesson 1 plan, but we can assess how Treatment Group students who struggled with Lesson Plan 1, for example, fared in comparison similar Control Group students.
Figure 3 shows for each student their Lesson Plan 1 score (horizontal axis) and Lesson Plan 2 score (vertical axis). Control students are plotted with a blue circle, while Treatment students are plotted with a red cross. (Since the score for each Lesson was defined in steps of 5 points, many students had the same pair of scores. To separate them out in Figure 3, a small random number was added to each score for display purposes only (points were “jittered” Cleveland, 1985: p. 161). A solid black vertical line at 110 shows the maximum Lesson Plan 1 score, and the solid black horizontal line at 110 the maximum Lesson Plan 2 score. Notice there is a cloud of both treatment and control symbols at the coordinate (110, 110). These are students with perfect scores on both Lesson Plan 1 and Lesson Plan 2. There is another solid black line going diagonally from (60, 60) to (110, 110). Points above this diagonal line indicate improvement from Lesson Plan 1 to Lesson Plan 2 score, while points below indicate students with a decrease in Lesson 2. The dashed red and dotted blue lines will be explained shortly. Student scores on lesson 1 and lesson 2.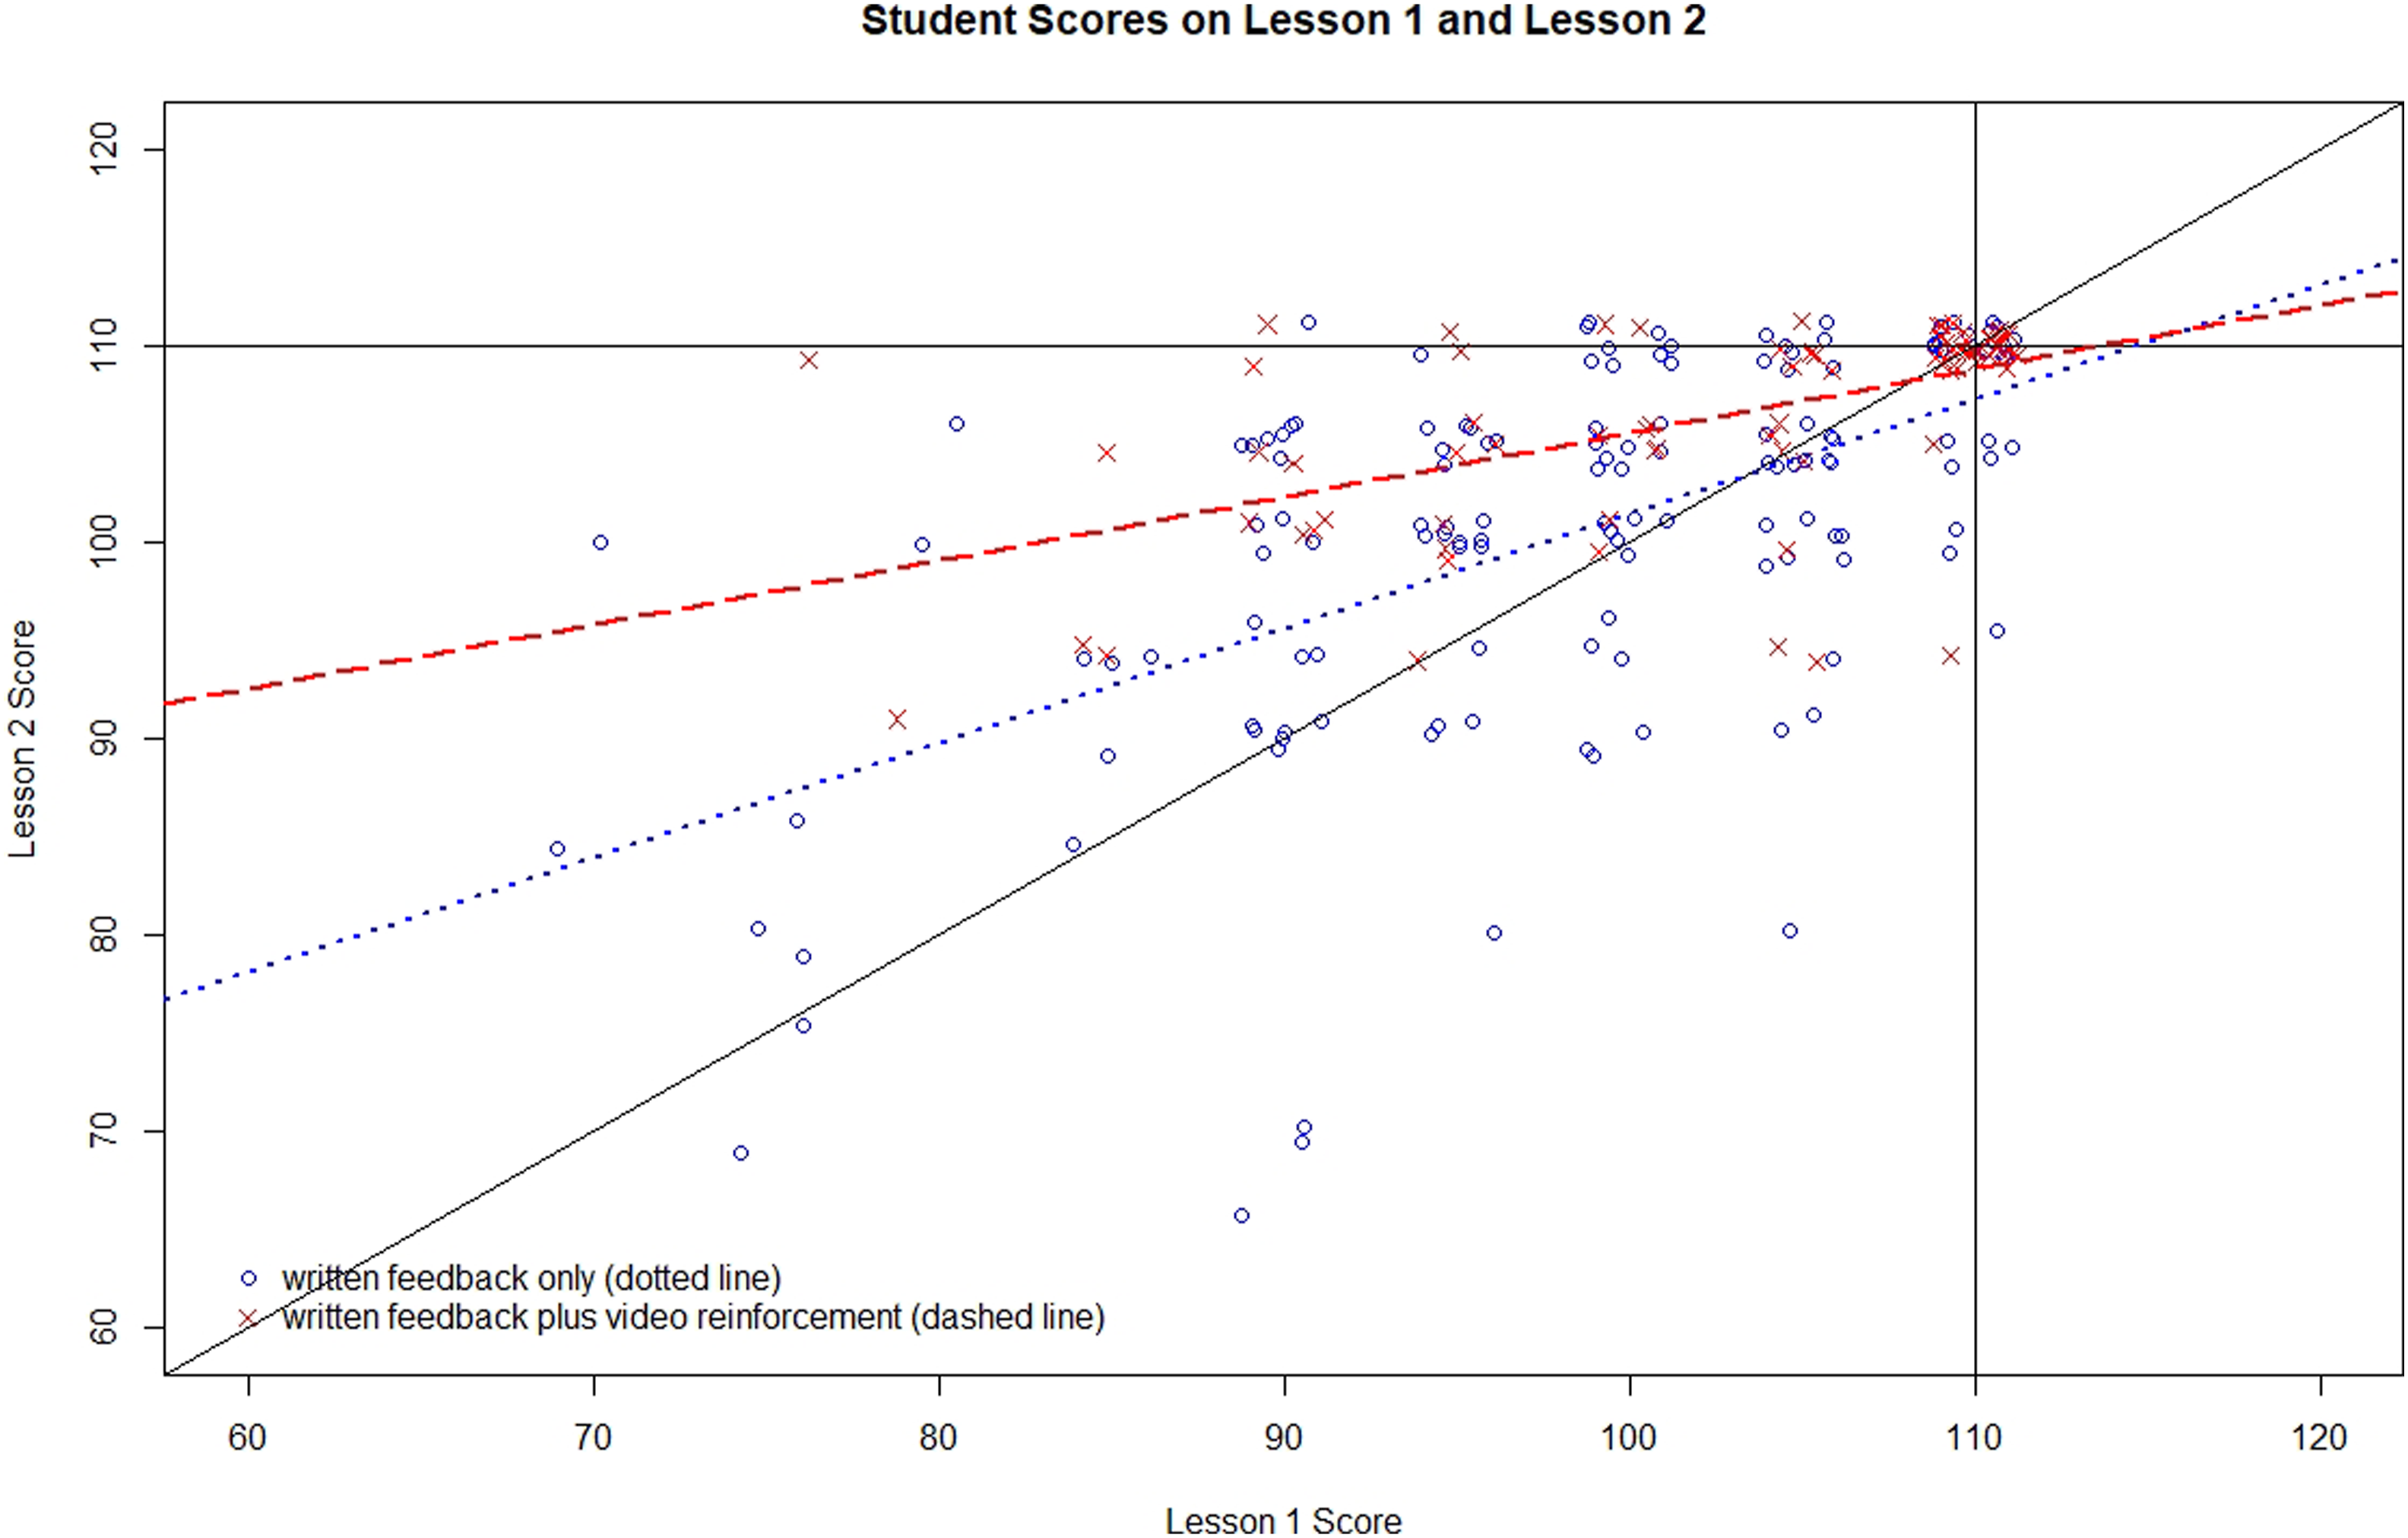
The goal is to measure the effect of the video intervention on Lesson Plan 2 after taking into account each student’s score on Lesson Plan 1. It is desirable to know whether the intervention had a similar effect for all students, or did stronger or weaker students experience more improvement? In other words, given a student’s score on Lesson Plan 1, what is the average improvement seen in Lesson Plan 2? This question can be modeled with an analysis of covariance model.
Before proceeding, we need to consider that there were 57 students with a perfect score on Lesson Plan 1 (26% of all students). These students appear in Figure 3 along the vertical black line at 110. Many of them also have a score of 110 on Lesson Plan 2, forming a cluster of points at coordinate (110, 110) on the graph. The “main treatment effect” in an analysis of covariance assumes a constant effect for every student in the treatment group. But this is impossible since a student with a perfect Lesson Plan 1 score cannot possibly show any further improvement. The measurement instrument has “maxed out”. So, we shall model our treatment effect in advance as having two components, a “main effect” and an “interaction effect” with Lesson Plan 1. What this means is that the size of the treatment effect is assumed to change depending on the initial Lesson Plan 1 score. What we are doing is fitting one straight line to Treatment subjects in Figure 3 (that is the red dashed line), and another straight line to Control subjects (that is the blue dotted line). For any score on Lesson Plan 1 on the horizontal-axis, the vertical difference between the dashed line and the dotted line is the estimated effect of the video intervention. Just as for earlier statistical analyses, the analysis of covariance model included terms to measure the amount of variation between-Sections, and variation between students within section. In the analysis of covariance “variation” means variability after accounting for each student’s score on Lesson Plan 1. It is important to remember that the “treatment effect” is now improvement in Lesson Plan 2 over and above the score in Lesson Plan 1, so any effect of the video intervention in Lesson Plan 1 has already been removed.
After taking into account Lesson Plan 1 score in the analysis of covariance model, variation between Sections in Lesson 2 was again estimated to be zero (F(9,207)=0.90, p = >0.50). Variability between students on Lesson Plan 2 score after adjustment for Lesson Plan 1 is now 6.7 points. Since all three analyses have shown no systematic variation between Sections, for simplicity we drop those terms from the analysis of covariance model (Flora 2018: p. 164) going forward.
Treatment effects for selected levels on lesson plan 1.
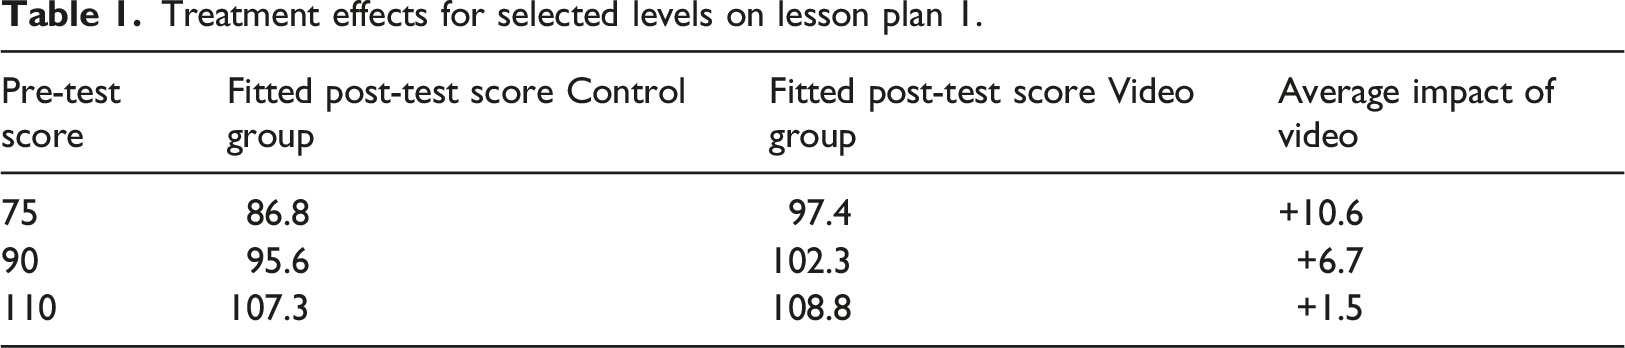
The Video intervention had a beneficial effect for weaker students, those starting out well below the perfect score of 110. Students with an initial level of 75 improved by about 10.6 points on average if they had access to the video. Intermediate students with an initial level of 90 improved by about 6.7 points on average.
One might be tempted to conclude from this analysis that the video provided hardly any benefit for those with a perfect score of 110 on Lesson Plan 1. This is, however, an artifact arising from our decision to model treatment effects with straight lines. As we noted before, many students in both control and treatment groups had perfect scores for both Lesson 1 and Lesson 2, so the lines estimated for Treatment and Control will necessarily both come very close to that cloud of students at coordinate (110, 110), resulting in a treatment effect of zero. Put another way, a student starting with a perfect score of 110 on Lesson 1 cannot improve in Lesson 2. His or her score on Lesson 2 will either remain the same or decline.
But we can show that students with access to the Video intervention had benefit when preparing Lesson Plan 2, even if they had a perfect score of 110 on Lesson Plan 1. There were 22 students in the control group with a score of 110 on Lesson Plan 1. Of these, 8 (36%) received a lower score on Lesson Plan 2. There were 35 students in the treatment group who got a score of 110 on Lesson 1. Of these 35 students who saw the video, only 2 (6%) got a lower score on Lesson 2, a statistically significant difference compared with controls (χ2=8.77, exact p=0.005). We conclude that the video had a reinforcing effect even for the strongest students in the study.
Discussion
Creating lesson plans is vitally important to the practice of teaching. The findings from this study make clear the importance of providing contextualized and personalized feedback directed towards the important elements of lesson design. A written document alone, no matter how precise and clear, cannot match a written document supplemented with an instructor-created tool that reinforces the content. The particular tool in this study, a video, provided measurable benefit to both struggling students and top performers.
The findings of this study support the assertions made by Nilson and Goodson (2018) pertaining to the effectiveness of instructor-created videos for use with online courses. The findings are also in strong alignment with the work of Christensen and colleagues (2010) who found that instructional videos support increased student achievement and knowledge retention. While a common denominator for online courses includes text and written instructions to students, this study provides evidence to the potential benefit and value of videos as a means for supporting students in online courses.
Even beyond technology tools and faculty training, there are a multitude of factors and potential confounding variables that impact the effectiveness of online teaching and learning. Nevertheless, it is clear that an embedded video – while seemingly simple – can provide instructional benefits for students. Objective evaluations such as this one serve both to focus efforts on what works best in online courses and to support online teaching methods throughout the academy.
One may argue that the video did not have a large impact since it was associated with an average improvement in Lesson 1 Plan score of only 4.6 on a scale from 0 to 110. The incremental improvement in Lesson 2 was statistically significant as well but varied depending on the starting score in Lesson 1 and was not large. Small improvements, however, are powerful. Continuous improvement is a process widely used to optimize anything done repeatedly over a period of time, whether manufacturing automobiles, delivering packages, or searching for a new drug to treat diabetes (Fryer et al., 2007). It can be equally well applied to teaching students. The idea is to make small changes in your process, measure the impact, keep the changes that improve your process, and discard changes that do not. Over time your process slowly improves. As improvements accumulate the effect can be dramatic.
This study is one step in an ongoing process. To illustrate the power of small improvements over time, consider this example from sports. From 1908 to 2003, British cyclists won a single gold medal; none had never won the Tour de France. In 2003 a new coach began an intense effort to find every opportunity to make improvements, however small. For example, they painted the inside of their team truck white to help spot tiny specks of dust that might impact the finely tuned bikes. The cumulative impact of many tiny improvements was amazing. Just 5 years later, they won 60 percent of the gold medals available for cycling at the 2008 Olympic Games. During the 10-year span from 2007 to 2017 they won 178 world championships, 66 Olympic or Paralympic gold medals and captured five Tour de France victories.
The process of continuous improvement is well suited to the process of online teaching today. Standard ways of conducting instructional delivery must be modified given the new learning and course offering conditions arising from the pandemic. Instructors must constantly assess progress of their students and know the value (and limitations) of objective data. The concept of data driven decision making will be familiar to instructors of any grade level or subject, at all levels of the educational continuum.
What additional work is necessary to layer a study like this onto a class with multiple sections? Thought in advance is necessary to select the innovation to be tested, which class or classes of students are most appropriate for the innovation, and how to objectively measure the outcome. Measures must also be taken to evaluate each student equitably. There is additional work required after the course is complete, since statistical analysis is concerned primarily with overall performance of groups rather than individual students. Commensurate educators will spend time reflecting on lessons learned after completing a class. Statistical analysis is simply a more formal process of reflection.
While an observational study imposes relatively little extra work on the instructor, it is true that the conclusions cannot carry the weight of a formal randomized trial. When randomization can be done and the sample sizes are sufficient, randomization has the great advantage that treatment and control groups are balanced on potential confounding factors, even if unknown. The overhead for randomized studies however is great, involving a lot of advance planning, informed consent, and often Institutional Review Board review.
Conclusions from observational studies are more vulnerable to error than are randomized studies, but there are protections available. First, as long as the course continues to be taught there will be opportunity to observe that an innovation is not as effective as thought and change course. Second, for results that are published, other instructors will have opportunity to try out the innovation and report their experience.
Conclusions, Limitations, and Future Research
As this study has shown, developing and embedding instructor-created videos into a learning management system has the potential to breathe life into asynchronous courses, while also offering the similar promise to courses using a synchronous format. Moreover, these findings even suggest the use of instructor-created videos may improve student learning regardless of learning modality, including traditional settings.
The teaching “script” of a lesson plan captures essential elements of the preservice teacher’s pedagogical content knowledge (Shulman, 1987a) by (1) accounting for students’ prior learning, (2) engaging students with meaningful interactions with the content, (3) providing students with feedback related to their conceptualizations and learning, and (4) differentiating content to reflect the needs of diverse learners.
There are also other important considerations that impact the professional practice of future teachers. For example, it is also necessary that online courses pertaining to teaching methods reflect the dispositional components required of preservice teachers, including such notions as caring, equity, and professionalism (CAEP, 2013). While this study has offered insights pertaining to the implementation of an instructor-created video to improve the quality of lesson plan development, many other areas of instructional delivery and professional practice may benefit from online teaching tools and are worthy of study.
Engaging students in effective lesson planning is necessary, but only a first step for teacher preparation programs teaching lesson planning. Once novice teachers are able to create a sound lesson plan, they must get real or simulated teaching experience using them. Additional research in needed to study how best to extend quality lesson plans to sound classroom delivery. While putting the lesson plan into practice extends beyond the scope of this study, other research has shown that online learning experiences can have a positive impact on lesson delivery (Ko and Rossen, 2010). A logical next step for research study is to create and enact practice teaching scenarios that enable candidates to engage in authentic lesson delivery while also receiving responsive and personalized feedback from the instructor.
Footnotes
Declaration of conflicting interests
The author(s) declared no potential conflicts of interest with respect to the research, authorship, and/or publication of this article.
Funding
The author(s) received no financial support for the research, authorship, and/or publication of this article.