
Abstract
The study investigates (1) the effectiveness of using eLearning-embedded stories and pictures in order to improve learning outcomes for students and (2) how universities can adopt innovative approaches to the creation of Problem-Based Learning (PBL) resources and embed them in educational technology for teaching domain-specific content, such as statistical literacy – a widely documented difficult subject for students to master. Current didactic approaches for statistics commonly do not arouse student attentiveness and enthusiasm. New educational theories related to contextualism and learning through student-relevant experiences and technologies establish encouraging options to improve educational relevance. The author suggests that contextualizing theories embedded in eLearning systems can eliminate barriers for learning and can serve as a valuable technique that encourages students to learn using scenarios that are more relevant to them. The authors examine empirical data on students’ learning and interpretation of the topic studied. The data are instrumental in determining the broader context of learning, including affective dimensions and student interpretations. Based on the proposed approach, a trans-disciplinary application is possible.
Keywords
Introduction
Those students majoring in economics and business are required to enrol in statistics and quantitative-based research methodology courses for degree completion. Statistics prepare these students to understand and use statistical data through the application of descriptive statistical concepts in their respective fields.
ECON 1310 is an introductory quantitative analysis course with approximately 800 enroled students per semester. The course covers a variety of techniques applicable to the presentation, interpretation and use of data through the emphasis on inferential statistics with Estimation and Hypothesis testing techniques. Inferential statistics are followed by simple linear regression topics, which have an emphasis on the use of Microsoft Excel for analysis and presentation.
Historically, the failure rate of the course is 30%. Students appear to dread the course and have registered complaints in the past as to the difficulty, complexity and relevance of the course in business and economics. The authors note that students often focus on formulae memorization in order to simply pass the course, rather than deeply understand the material. Students do not actively participate in tutorials, electing instead to sit back, listen to a tutor and copy solutions from a whiteboard. Student evaluations show that students consider the course boring and frustrating.
Since understanding economic theory and, in particular, the abstract mathematical concepts in economic statistics, can be difficult for students, the course was redesigned to be interactive and delivered via eLearning technology, as well as show the practical relevance of learning statistics through explanations using stories that revolve around a fictional fish farming business. Abstract statistical concepts are contextualized through characters, such as a seagull, a pelican and Freaky Fish.
This approach has led to positive student feedback. As a result, the course’s aim is now formulated from the student’s perspective to provide a ‘general statement[s] of educational intent’ (Ramsden, 2003: 126), rather than being vague and general. The course’s aim is to ‘develop an ability to independently solve practical problems using inferential statistics techniques, and explain the results using everyday language’. The new learning objectives are restated to be ‘more specific and concrete statements of what students are expected to learn’ (Ramsden, 2003: 126) and are able to be assessed.
Literature related to teaching and learning about statistic-based pedagogical methods widely documents that students have negative perceptions and difficulties in mastering fundamental statistical concepts (Broers, 2008; Cochran, 2005;Garfield et al., 2002; Kotz, 2010; Landes, 2009; Lee, 2007; Prabhakar, 2008). The author’s experience with statistics students at the University of Queensland (UQ) is that students consider statistics more difficult than other domains, due to difficulties in keeping up with continual cumulative material and dislike of the subject. As a result, statistical literacy is not developed, causing these students to fall behind. MacGillivray and Pereira-Mendoza (2011: 110) argue that ‘the learning and teaching of statistical thinking requires gradual building up of concepts, understanding and skills, in a coherent, consistent and cumulative way that engages students in real contexts and authentic learning experiences’.
In this paper, the author presents and reflects upon the teaching methods for statistics at UQ since the course is widely regarded as challenging due to the cumulative nature, creating difficulties in catching up if the student falls behind. The concepts covered in the course are deemed an essential part of the analytical toolbox for well-trained professionals. Success in the subject depends on keeping up to date. Therefore, each topic is assessed as it is completed via a computer-managed quiz.
The literature documents problems related to student appreciation of the relevance of statistics, showing that perceptions of the usefulness and worth of statistics is unfavourable (Cashin and Elmore, 2005; Hollis, 1997; Schau et al., 1995; Vanhoof et al., 2011). The methods previously applied in the course to teach statistics have largely proven to be ineffective, leading to the creation of a story-based approach for teaching statistics, yielding positive results over a five-year period and higher pass rates.
Literature review
Traditional methods of teaching statistics to first-year students have been through didactic instruction, which involved a lecturer presenting materials and formulae. This method involves setting assignments and exams to a large contingent of students, typically classes of 800 students.
Students are required to attend at least one two-hour lecture per week, as well as an 80-minute tutorial in which students work through a series of pre-set questions. In this approach, students are required to read the textbook and attempt practice questions at the end of each chapter. Assessment comprises a mid-semester exam (weight: 25%), a final exam (weight: 55%), and assignment papers throughout the semester (weight: 20%).
Learning contextualism occurs as the content, methods and materials of the curriculum are related to the experience and environment of the learner. Students are typically taught statistics in an ‘arid, context-free landscape’ where students ‘rarely think statistically’ (Wild and Pfannkuch, 1999: 228). Recently, Dierdorp et al. (2011) determined that real-world contexts are useful in explaining statistical concepts. Thus, conceptualization, which comes from constructing meaning from previous experiences, is related to learning (Ramsden, 2003).
Linking ‘theory with practice’ is difficult for many students (Murtonen and Lehtinen, 2003: 183). Dall’Alba (2009) argues that seeing the overall scheme of things is important to fully grasp key ideas. As a result, the seeming irrelevance of statistics to life experiences is an enduring problem.
In many educational settings the irrelevance of statistics education to the life experience of learners seems to be an enduring problem (Carnell, 2008; D’Andrea and Waters, 2002; Gal et al., 1997; Gordon 2004). As a result, it is necessary for educators to explore educational strategies that are based on student-centred environments, including student contextualization of content and pedagogy for meaningful application.
Problem-based teaching techniques that use real examples and incorporate visual narratives were adapted into the course in order to allow students to apply the course material to a business environment, since it was determined that many students were not interested in theory. Students were confronted with ill-structured problems typical of businesses, rather than pre-framed and semi-structured textbook case studies, through eLearning technology. As a result, students must apply theory and seek additional information beyond the provided information, allowing students the opportunity to develop critical thinking and analytical skills needed in their careers.
The use of a fish farming operation allows students to analyse issues within a fictional real-world business. As a result, concepts – such as the normal and sampling distribution of the mean – are explained through everyday observable features on the fish farm. Pictorial icons, such as the Freaky Fish (Figure 1), are used to help students identify statistical problems and solution techniques. The Freaky Fish assisted students in understanding ‘why and how’ a solution technique is applied to a specific problem. Thus, through the PBL framework, students can access innovative eLearning resources (Figure 2) designed to familiarize them with key concepts and interact with on-demand authentic, complex and realistic problems.
The Freaky Fish visual narrative related to the sampling distribution of the sample proportion. Screen shot of eLearning material with the seagull pictorial icon related to the normal distribution.
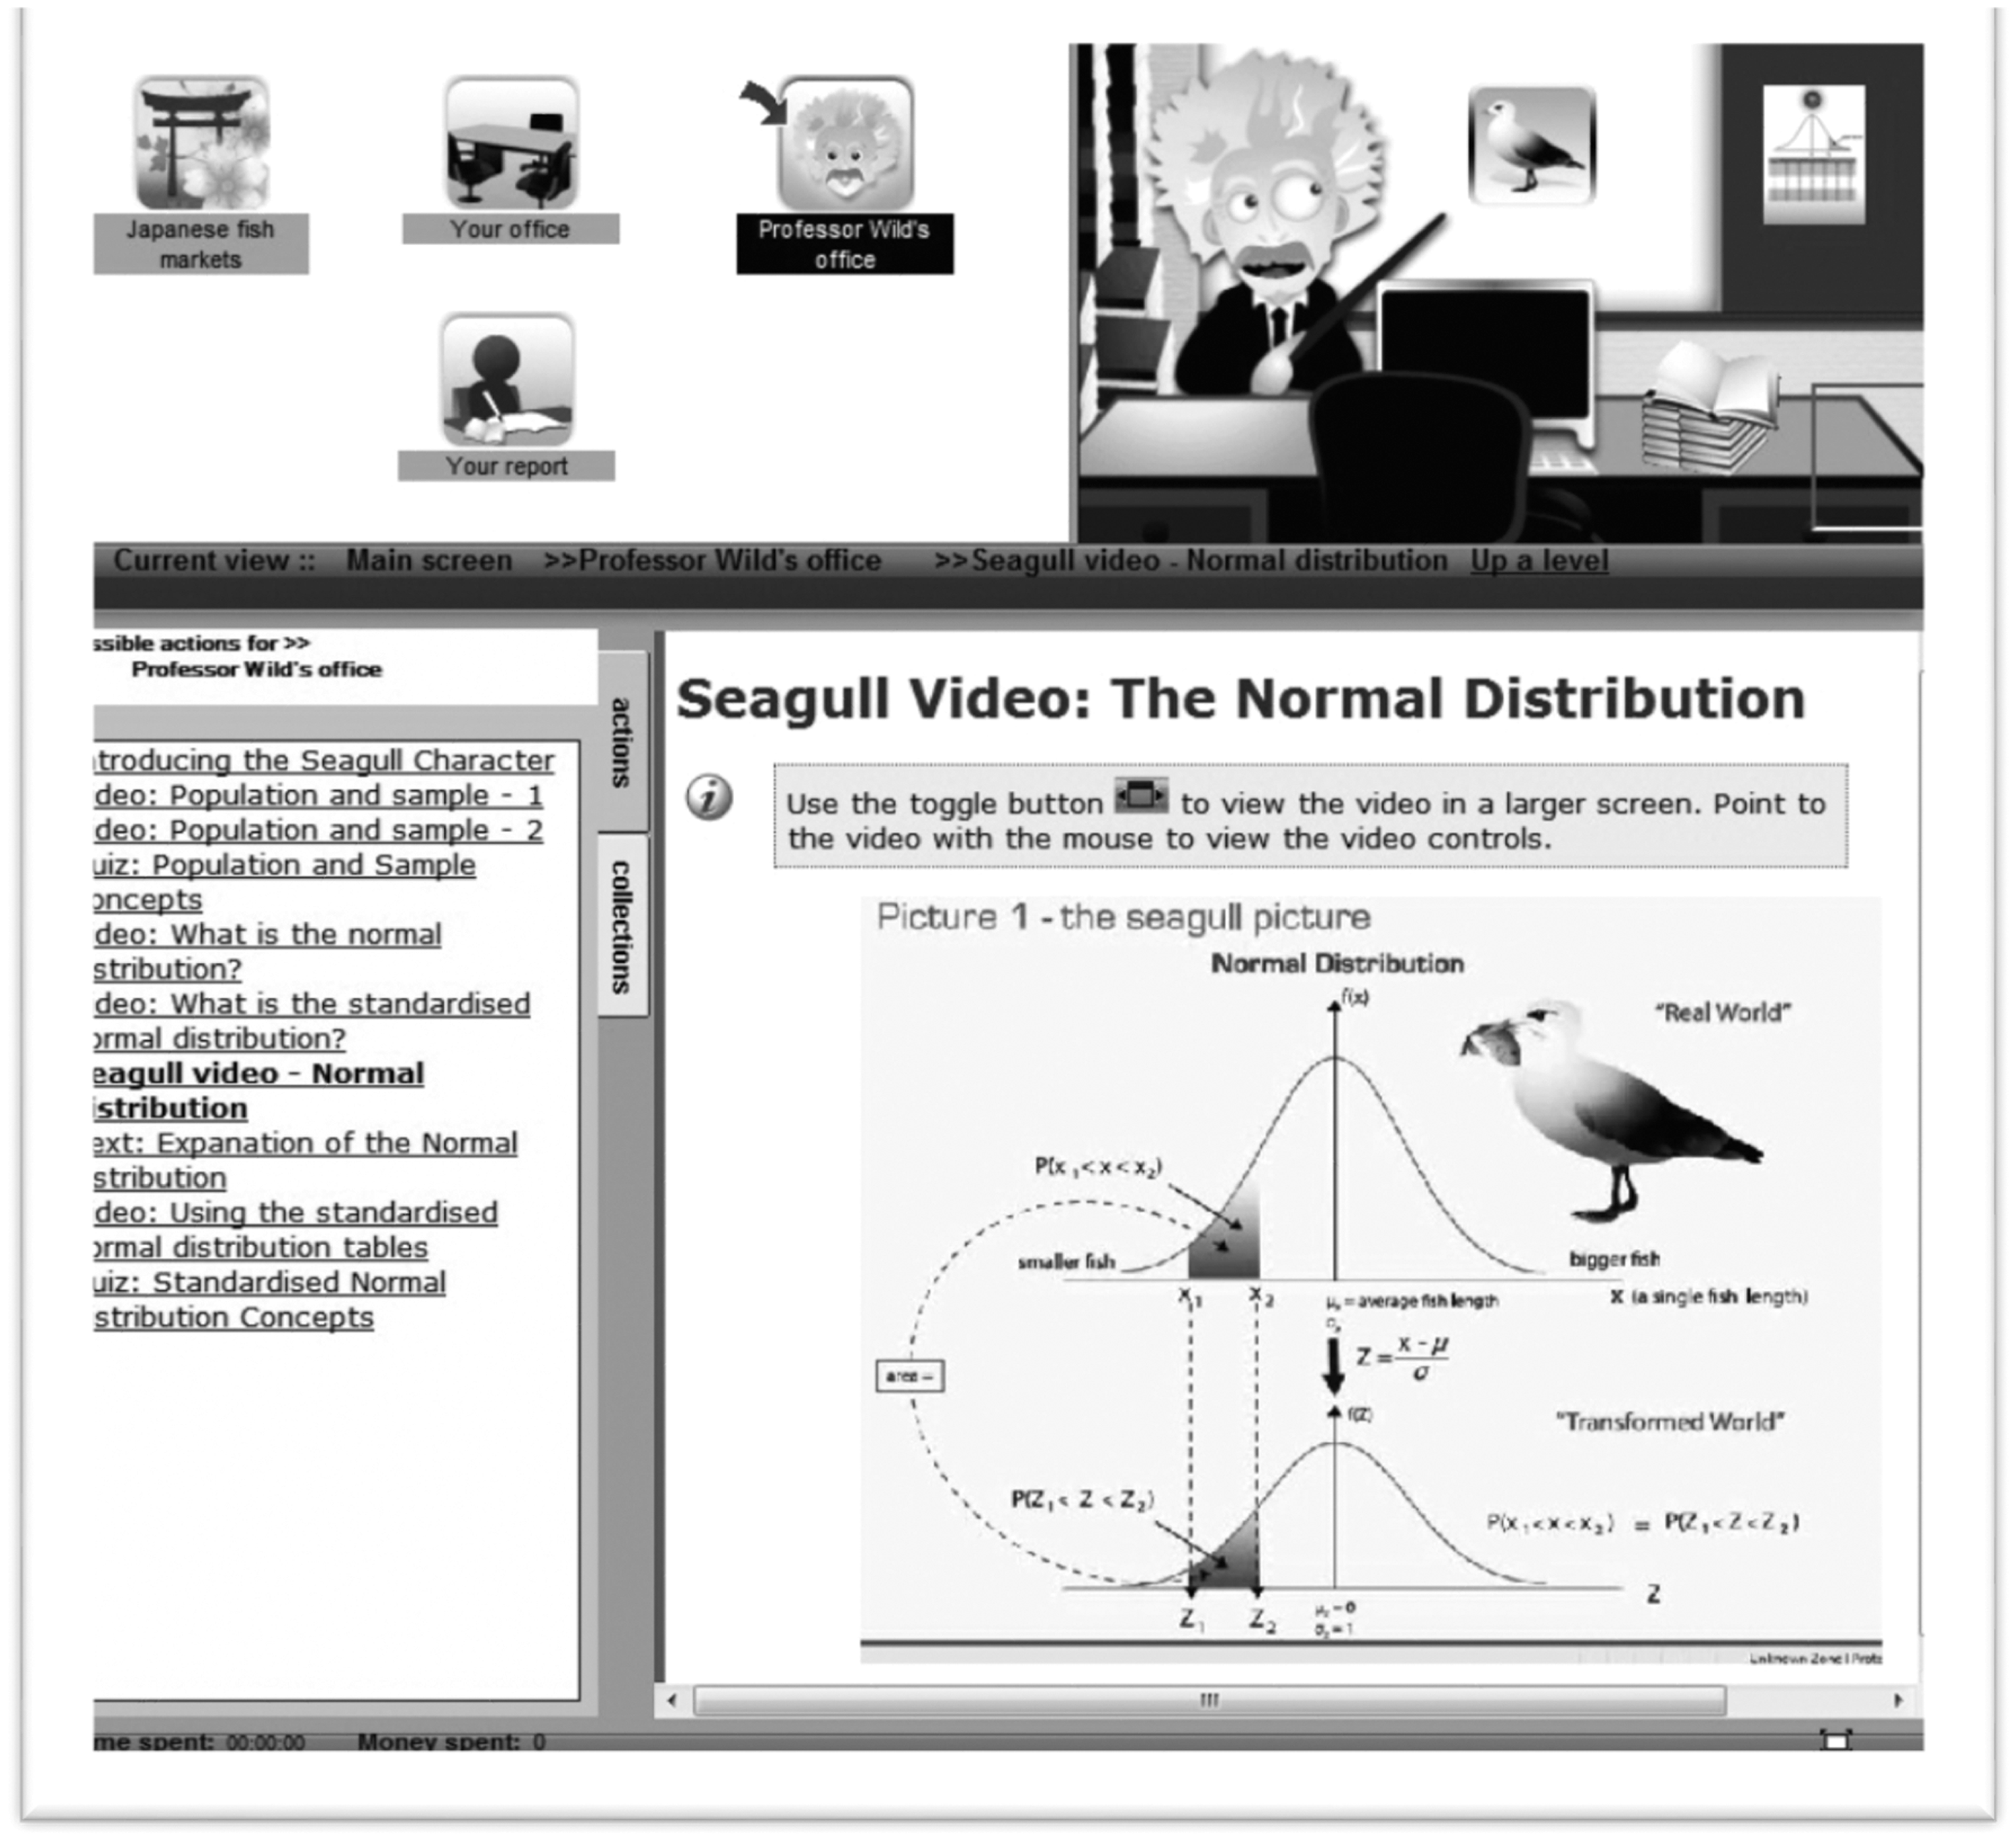
Scenario-based Learning Interactive (SBLi) is an authoring tool and platform for presenting web-based simulations/case studies. The eLearning scenario is developed/built by establishing locations, actions, collectable items, tests, etc. in a framework that meets desired learning objectives (Norton et. al., 2012). The scenario is made more appealing and engaging through the use of video, audio and images. External files can be added to a scenario for students to further investigate the problem or as a template to complete their work. The platform enables educators and training professionals to utilize PBL and situational learning theories to encourage student-centred learning, rather than teacher-directed instruction (Jinks et al., 2011).
The situational learning theory is appropriate for SBLi because it allows the learner to ‘distinguish and handle continuity and change in related situations’ (Martin, 2009: 133). Thus, SBLi allows students to participate ‘in social practices and be closely connected to a continuous interactional adaptation to unfolding circumstances and activities across situations and time’ (Martin, 2009: 137). At the same time, variation theory is also related because of changing situational constructs. The success of SBLi can be measured through pre- and post-test scores because the test scores show changing situational constructs (what was previously known and what was learned in the SBLi).
Standard tests are believed to only provide graphical representations of statistical concepts. Therefore, the authors developed a ‘character’ (i.e. bird/fish picture) that can be associated with standard textbook graphical representations – a task that has not been accomplished to date. The authors borrowed concepts from educational psychology (such as situational theory) (Kim and Grunig, 2011; Kruger-Ross and Waters, 2013) and the role of visual markers in order to anchor points in adult learning. Studies, such as the one by Carraher et al. (1985) in Brazil, clearly illustrated this gap between everyday cognition and school-based knowledge. This gap was illustrated by Carraher et al. (1985) through studying children while solving arithmetic tasks in different contexts: as street vendors and in the classroom. The findings emphasized the need to anchor learning processes in more realistic situations, which does not occur in the case studies found in standard statistics textbooks. As a result, typical school learning is decontextualized, while real cognitive activities and learning occur in contextual situations.
The success of this method depends on modern learning theories, which date back to 1984 (Alesandrini, 1984). Thus, the literature suggests that associative learning occurs through analogical pictures (such as the seagull, to teach normal distribution and its equations), which are useful in helping students relate new information to prior knowledge through contextual cueing and associative learning.
D’Andrea and Waters (2002) employed a method using fictional short stories that involved some ‘sleuthing’ by the student to solve a statistical problem, which improved the students’ attitudes towards the course. Based on the successes in this study, the authors have created a scenario based on a fictitious fish farm introduced in a statistics course. However, the scenario created by the authors varied from D’Andrea and Waters’ (2002) proposal by incorporating pictures (as appropriate) throughout the eLearning scenario to act as visual aids for the student. In this scenario, the student acts as an advisor required to use hypothesis testing in order to investigate claims made by the fish farm owner on average fish lengths, then evaluate their findings and ascertain if the fish farm is a viable business proposition.
The application of pictorial icons within a problem-based eLearning environment supports the connection of learning with real-world scenarios and encourages students to be accountable for their learning decisions. Representational fluency occurs as students are able to establish meaningful links between and among representational forms and to translate from one representation to another (Lesh, 2000). Through this literature, symbolization of concepts is established, as well as how symbolization can be an effective learning tool (Derry, Wilsman and Hackbarth, 2007; Santos and Thomas, 2001; Stieff and McCombs, 2006; Stull et al., 2012). As early as 1999, Keogh and Naylor (1999) were using ‘concept cartoons’ to develop an innovative teaching and learning strategy which took into account constructivist views of learning in science.
Methodology
This specific design is different because it creates a link between the picture and the standard statistical textbook diagram, which has not been attempted previously. For instance, in this design, a seagull picture relates the student to the theory of normal distribution. The purpose is to allow students the ability to relate to a real-world analogy of a seagull catching a single fish from a population, which links to the appropriate theory and equation. This study is aimed at the evaluation of the pedagogical effectiveness of employing a set of pictorial icons with a story-based teaching method in improving outcomes for students. The research question for this study is: To what extent and in what ways does using eLearning embedded fictional real-life context stories allow students to perform differently than those exposed to pre-course materials only? H1: By using eLearning-embedded fictional real-life context stories, these students will perform better than those exposed to pre-course materials. H2: By being exposed to pre-course materials, these students will perform better than their counterparts who use eLearning-embedded fictional real-life context stories and pictures.
Subjects
Participants for the study included 385 undergraduate first-year university students out of 843 course enrolments. Criteria for study participation included:
Enrolment in an introductory statistics course (ECON 1310 Quantitative and Economic and Business Analysis). No previous university-level experience with descriptive statistics and/or inferential statistics.
Participant information
Participants were made aware that participation (pre- or post-test) was not graded and did not count towards coursework. Furthermore, participants were made aware that participation was voluntary and anonymous. Students were informed that they should not expect to know the answers at the time of the administration of the pre-test, which was diagnostic of knowledge levels of statistics prior to taking the course. The students were informed that the pre-test might provide them with (1) a sample of the topics that would be covered in the course and (2) an illustration of the types of questions that would be on the course exams. It was recommended to students that the completion of the test would allow them to reflect upon their learning, receive individual feedback (i.e. marked scores), and enable them to develop individual learning plans aimed at optimizing their success within the course.
Intervention
Participating students completed a pre-test online in order to test their understanding of fundamental statistical concepts before taking the course. At the end of the term, participating students completed a post-test online in order to test for increases in statistical literacy.
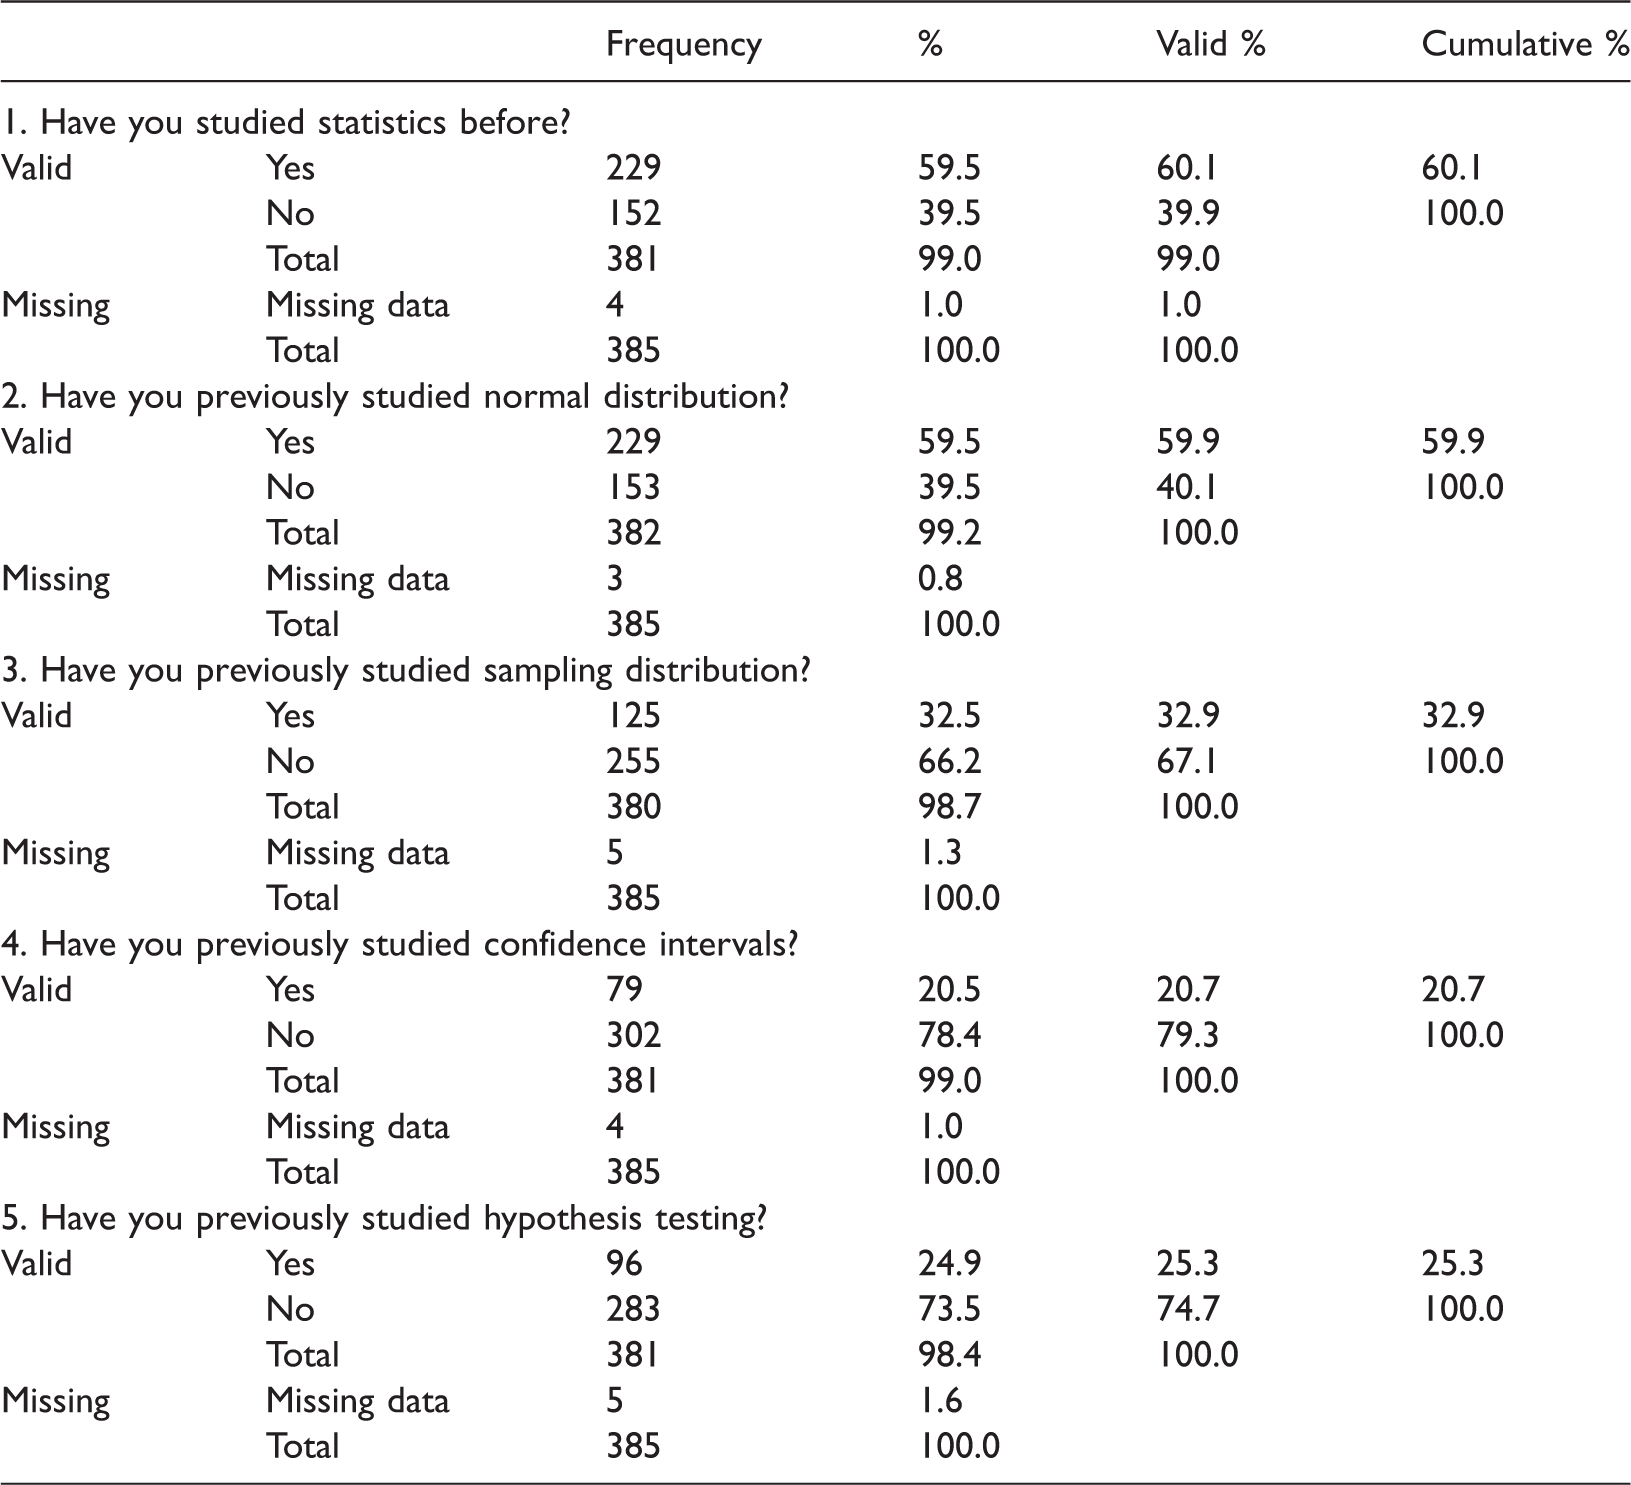
The questionnaire included 45 questions. It was established that five questions were to determine the existence of any prior statistical learning (such as the extent of statistics studies in high school in order to gauge expected performance), while the remaining 40 Multiple Choice Questions (MCQ) tested statistics knowledge (see Appendix A). The MCQs did not involve calculations and were developed by two fourth-year economics/commerce tutors, contracted to compile the MCQs, providing each question with five options, allowing measurement to occur regarding learning the statistical concepts.
The MCQs were then reviewed/edited by the statistics instructor. The final 40 MCQs were completed by three senior statistics instructors in order to create cross-validation and ensured that the questions were easily understood and comprehensive, which eliminated the risk that students would erroneously answer the question because the wording was unclear. Throughout this process, only one question required rewording for clarity purposes.
Upon completing the post-test, which included an additional three qualitative questions in order to determine the opinion of participants regarding lesson styles, they received their scores immediately, as well as the correct answers to all questions in order to assist them in evaluating their own progress during the course, such as new knowledge gained and what needs to be focused upon.
The pre-test was administered during the first week of classes through an anonymous link via Blackboard Learning Management System. By the end of the third week, 148 students (resulting in 17.5% of the class) had completed the pre-test. The post-test was administered through two separate links via Blackboard at the end of the semester (two weeks prior to final exams). The first link was for those students that had completed the pre-test (148 students with 123 completions), while the second link was for those students that had not attempted the test (143 students). All participants were requested to not refer to lecture notes or textbooks in order to show what was learned during the term. Students could access the pre-post-tests from any location they chose using the links given and were under no time limits to complete these tasks.
The three data sets are referred to as:
Research design
Data are collected from the results of the MCQs, as shown below:
Pre-test
This test quantitatively assessed the participant’s prior basic statistical knowledge with five quantitative questions. An additional 40 MCQs consisted of four groups of 10 questions, each group covering the four topics covered in the course: normal distribution, sampling distribution, confidence intervals and hypothesis testing.
Post-test
This test included the 40 MCQs that were identically reproduced from the pre-test. In addition, three qualitative questions were asked, which did not alter the numbering of the content questions and contained questions/statements based on a five-point Likert scale, with an optional open-ended response.
Analysis
Data analysis
Quantitative and qualitative data were collected simultaneously from the survey questionnaire provided for each of the three sample groups for this mixed method research study,
Quantitative data analysis
The variables were encoded or transformed to numerical values to determine descriptive statistical analyses. This same activity occurred for MCQs 47 and 48 (considered answerable through a five-point Likert scale). However, for MCQs 6–46, the participants’ scores on each survey questionnaire were considered. As a result, these scores were tallied and summed for all three groups (Group 1 = First Attempt; Group 2 = Second Attempt; and Group 3 = Not Done Previously). The groups were considered as independent samples because data were independently gathered.
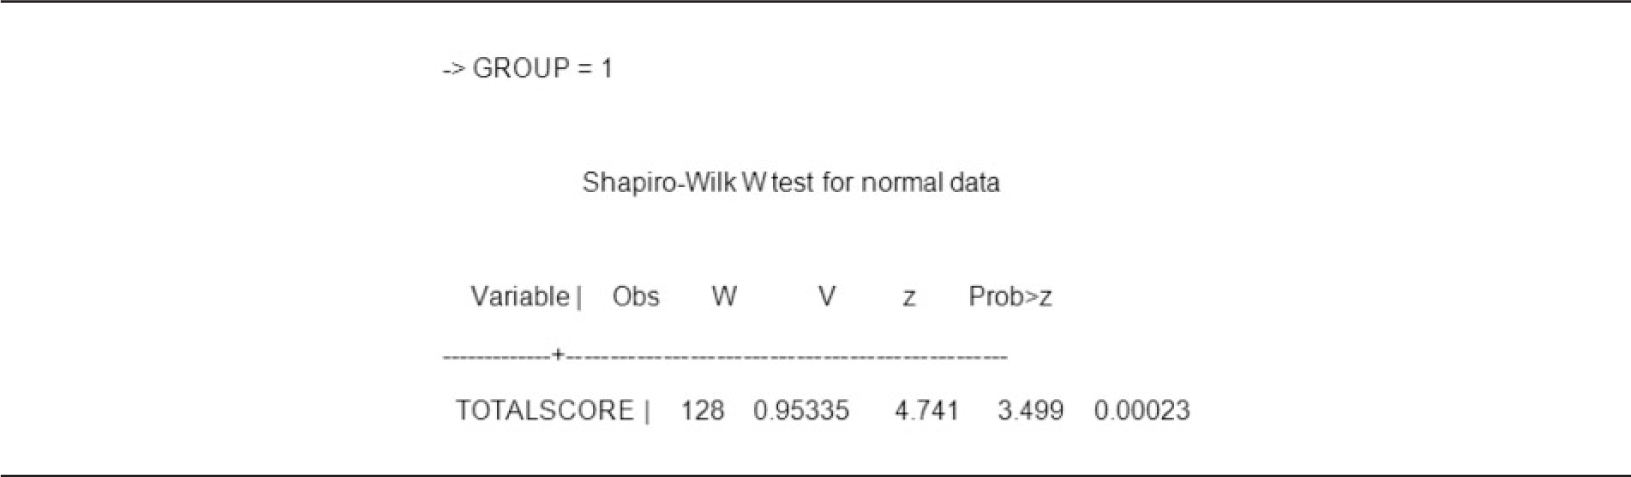
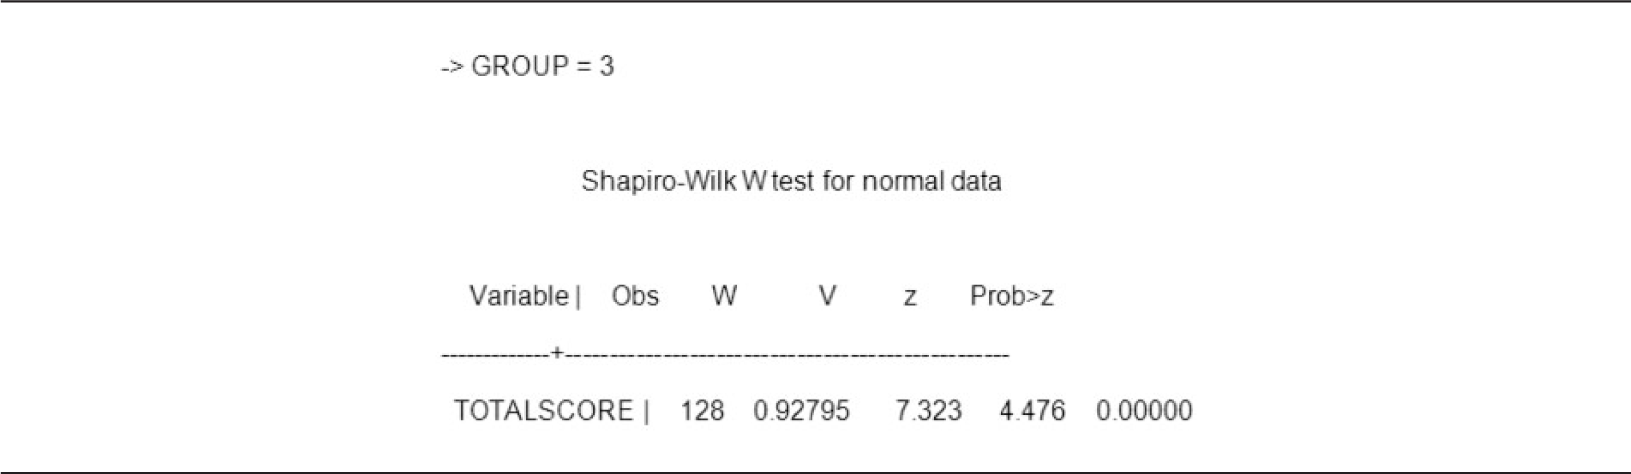
The first quantitative test was conducted on each individual group in order to determine normality through a Shapiro-Wilk W (tables 6, 7 and 8). If the group resulted in a normal distribution, a parametric test was performed. If the group did not result in a normal distribution, a Mann Whitney U test (figures 5, 6 and 7) was performed as a non-parametric test.
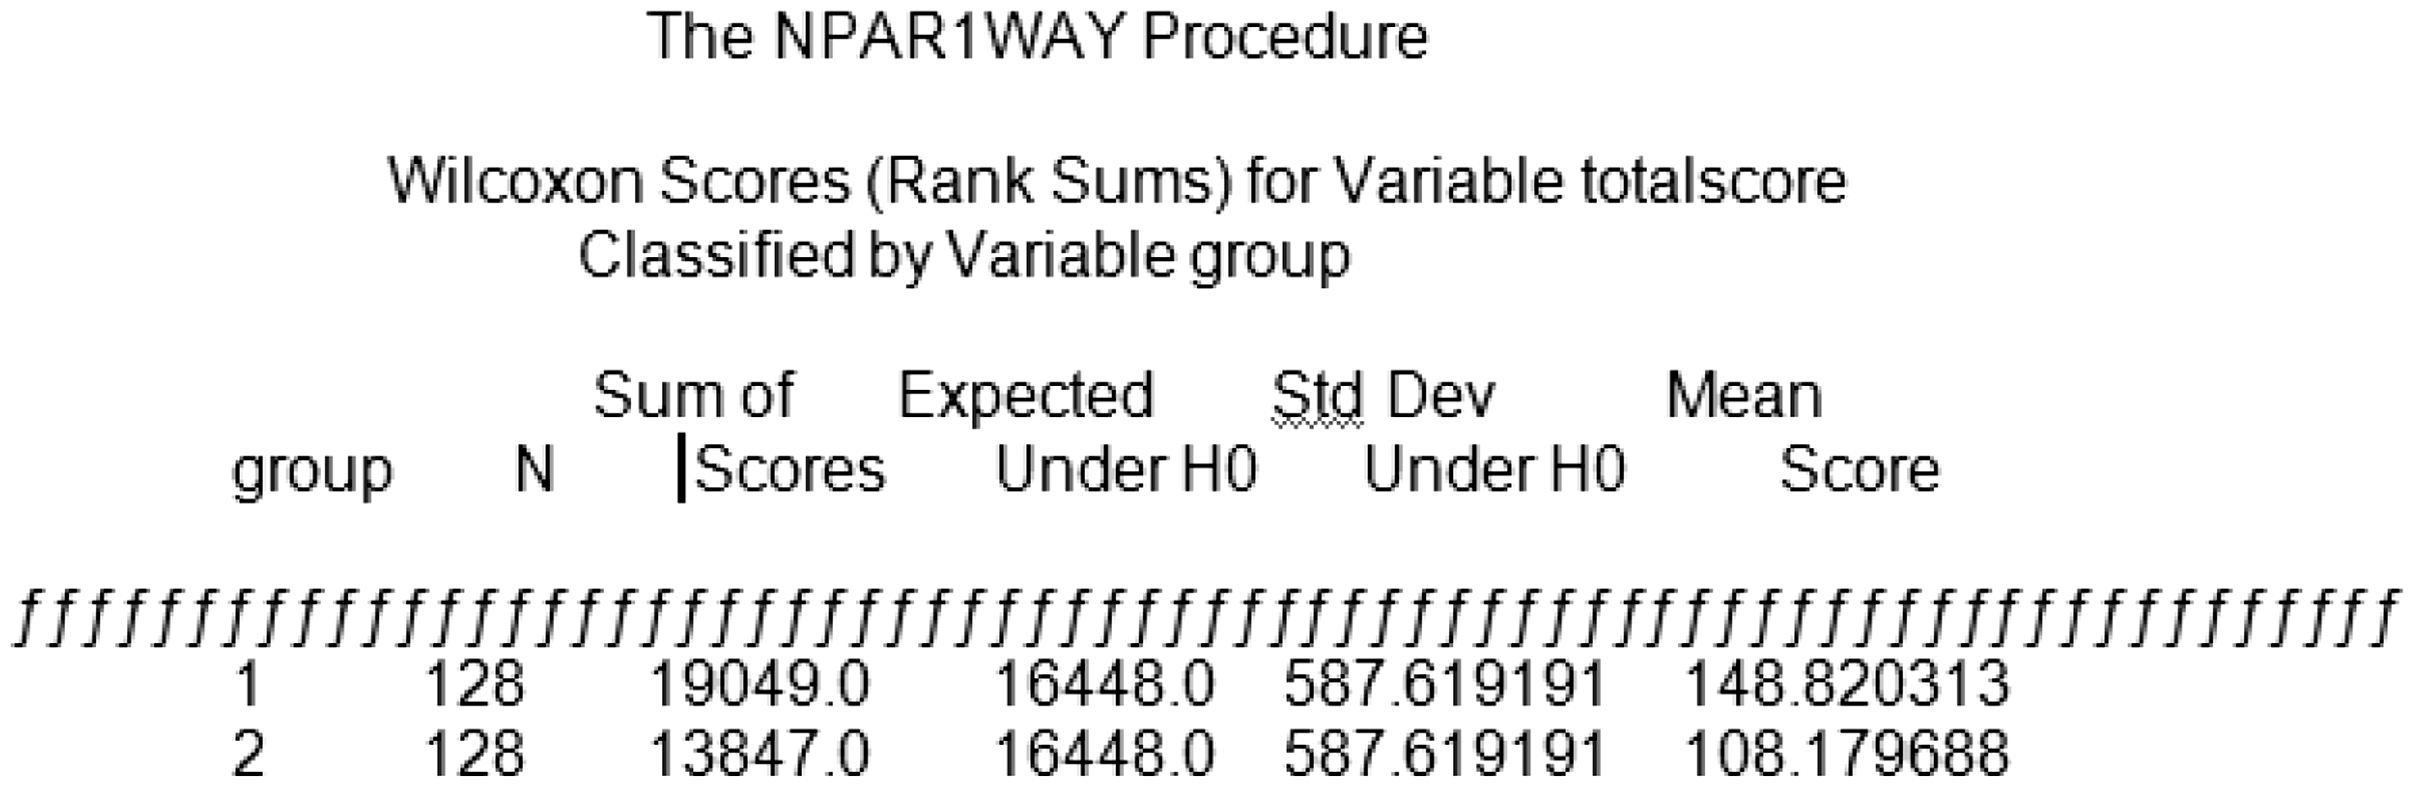
The second and third quantitative tests included a Wilcoxon-Rank-Sum test for two-sample tests and the Krusall-Wallis test. Significantly, the Wilcoxon Rank-Sum test refers to a non-parametric test that is an alternative to the two-sample t-test (Wild and Seber, 1999). The Krusall-Wallis test is a non-parametric test that is based on the order placements of sample observation and is used to compare three or more samples (Easton and McColl, n.d.). Through this test, the null hypothesis that all populations have identical distribution functions against the alternative hypothesis that at least two of the samples differ only in respect to location (median), if at all.
Qualitative data analysis
Qualitative data was obtained through three questions from the post-test. It was open-coded by the authors with central themes relating to course materials, content, statistical application, pictorial icons and perspective emerging from the data, as required through qualitative methods, suggesting that student responses be analysed as phrases or complete sentences (Strauss and Corbin, 1988). This was done through a five-point Likert scale and allowed students to elaborate on their responses on the post-test.
Justification
The use of the quantitative analysis is justified through the consideration of three independent groups. In order to support consistency and continuity, it is important to both describe the data in an effective manner (such as descriptive statistics) and conduct independent tests that will allow for the comparison of the data in an effective way. Therefore, the independent tests allow the grouped data to be treated independently, a necessity since each test was administered to the groups independently.
Results
The purpose of this section is to present the results of the study.
Qualitative analysis: Descriptive statistics of students’ response to the first five item questions
Student responses to Questions 1 to Questions 5.
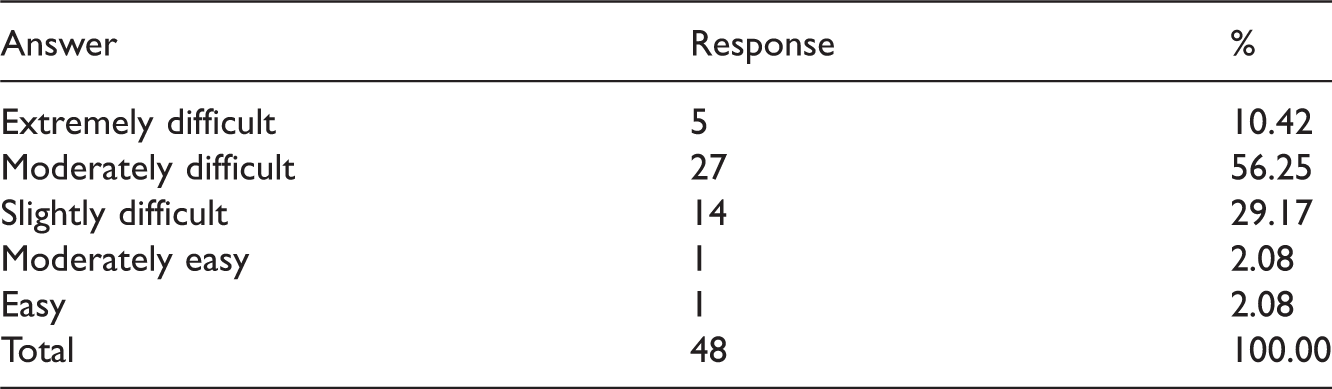
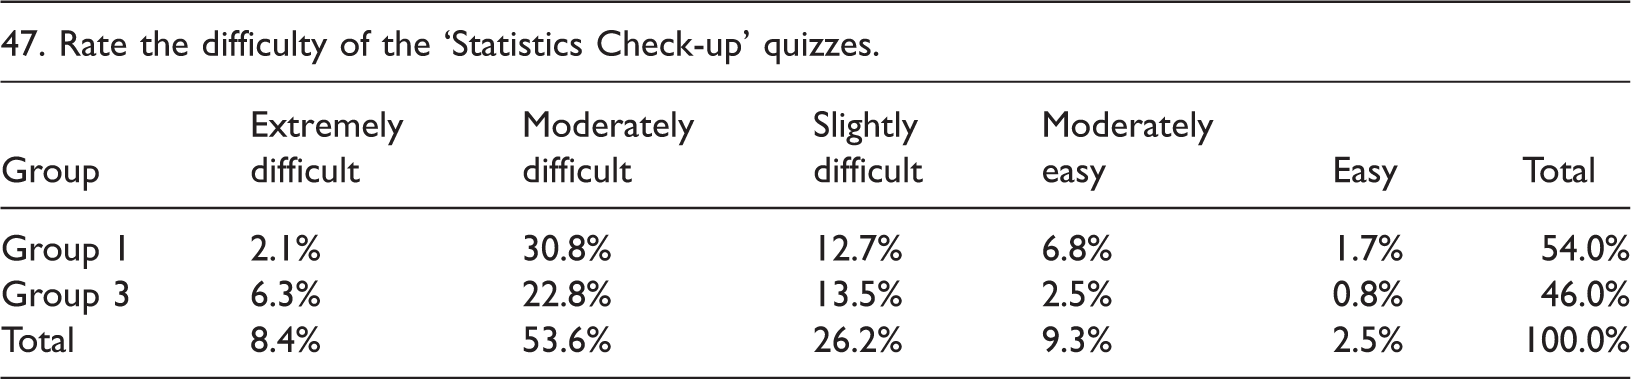
Qualitative analysis: Rating of difficulty of ‘statistics check-up’ quizzes
Student responses to ‘Rate the difficulty of the quizzes’.
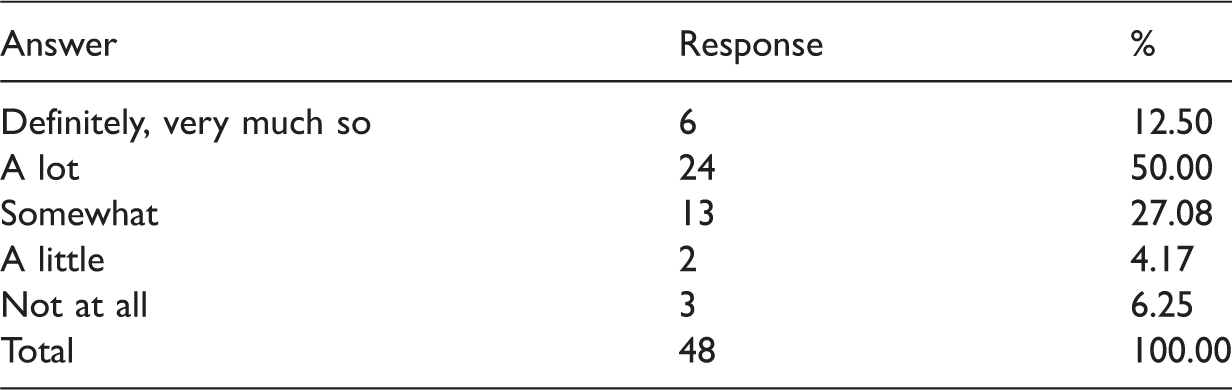
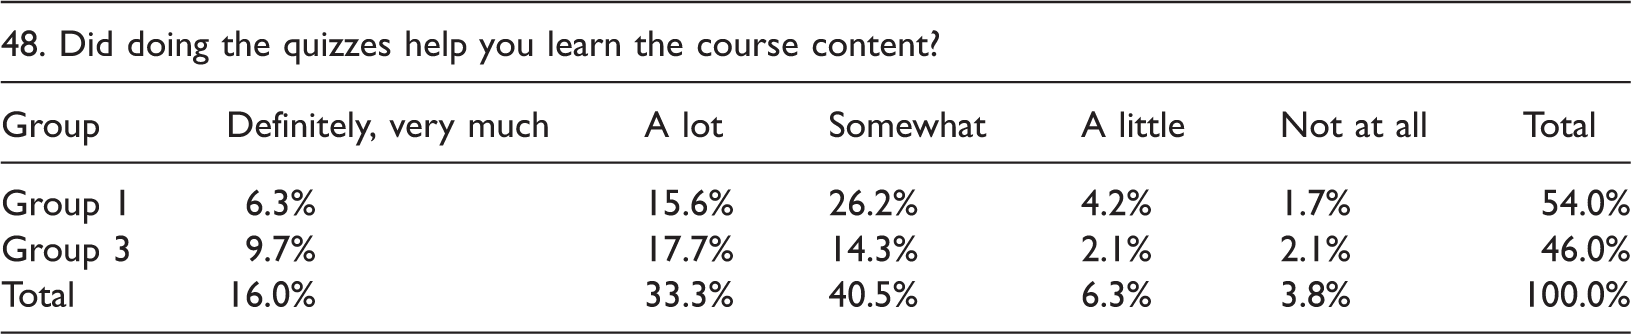
Student responses to ‘Did doing the quizzes help you learn the course content?’.
For recollection, the characteristics of the three groups are; Group 1: attempted the pre-test, Group 2: completed both tests (pre and post), and Group 3: only took the post-test. Based on cross-tabulation (shown in Table 4) and Figure 3 (shown below), it can be argued that the majority of the responses were ‘moderately difficult’ (equivalent to rating 2) for both the ‘First Attempt’ and the ‘Not Done Before’ groups. In total, these two groups have 53.6% of students who rated the survey as ‘moderately difficult.’
Statistics survey response rating. Statistics survey ratings: Rate the difficulty of the ‘Statistics Check-up’ quizzes.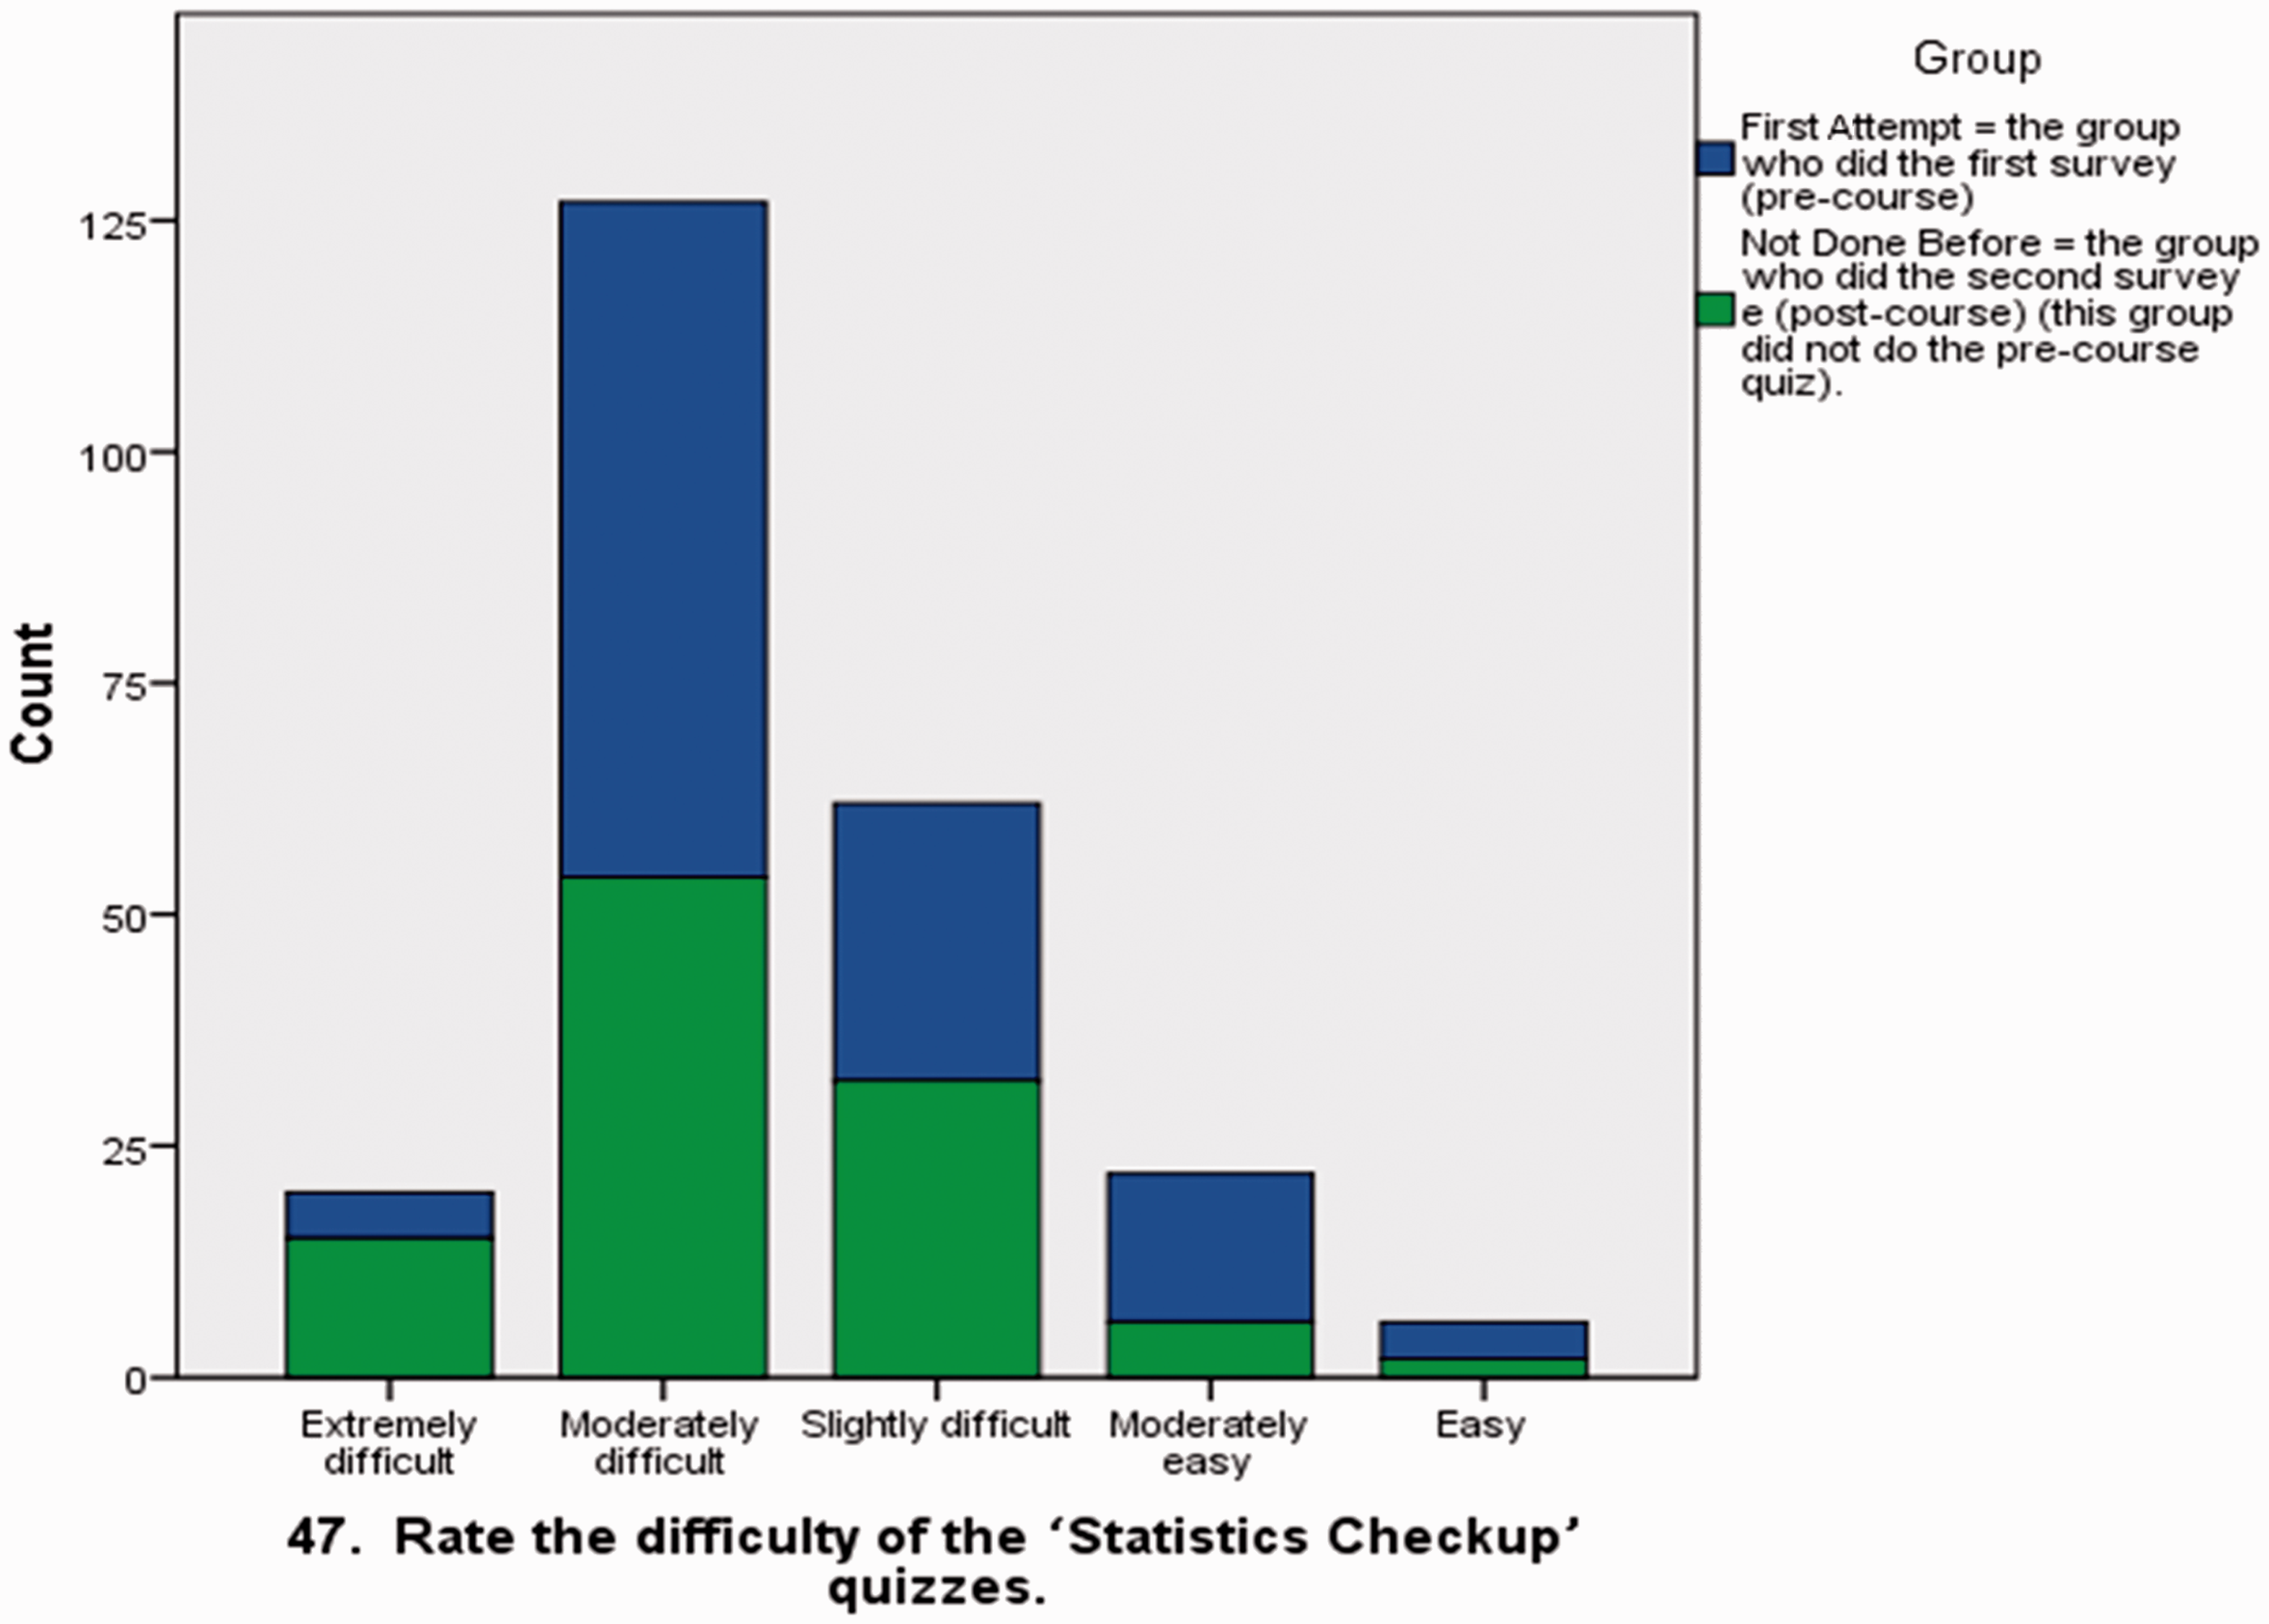
Quantitative analysis: Rate of learning from ‘statistics check-up’ quizzes
Based on the cross-tabulation (Table 5) and the graphical representation (Figure 4), it is shown that the students in Group 1 rated 26.2% as ‘Somewhat’ in acquired learning from the statistics check-up. However, in Group 3, 17.7% of the respondents rated ‘a lot’ of learning from the statistics check-up. On the other hand, 17.7% of the students in the ‘Not Done Before’ group rated ‘a lot’ of learning from the statistics check-up quiz. The combination of these groups resulted in 40.5% rating of ‘somewhat’ from learning something from the statistics check-up quiz. Therefore, it is suggested that through completing statistics check-up, students were more likely to understand course material.
Response learning rating of statistics survey. Mann Whitney U Test results for Groups 1 and 2. Mann Whitney U Test for Groups 1 and 3. Mann Whitney U Test for Groups 2 and 3. Learning rating of statistics survey.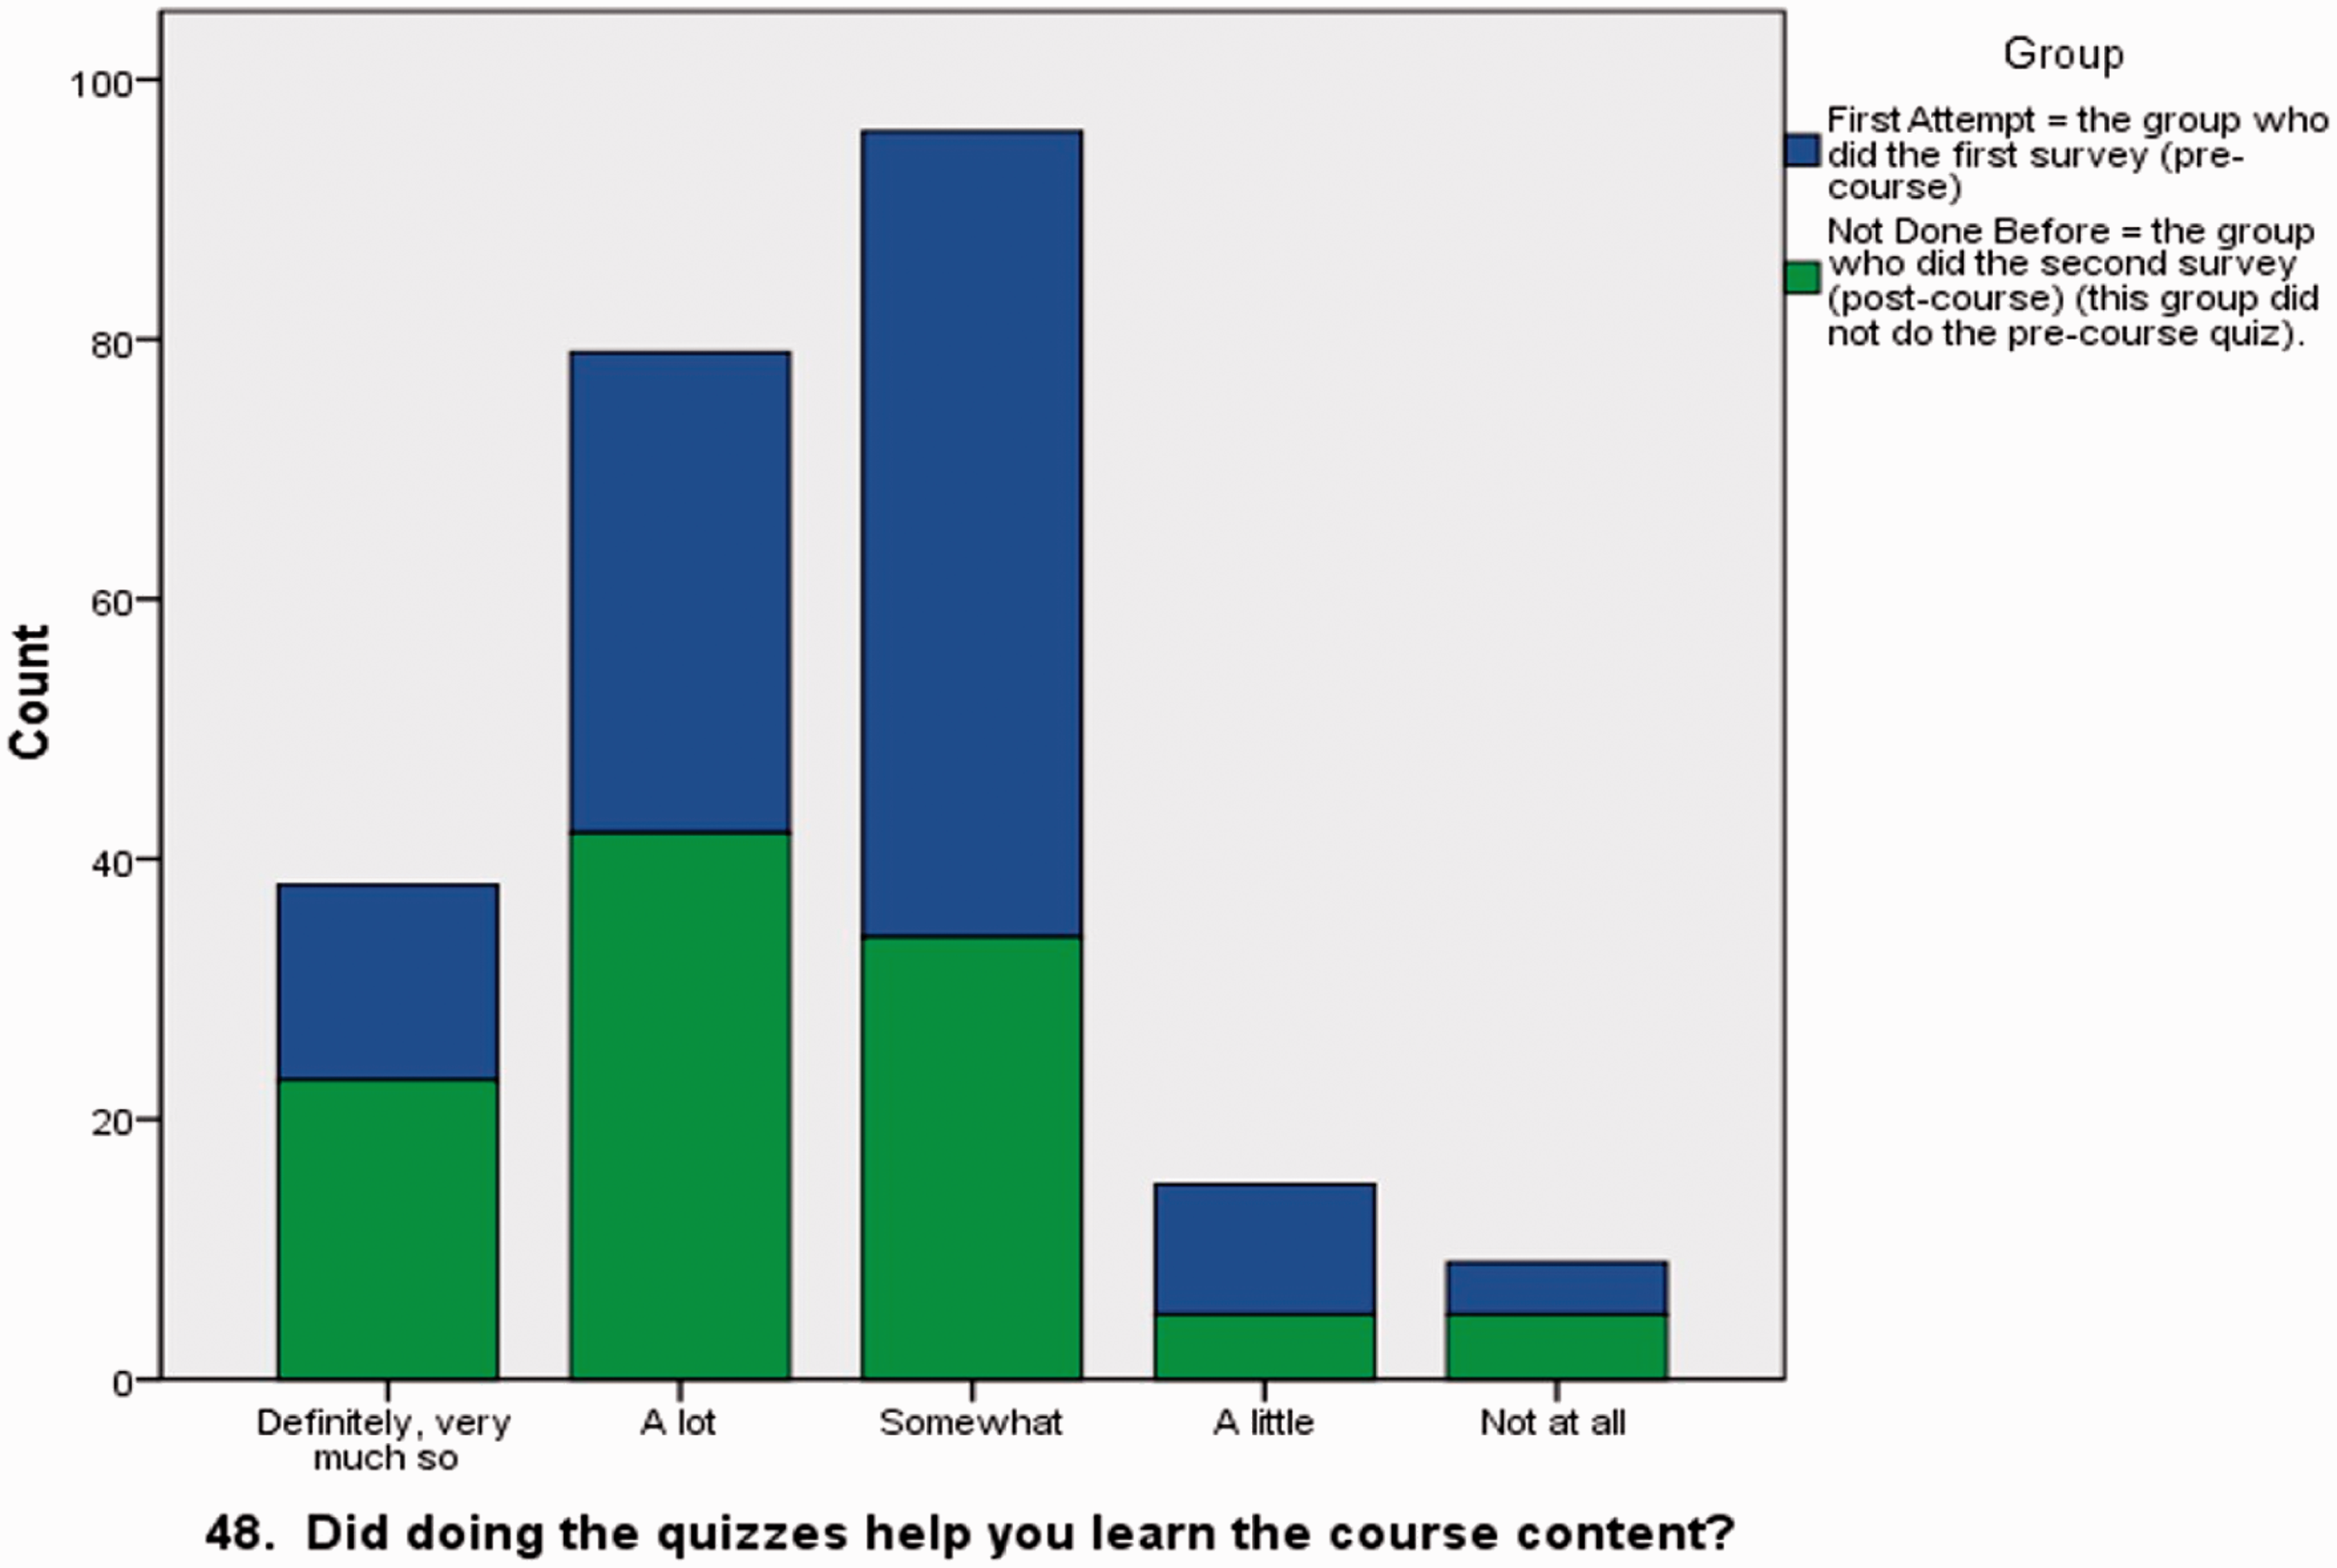
Quantitative analyses: Inferential statistics
The following three procedures were followed for statistical analyses:
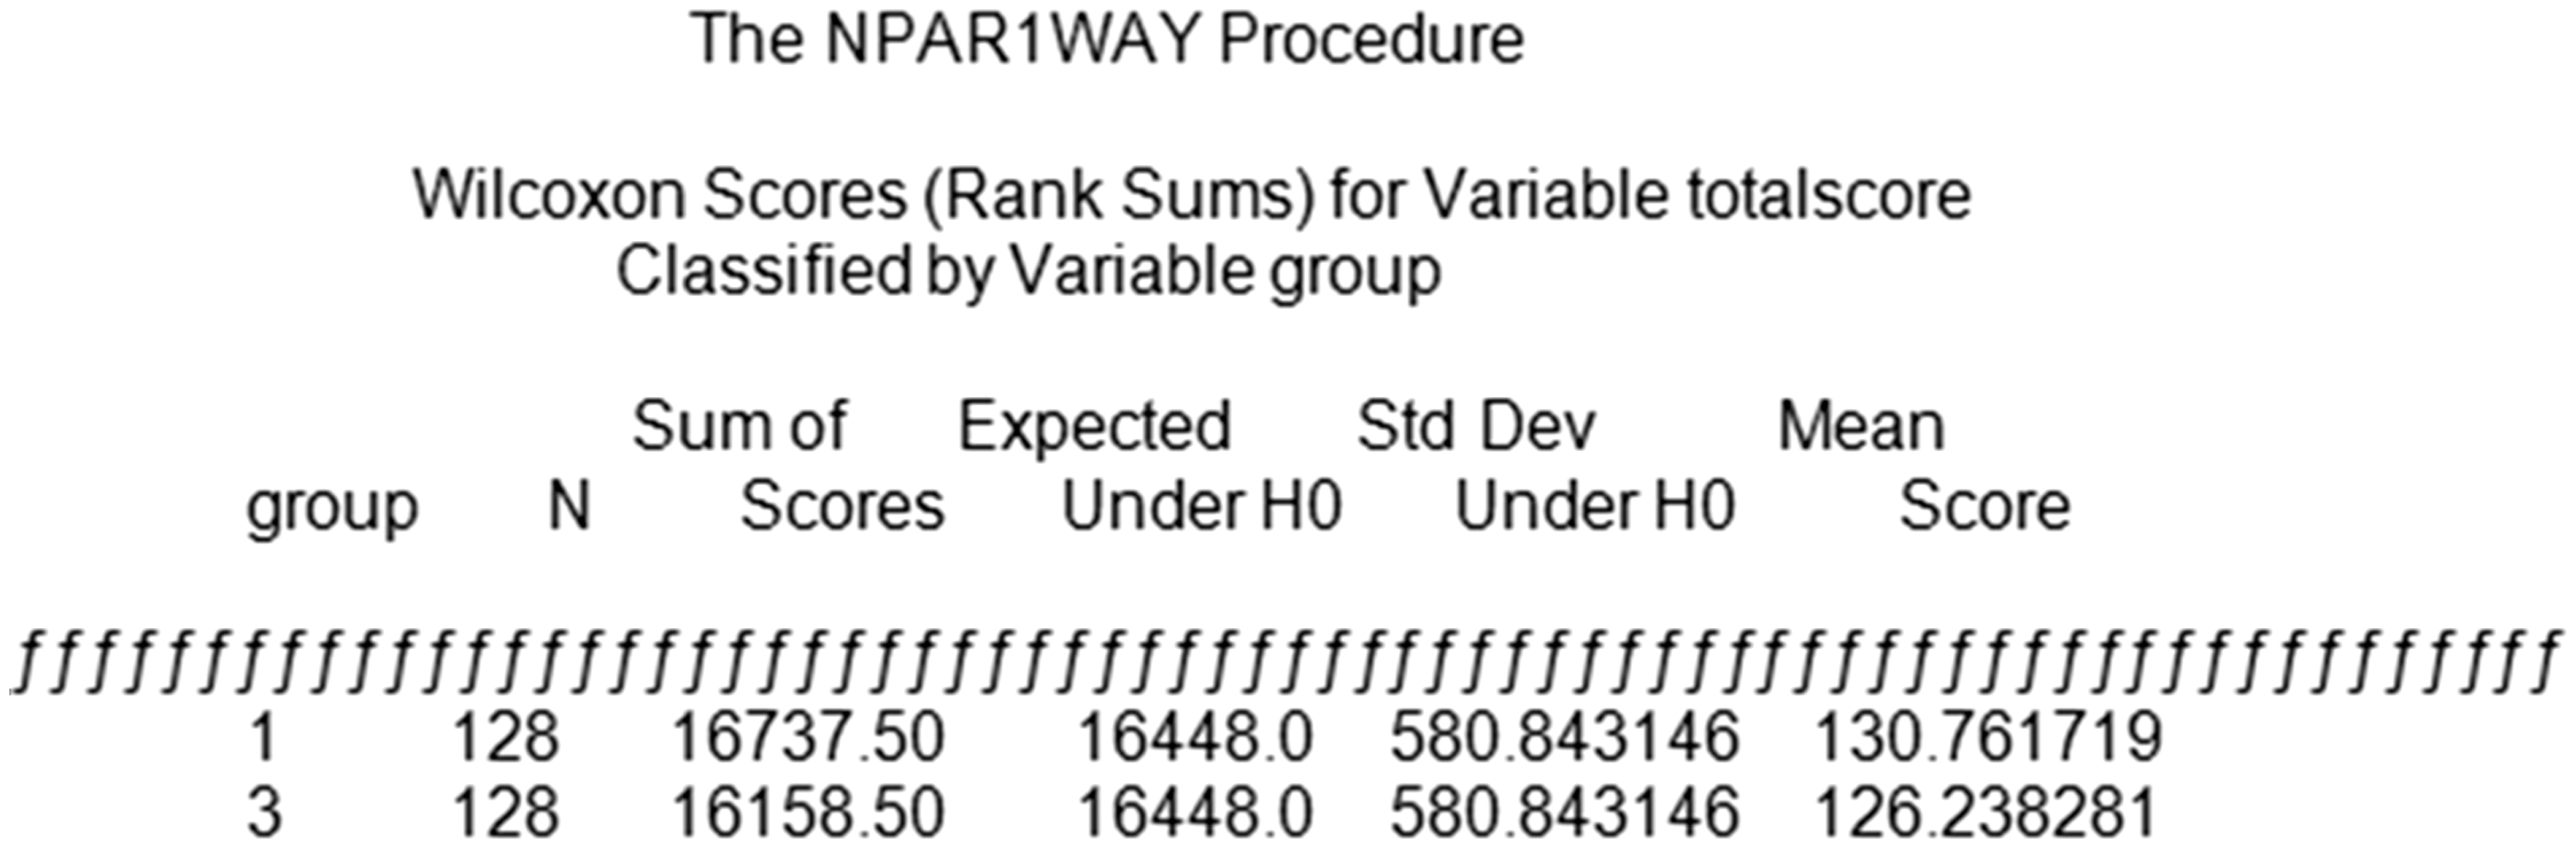
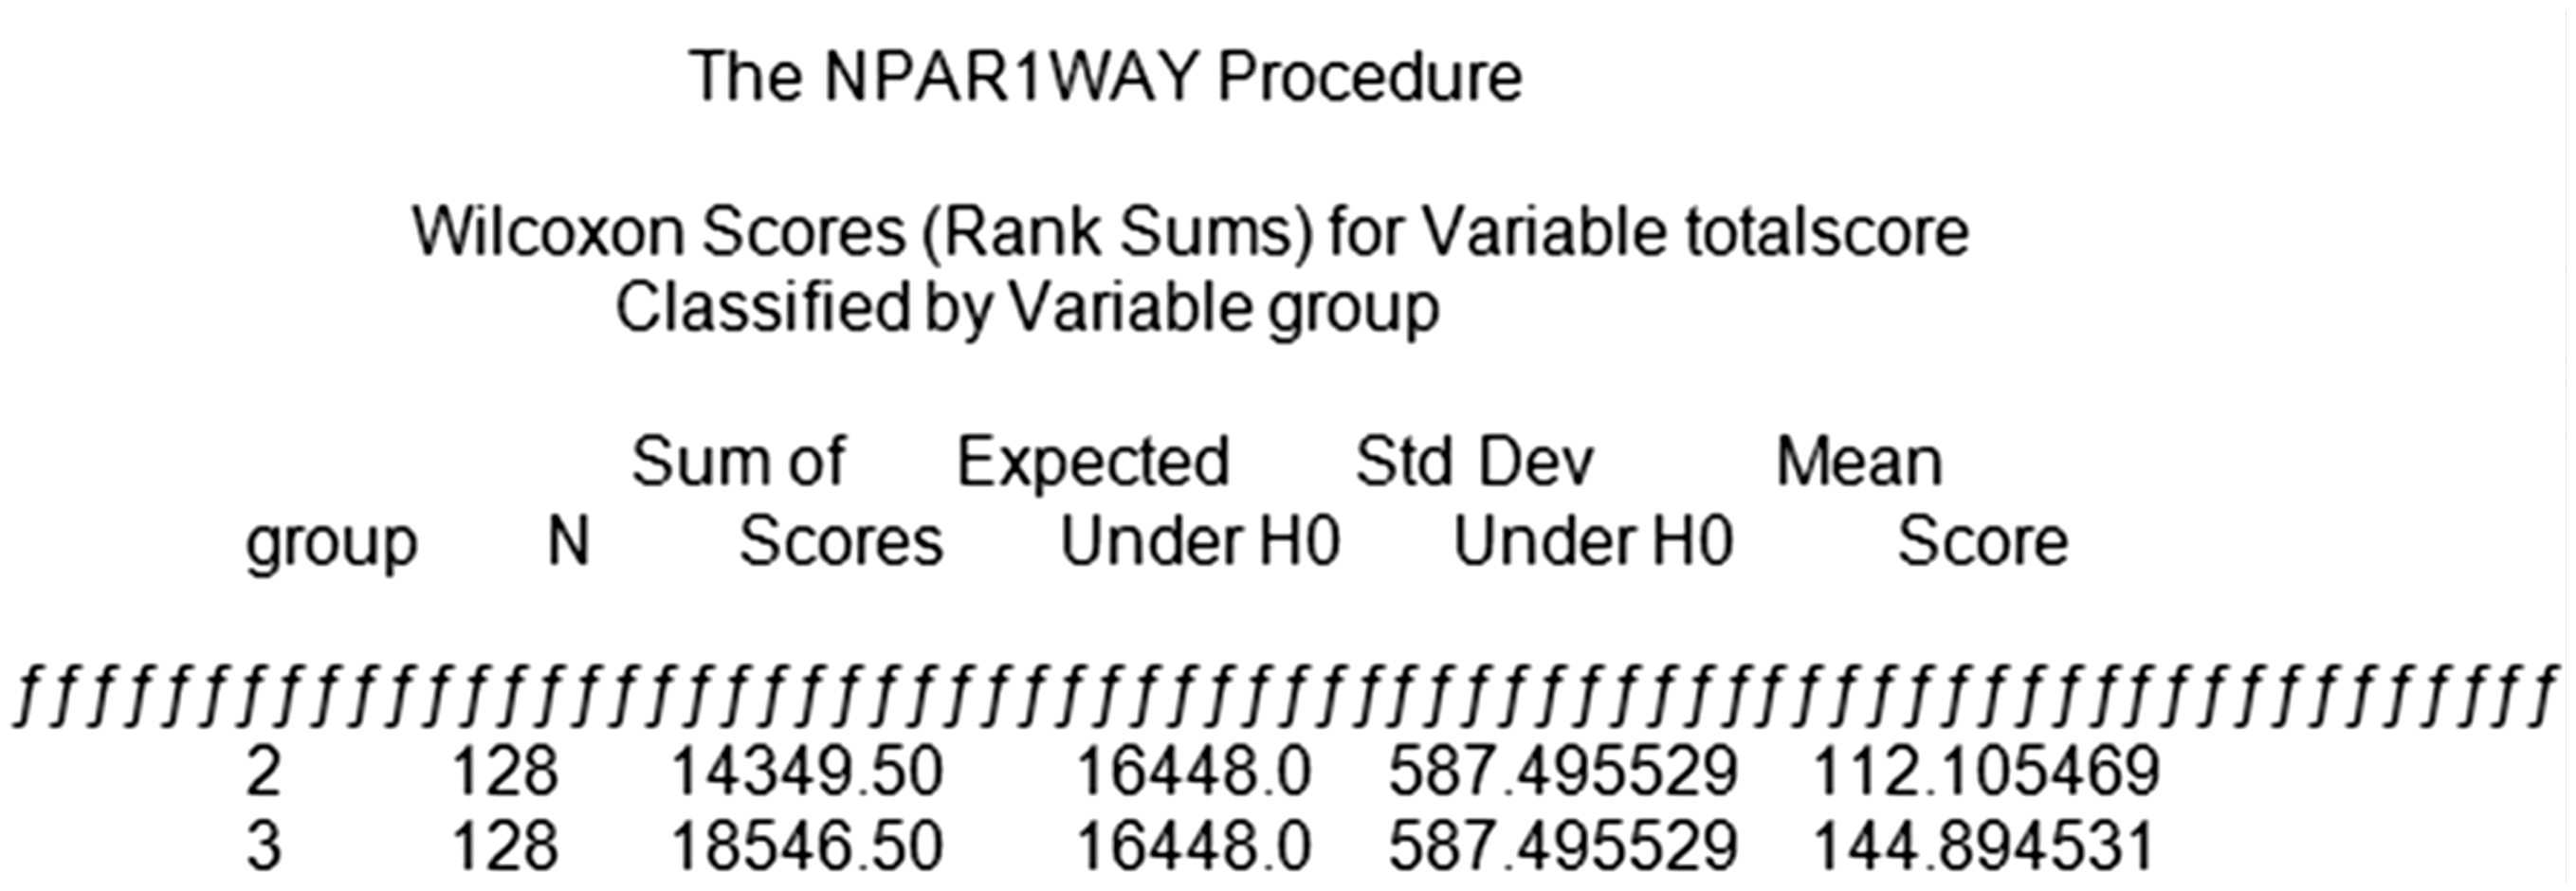
The three groups were compared two by two (such as Group 1 to Group 2; Group 2 to Group 3; and Group 3 to Group 1), in terms of total scores. Based on the normality tests for each of the three groups, the data were not normally distributed. Hence, the Mann Whitney U test (non-parametric for two independent populations) was applied (figures 5, 6 and 7). These results are shown below:
Groups 1 and 2 both show a standard deviation of 587.62 and respective means of 146.80 and 108.18 each. For groups 1 and 3, the standard deviation was 580.84 and respective means of 130.76 and 126.24. For groups 2 and 3, the standard deviation was 587.50 and respective means of 112.11 and 144.89. The Shapiro-Wallis W normality test tables for each of the three groups are illustrated below. The data indicate that all groups were not normally distributed.
For Group 1, z = 4.741. For Group 2, z = 5.971. For Group 3, z = 4.476 (table 8). This data suggest that the normality rate for all three groups varies. However, the data also shows that if the student has additional studying or previous experience, s/he was more likely to understand statistics as a whole.
The data indicate that:
Group 1 > Group 2: Group 1 (First Attempt) does better than Group 2 (Second Attempt). Group 1 = Group 3: Group 1 (First Attempt) equals Group 3 (Not Done Before). Group 2 < Group 3: Group 2 (Second Attempt) is lesser than Group 3 (Not Done Before).
Qualitative analysis: Student analysis
During the post-test, participants were asked to rate the difficulty of the 40 MCQs. Although 62% found the quizzes ‘moderately difficult’ to ‘extremely difficult,’ only three students posted negative comments relating to the difficulty of the quizzes. For instance, according to one student, the quizzes created stress. Another student questioned the relevance of the quizzes to the course content. The final student suggested that s/he was struggling both in the course and to complete the quizzes accurately. The remaining responses were positive regarding the difficulty levels.
Group 1 normality test.
Discussion
For many students, statistics create ‘fear’ and ‘statistical anxiety’ (Hasbrouck et al. 2014; Murtonen and Lehtinen, 2003; Slootmaeckers et al. 2014). Furthermore, overcoming this anxiety is more difficult when students have inadequate abstract reasoning skills (Garfield and Ahlgren, 1988). Thus, the teaching of statistics usually occurs in an ‘arid, context-free landscape’ where students never really engage in or experience ‘statistical thinking’ (Wild and Pfannkuch, 1999: 228) and consequently, become bored or lose confidence. Connecting theory with real-world contexts that students create themselves allows students to understand concepts on their own. This has also been investigated by others (Meyers and Nulty, 2009; Wild and Pfannkuch, 1999).
Group 2 normality test.
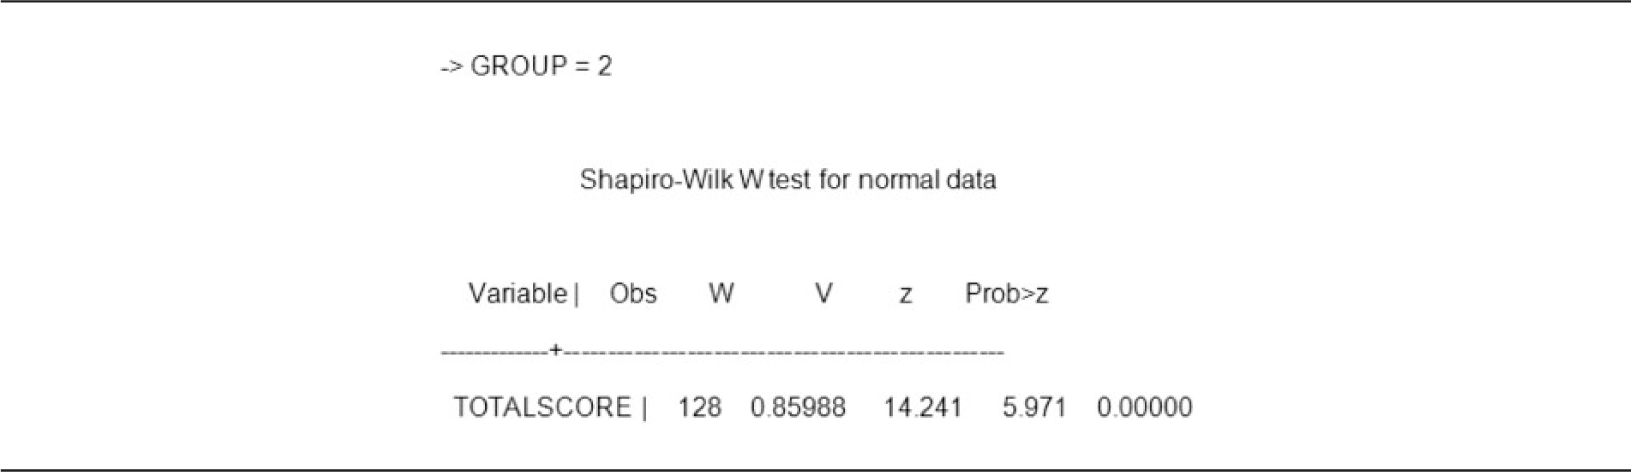
Group 2 normality test.
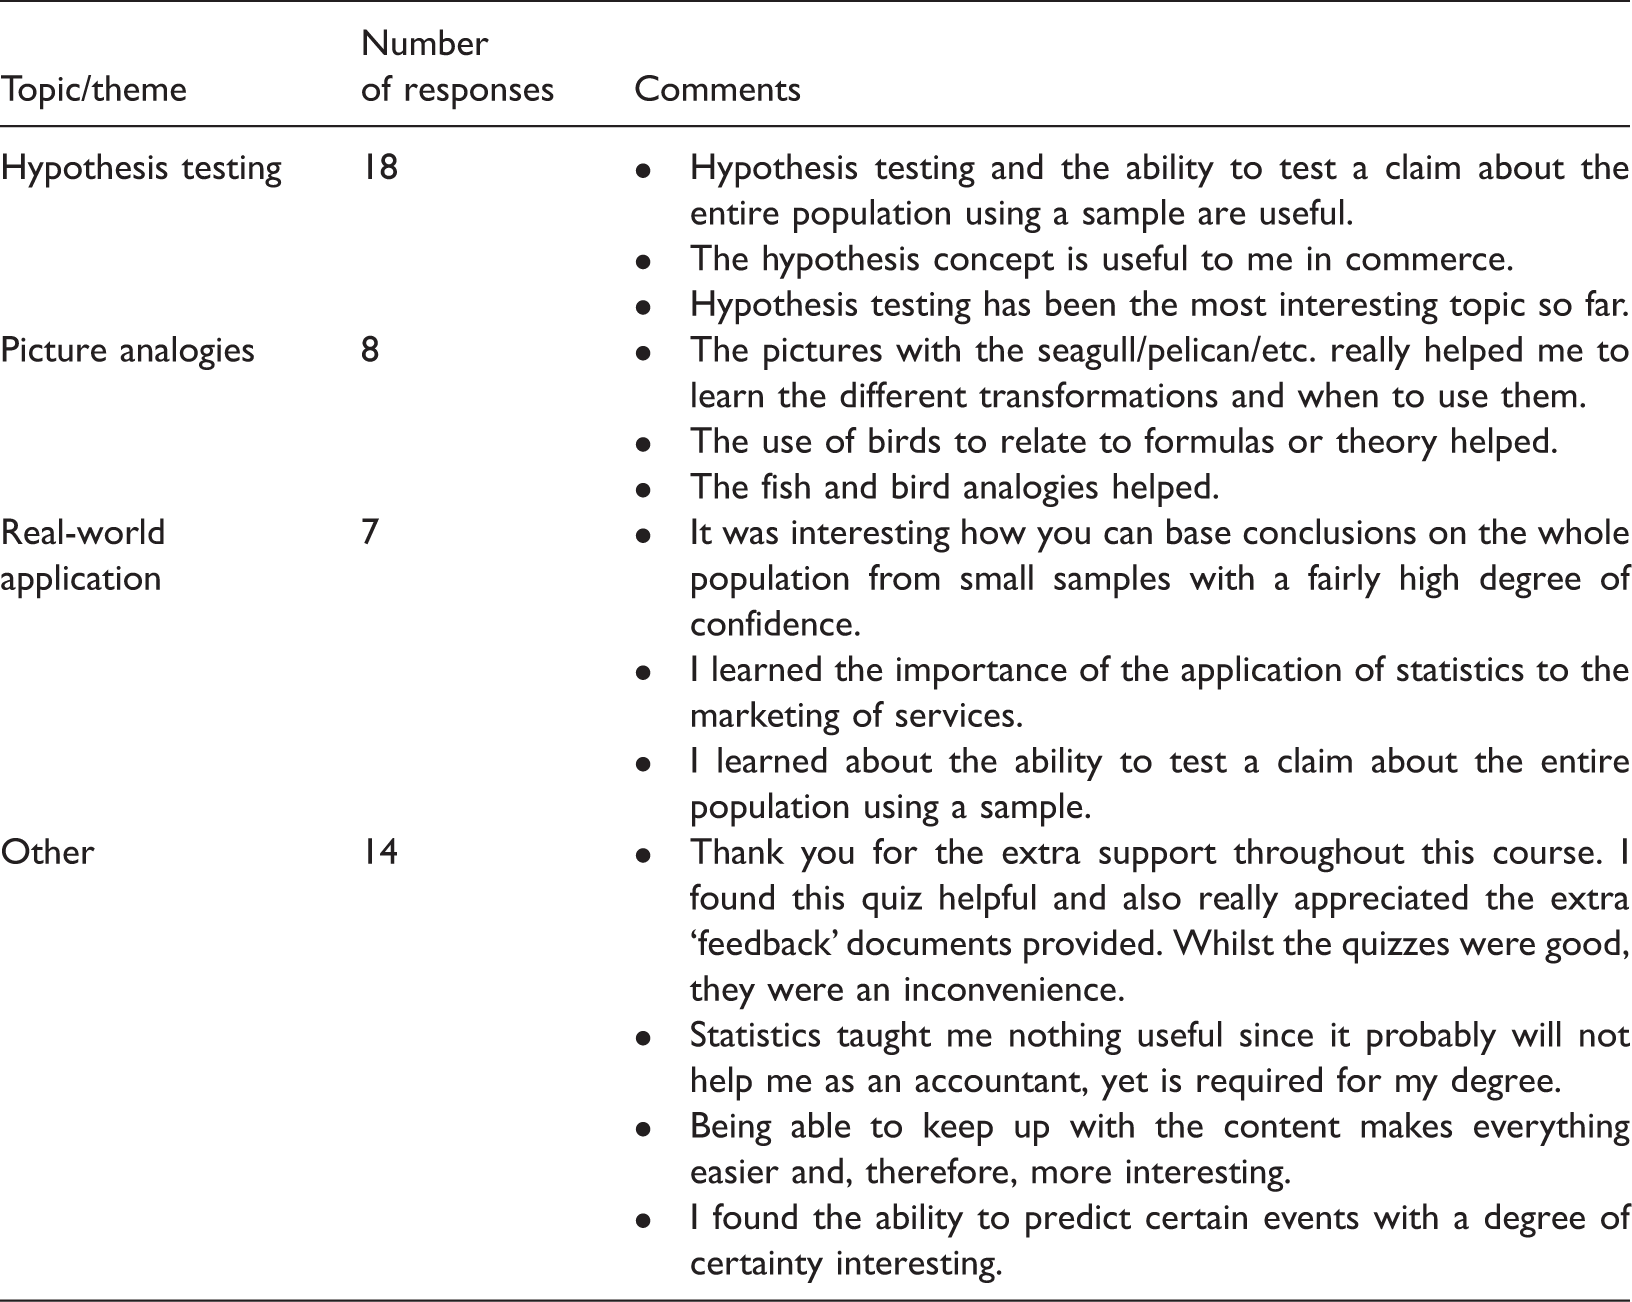
Student responses to ‘What is the most interesting, useful, or valuable thing that you’ve learned so far in this class?’
It was expected that Group 1 would perform better than Group 3, considering the fact that Group 1 completed the pre-test. However, it was found that both groups performed well in the post-test. Furthermore it was suggested that Group 2 would also perform better than Group 3. However, the results show that Group 2 did not perform as well as Group 3. Finally, it was expected that Group 1 would outperform the other groups as it had previous exposure to statistics.
As a result, the data demonstrate that some differences exist in the post-test scores, especially if the student has taken the pre-test. Furthermore, the data demonstrate that students do benefit from previous knowledge, implying that this knowledge may help in some statistical areas which may create a noticeable gap in understanding in contrast to those without prior knowledge. Finally, based on the data, the teaching method appears to have a positive influence on student understanding of subject matter.
Conclusion
It is suggested that these results, as well as a notable increase in attentiveness, enthusiasm and participation, indicate a benefit over traditional didactic teaching-centred styles previously experienced and applied in the authors’ teaching of statistics. However, questions remain regarding why Group 1 or 2 students did not perform better on the post-test than those in Group 3, who only attempted the post-test. Lovett and Greenhouse (2000: 200) suggest that, ‘students do not enter the classroom as blank slates; their prior knowledge can have an impact on their learning’. However, one consideration is that the students’ prior knowledge may not be at a level that is significant enough to help them understand the teaching and manage the cognitive load (Sweller and Chandler, 1994). Therefore, it is possible to attribute the performance of Group 3 to the teaching methodology and the level of prior knowledge for Group 2 students may not have been high enough to make a difference.
Therefore, an innovative approach has been introduced to teaching undergraduate statistics by employing eLearning tools to embed pictorial icons within a problem learning environment to connect learning with real-world practices, and this has resonated with students. This confirms several studies that focus on the relationship between student math skills and course performance, which suggests that grades in previous courses are more related to initial attitudes towards statistics (Carmona et al., 2005; Johnson and Kuennen, 2006; Ramsey; 1999; Ricketts and Berry, 1994). The qualitative data demonstrate that students largely enjoyed the real-world experience of learning statistics in the eLearning environment and related to the pictorial icons. It was also found that student pass rates have risen from 70% in 2009 to 87% in 2010 as a result of this pedagogy. More recently it increased to 90% in 2011 and 2012. Furthermore, student feedback has been positive towards the approach, commonly stating things such as: I really don’t think I’m going to forget anything I learnt in 1310 simply because I understood the content…the concepts complemented each other and everything made perfect sense…I'm much more confident in facing next semester. Thank you for everything, it was a pleasure being one of your students and ECON1310 was most definitely my favourite subject.
It is important to design courses in a way that discourages learners from limiting themselves to surface learning but instead stimulates in-depth learning. An outcome of the author’s approach is that trans-disciplinary education application is possible. Practice found that these innovative interactive eLearning resources gave students guidance as they worked independently and interactively through different stages of problem solving as they explored the problem space. Moving away from a traditional teacher-centred teaching approach to a student-focused approach embedded in technology has helped influence, motivate and inspire students, who can apply theory to function effectively in the corporate environment as independent and proactive professionals.
Recommendations for future research
A future study could explore the achievement differences between students who were enroled in a traditional statistics class and those who were exposed to eLearning in statistics. A broader study would be applied across multiple institutions and across a number of tools, perhaps eventually developing a framework for implementation.
An additional study could employ the techniques outlined in this paper in a university course other than statistics to test the transferability of the lessons learned here. Such a study would test the hypothesis that this manuscript’s conclusions could be generalized to a variety of educational settings and a broad range of disciplines.
Footnotes
Funding
This research received no specific grant from any funding agency in the public, commercial, or not-for-profit sectors.