
Abstract
Bamboo–timber composite columns hold significant promise as bio-based structural elements. However, research in this area remains limited, especially concerning modern buckling analysis methods that incorporate bio-based constitutive models of engineered bamboo and timber materials. This study aims to address this gap by proposing a proof-of-concept analytical framework based on component-based strategy for buckling analysis, utilising piecewise bio-based material constitutive models as the guide rail for its strain-stage-based component split-up. Preliminary experimental validation was performed to evaluate the feasibility of using component-based analysis to estimate the overall buckling resistance of both composite and non-composite bamboo and timber columns. This initial study offers an alternative analytical approach for estimating the buckling resistance of bio-composite columns and establishes a set of conceptual guidelines and indicative parameters for the experimental design of future research.
Introduction
Bamboo and timber are gaining attraction as popular construction materials, especially in frame systems for buildings, sparking considerable research interest. Previous studies have focused on various aspects, such as timber joist shear resistance,1,2 torsional behaviours,3–13 timber gridshell structures,14–18 timber liquid containers,19,20 calibrations of timber mechanical properties with photogrammetry method,21–23 round bamboo beams 24 and bamboo–concrete composite beams. 25 These investigations reflect the growing exploration and application of bamboo and timber in diverse structural contexts, underscoring the need for continued research and development in this field. While softwood is more readily available than bamboo in some regions, bamboo can effectively reinforce softwood, resulting in sturdy, cost-effective, and aesthetically pleasing structural elements. This trend has also spurred researchers to explore innovative technologies like bio-flitch beams, 26 bamboo–concrete composite structures 27 and bio-based prestress technology. 28 However, most of these studies are focused on the flexural capacity of the bamboo- or timber-based beam elements, very few studies focused on bamboo–timber composite structural members.
Columns, as integral components of structural frame systems, are garnering growing attention from the research community. Currently, many scholars have conducted in-depth research on the application of engineered bamboo in compression-bending components. Liu et al. 29 studied the deformation behaviour of three types of reconstituted bamboo columns under axial loads, finding that only solid columns experienced instability failure, while hollow and I-shaped columns experienced debonding failure. Wei et al. 30 established a well-fitting stress–strain relationship model for reconstituted bamboo through uniaxial tensile and compressive tests. Li et al., Dong et al., Su and Zhou,31–35 analysed three failure modes of laminated bamboo lumber (LBL), bamboo scrimber columns under axial compression and established a stress–strain relationship model, proposing a method for calculating the ultimate bearing capacity of LBL columns. Su et al. 36 produced and tested 21 glued bamboo hollow columns of different slenderness ratios, finding that slenderness ratio was the main factor affecting the experimental values and errors and established a model for calculating the axial compressive ultimate bearing capacity of glued bamboo hollow columns based on the macroscopic shear angle.
Bamboo–timber composite columns hold great promise as sustainable structural components, yet there has been relatively little research in this specific area compared to studies on pure timber or bamboo columns. This study aims to bridge this gap by conducting preliminary experimental trials focused on investigating the axial compression behaviour of different column types: laminated bamboo, pure timber, and bamboo–timber composite columns. The primary objective is to gather valuable data through these experiments, which will serve as an initial dataset for informing and guiding future larger-scale experimental studies. By examining how these columns perform under axial compression, we can better understand their structural characteristics and potential applications in construction.
This study focuses on bamboo–timber composite columns, designed with engineered bamboo distributed on the outermost section and wood as the core material. While the cross-sectional form of composite columns differs significantly from that of hollow columns, they share many advantages. Although there has been considerable research on timber and bamboo structures domestically and internationally, research on the performance of bamboo–timber composite structures is limited. Moreover, this research goes beyond experimentation by developing an initial analytical model specifically tailored to estimate the axial compression capacities of bamboo–timber composite columns. This analytical framework will contribute to a deeper theoretical understanding of these composite structures and aid in their practical implementation in the field of structural engineering. The paper will primarily focus on experimental research aimed at determining the bearing capacity of bamboo–timber composite axial compression members.
Ultimately, this study lays the groundwork for advancing the knowledge base surrounding bamboo–timber composite columns, paving the way for broader applications and innovations in sustainable construction practices.
Basic material properties
Physical properties
In this study, Moso bamboo (Phyllostachys edulis) materials were sourced from four-year-old forests in Jiangxi Province, China. The typical diameter of the bamboo culm is around 100 mm, and the typical wall thickness at the middle section of the culm is around 11 mm. The raw bamboo underwent standard processing steps including cutting, planning, drying, sanding, gluing, assembling and cold pressing to create the necessary test samples. The bamboo materials were obtained from a consistent supplier previously utilised by the authors. For detailed information on the processing procedures, refer to the work by Zhang et al. 28
TC13-B European spruce, imported from Sweden, with C18 strength grade was used in this study. The original lumber size was 5100 mm × 150 mm × 50 mm before being sawn and planed into the desired glulam timber board size of 20 mm × 100 mm × 1300 mm. Total of six clear samples with size of 20 mm × 20 mm × 20 mm were cut randomly from the same batch of the wood for measuring the moisture content and density.
The manufacturing process closely resembles that of the bamboo–timber composite beam prepared in the authors’ previous study, utilising the same type of glue and press configurations. For further details, please refer tothe work by Zhang et al. 28 for brevity.
For the determination of moisture content and density of laminated bamboo, which is formed by cold-pressing stacked individual bamboo pieces, since there are no specific standard regulations available temporarily, the requirements from Chinese standards37,38 are adopted. Same as timber, a total of six clear samples with size of 20 mm × 20 mm × 20 mm were cut randomly from the same batch of the wood for measuring the moisture content and density.
The next steps involved labelling a total of 12 samples and measuring their initial volume and weight within an environment set at a temperature of 20 ± 2 °C and relative humidity of 65 ± 3% RH. Subsequently, the samples were collectively placed inside an oven and subjected to an 8-h drying period at a temperature of 103 ± 2 °C. At 2-h intervals during this period, two samples each of laminated bamboo and wood were alternately chosen for weighing. This process was repeated until the difference between the successive weight measurements was less than 0.5% of the sample's initial mass. This indicated that the samples had achieved a completely dry state (Figure 1). The weight of each fully dried sample was then recorded, and the results of the tests are presented in Tables 1 and 2. The dimensions of the samples after oven-dry were not recorded.
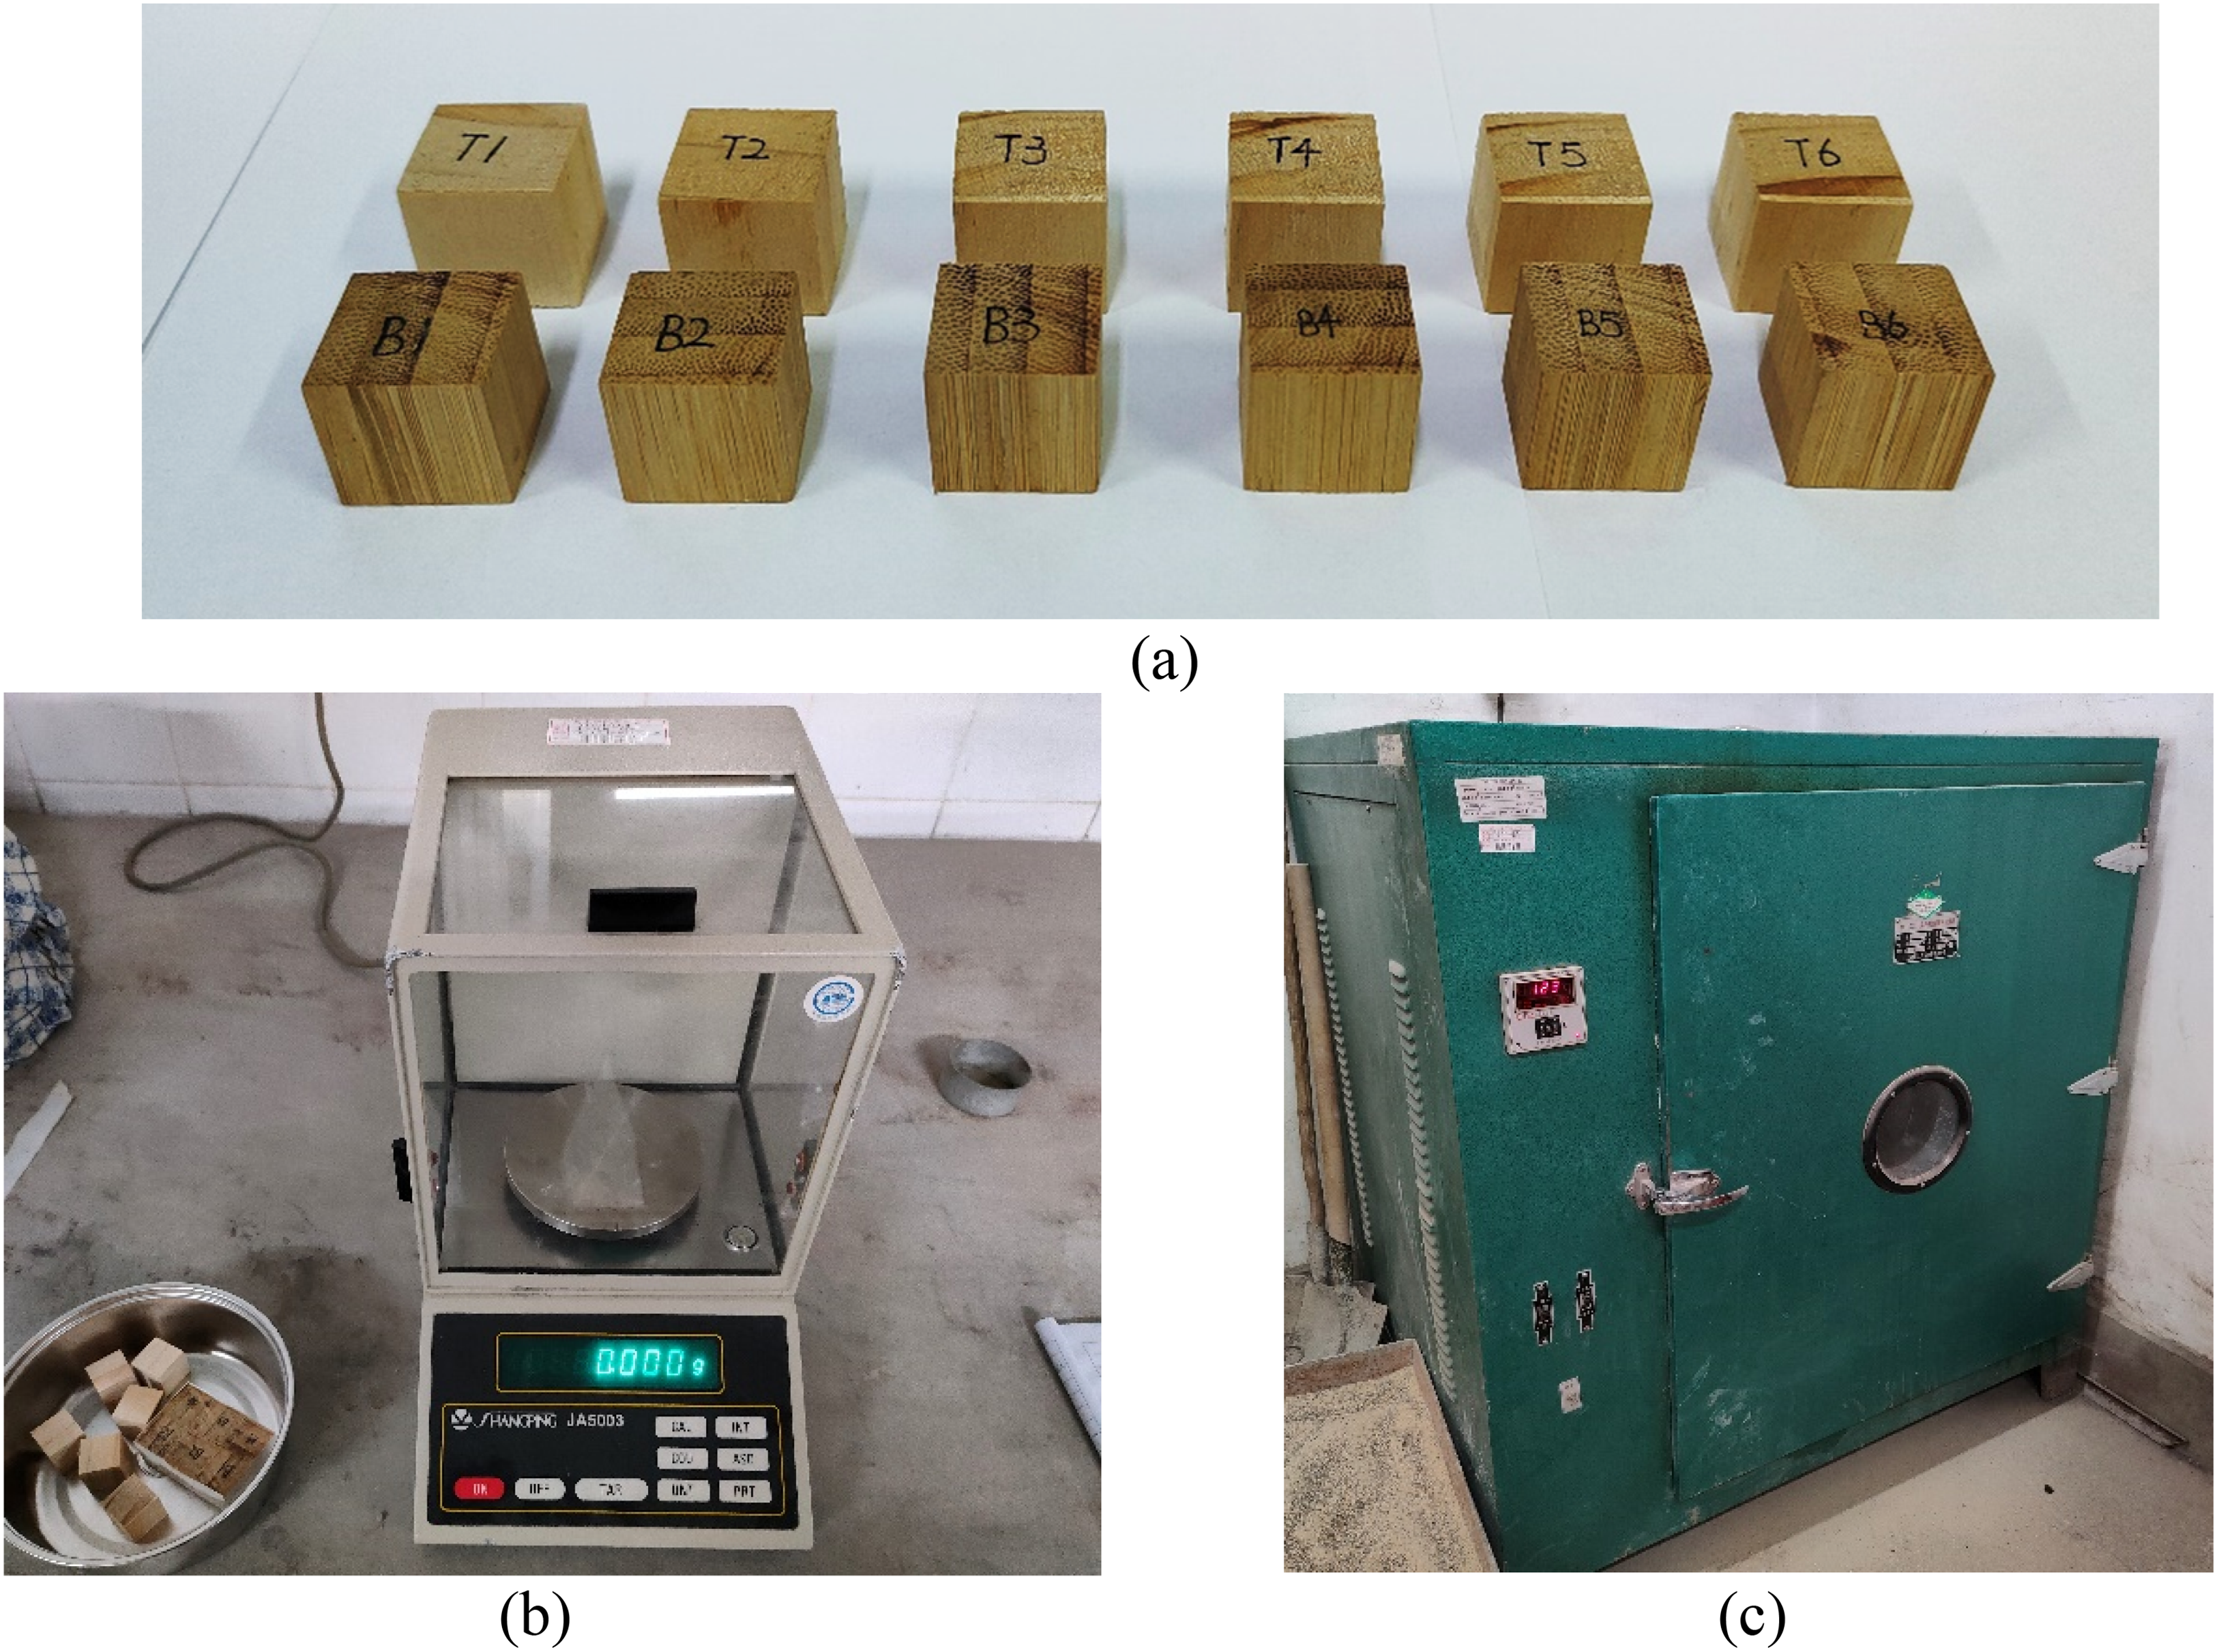
Sample density and moisture measurement. (a) Samples for physical properties test. (b) Sample weighing. (c) Sample drying.
Density of laminated bamboo and timber.

Note:
Moisture content of laminated bamboo and timber.
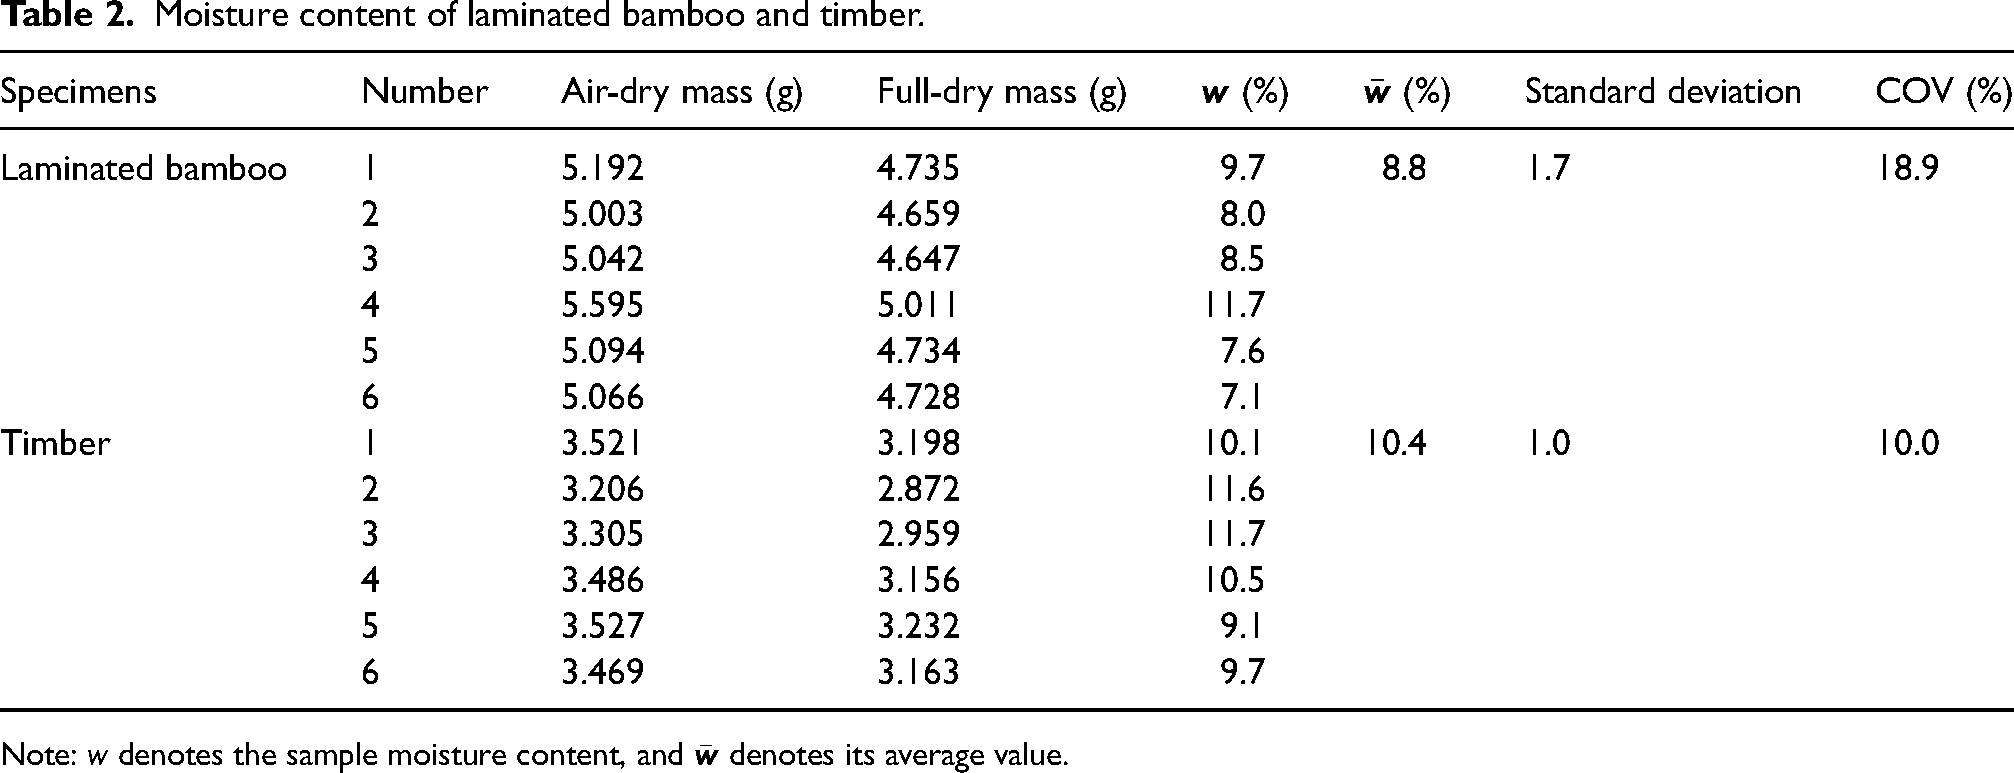
Note: w denotes the sample moisture content, and
Mechanical properties
As shown in Figure 2, in accordance with the BS 373-1957, 39 a total of six samples for both laminated bamboo and timber were prepared from the same batch of laminated bamboo and timber used in this study, with dimensions of 50 mm × 50 mm × 200 mm, for conducting longitudinal compression tests. The samples were required to have smooth, flat ends perpendicular to the grain.
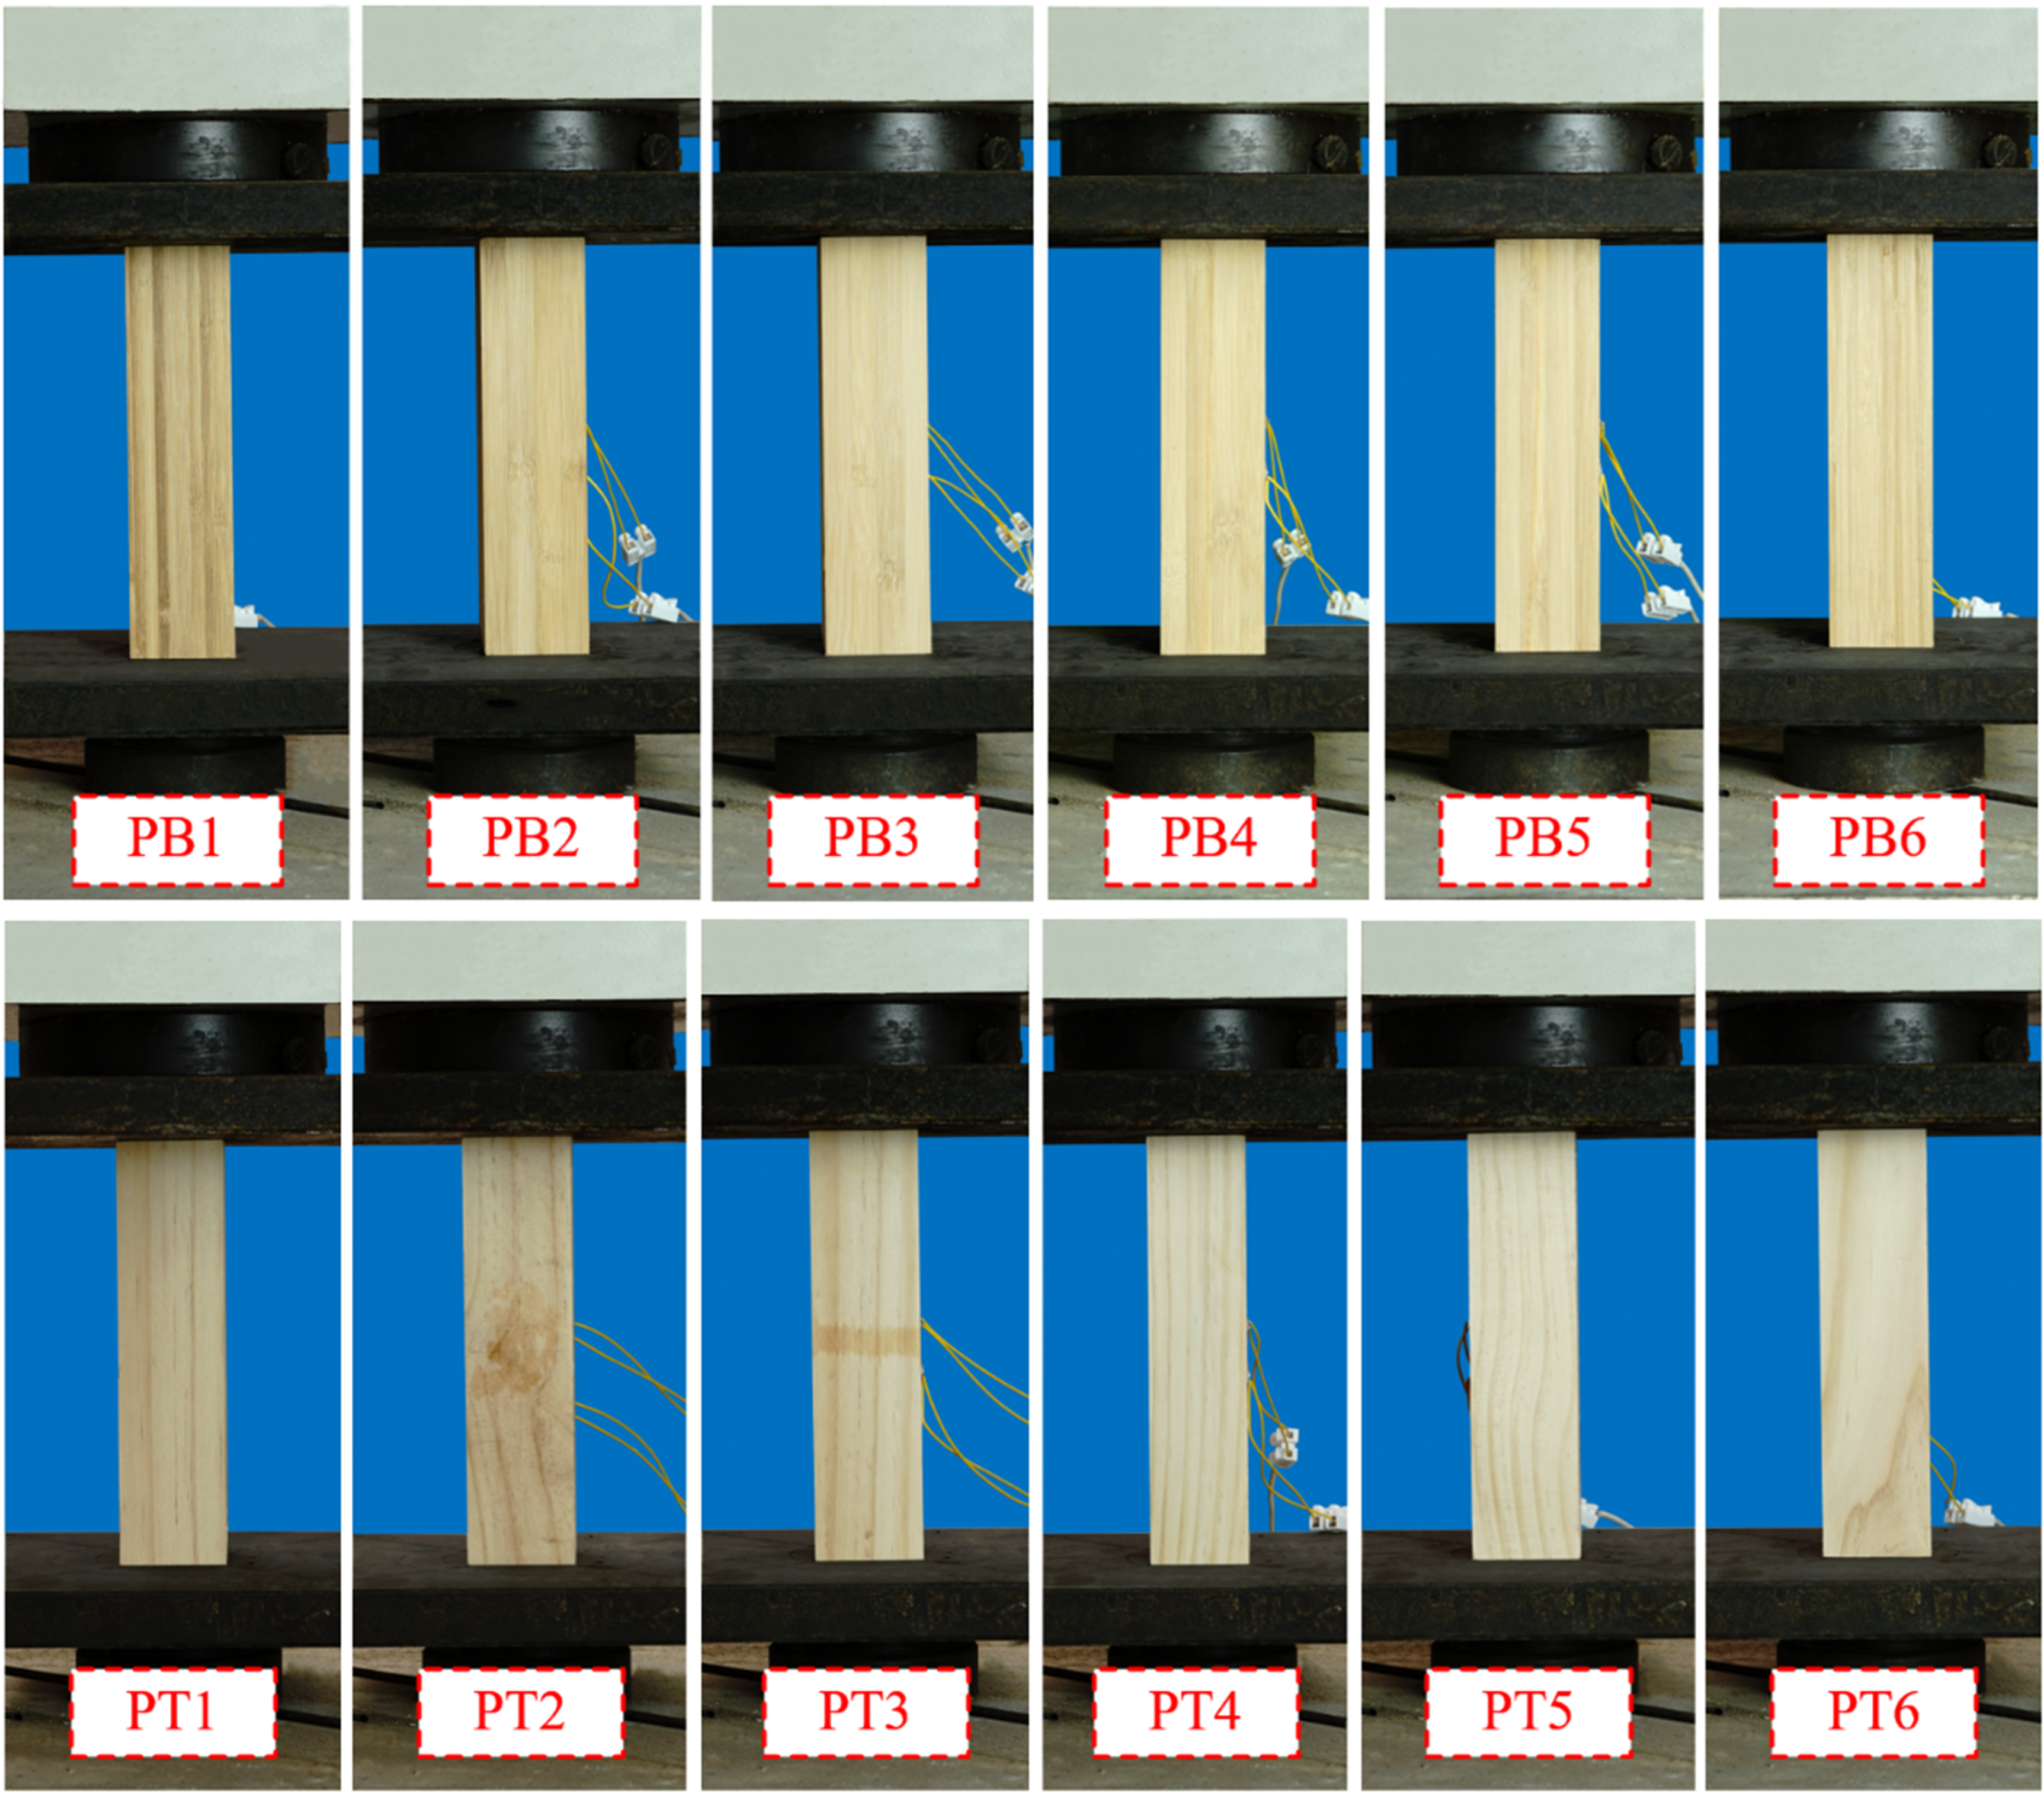
Samples of compression test.
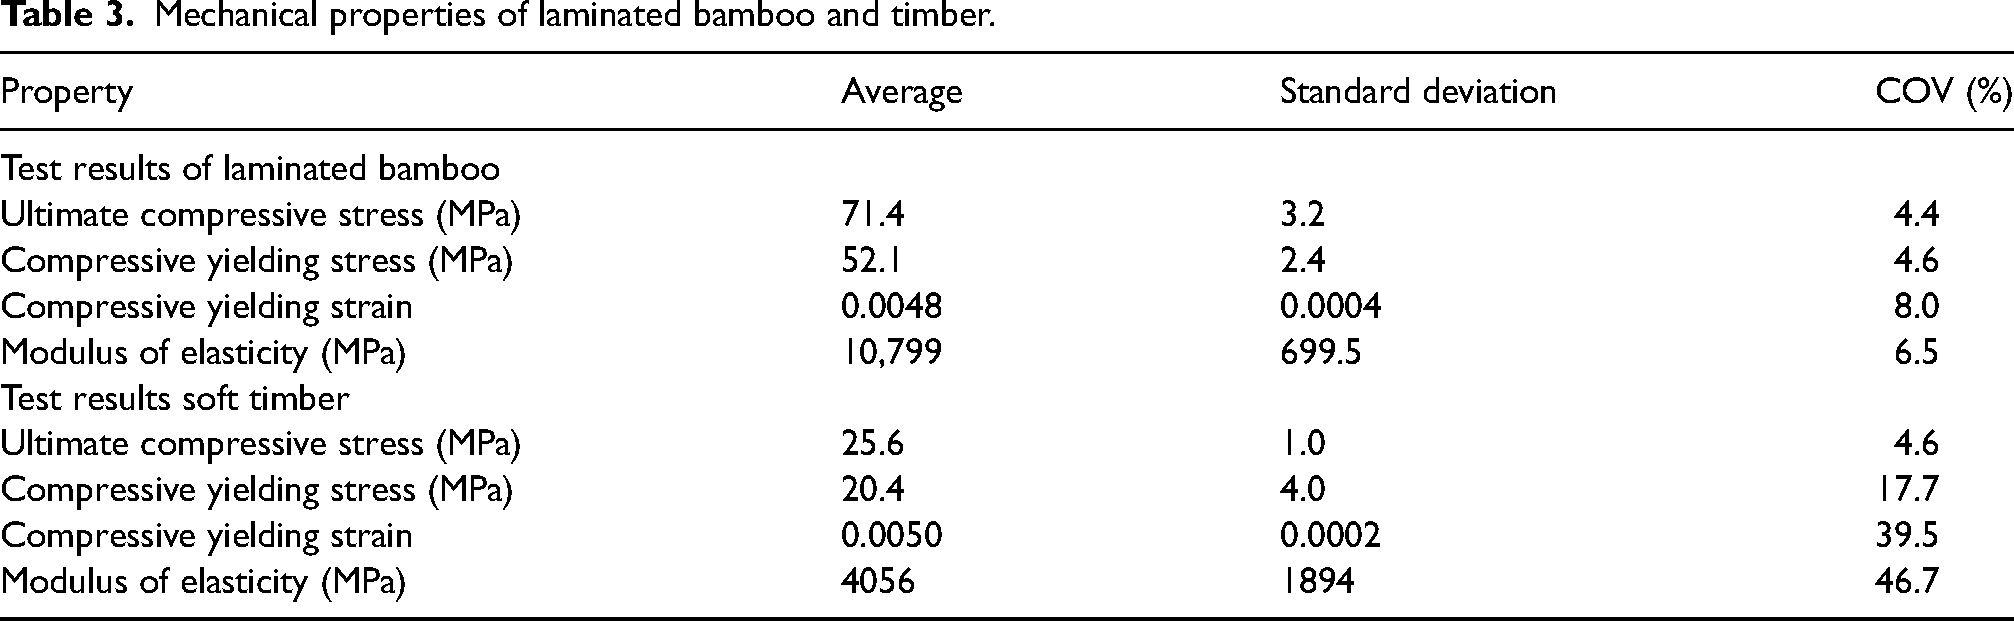
Compression loading was applied to the samples using a displacement control method at a rate of 0.6 mm/min. Strain gauges were positioned along the midspan of each sample in the direction of the grain to capture strain data during the process of resisting compressive loads. The test results are then used to determine the yielding and ultimate stress and strain values following a trilinear model proposed in section ‘Determination of simplified tangent modulus’. The estimated values are presented in Table 3.
Mechanical properties of laminated bamboo and timber.
Experimental design
Sample preparation
In the research of the critical load for slender columns subjected to axial compression, the Euler formula is applicable.
The laminated bamboo and wood material were cut into 20 mm thick boards and combined using water-based polyurethane structural adhesive to form three different cross-sectional shapes of column samples. These columns were 100 mm × 100 mm × 1200 mm in size, as shown in Figure 3. The column samples were numbered according to their different cross-sectional shapes: pure laminated bamboo column (B-C), composite column (C-C) and timber column (T-C). Among these, B-C and T-C are composed of a single material. In the subsequent description of their combined behaviour, they are collectively referred to as ‘single columns’. Similarly, samples composed of a composite combination of bamboo and wood are referred to as ‘composite columns’.
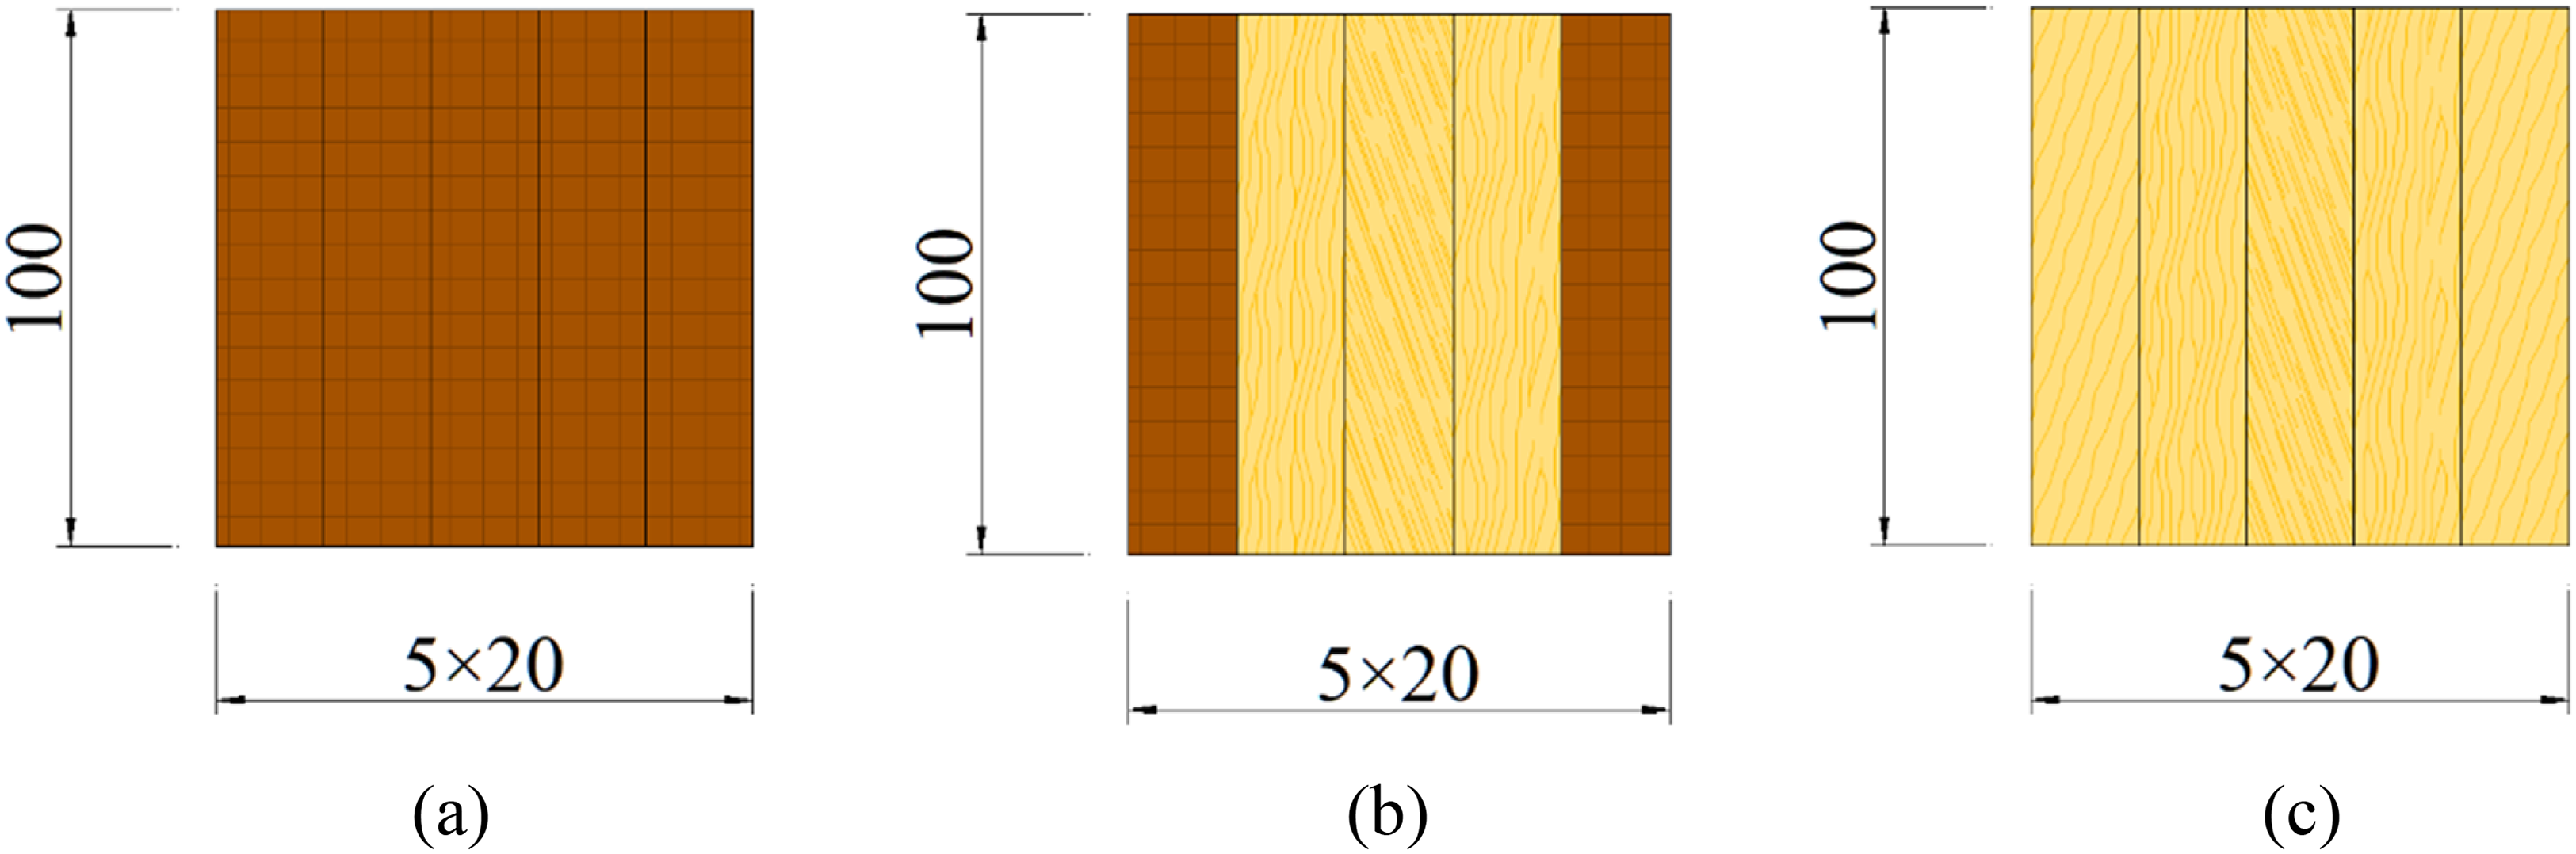
Cross-section form. (a) B-C. (b) C-C1 & C-C2. (c) T-C.
The first letter of the sample number represents the composition of the column's cross-section: ‘B’ stands for ‘bamboo’, ‘C’ stands for ‘composite’, and ‘T’ stands for ‘timber’. The second letter is ‘C’, representing ‘column’. The experimental design includes two identical columns grouped as duplicates, numbered C-C1 and C-C2.
Loading apparatus and mechanism
To thoroughly investigate the impact of various cross-sectional shapes on the axial compressive capacity of columns, this experiment utilised notch supports to constrain column samples at a state of critical instability in relation to their buckling direction. A hydraulic loading system, YBD350-200, with a maximum capacity of 350 kN was used to apply the load.
The samples were linked to the loading system through unidirectional knife-edge hinges and aligned using a laser level to ensure the central point of the sample coincided with the centre of the loading end along a vertical axis. Employing physical cantering methods, a preloading force of 20 kN was applied to the samples. The strain values at the mid-span of the samples were monitored, and the sample positions were adjusted as needed until the observed strain values differed from the average value by no more than 5%. This adjustment aimed to prevent significant initial eccentricity. The testing procedure implemented a gradual load control strategy, advancing in increments of 10 kN. After each increment, the load was maintained for 30–60 s before proceeding to the subsequent increment.
As shown in Figure 4, at the mid-span positions of each sample, a total of nine strain gauges labelled S1 to S9 were affixed along the W, N, and E directions to observe strain growth behaviour. Strain gauges on the W and E surfaces were positioned at equally spaced points, while for the N surface, different arrangements were made for single columns and composite columns. To better observe the bonding and slip behaviour at the interface between laminated bamboo and wood, the strain gauge positions were situated as close to the adhesive layer as possible. Hence, the positions of S3, S4, S6 and S7 were shifted by 5 mm from the layer centre toward the interface. Due to the constraint characteristics of the notch supports, when the column samples became unstable, they would only buckle towards the E or W direction. To monitor lateral deflections of the samples, three displacement sensors were positioned at equally spaced points on the E surface. The complete layout of the loading apparatus and measurement points is shown in Figure 5.
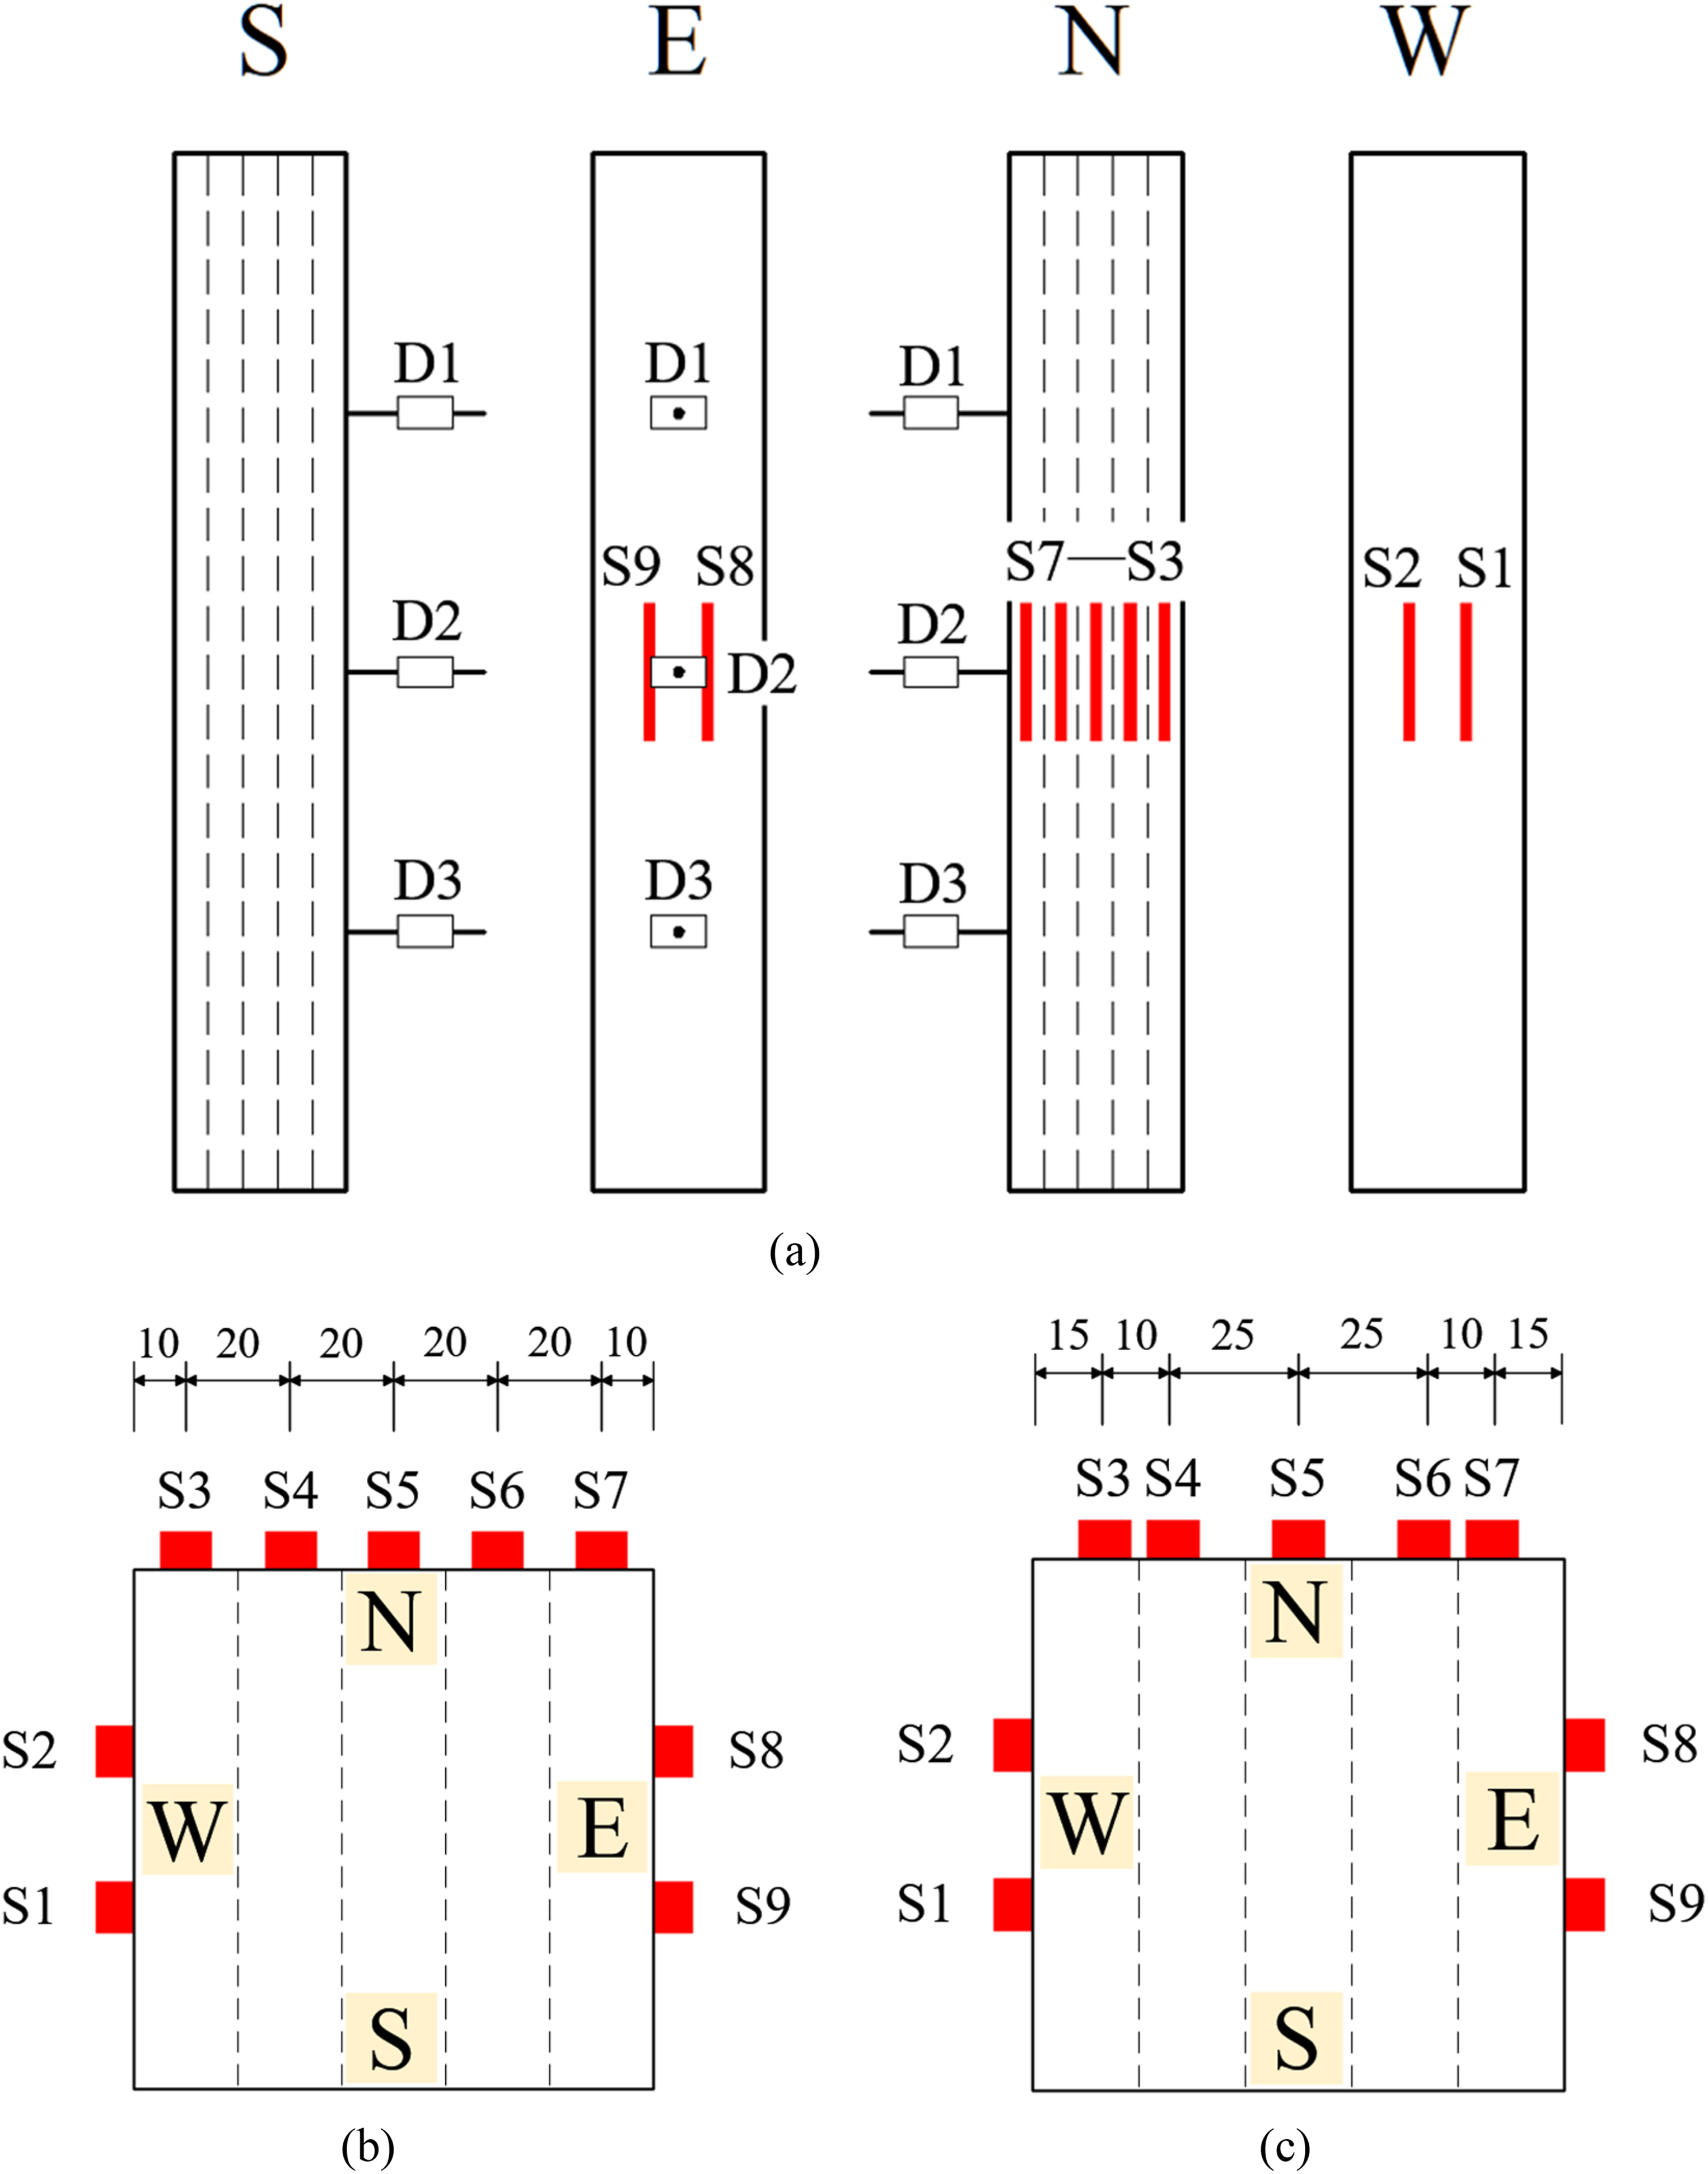
Measuring points arrangement. (a) Strain gauges and LVTDs arrangement. (b) Single column. (c) Composite column.
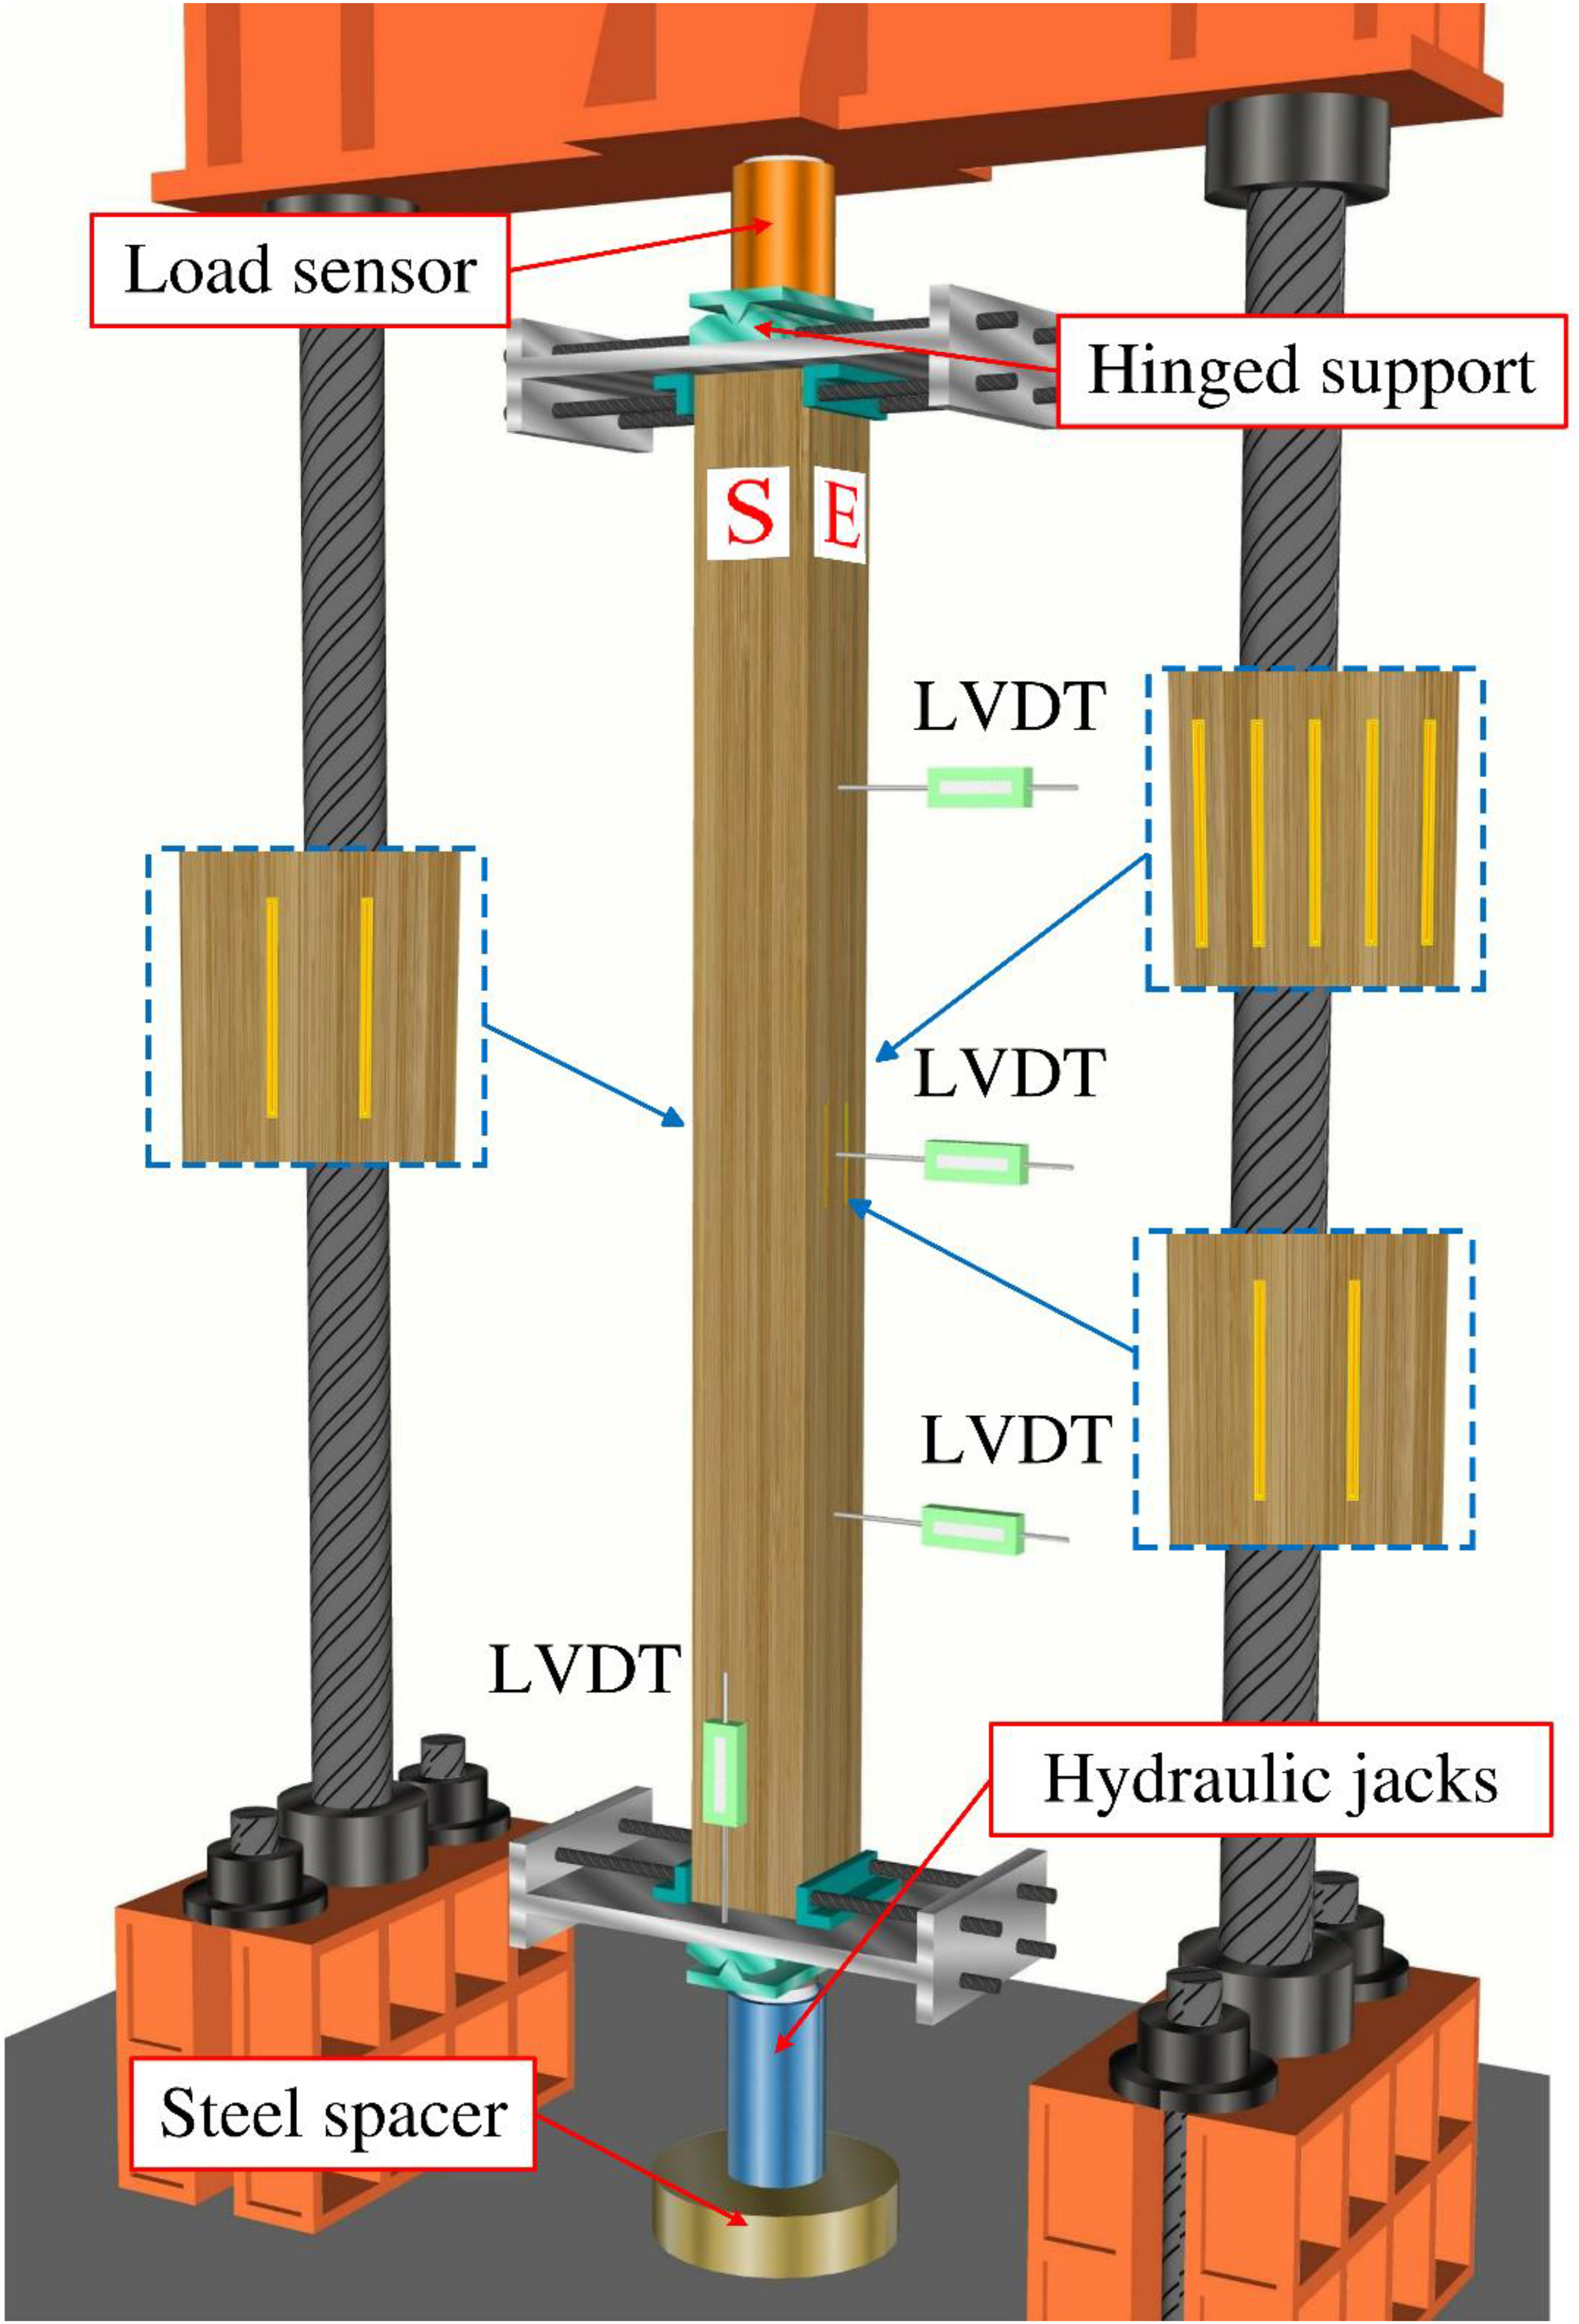
3D diagram of the test.
Experimental results and analysis
The aim of this preliminary study is to establish a set of conceptual guidelines and indicative parameters for the experimental design of subsequent studies and to pilot the validation of the proposed component-based analytical model for the buckling analysis of laminated bamboo and solid timber composite columns. This model is the first model to consider the trilinear constitutive relationship of bio-based materials. However, as a pilot study with limited resources, the experimental aim is to provide a benchmark reference rather than a statistically robust range of values. Consequently, the test results discussed here are intended to identify reference values, not to serve as quantitative guidance for practical design.
Typical failure modes
As shown in Figure 6 and Table 4, three failure modes (Mode A, B, C) were observed for axially loaded columns, each corresponding to different cross-sectional shapes of the column samples. In Mode A, the sample had poor flexural capacity, and can only develop into small curvature before failure, resulting in small stress increments from bending. The material within the compression zone hardly experienced yielding, with most of it remaining in the elastic range. As the buckling progressed, the material on the outer side of the tension zone was pulled apart, and a crack propagated instantaneously through the entire cross-section, leading to a sudden and brittle failure.
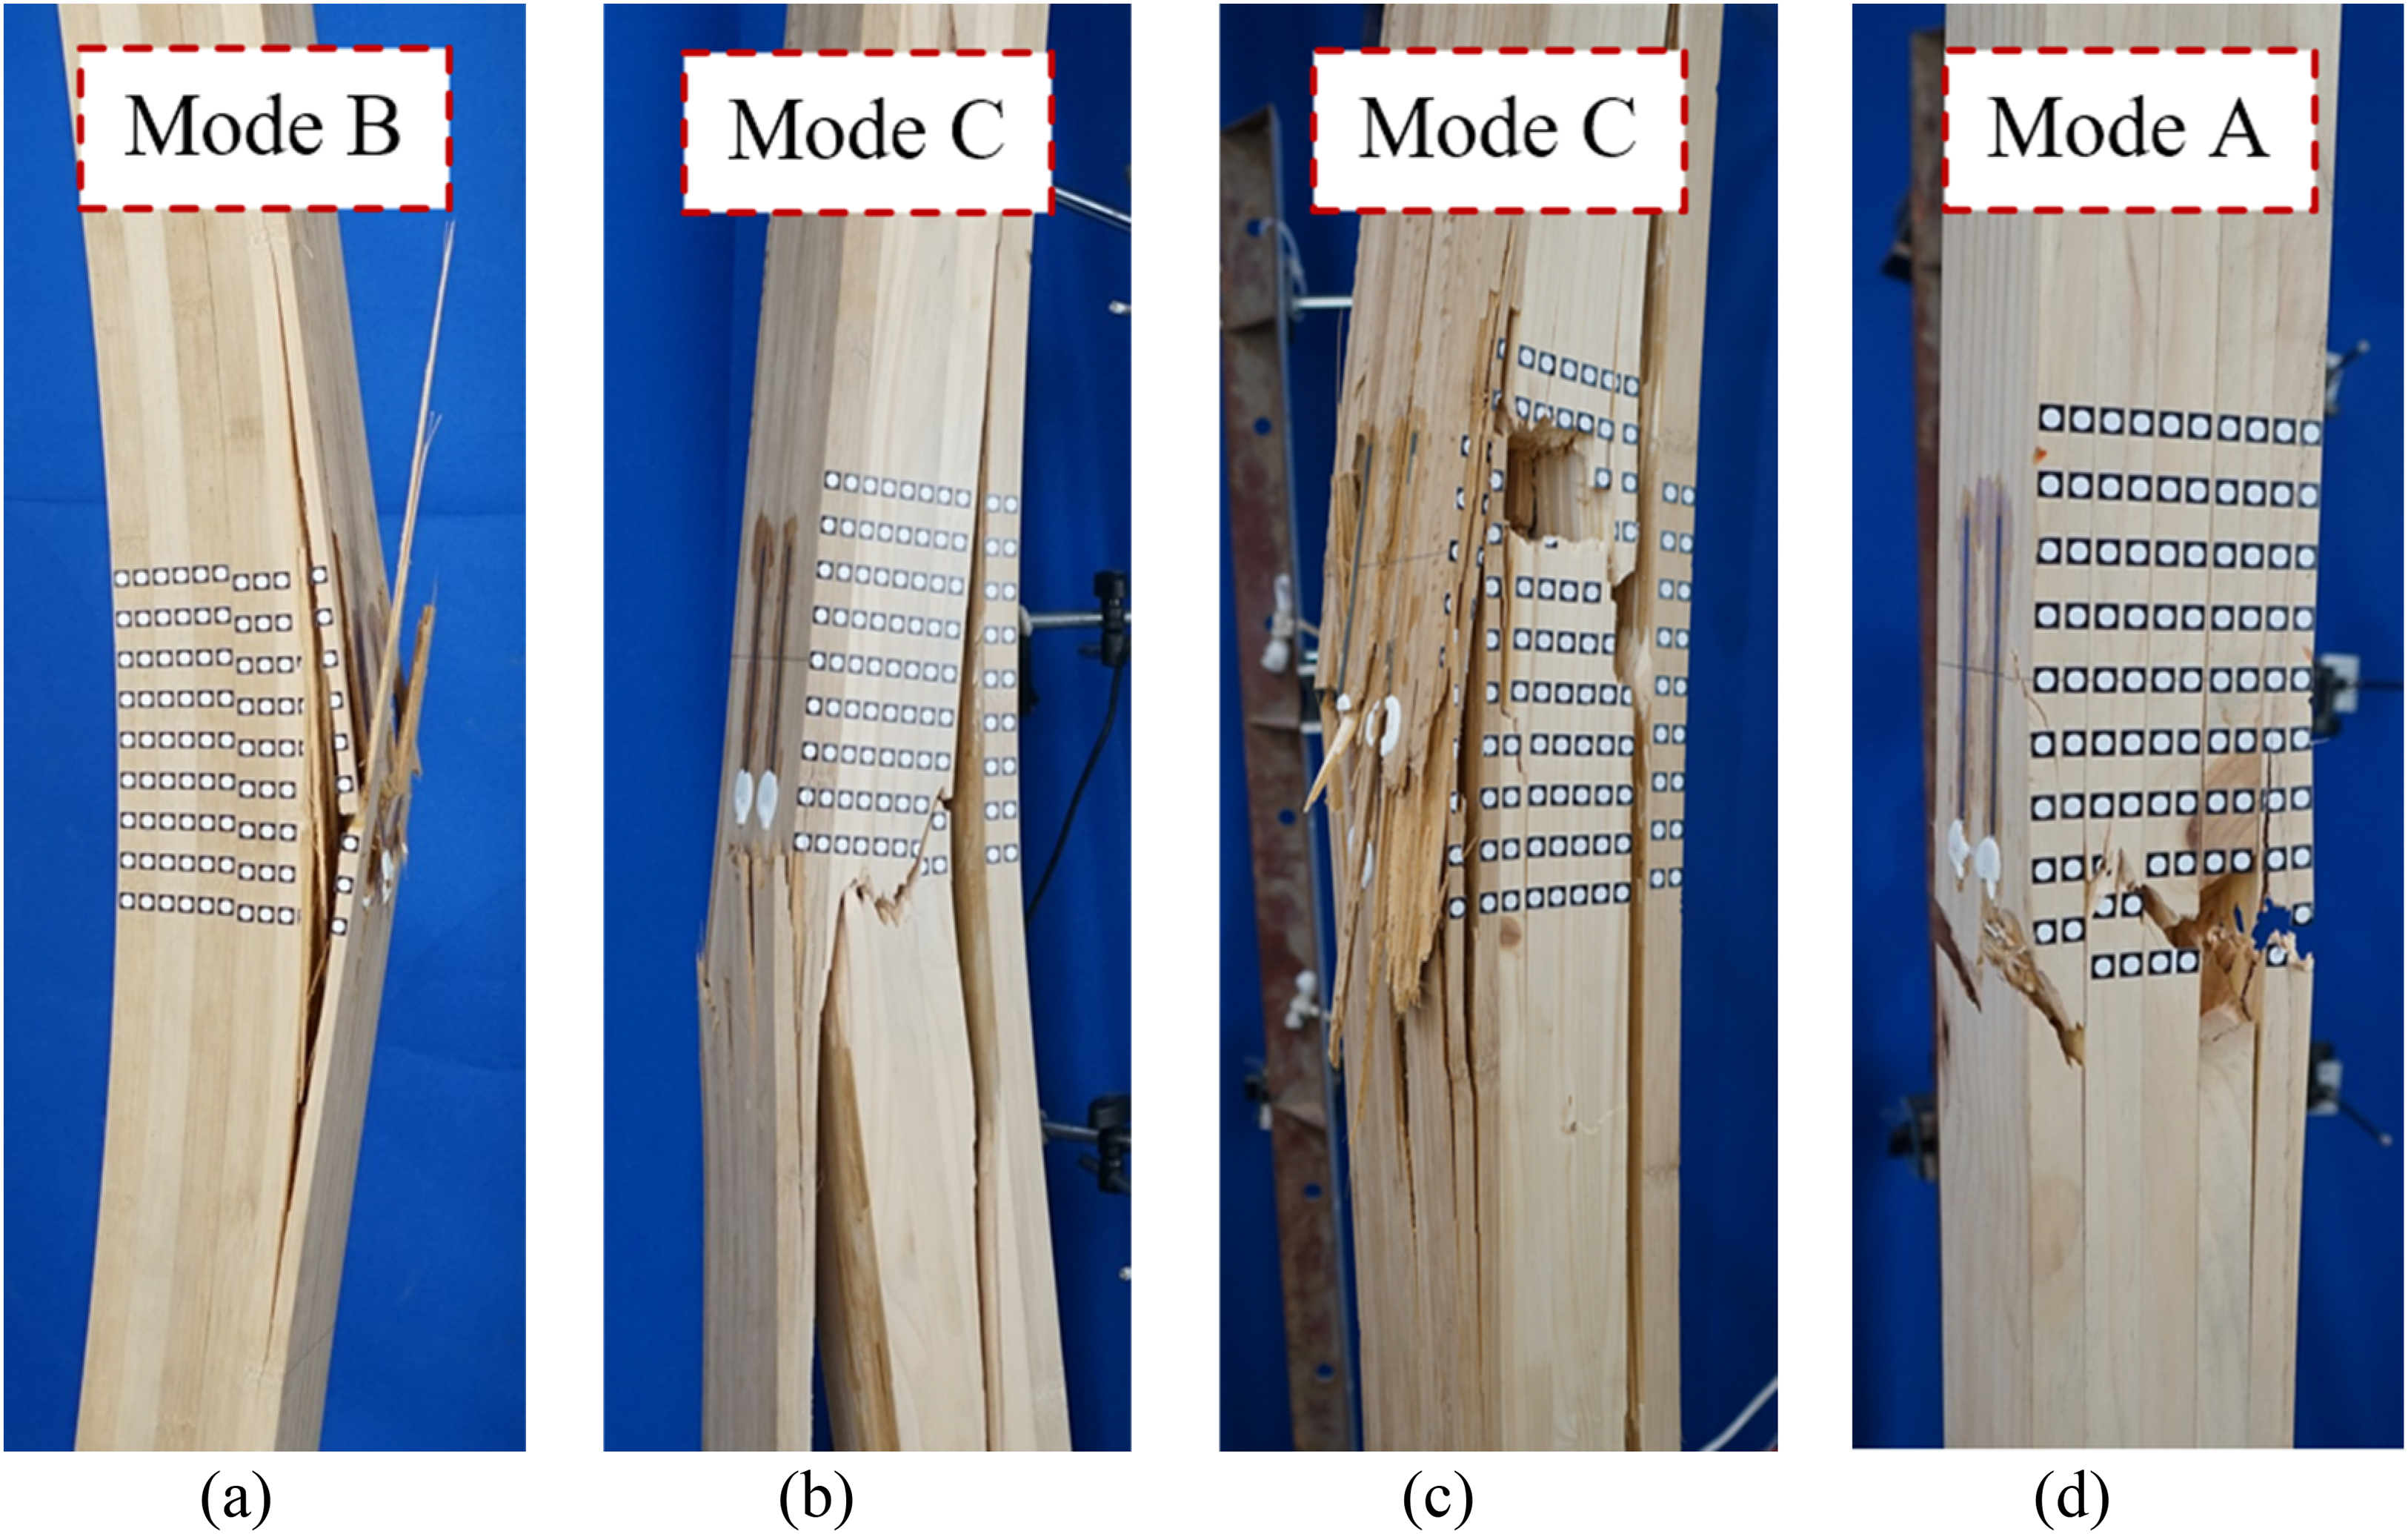
Typical failure modes of columns under axial compression. (a) B-C. (b) C-C1. (c) C-C2. (d) T-C.
Experimental and analytical results of axial compressive capacity.
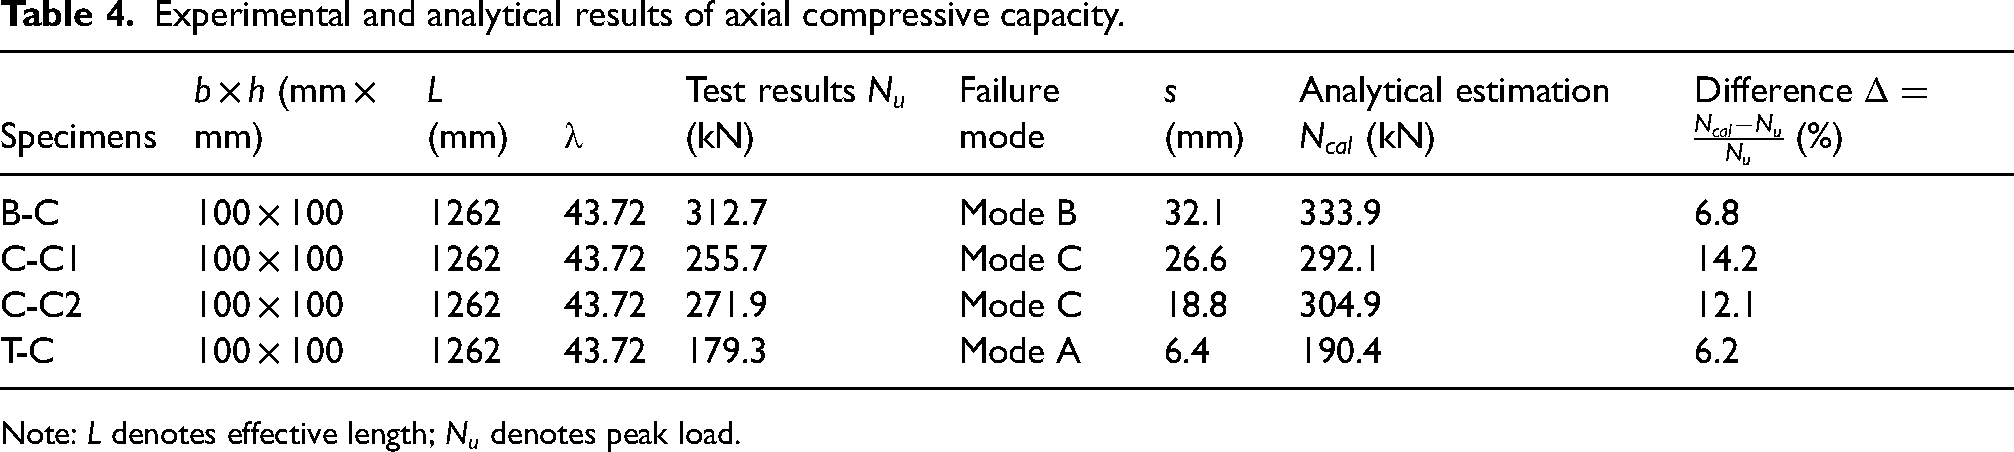
Note: L denotes effective length;
In Mode B, the sample exhibited excellent flexural capacity with highest curvature achieved before rupture. While lateral deflection occurred, the mid-span section bore an additional bending moment, causing a corresponding stress increment. This led to yielding in a significant portion of the compression zone. Failure initiated from the rupture of material on the outer side of the tension zone. The crack gradually extended inward, with fibres fracturing layer by layer. Additionally, there was vertical shear slip at the neutral layer position.
Mode C was primarily observed in C-C1 and C-C2 samples. The flexural capacity of these samples fell between Mode A and Mode B as well as the curvatures achieved before failure. Due to the constraint imposed by the outer bamboo layers, the timber core layer could withstand larger deflections without rupturing compared to Mode A. When the outer bamboo layer in the tension zone was pulled apart, transverse cracks instantaneously traversed the entire core layer. However, the bamboo layers in the compression zone remained intact. Under vertical pressure, significant deflection occurred, causing the already fractured timber core layer to detach from the adhesive layer during the bending process. As a result, transverse cracks that traversed the core layer extended directly along the vertical adhesive layer after crossing the core layer.
Load–strain relationship curves
As shown in Figure 7, the load–strain relationship of the samples can be divided into three stages throughout the loading process:
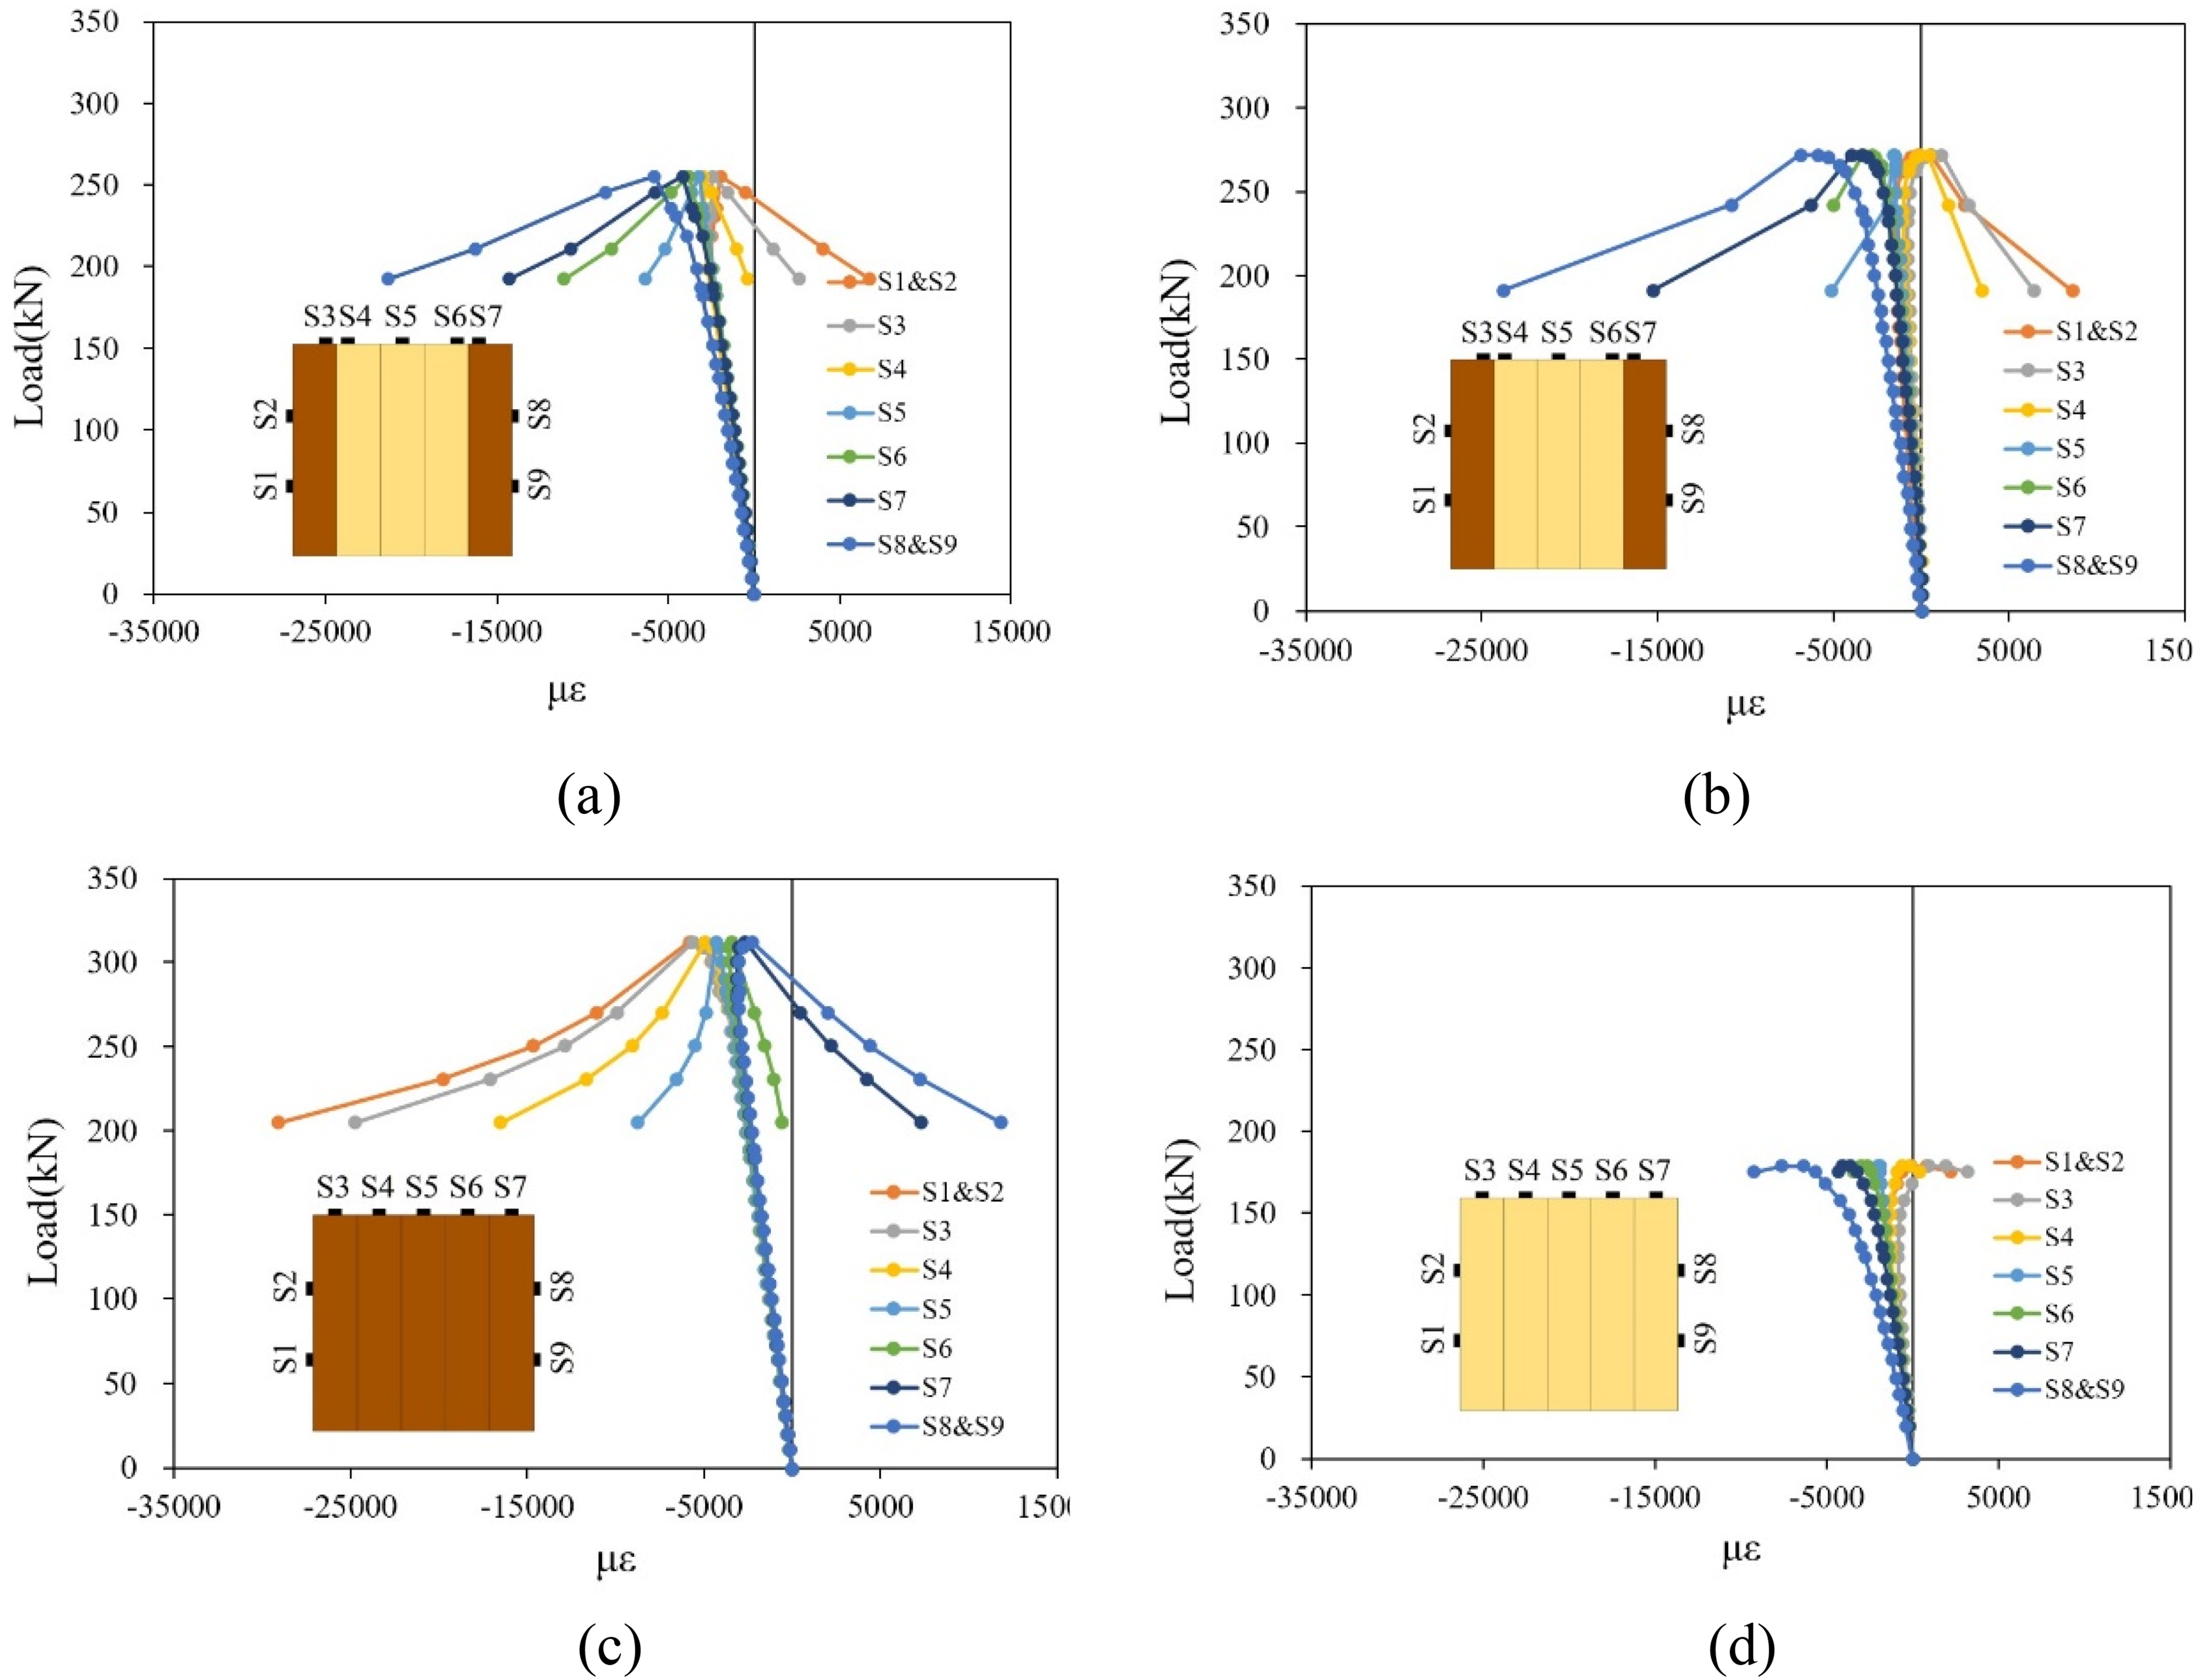
Load–strain history plots. (a) C-C1. (b) C-C2. (c) B-C. (d) T-C.
Elastic stage: In the initial loading phase, the materials of the samples are in the elastic range, and strain increases linearly with the applied load.
Elastic-plastic stage: In the axial compression tests, column T-C reaches a peak load of 60–70%, while columns B-C, C-C1 and C-C2 reach peak loads of 80–90%. At this point, local materials reach the proportional limit and enter the yield stage. The slope of the curve changes, and the strain distribution across the cross-section is no longer uniform. Compression strain gradually shifts towards one side, causing compression strain growth on the convex side of the sample to stall and exhibit a tendency to reverse.
Load decrease stage: After reaching the peak load, the compression strain on the convex side of the sample rapidly decreases. The outer fibres transition from a compressed state to a tensile state. Meanwhile, a significant portion of fibres on the concave side enters the plastic stage, and compression strain increases dramatically until the sample eventually fails.
The initial defects of the samples (such as initial eccentricity, component manufacturing errors, material defects, etc.) can indeed influence the test results. The load–strain relationship curve of sample T-C during the first stage appears more scattered compared to other samples. It resembles the curve of a slightly eccentric compression state. In contrast, laminated bamboo is engineered by slicing and cold-pressing raw bamboo into a material where the defects in the bamboo nodes are evenly distributed across various positions on the cross-section. This can be treated as an axially homogeneous material, leading to less scatter in the elastic stage curve of sample B-C.
For samples C-C1 and C-C2, where laminated bamboo is used as the outermost layer, the main load-bearing capacity comes from the laminated bamboo layer. This sectional arrangement improves the uneven deformation caused by initial defects on the cross-sectional material. Consequently, the scatter in the elastic stage curve falls between that of samples B-C and T-C.
Load–deflection relationship curves
Figure 8 depicts the load–deflection relationship curves generated by selecting the deflection values at the mid-span position of each sample. Prior to reaching the peak load, samples B-C, C-C1 and C-C2 exhibit relatively small and gradual deflections. As the load reaches around 80% of the peak load, these samples enter the elastic-plastic stage. The uneven strain growth combined with the small deflections in the earlier stages leads to an increasing bending moment on the cross-section. As a result, the lateral deflection at the mid-span rapidly increases.
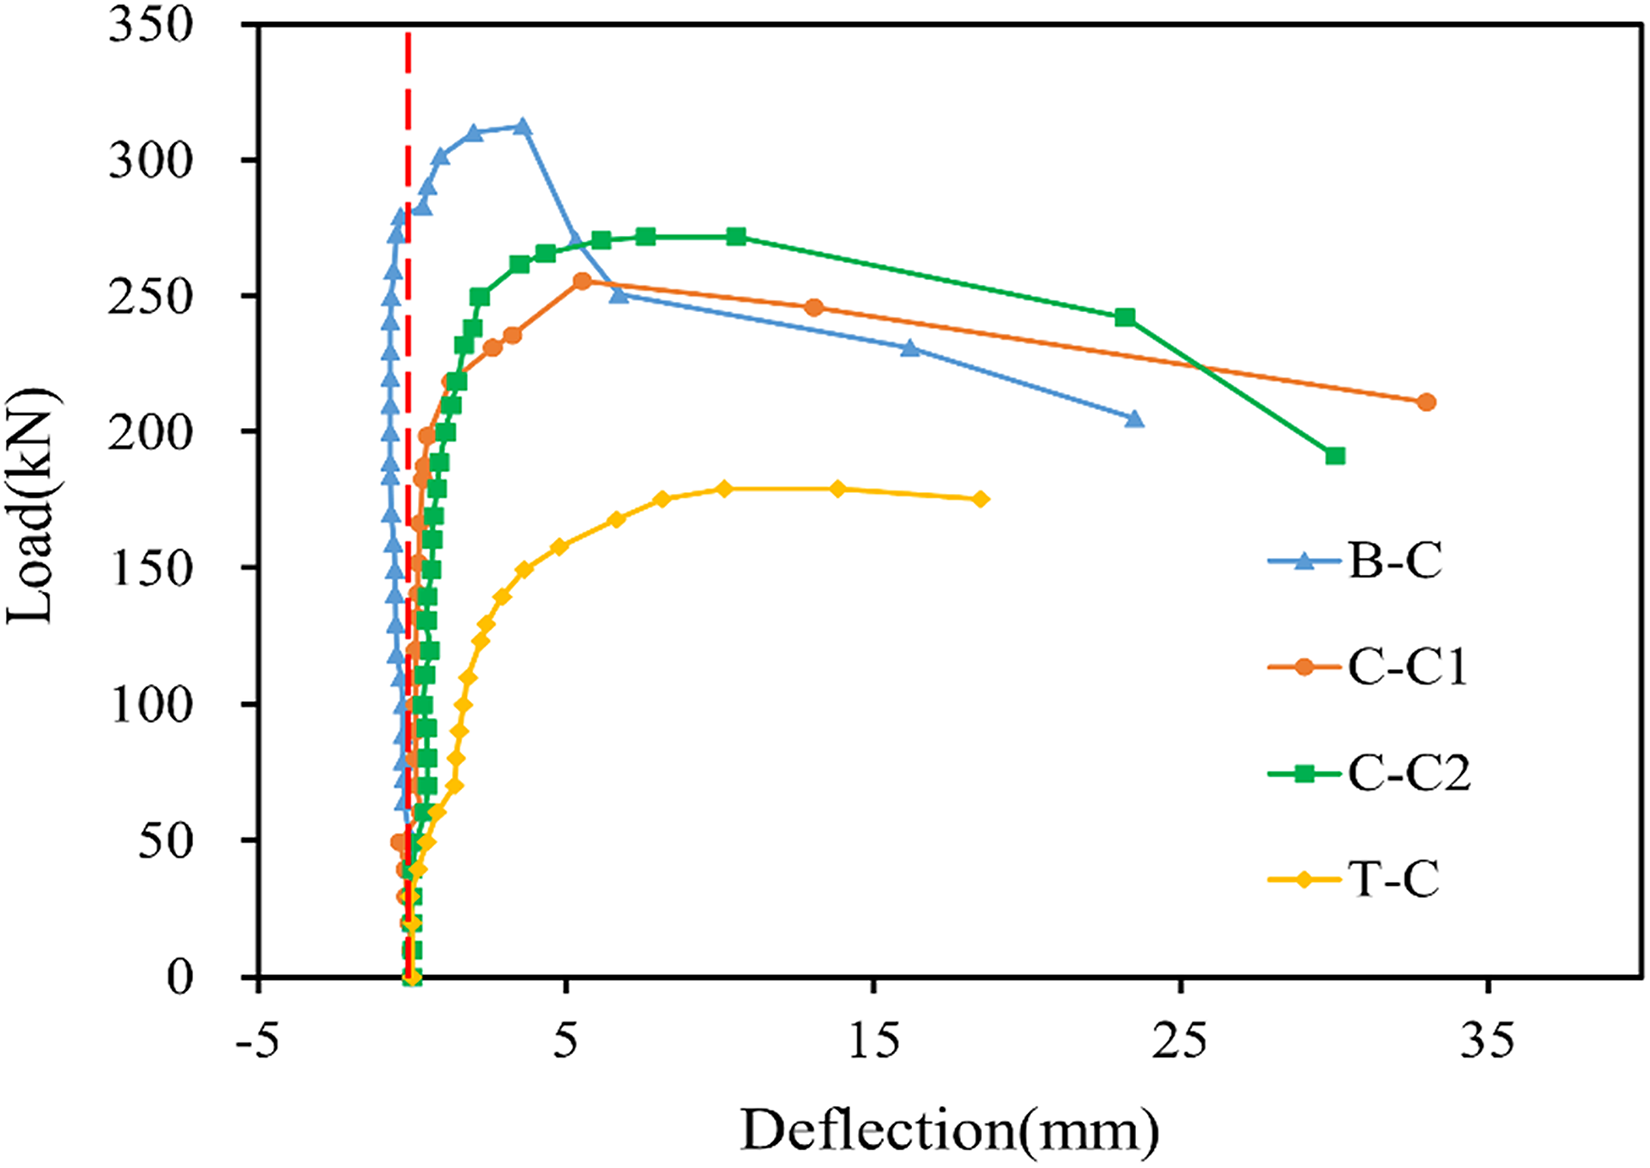
Load–deflection curves.
For sample T-C, at peak loads of 30–40%, due to the influence of initial defects, the deflection of the sample suddenly increases by a small amount and then remains stable. As the peak load reaches 50–60%, the previous abrupt increase in deflection results in an additional bending moment on the mid-span section due to the vertical load. This leads to an acceleration in the rate of deflection increase.
After reaching the peak load, sample B-C experiences a rapid decline in load-bearing capacity. Once the component bears a load and rapidly drops to around 80% of the peak load, the rate of descent slows down significantly, indicating a characteristic of ductile failure.
The failure mode of sample T-C is brittle, where there is no significant downward trend in load-bearing capacity after reaching the peak load. Once the material in the tension zone is pulled apart, sample T-C fractures directly in the middle, leading to a loss of load-bearing capacity.
For composite columns C-C1 and C-C2, after reaching the peak load, deflection continues to increase rapidly while the load decreases slowly. As deflection keeps growing, the bending moment on the mid-span section steadily increases until the fibres on the convex side of the sample are pulled apart, resulting in failure.
Estimation of axial compression capacity
Determination of simplified tangent modulus
A typical stress–strain curve for biobased materials under compression is shown in Figure 9, in which,
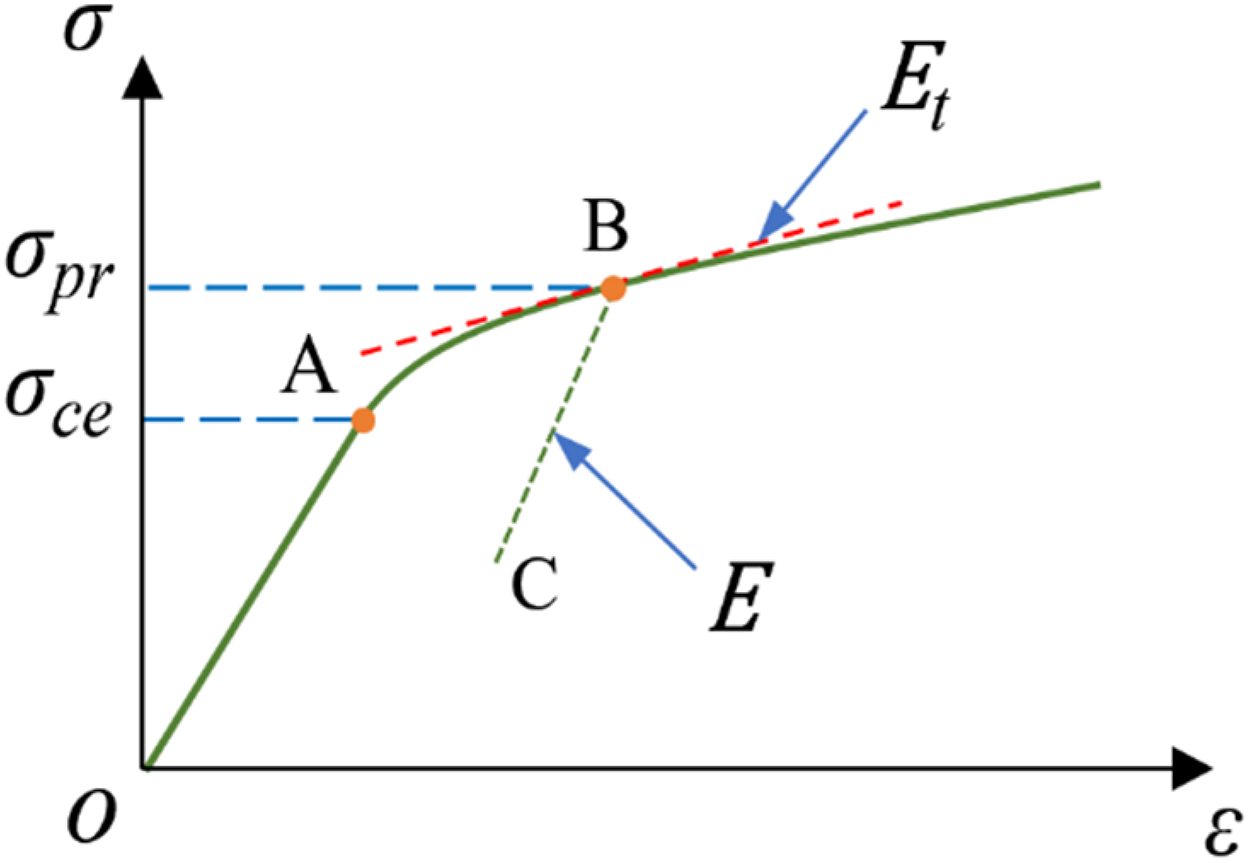
The stress relationship of compression.
The study
30
simplified the compressive stress–strain curve of laminated bamboo into three stages and proposed a trilinear constitutive equation: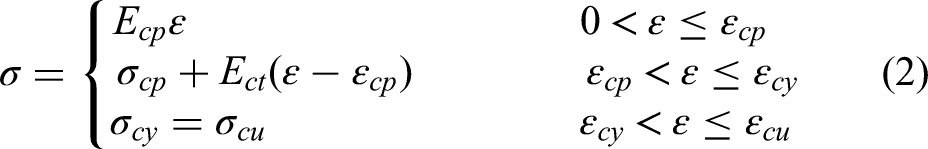
In this study, an approach based on the FPM was adopted to determine the yielding point from the small clear test results. To implement this method, a line was first drawn to connect the origin and the peak point (‘origin-peak’ line). The yielding point is then defined as the farthest point on the stress–strain curve from this line. This method of defining the yield point differs from that of research,
30
and it has an impact on the initial elastic modulus 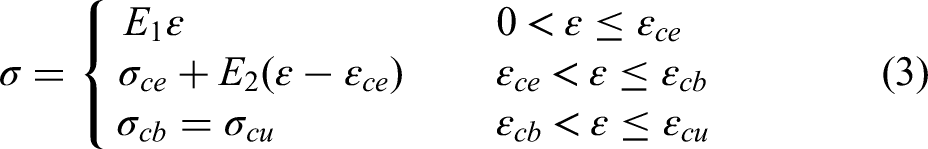
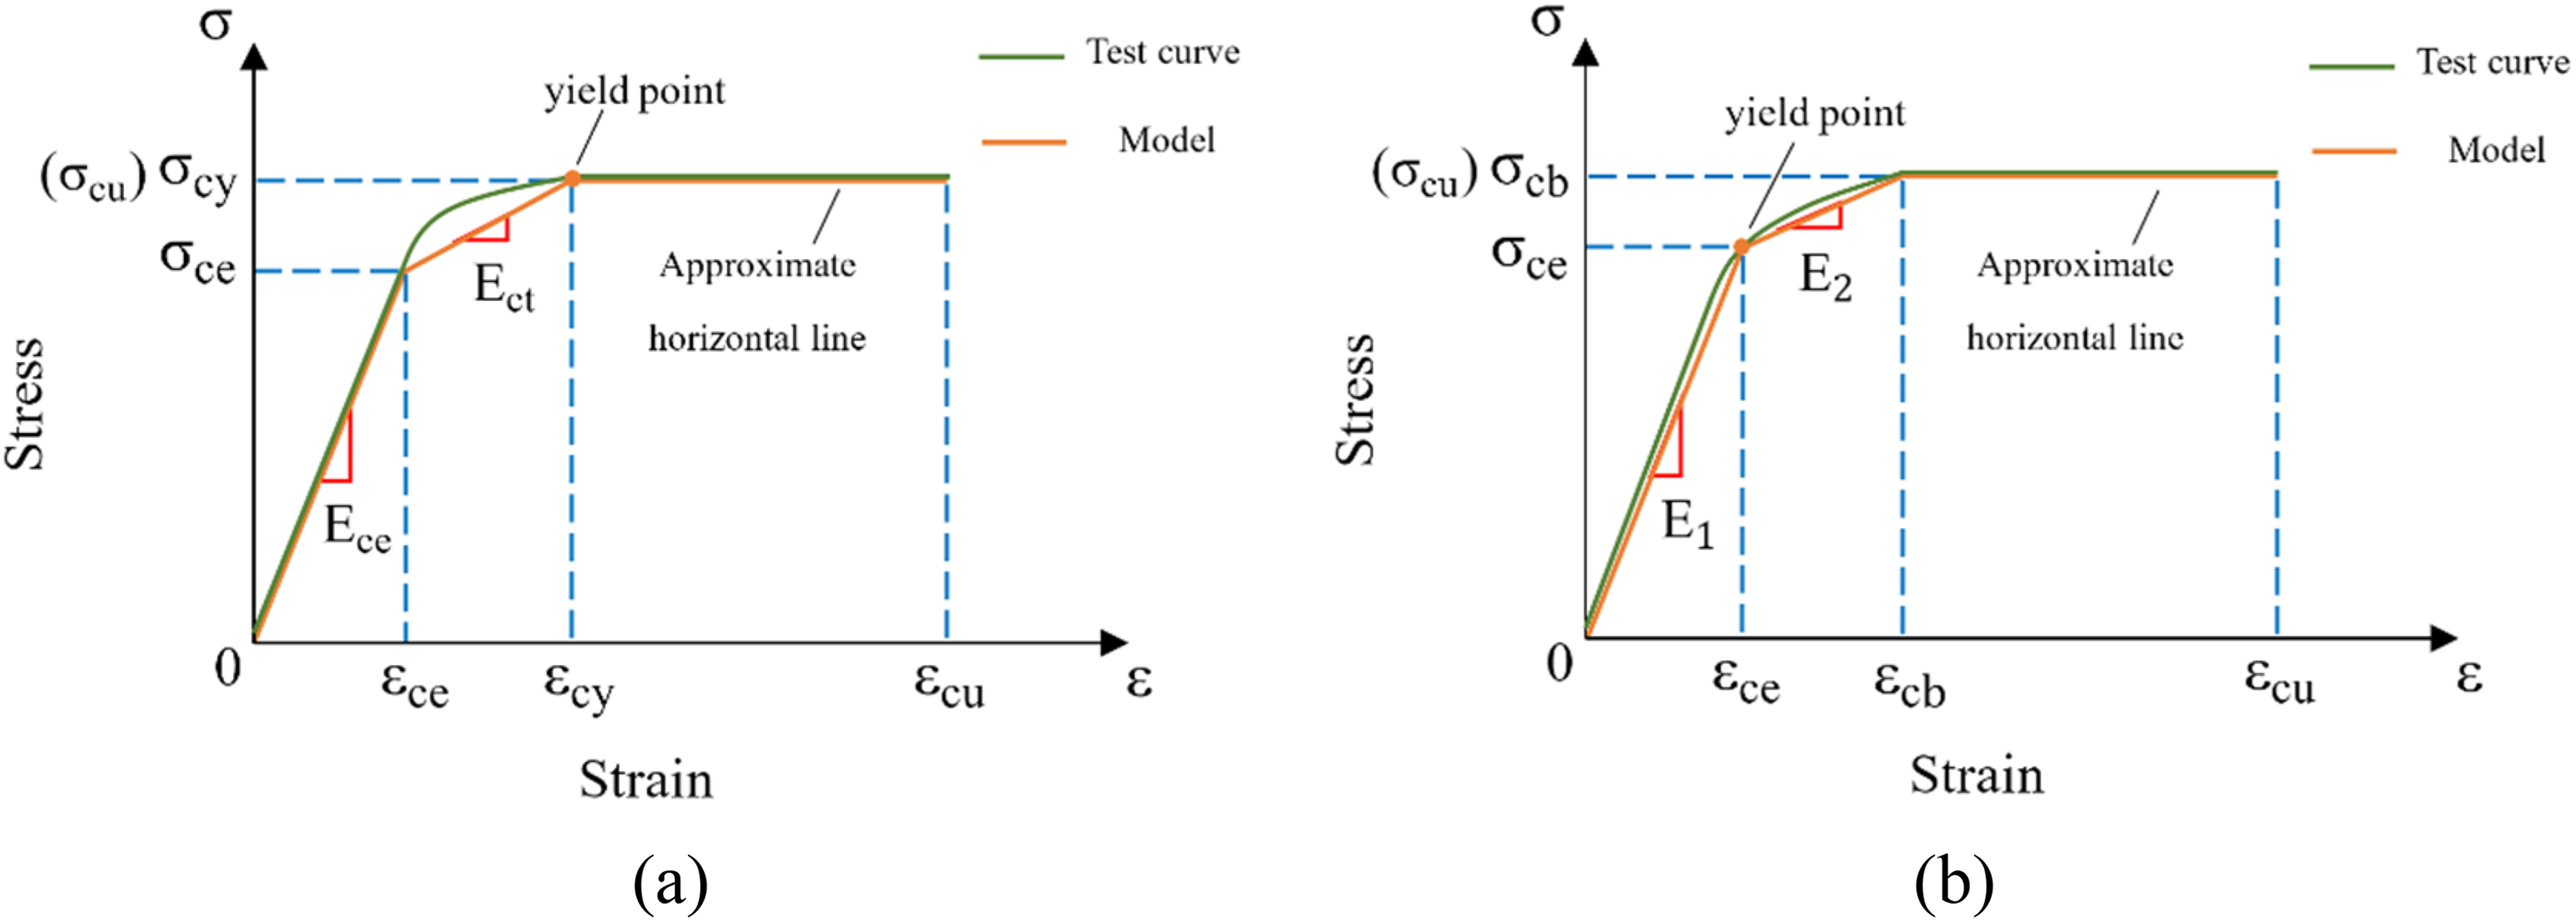
Trilinear model for compressive stress–strain relationship. (a) Wei's trilinear model. (b) Adjusted trilinear model.
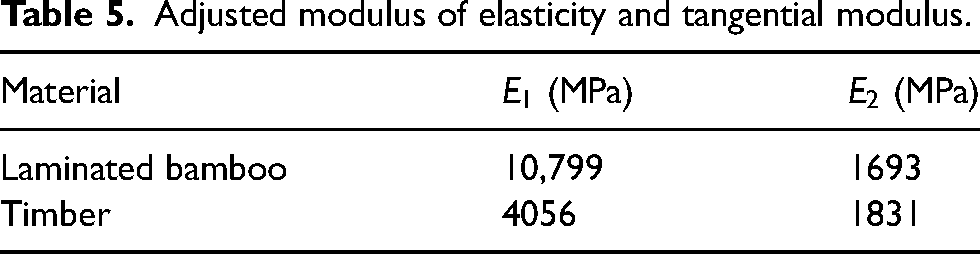
Figure 11 illustrates the model function graphs and stress–strain curves after adjustment for both laminated bamboo and wood materials. From the graph, it is evident that equation (3) can effectively represent the true compressive constitutive relationship of the materials. The results of the adjusted dual-stage moduli
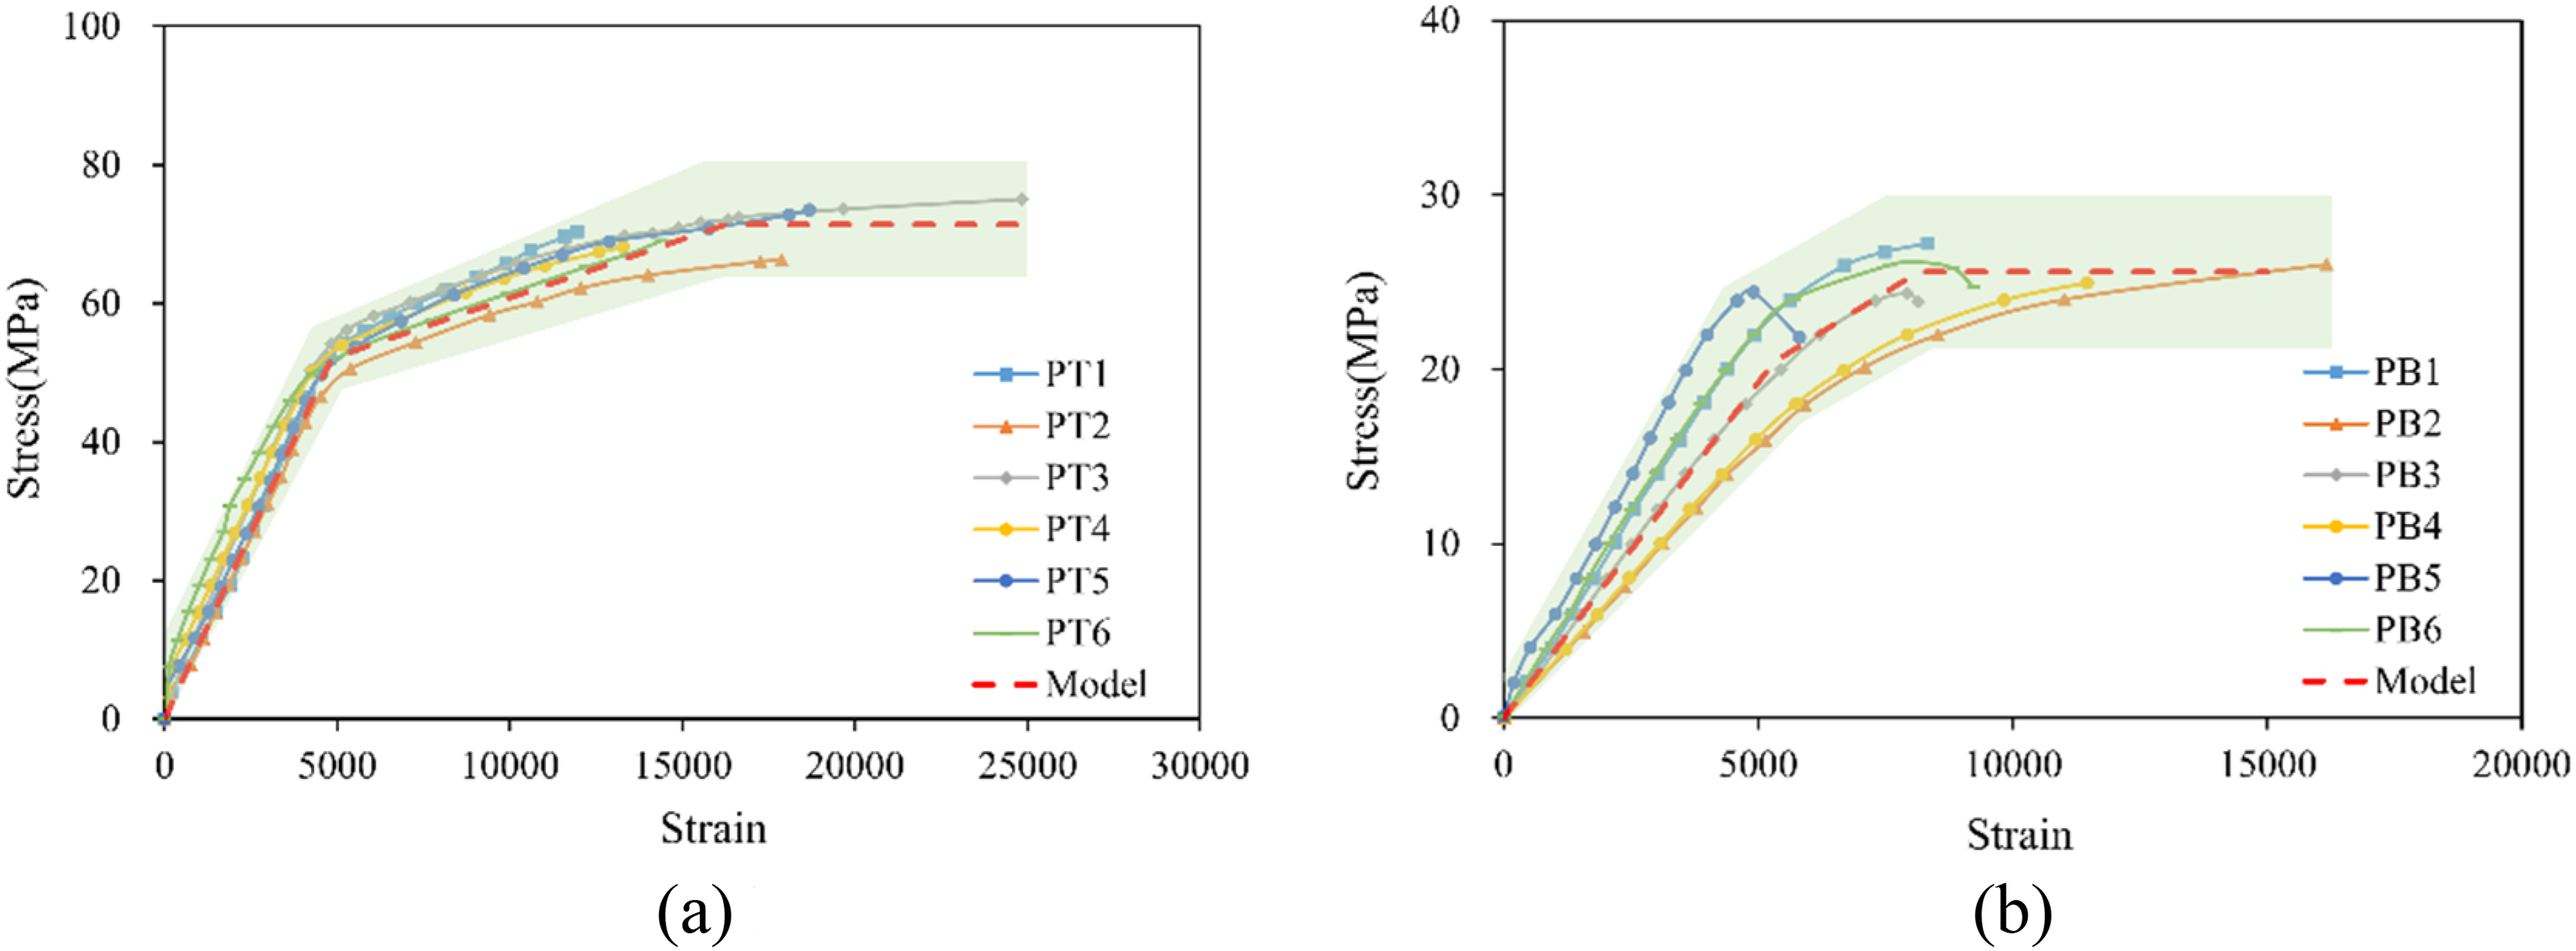
Stress–strain curves, model curve of laminated bamboo and soft timber. (a) Laminated bamboo. (b) Soft timber.
Adjusted modulus of elasticity and tangential modulus.
Modulus reduction theory
As shown in Figure 12, the modified Euler formula exhibits higher accuracy when calculating the critical load of slender columns. However, there is a significant error when calculating the critical load of moderately long columns with small slenderness ratios. This discrepancy arises because, during the instability of moderately long columns, the concave-side material undergoes yielding and enters the elastic-plastic stage. The elastic modulus
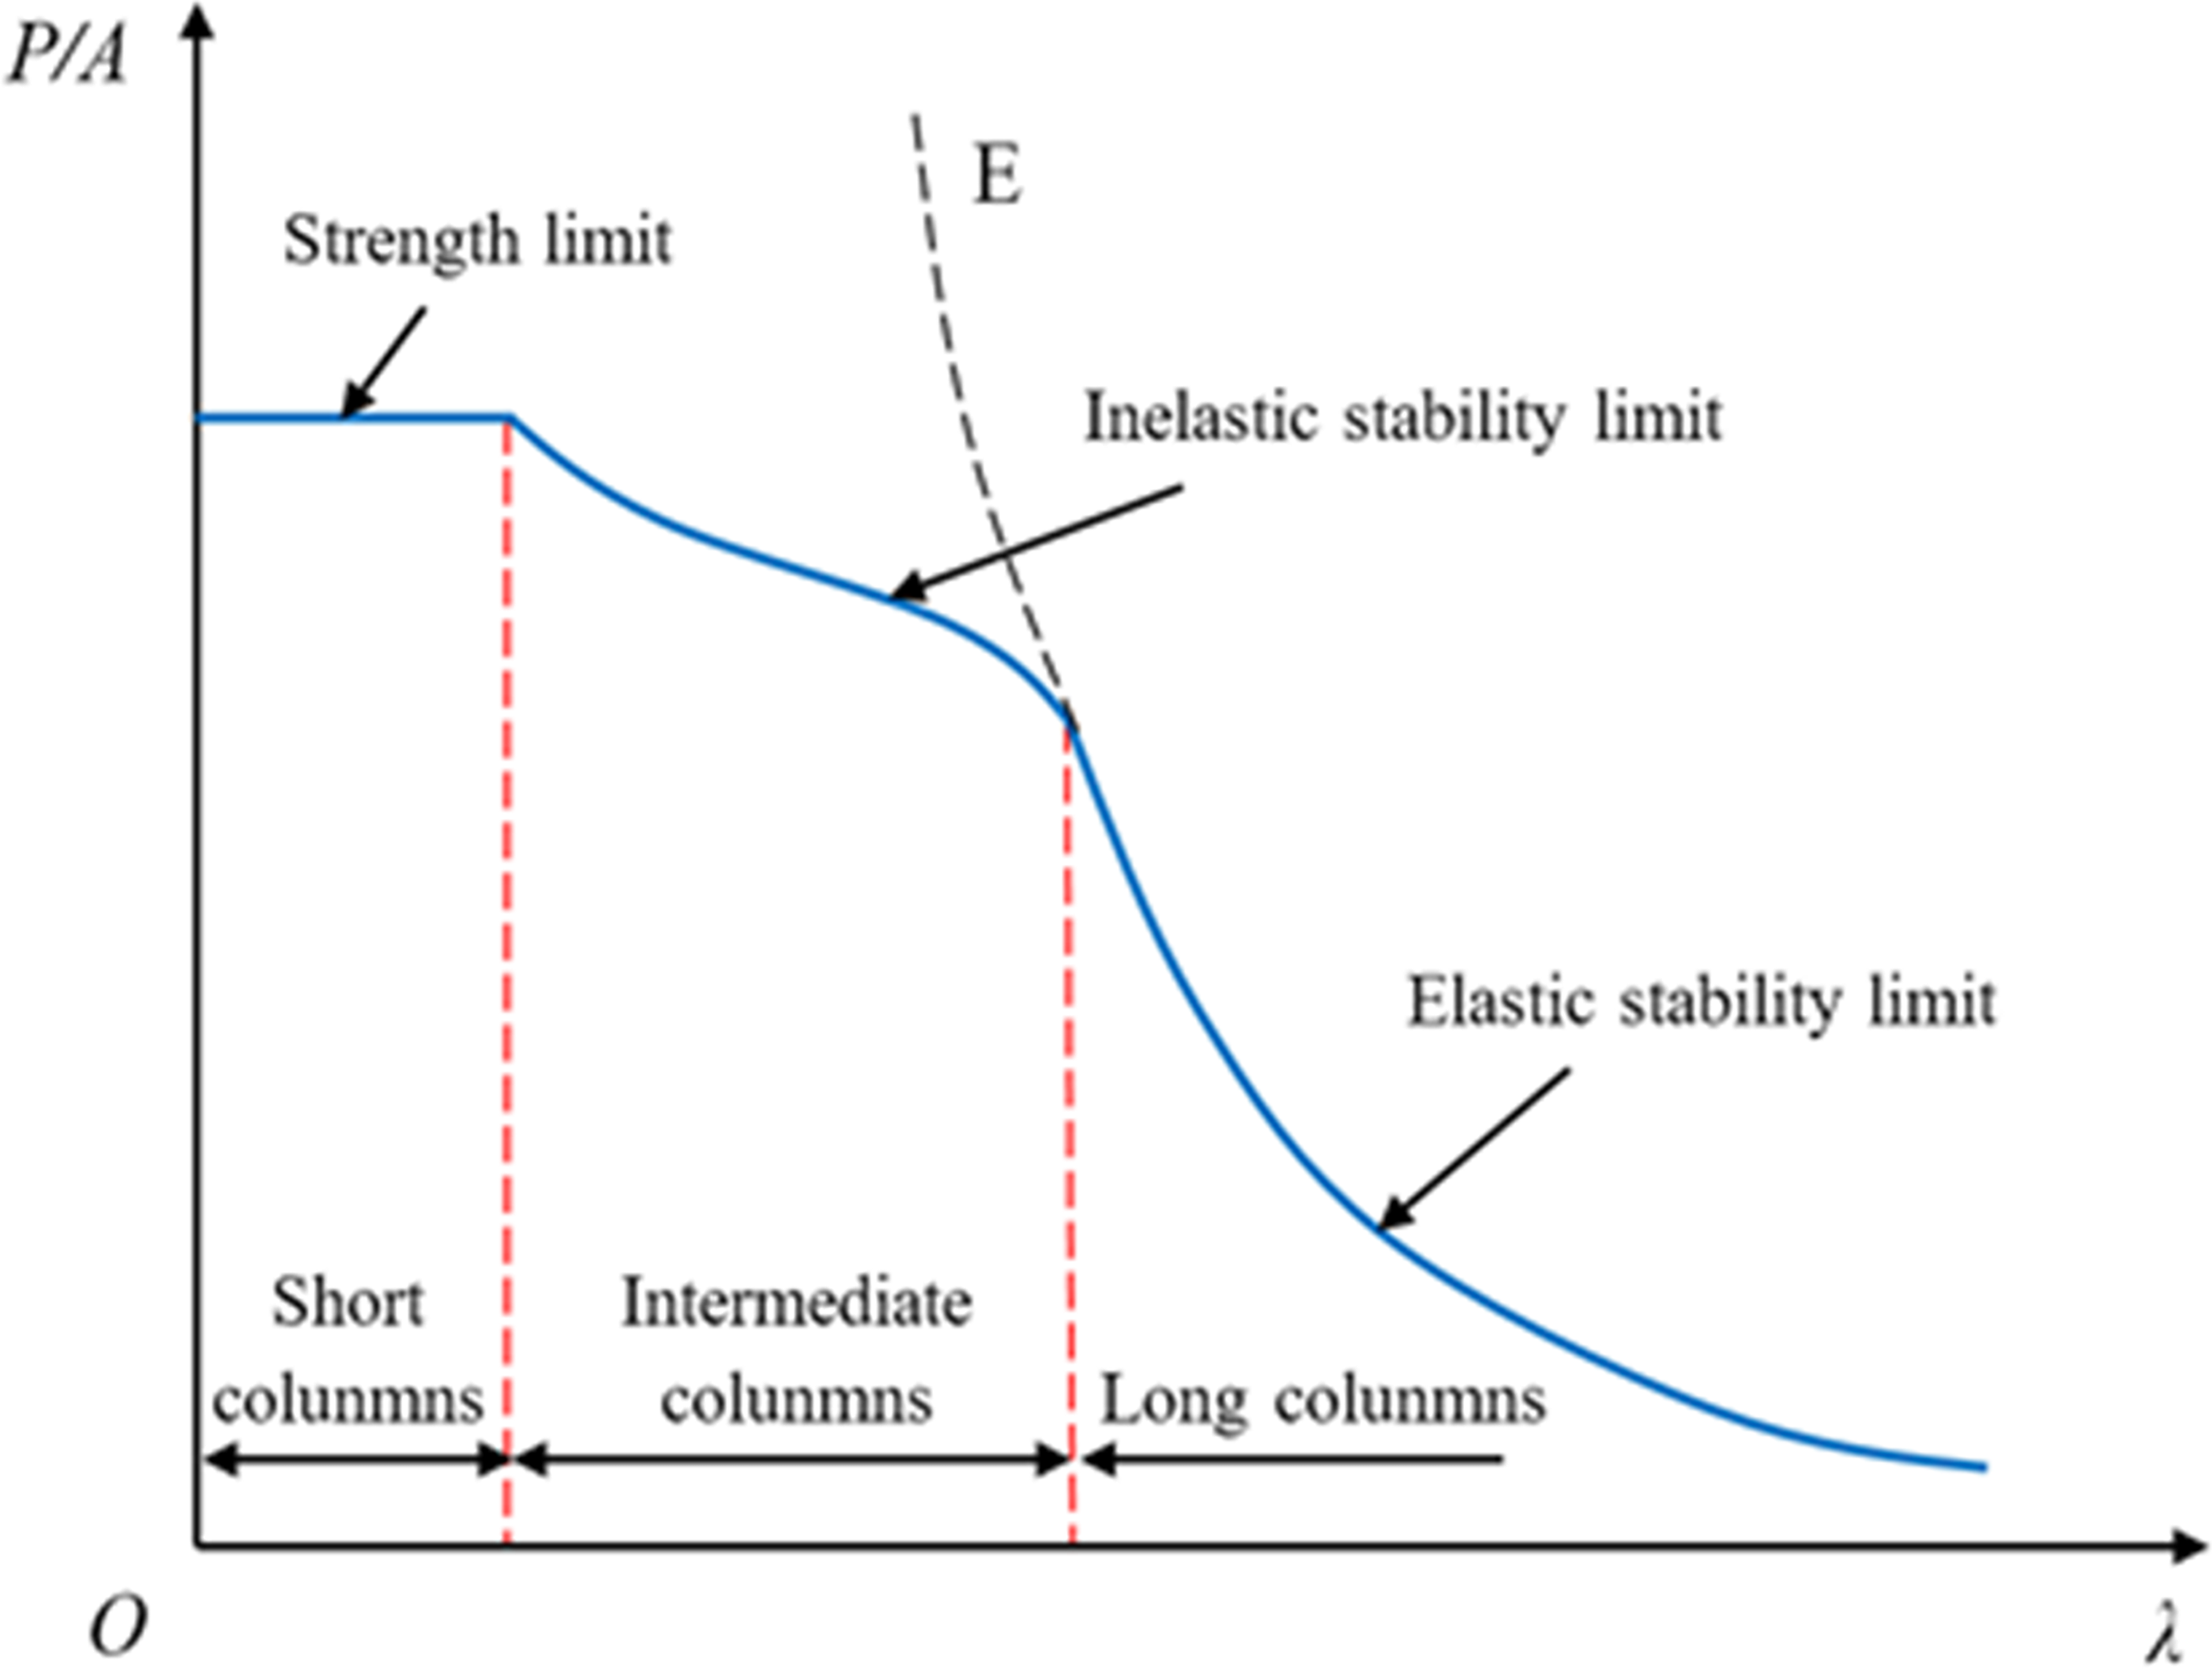
Diagram of average compressive stress P/A versus slenderness ratio λ.
Figure 13 illustrates the stress distribution across the mid-span section of a moderately long column during axial buckling. Due to the evolving deflection, the additional bending moment exerted by the axial load on the mid-span section gradually increases. This additional moment leads to extra stress increments on the concave-side fibres and equal stress reductions on the convex-side fibres. As a result, the concave-side fibres reach the elastic limit and yield ahead of the convex-side fibres.
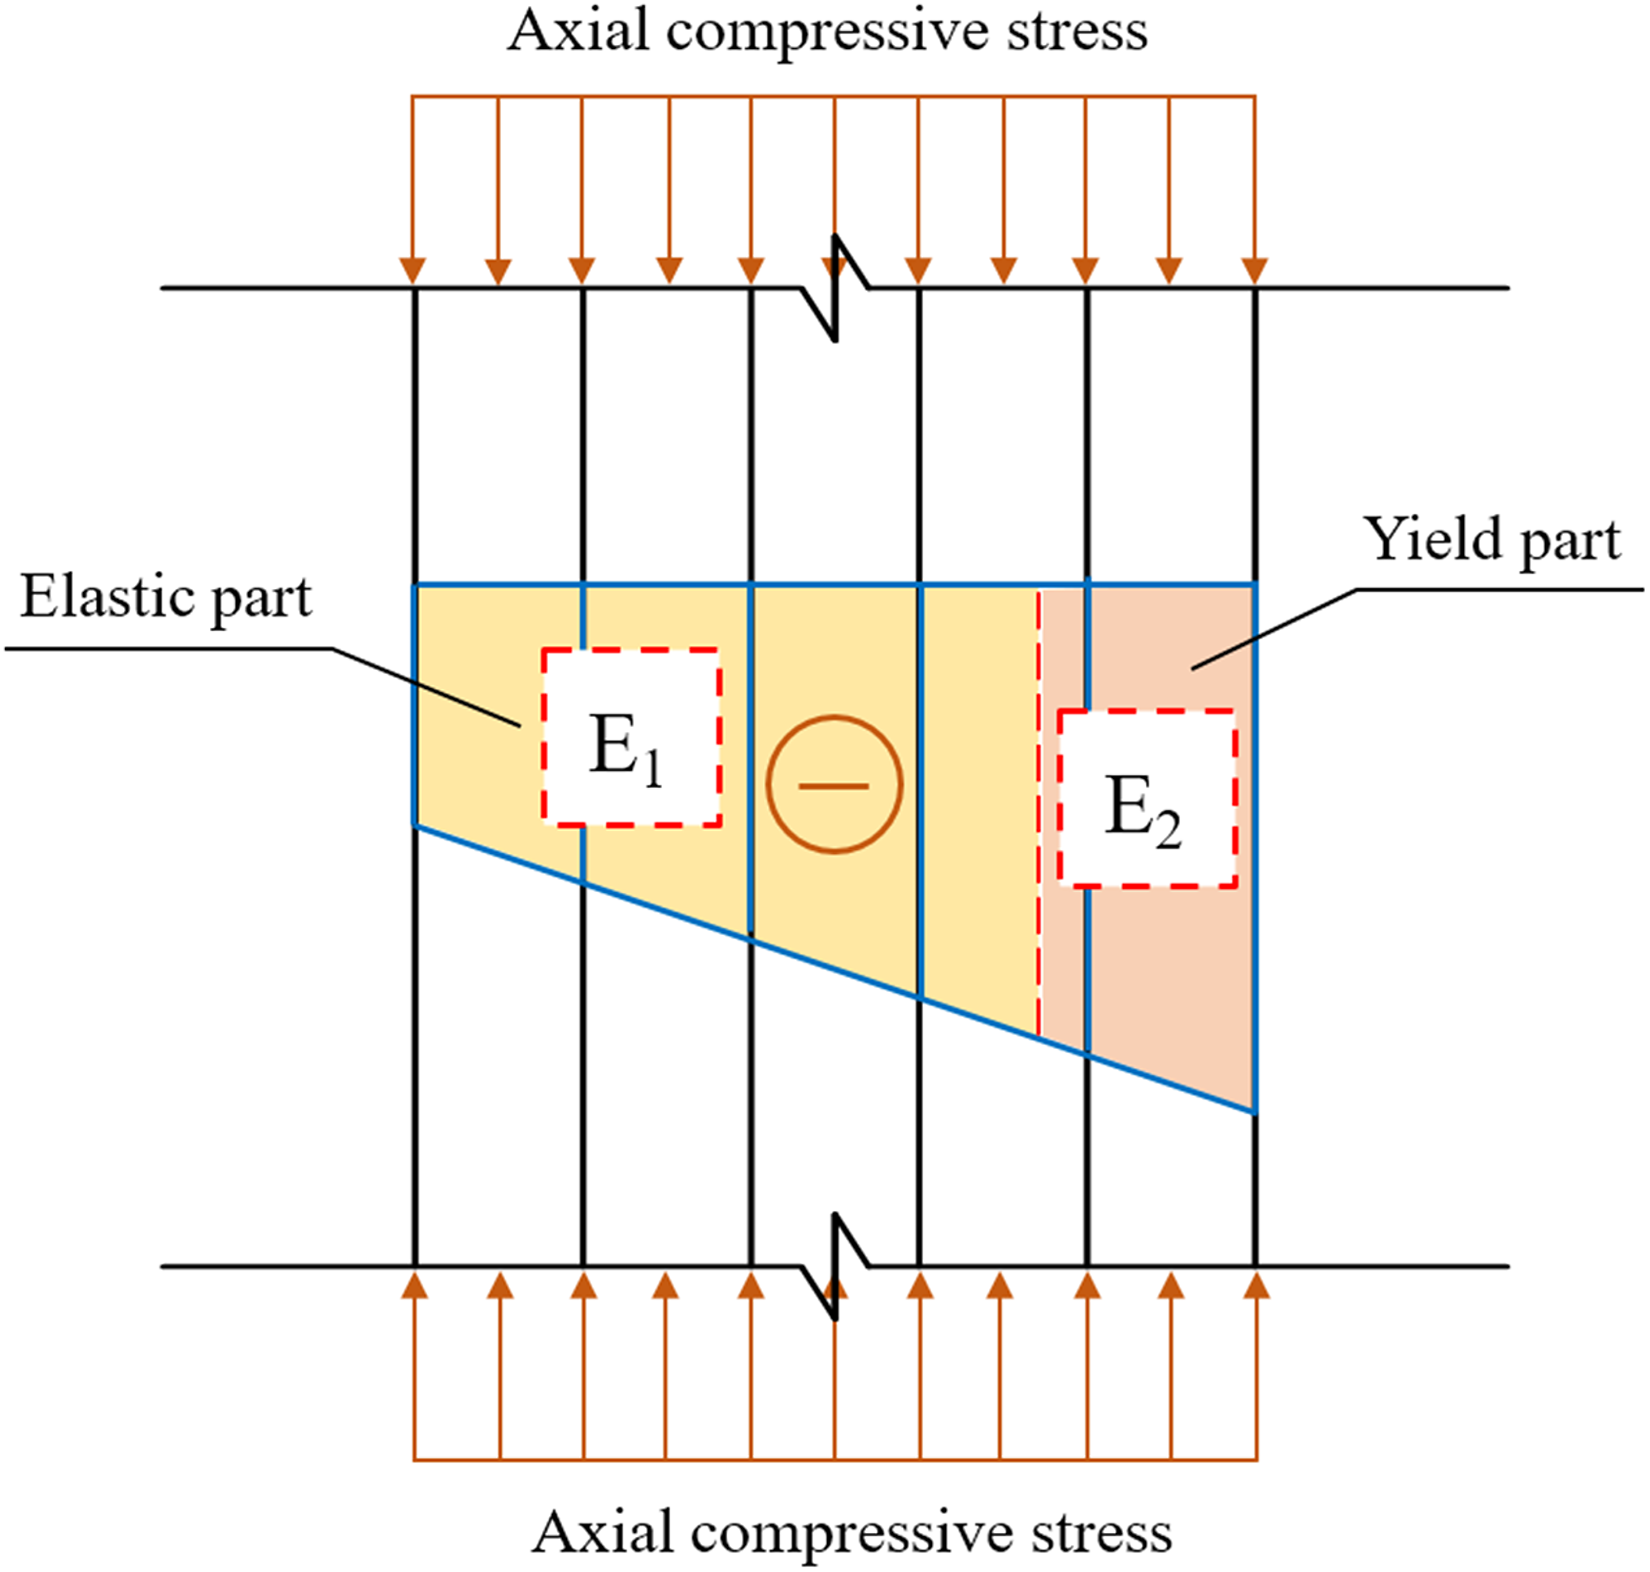
Mid-span compressive stress distribution.
Based on an in-depth study by Von Karman
41
regarding the modulus reduction theory, a column undergoing inelastic buckling is treated as an equivalent elastic buckling column with a modulus of 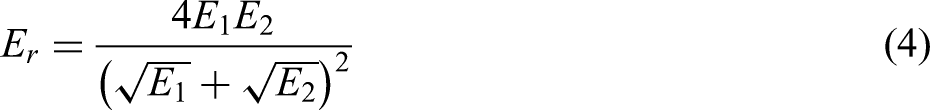


For composite columns like C-C1 and C-C2 composed of multiple materials, this paper separately calculates the load-bearing capacities contributed by the concave bamboo layer, the wood core layer and the convex bamboo layer. Following the previously proposed calculation method in this article, each layer is treated as two sub-columns based on whether yielding occurs. The critical load of each sub-column is then computed. This process eventually yields the critical load of the composite columns. Based on collected strain data, it is evident that under critical load conditions, yielding phenomena occur only within the concave bamboo layer, with the wood core layer not experiencing compressive yielding. However, the centroid axis of the concave bamboo layer does not coincide with the z-axis (Figure 14). Thus, when calculating the critical load-bearing capacity of this layer, the parallel shift axis formula is introduced:


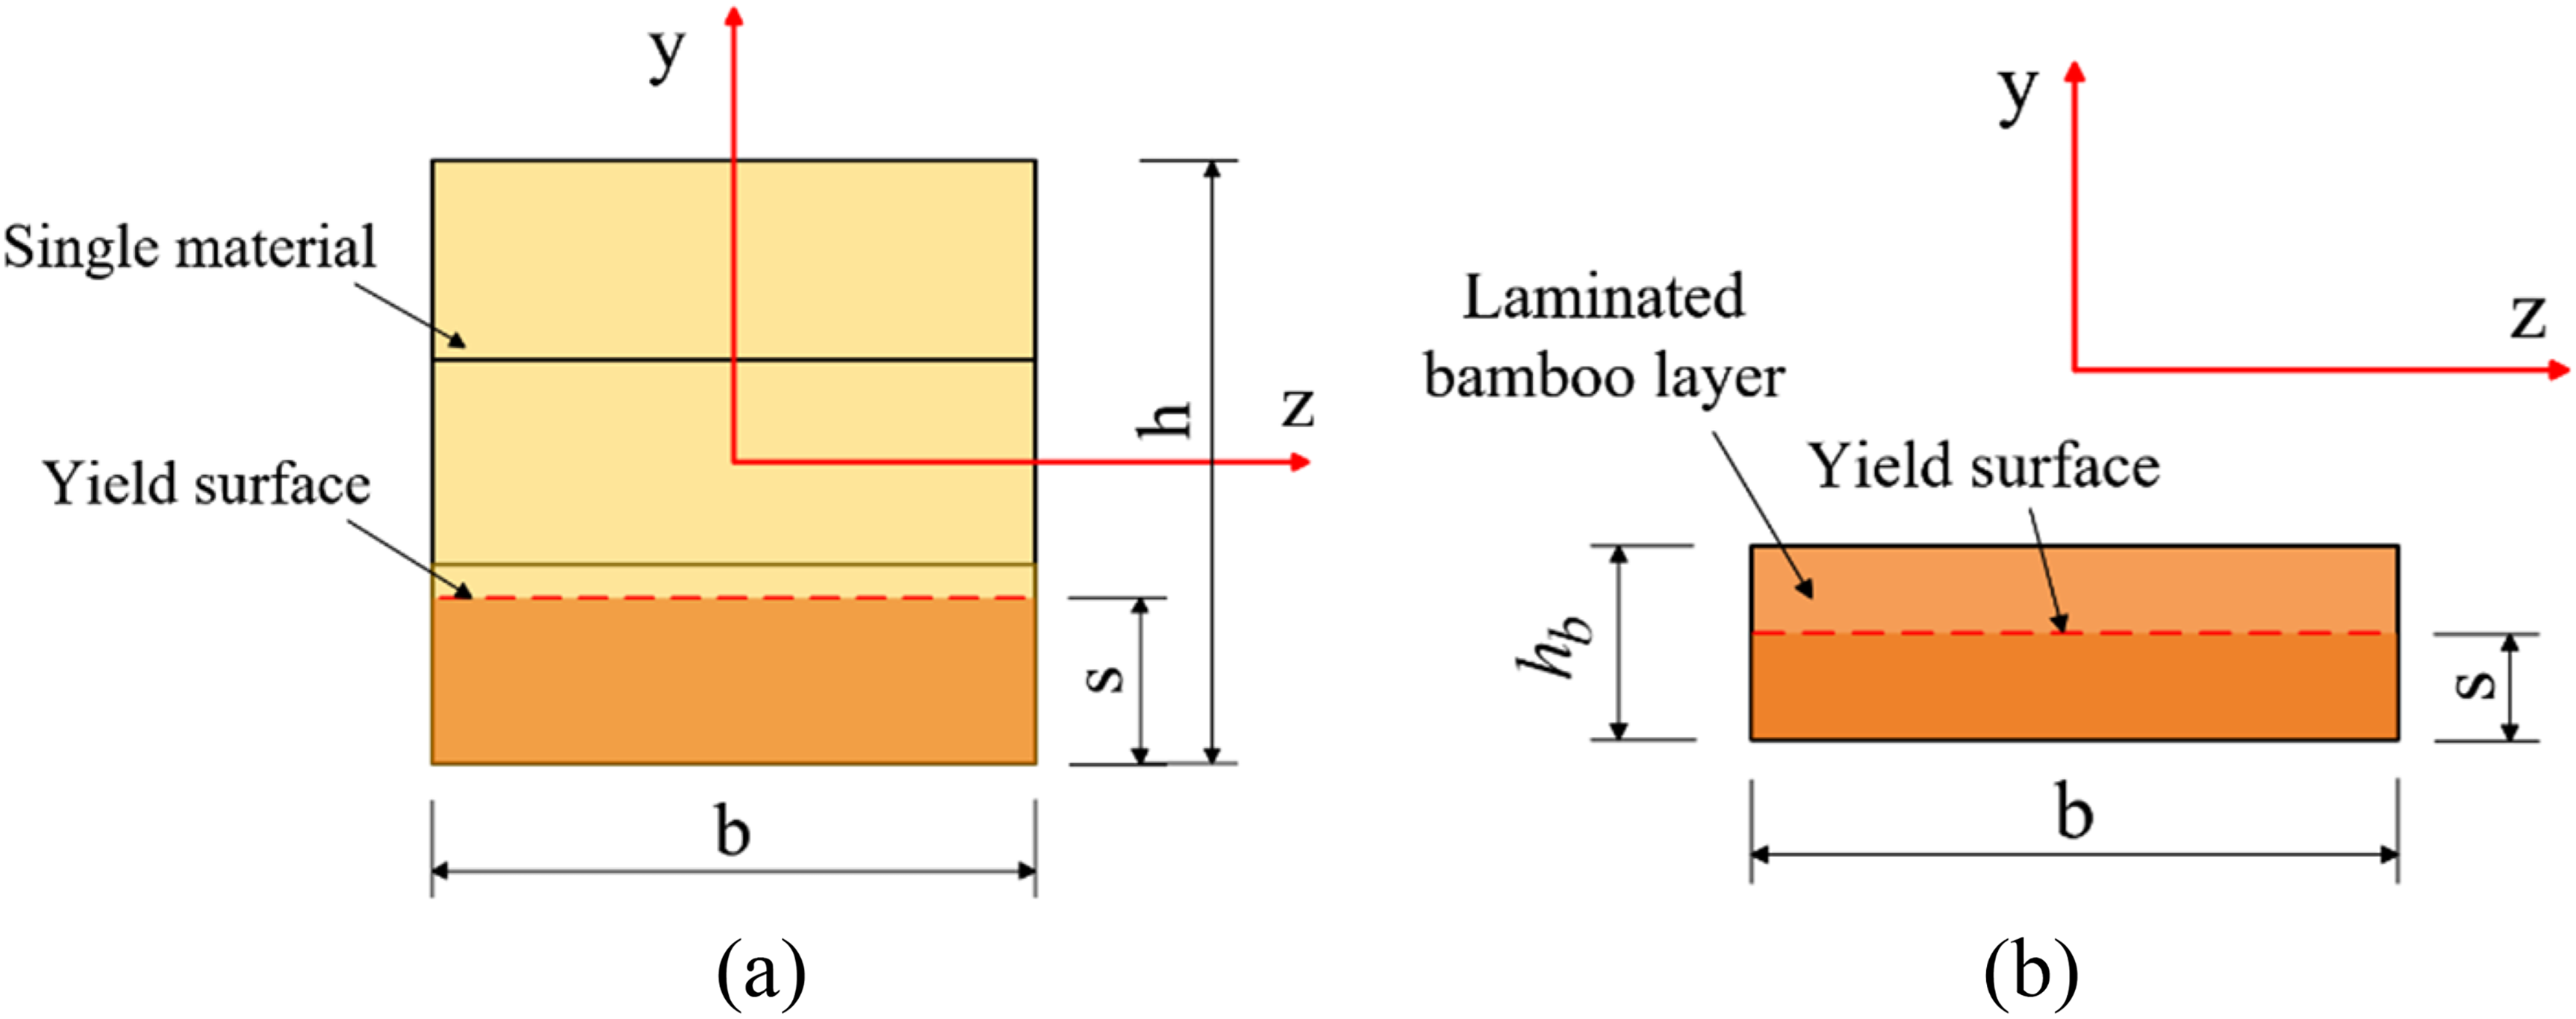
Section calculation schematic. (a) Shaped axis on z-axis. (b) Shaped axis not on z-axis.
For bio-based column, if the trilinear model adopted, the governing equation from the elementary beam theory is not valid anymore, the neutral axis shifts when part of cross-section enters the inelastic range. A modified beam theory should be developed for bio-based frame element with trilinear constitutive model. Before this, a practical solution is to use strain gauges to profile the strain distribution along the depth of the cross-section. The experimental data from this study were substituted into the formula for validation, and the calculated results are presented in the work by Khokhar et al. 4 For B-C and C-C type of columns, B-C and C-C composed of single materials, the formula-based values are 6.2% to 6.8% higher than the experimental values. The theoretical calculations align quite well with the actual outcomes. Concerning composite columns C-C1 and C-C2 formed by multiple materials, the formula-derived values are 12.1% to 14.2% higher than the experimental values. The calculation error for composite columns is greater than that of single columns. However, even when employing equation (12) to compute the critical load of composite columns, there is still a good agreement with the actual results.
Conclusions
This study undertakes a preliminary experimental investigation to compare the structural responses of timber, laminated bamboo and bamboo–timber composite columns subjected to axial compression, with an aim to provide the first-hand dataset for following-up researchers and further studies from our research team. We observed three distinct failure modes and noted that laminated bamboo and bamboo–timber composite columns demonstrate superior ductility compared to timber columns. Their compressive behaviour unfolds in three successive stages: elastic, elastoplastic and softening stages. Additionally, we propose a modified Euler-Buckling model integrating the concept of yielding layers. These findings yield significant insights, underscoring the following conclusions:
The failure modes observed in the three types of columns exhibit distinct characteristics. Both laminated bamboo (B-C) and bamboo–timber composite columns (C-C) demonstrate greater ductility compared to timber columns (T-C). Failures in all cases occur due to tension failure at tension zones, albeit with varying patterns of progression leading to member failure. Notably, B-C and C-C specimens exhibit sufficient warning signs prior to member failure, indicating more favourable structural behaviour for practical engineering applications. The failure of specimens unfolds in three distinct stages: elastic, elastoplastic and softening stages. In T-C specimens, strain distribution becomes uneven, particularly from the elastoplastic stage onwards. Strategically placing more uniformly laminated bamboo layers at the outer surfaces of the column helps mitigate this effect. Leveraging the plane-remain-plane assumption and a piece-wise constitutive model calibrated for timber and bamboo in this study, we introduce the concept of a yield layer under Euler buckling theory to estimate the critical load for the three types of columns. Results obtained from the proposed analytical model show a 6.2–6.8% difference for T-C and B-C specimens compared to experimental data, while C-C specimens exhibit a 12.1–14.2% difference. This suggests a good agreement between analytical estimations and experimental results.
Footnotes
Acknowledgements
This research was supported/partially supported by the Royal Academy of Engineering-Industrial Fellowship (IF\192023), National Nature Science Foundation of China (51768008, 52168016), British Council and Ministry of Education, China (UK-China-BRI Countries Education Partnership Initiative 2019), British Council (Enabling Grants to Strengthen UK-China Institutional Partnerships through academic collaboration 2021), Nature Science Foundation of Guangxi Zhuang Autonomous Region (2019JJA160137), and Royal Academy of Engineering-Visiting Professor (VP2021\7\12). The authors also would like to express their special gratitude to the significant investment from the Research, Innovation & Enterprise office of Edinburgh Napier University that enable them to acquire industrial level of press machine to support this research project.
Author Contributions
Yu Deng: conceptualisation, data curation, formal analysis, funding acquisition, investigation, methodology, project administration, resources, supervision, validation, visualisation, writing – original draft, writing – review & editing. Weidong Xia, Siqi Yang, Miao Ni, Gaxu Huo: data curation, formal analysis, investigation, methodology, software, validation, visualisation, writing – original draft, writing – review & editing. Hexin Zhang: conceptualisation, data curation, formal analysis, funding acquisition, investigation, methodology, project administration, resources, supervision, validation, visualisation, writing – original draft, writing – review & editing. Simon H F Wong, Piti Sukontasukkul, Chayanon Hansapinyo, Yuxin Zhang, Khampaseuth Thepvpngsa, Mario SEIXAS, João de Almeida Melo Filho: methodology, validation, writing – original draft, writing – review & editing.
Declaration of conflicting interests
The authors declared no potential conflicts of interest with respect to the research, authorship, and/or publication of this article.
Funding
The authors disclosed receipt of the following financial support for the research, authorship, and/or publication of this article: This work was supported by the Royal Academy of Engineering, National Natural Science Foundation of China, Natural Science Foundation of Guangxi Zhuang Autonomous Region, British Council.