
Abstract
Mass timber composites (MTCs) generally require stiff glued connections to meet serviceability design criteria; however, achieving stiff glued connections without conventional pressing infrastructure can necessitate alternative gap filling adhesives. A readily available construction adhesive with potential for use with alternative pressing methods is investigated to develop the needed information for its commercial application in MTCs. The glue line thickness, surface coverage, three contact pressures, and how these parameters influence the load-slip curve of the connection when loaded in pure shear are investigated. The average glue line thickness ranged from 0.76 to 0.33 mm, with lower pressures having thicker glue lines and higher pressures having thinner glue lines. The planning precision was found to be more critical than clamping pressure for glue line thickness. Based on glue bond thickness testing and fabrication experience it is recommended to use 1.2–1.4 mm2 of adhesive per mm width to create full coverage glue bonds without excessive adhesive squeeze out. When tested under pure shear, specimens were observed to fail with a mixture of wood and glue, with more glue failure present as the pressure was increased. The initial stiffness of the connection tended to increase with clamping pressure, while the strength tended to decrease. Two bi-linear data fit models are applied to determine the yield point and simplify the load-slip behaviour for use in design analysis. Overall, the 75% max load method better fit the behaviour and was simpler to apply. The shear strength and stiffness achieved experimentally across all pressures were comparable to other glue connection literature results, and when applied in the design of a 10 m long MTC ribbed panel all pressures achieved near fully composite action. Overall, the adhesive has shown to be an easy to apply and structurally viable connection alternative for MTCs.
Introduction
Background
There are limitations in achieving long floor span lengths (i.e., ≥ 8 m) for conventional mass timber flat slab systems, comprised of cross-laminated timber (CLT) slabs running perpendicular to glued-laminated timber (glulam) beams/purlins, due to vibration and human comfort. 1 Therefore, designers and researchers may turn towards value-added manufactured solutions such as mass timber composites (MTCs) (i.e., T-beams Figure 1(a), I-beams Figure 1(b)), to meet the column grid spacing requirements of modern industrial, commercial, and institutional (ICI) buildings. MTCs are comprised of a thinner solid slab panel for the flange(s) which are connected to webs, often referred to as ribs, using adhesive (e.g., epoxy - EP, polyurethane - PUR, phenol-resorcinol-formaldehyde – PRF), mechanical fasteners (e.g., sharp plates, self-tapping screws – STS), or a combination thereof.
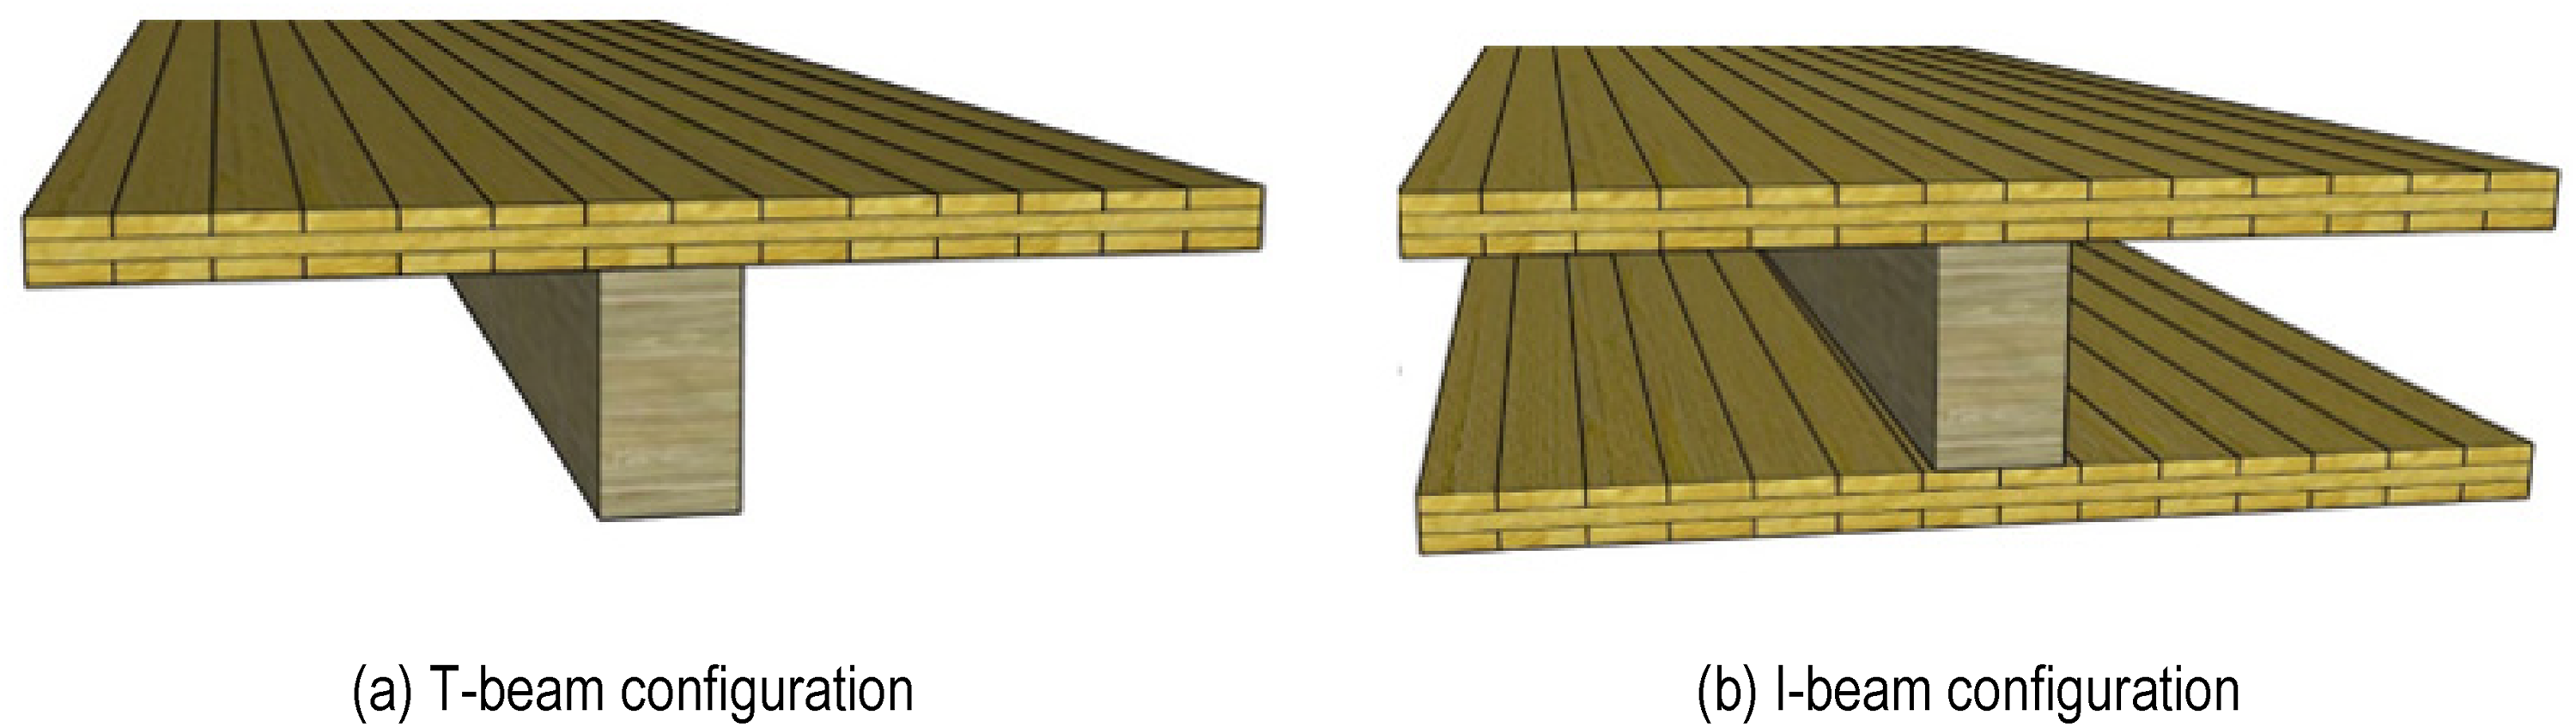
Mass timber composite panels. (a) T-beam configuration. (b) I-beam configuration.
Serviceability concerns (i.e., deflection and vibration) are often the governing criterion in the design of MTCs. The shear connection plays a crucial role in the transfer of forces between the flange(s) and web, and thus overall bending stiffness and serviceability performance of the system. The choice of connection type depends on the manufacturing infrastructure available (e.g., vacuum press) and environment in which the MTC will be fabricated (i.e., inside a manufacturing plant vs on-site).
Whereas some manufacturers can fabricate these products using a vacuum press (e.g. Stora Enso, 2 Egoin Wood Group 3 ), the physical height capacity of the press, or lack thereof, warrant the investigation into alternative pressing processes. While connections free from adhesive such as STS at an angle: 30° and 45°, and double-sided punched metal plates DSNP offer moderate stiffness,4,5 research has shown that glued connections are preferable as they exhibit the highest shear connection stiffness in comparison to other alternatives.4,5 Low stiffness connections such as STS driven vertically (90°) were reported to not produce the needed stiffness to efficiently achieve adequate vibration performance at long spans. 6
While initial studies have showcased the potential of MTCs with high stiffness connections to be designed to meet long floor spans in laboratory and numerical settings,4,5,7 there has been a slow adoption by the industry in large part due to the complications implementing viable shear connections in manufacturing processes, specifically those involving glue. One project employing MTCs without conventional pressing infrastructure is the Catalyst building in Spokane, WA. 8 For the MTC panels, the IBC 1604.7 9 required quality assurance of the screw-glued connection by verifying the adhesive quantity (i.e., weighing of samples) and coverage (i.e., measure gap size, observe squeeze out), adhesive assembly time (i.e., timing of assembly), operating environment (i.e., monitor factory temperature and humidity), and installation of fasteners (i.e., visual inspection), as well as full-scale destructive testing. 10 A commercially available high viscosity bead extruded silane modified adhesive was used in the 3.1 m × 9.2 m MTC ribbed panels as it was preferable for its ease of application, no required respiratory protection, and not bleeding out of the glulam webs, while also meeting the structural requirements and quality control standards. 10
Generally, when manufacturing any glued connection, the bond quality between two wooden elements is affected by the surface properties as well as the physical characteristics of the wood (e.g., density, porosity, moisture content, dimensional movement.11,12 To achieve an adequate glued connection with a consistent bond line thickness, the surface between the two elements should be placed flat to each other to minimize the amount of gap filling required from the adhesive minimize the pressure to adequately distribute the adhesive. 13 The pressure required for glued connections can vary significantly depending on the application, ranging from 0.05 MPa for light screw gluing to upwards of 1.0 MPa for large hydraulic presses used for glulam and CLT. 13 Despite the promising results of the commercially available adhesive in the Catalyst project, there lacks a standardized methodology and understanding in literature of the key parameters during manufacturing (e.g., surface preparation, quantity of adhesive, contact pressure, and bond thickness) affecting the bond quality in order to repeatedly achieve adequate glued connections with this adhesive type (i.e., high viscosity bead extruded silane modified adhesive).
Research overview
The overarching purpose of this research is to develop a viable glue bonded shear connection using a commercially available gap-filling bead extruded silane modified adhesive targeted for MTCs. The study investigates the potential of the adhesive to be employed in MTCs through the experimental evaluation of glue spread, bond line thickness, and structural performance when loaded in pure shear. The effects of adhesive quantity, clamping pressure, and surface preparation on the bond line thickness and load-slip behaviour in shear are evaluated on dimensional lumber. It is hypothesized that higher pressures will result in thinner bond lines with higher stiffnesses as well as higher yield and ultimate strengths. The experimental results from the shear connection are used in a hypothetical scenario of a 10 m CLT-glulam T-beam to determine the level of composite action and viability for MTCs.
Experimental research program
Overview
The experimental research was divided into two separate phases with the overall aim of developing a structurally viable glued connection with a commercially available bead extruded silane modified adhesive, namely PL Premium Max. 14 The adhesive was selected for its ease of application, gap filling ability when curing, and due to the lack of requirements for respiratory protection during application.
The first phase of the experimental program focuses on establishing the behaviour of the adhesive for the purpose of using it as a shear connection for MTCs. The adhesive spreadability, bond thickness, and necessary clamping pressure to achieve full coverage of the area are investigated on sixty specimens representative of common glulam width.
The second phase evaluates the mechanical shear strength and stiffness of a glued timber connection with the same adhesive, fabricated using three different pressures determined in the first phase. A total of twelve T-shaped shear specimens are tested to determine the behaviour of the glue pressed connection. The complete details related to the materials and methodology employed are provided in Sections 2.2 and 2.3 for the first and second phases, respectively.
Evaluation of glue spread and bond line thickness
Description of specimens and test matrix
Table 1 presents the detailed test matrix for the sixty specimens along with the key parameters investigated (i.e., element width, quantity of glue, clamping pressure) and number of replicas for each configuration.
Glue line thickness test matrix.
Readily available dimensional lumber consisting of 152 mm long 38 mm × 89 mm (2 × 4) and 38 mm × 140 mm (2 × 6) spruce-pine-fir (SPF) elements that are representative of common glulam widths were used for the glue spread and bond line thickness tests. A glue bead width of 12.7 mm was used with one, two, and three lines depending on the width of the specimen.
Based on the range of glued connection pressures in practice and the gap filling abilities of the adhesive, the three pressures selected for this study were P1 = 0.125 MPa (i.e., representing screw gluing or vacuum pressing), P2 = 0.25 MPa (i.e., representing strong screw gluing to light hydraulic presses), and P3 = 0.5 MPa (i.e., representing hydraulic presses). The naming convention consisted of the following: cross-sectional area-number of lines-specimen iteration number-pressure (e.g., 2 × 4-2L-01-P1).
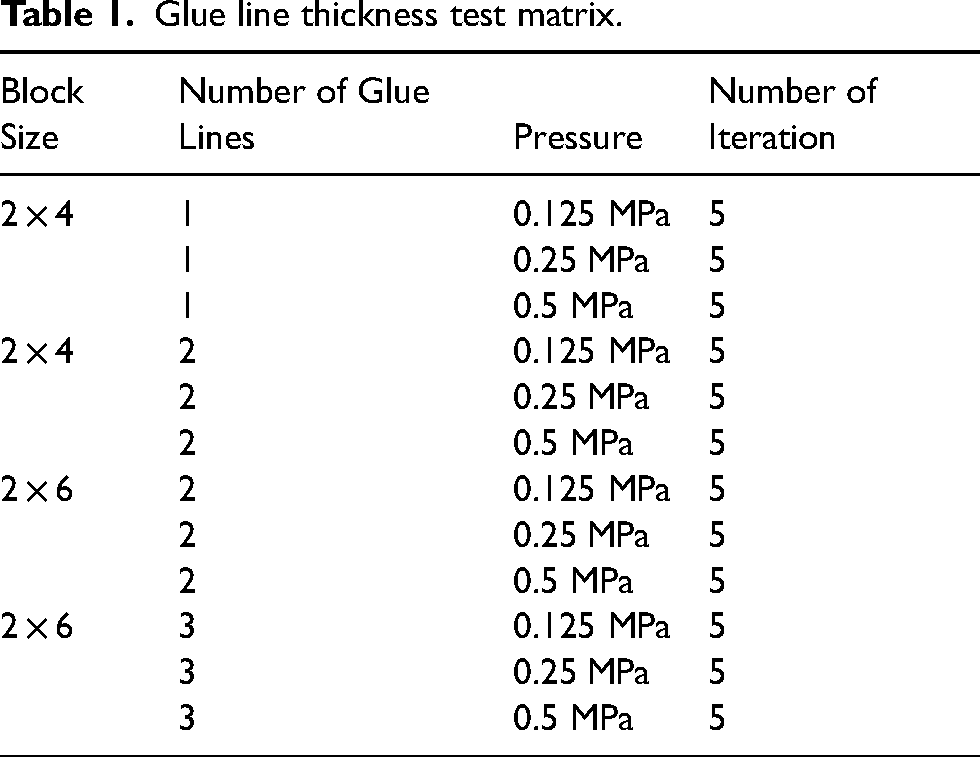
To create a flat, smooth surface for bonding, the 2 × 4 and 2 × 6 boards were all run through a surface planar twice on each face. The surfaces were then cleaned of any residual saw dust and the adhesive was applied with one and two glue lines for the 2 × 4 specimens, while two and three glue lines were applied to 2 × 6 specimens to account for the increased width as shown in Figure 2.
Representative glue spread test specimens. (a) 2 × 4 with one 12.7 mm glue line. (b) 2 × 4 with two 12.7 mm glue lines. (c) 2 × 6 with two 12.7 mm glue lines. (d) 2 × 6 with three 12.7 mm glue lines.
The adhesive is applied in evenly spaced lines as per the adhesive manufacturer documentation 14 and previous experience in commercial fabrication by Blomgren. 10 It should be noted that corners of the cross-section of the lumber pieces were rounded, which meant the flat surface area to cover with adhesive was approximately 5 mm less than the nominal dimension. Additionally, the 12.7 mm glue line was weighed and determined to have a bead area of 88.5 mm2 per mm of length of bead using the specific gravity of the adhesive. 14
Methodology
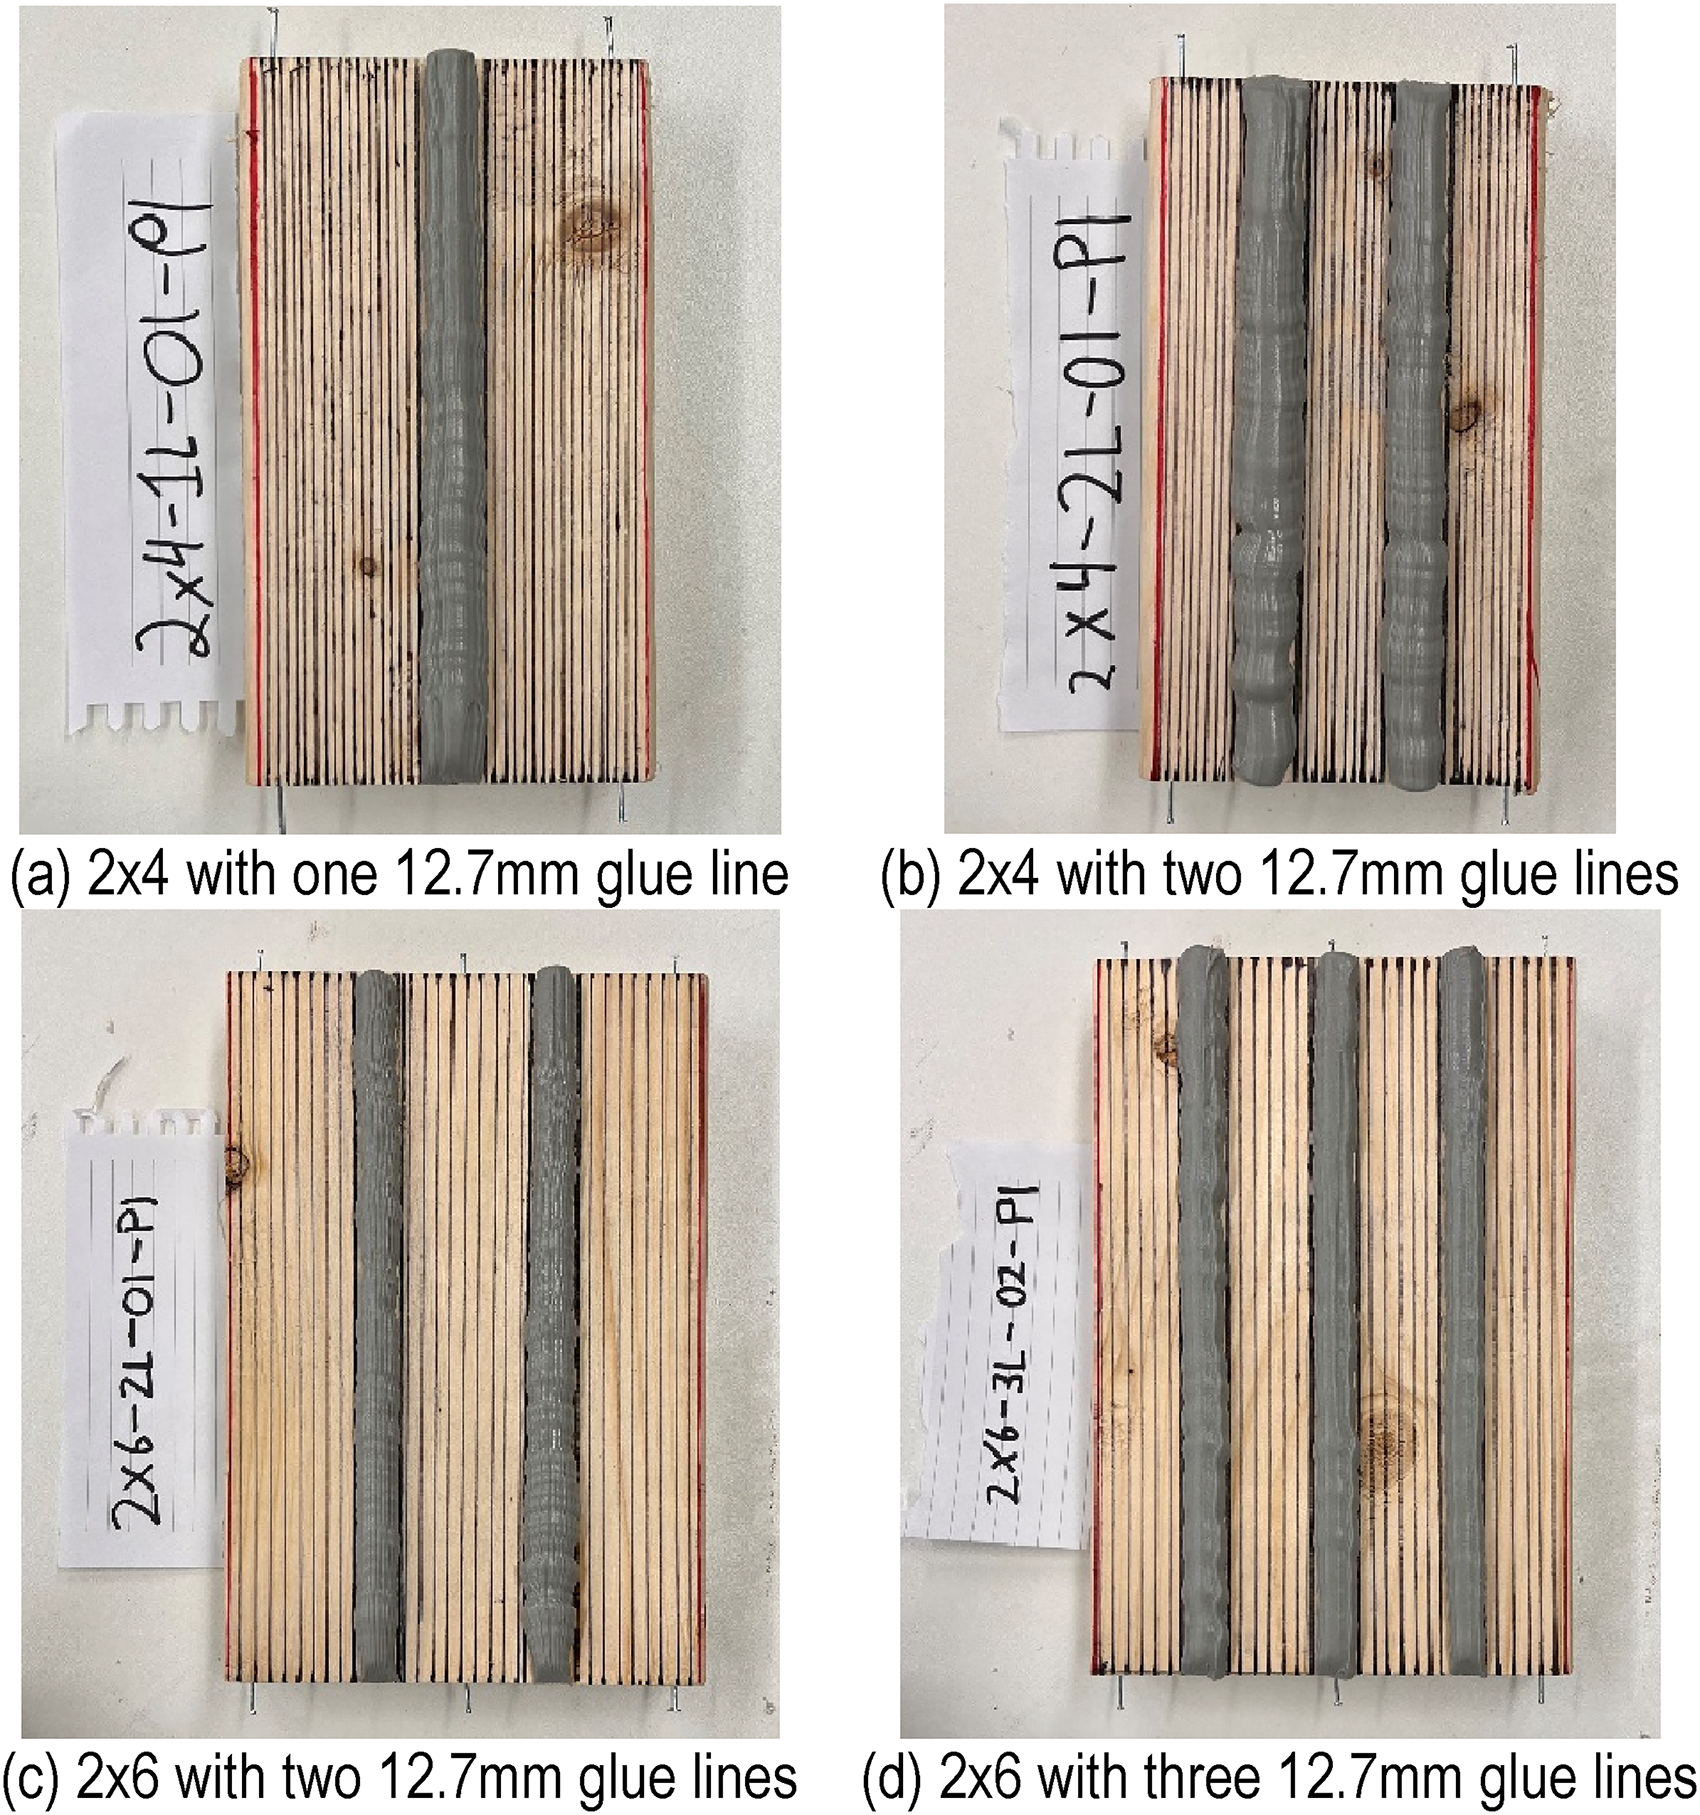
The specimens were pressed in a hydraulic loading machine to the desired pressure and held for 60 s before unloading. The glue bond line thickness was determined using small nails along the ends of the specimens (Figure 3). Measurements were taken between the nails before and after pressure application using digital calipers at all four corners for 2 × 4 specimens, with an added two measurements on centre points on the 2 × 6 specimens.
Measurement of the glue bond thickness.
The glue bond line thickness was then determined by subtracting the distance from the nails to the edge of the wood blocks from the vertical distance between nails. Similar to other studies 10 specimens were examined for adequate glue squeeze out on all sides, which is a good visual representation for sufficient surface coverage, before being pulled apart to examine the adhesive bond surface.
Evaluation of shear connection behaviour
Description of specimens
The T-beam specimens consist of 80 mm × 160 mm×500 mm long Douglas-Fir Larch (D.Fir-L) No.1/No.2 webs and 200 mm × 35 mm × 500 mm long SPF No1./No2 flanges. Four T-shaped shear specimens for each of the three pressures (total of 12 iterations) were tested monotonically to failure. A Tramex MRH3 pin-probe moisture and relative humidity meter was used to determine the moisture content immediately after testing of the webs and flanges. The density was determined by cutting small clear wood specimens from the webs and flanges which were dried in an oven and weighed in accordance to ASTM D4442: Density and Specific Gravity (Relative Density) of Wood and Wood-Based materials. 15 The average density of the webs was determined to be 473.9 kg/m3 with a coefficient of variation of 0.05, and an average moisture content of 9.6% with a CoV of 0.08. The flanges were determined to have an average density of 369.3 kg/m3 with a CoV of 0.16, and an average moisture content of 10.3% with a CoV of 0.05.
Assembly of specimens
The web and flange were glued together into T-section specimens with two evenly spaced 10 mm wide lines of adhesive, and a series of threaded rods and C75 × 6 C-channels in a clamping bracket setup, which could simulate the pressure of a vacuum or hydraulic press (Figure 4). The rods were tighten using a torque wrench which was calibrated to produce the required force corresponding to each of the three pressure levels. For pressures P1 and P2, two threaded rod and C-channel brackets evenly spaced 250 mm apart were used to produce the necessary pressure (Figure 4(a)), while pressure P3 required three threaded rod and C-channel brackets spaced 167 mm apart (Figure 4(b)).
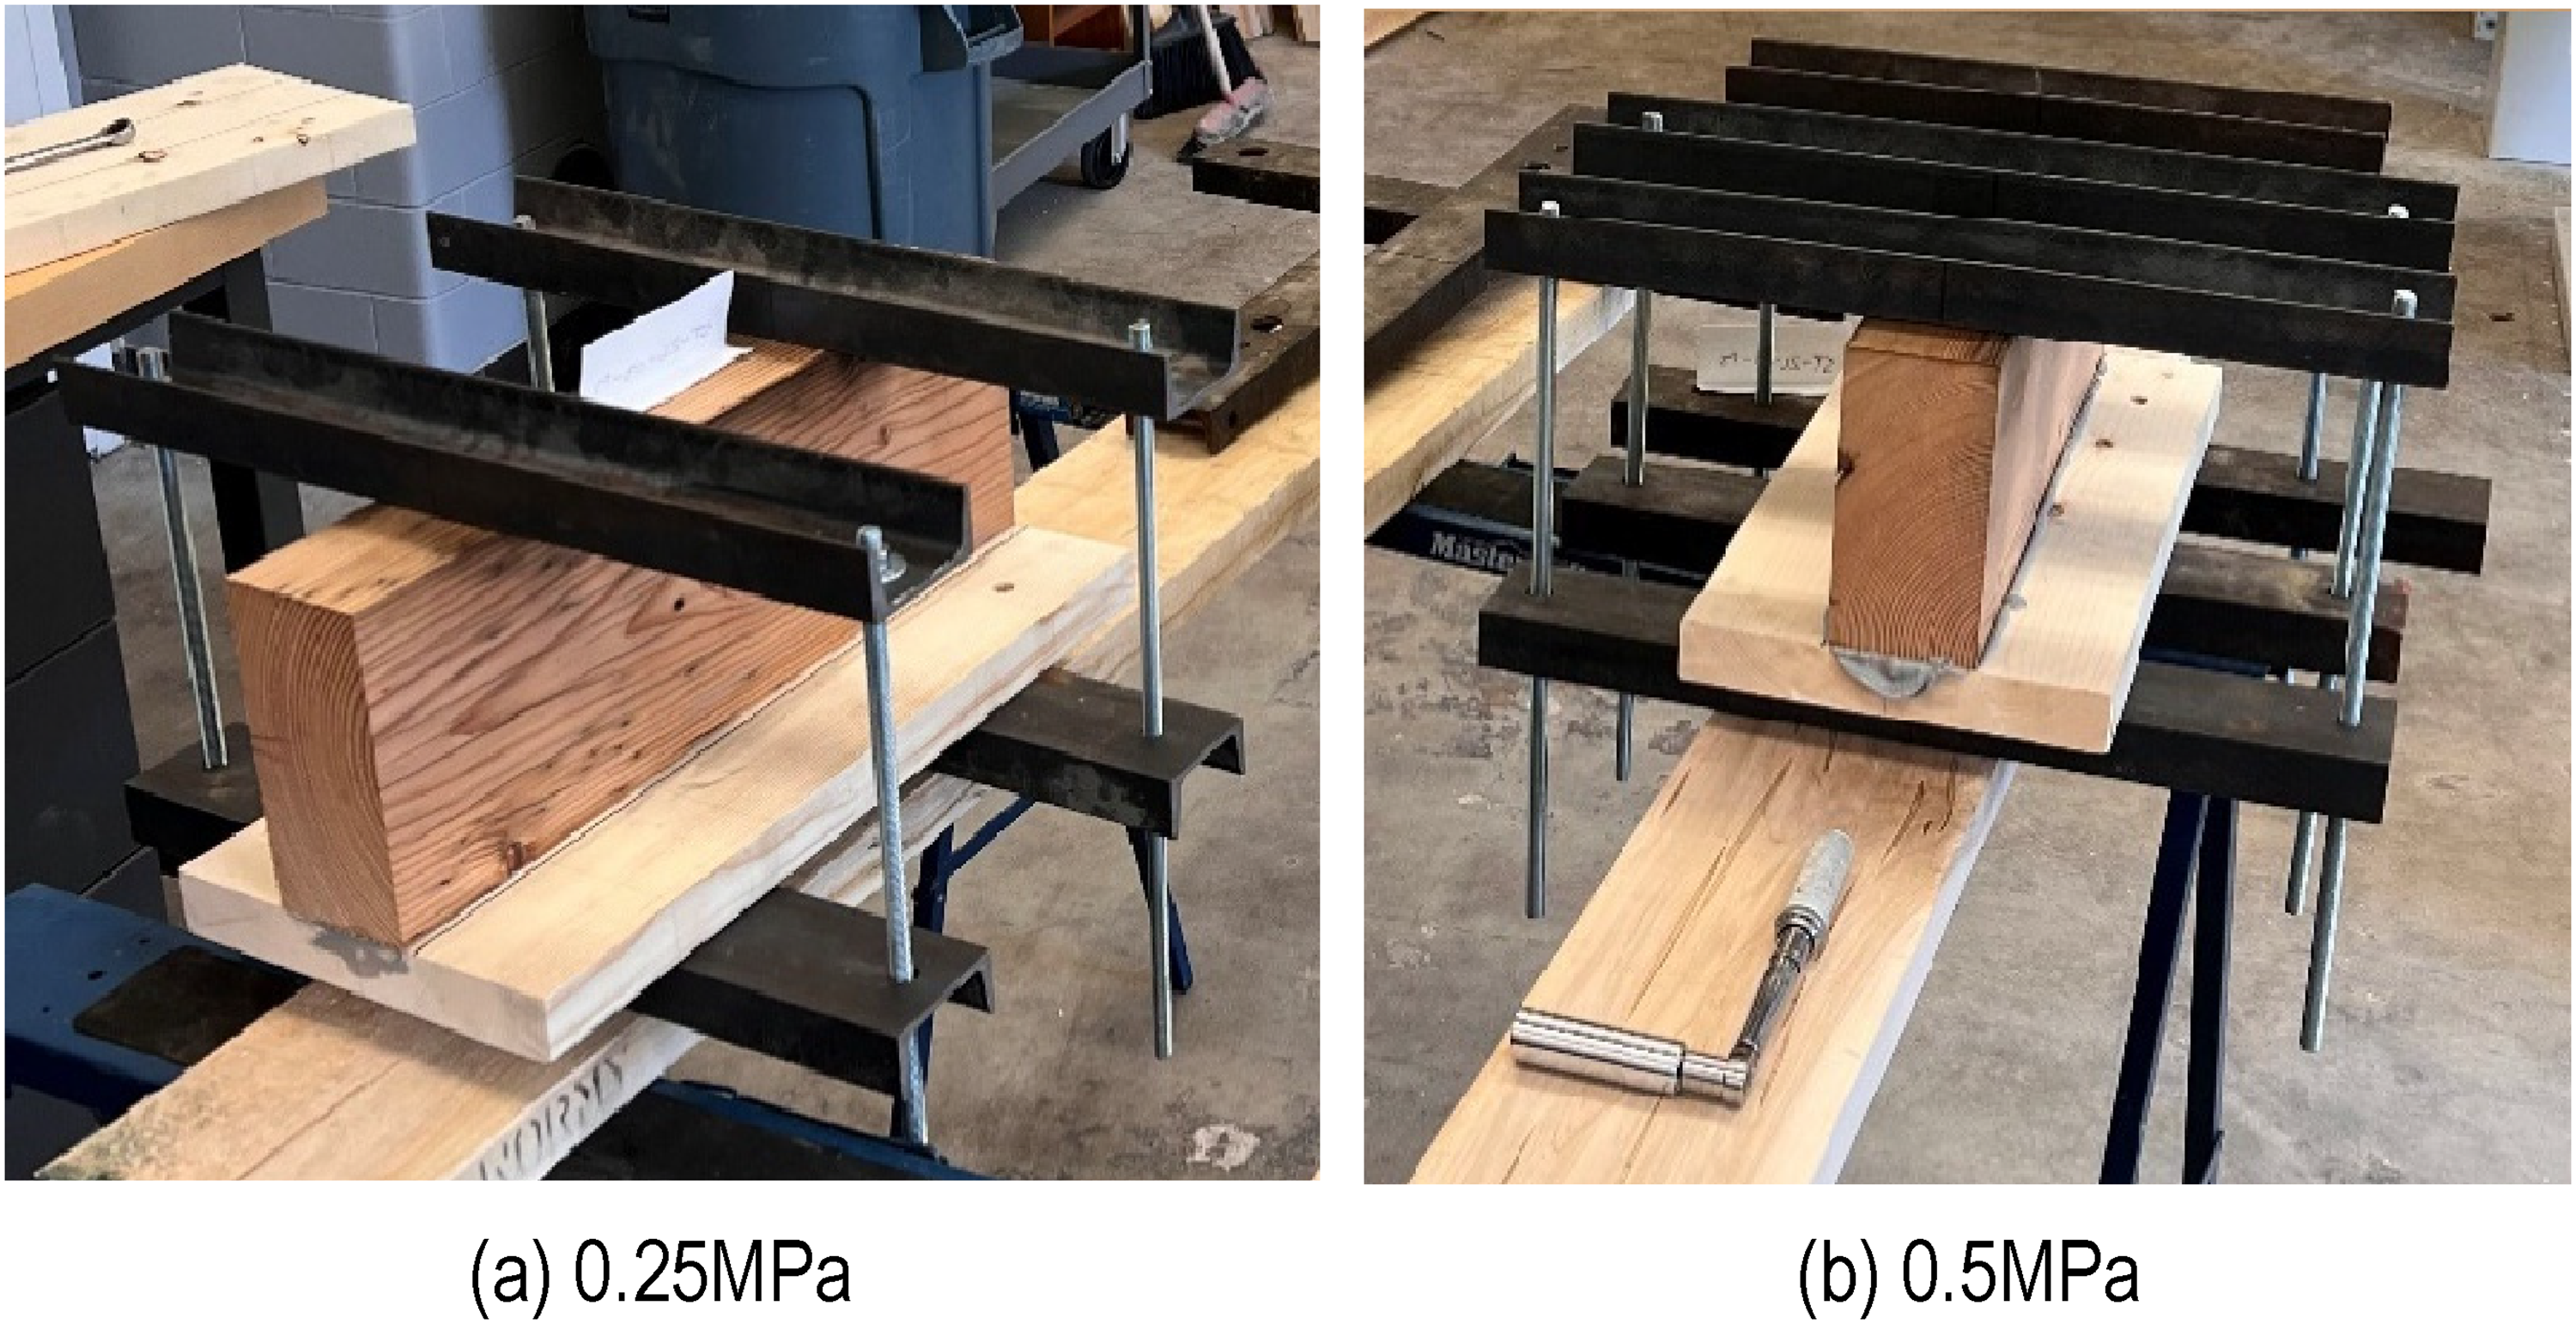
Clamping pressures of T-sections. (a) 0.25 MPa. (b) 0.5 MPa.
The relationship between the torque applied and the resulting clamping pressure was determined using the test setup shown in Figure 5, which had two c-channel brackets clamping a load cell between blocks of wood. This showed a near-linear relationship between applied torque and resulting clamping force. The test setup was also used to track the relaxation of clamping pressure in the wood over the 24hr period the adhesive was left to cure.
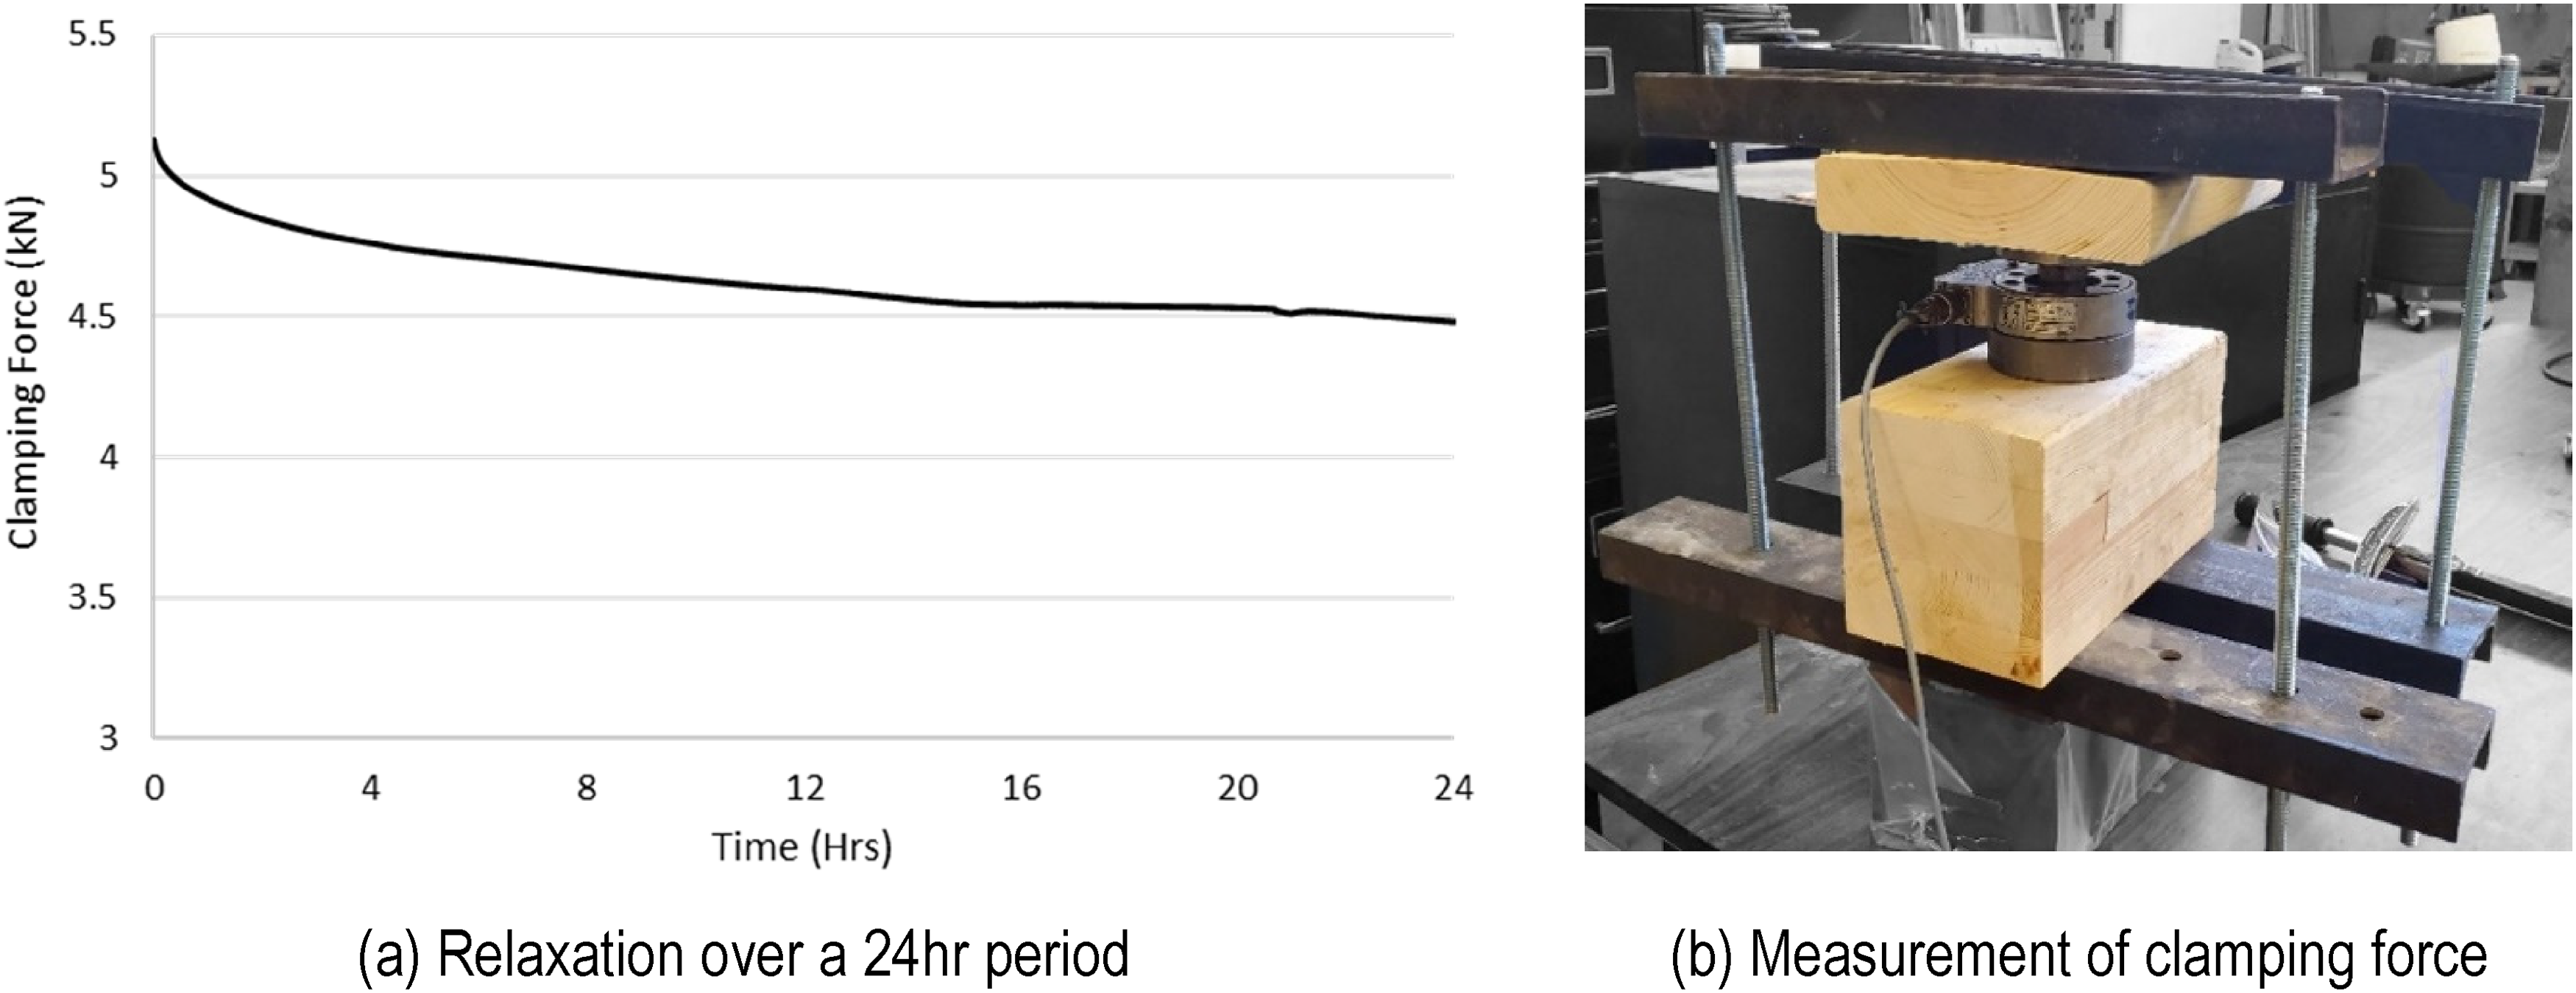
Investigation of relaxation in clamping pressure. (a) Relaxation over a 24hr period. (b) Measurement of clamping force.
The drop in clamping force overtime due to this relaxation for a P1 pressure level is shown in Figure 5(a). A drop of 8% in clamping pressure was observed after six hours while a total drop of 13% in clamping pressure over 24 h. This relaxation was observed in similar screw-gluing research 13 and is unavoidable without a force controlled hydraulic press running for the entire clamping time due to the mechanical behaviour of wood. However, the clamping setup was deemed acceptable as the initial pressure still provided adequate squeeze out (filling all the gaps between the two materials), and the adhesive began to solidify within 6hrs time when the clamping pressure was still greater than 90% of the initial pressure. 14 Similar relaxation would be seen in screw-glued and similar mechanically clamped connections, which are most likely to be used with this adhesive due to its longer cure time than conventional PUR or PRF adhesives.14,16
Setup for testing of the shear connections
The methodology employed to evaluate the bond strength of the T-sections was based on ASTM D905: Strength Properties of Adhesive Bonds in Shear by Compression Loading 17 and the procedure established by Montgomery. 5 The shear test setup is shown in Figure 6 where a reaction frame was fabricated to support the flange of the section while allowing the web to freely displace when loaded in shear. The web is restrained by a roller support resisting the eccentricity of the loading to the flange reaction, while allowing unrestricted vertical movements. There are also two additional steel plates in parallel connected by two tie rods used to help resist rotation of the flange during loading. A load was applied with a loading rate of 2.5 mm/min in accordance with ASTM D905. 17 Two linear variable differential transformers (LVDTs) were used to measure the flange to web slip on either side of the web, and the load cell of the UTM was used to record the load. The same shear configuration set-up was used for all specimens regardless of the variable clamping pressures.
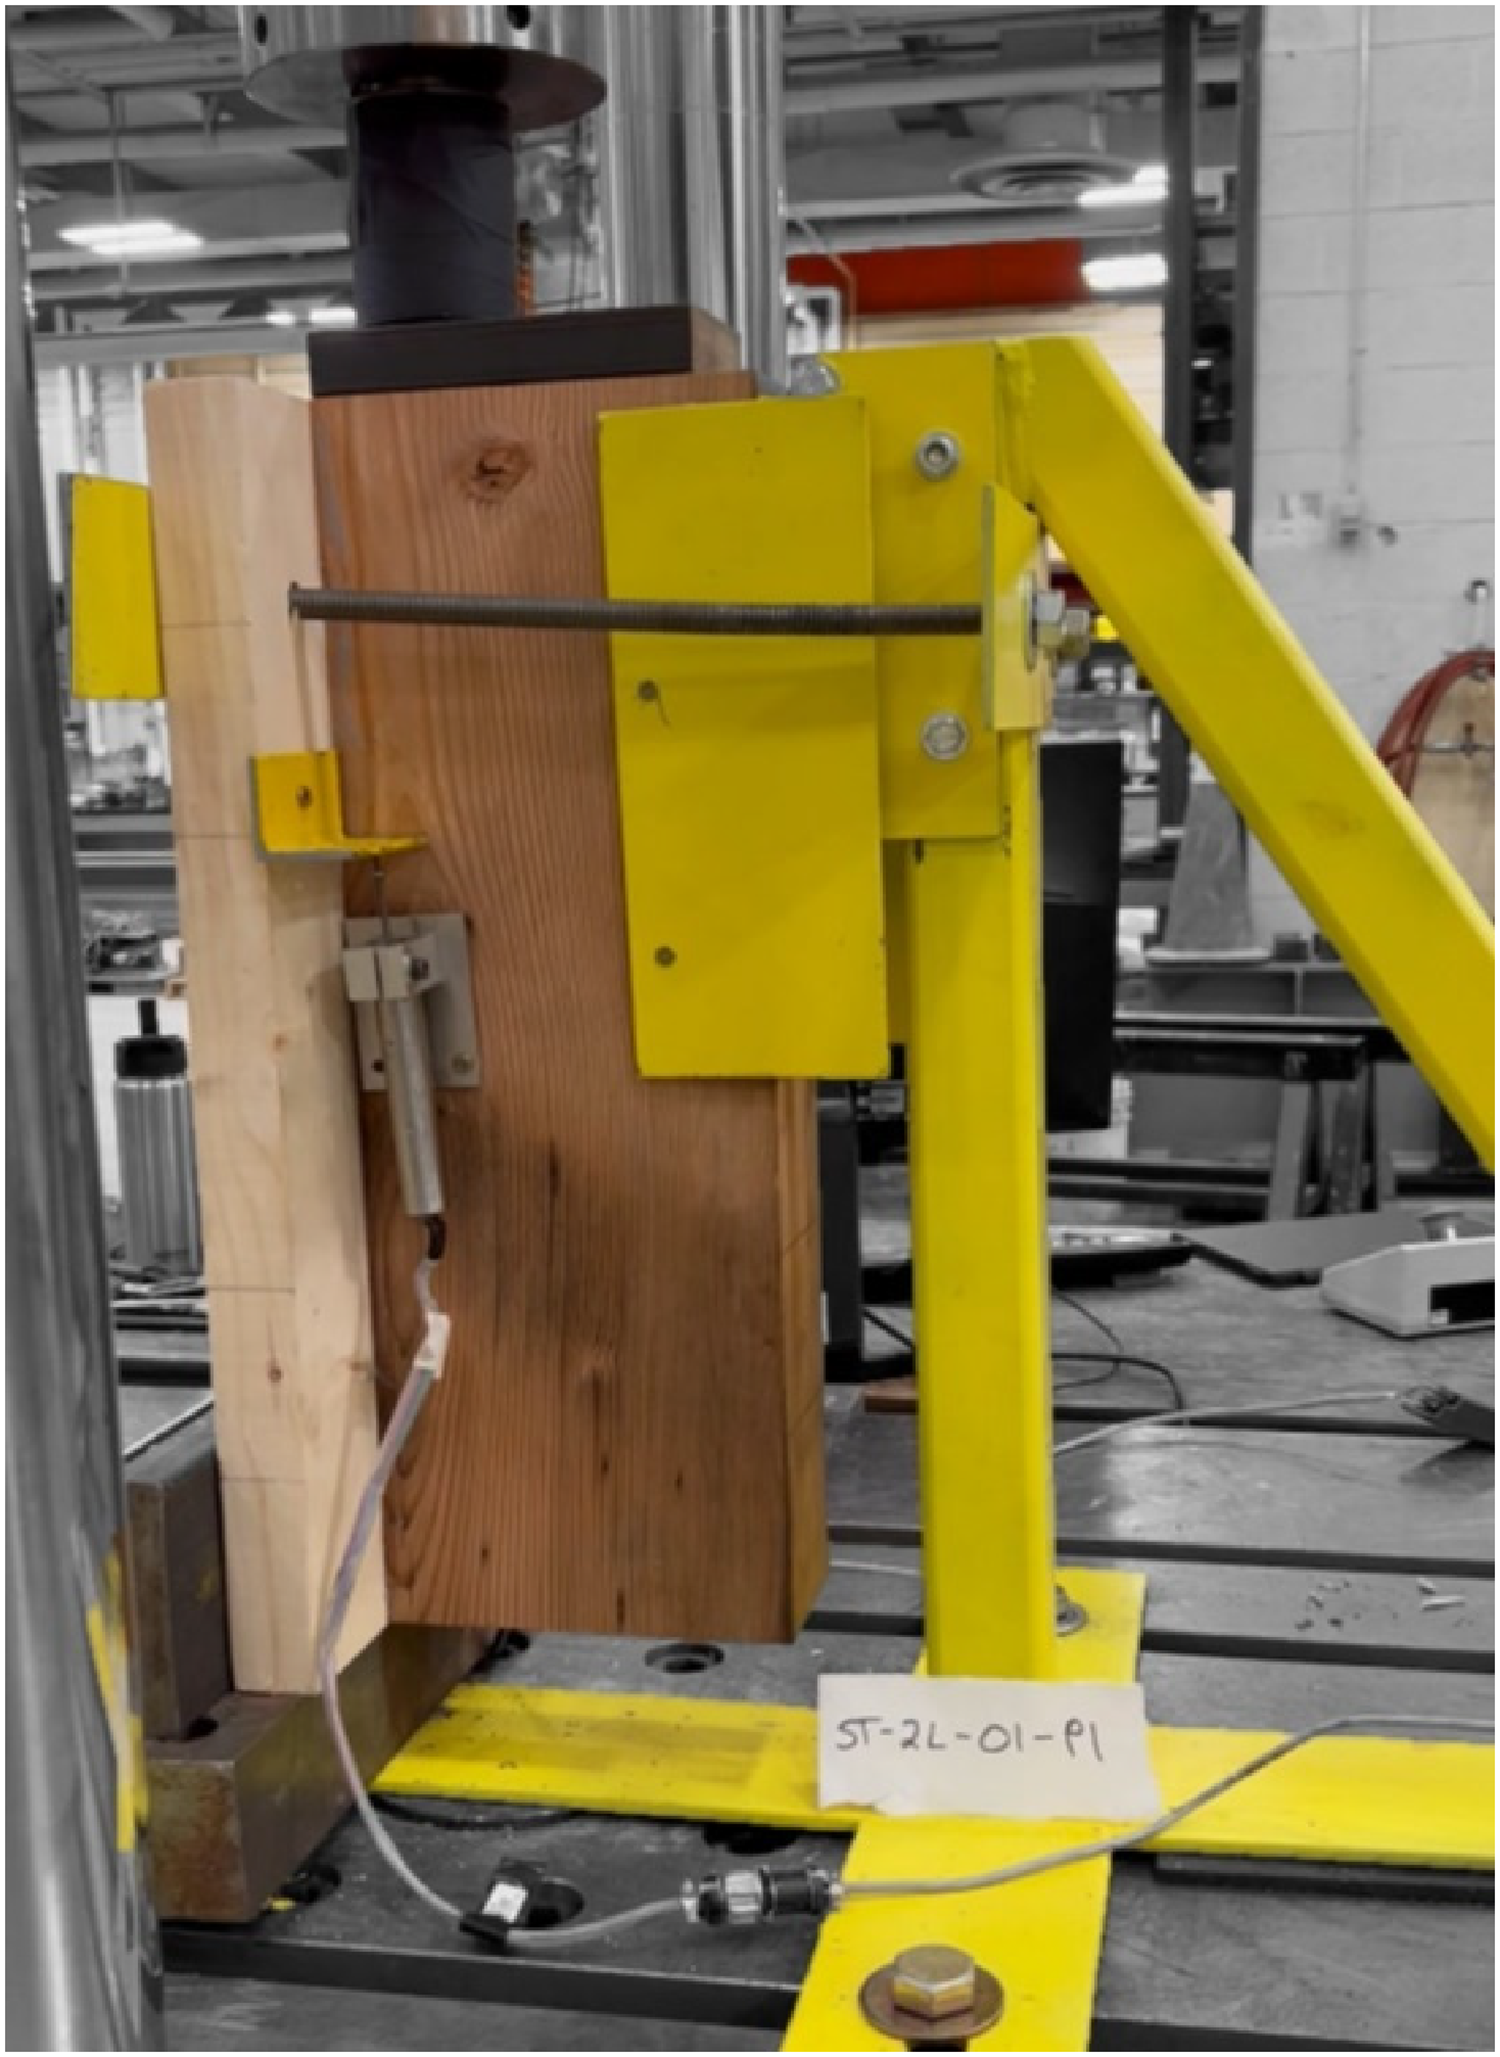
Shear connection test setup.
Analysis methodology of load-slip curves
The load-slip curve of each specimen was examined for a number of key parameters including maximum shear force, Fmax, the initial shear connection stiffness, and the yield stress. The initial stiffness, which is key for the design at serviceability level, was taken between points of 10% and 40% maximum load. The specimens were observed to behave linearly initially, followed by a non-linear strain hardening transition. The transition point between the linear and non-linear regions of the curve corresponds to the yield point and was quantified by two data fit models. The first data fit model was the European Committee for Standardization method EN 12512 18 which determines the yield point by the intersection of two lines on the load-slip curve. The first line represents the initial connection stiffness, which forms an angle α with the x-axis, while the second line is drawn tangent to the load-slip curve at a slope equal to 1/6 of α, known as β (Figure 7(a)). The second is the 75% Fmax model, which is based on that proposed by, 19 where the yield-point was determined by the point of the load-slip curve corresponding to 50% Fmax. In the current study, the 75% Fmax model appeared to better represent the yield point of the shear connections and was thus used instead of the approach proposed by Karacabeyli and Ceccotti 19 as shown in Figure 7(b).
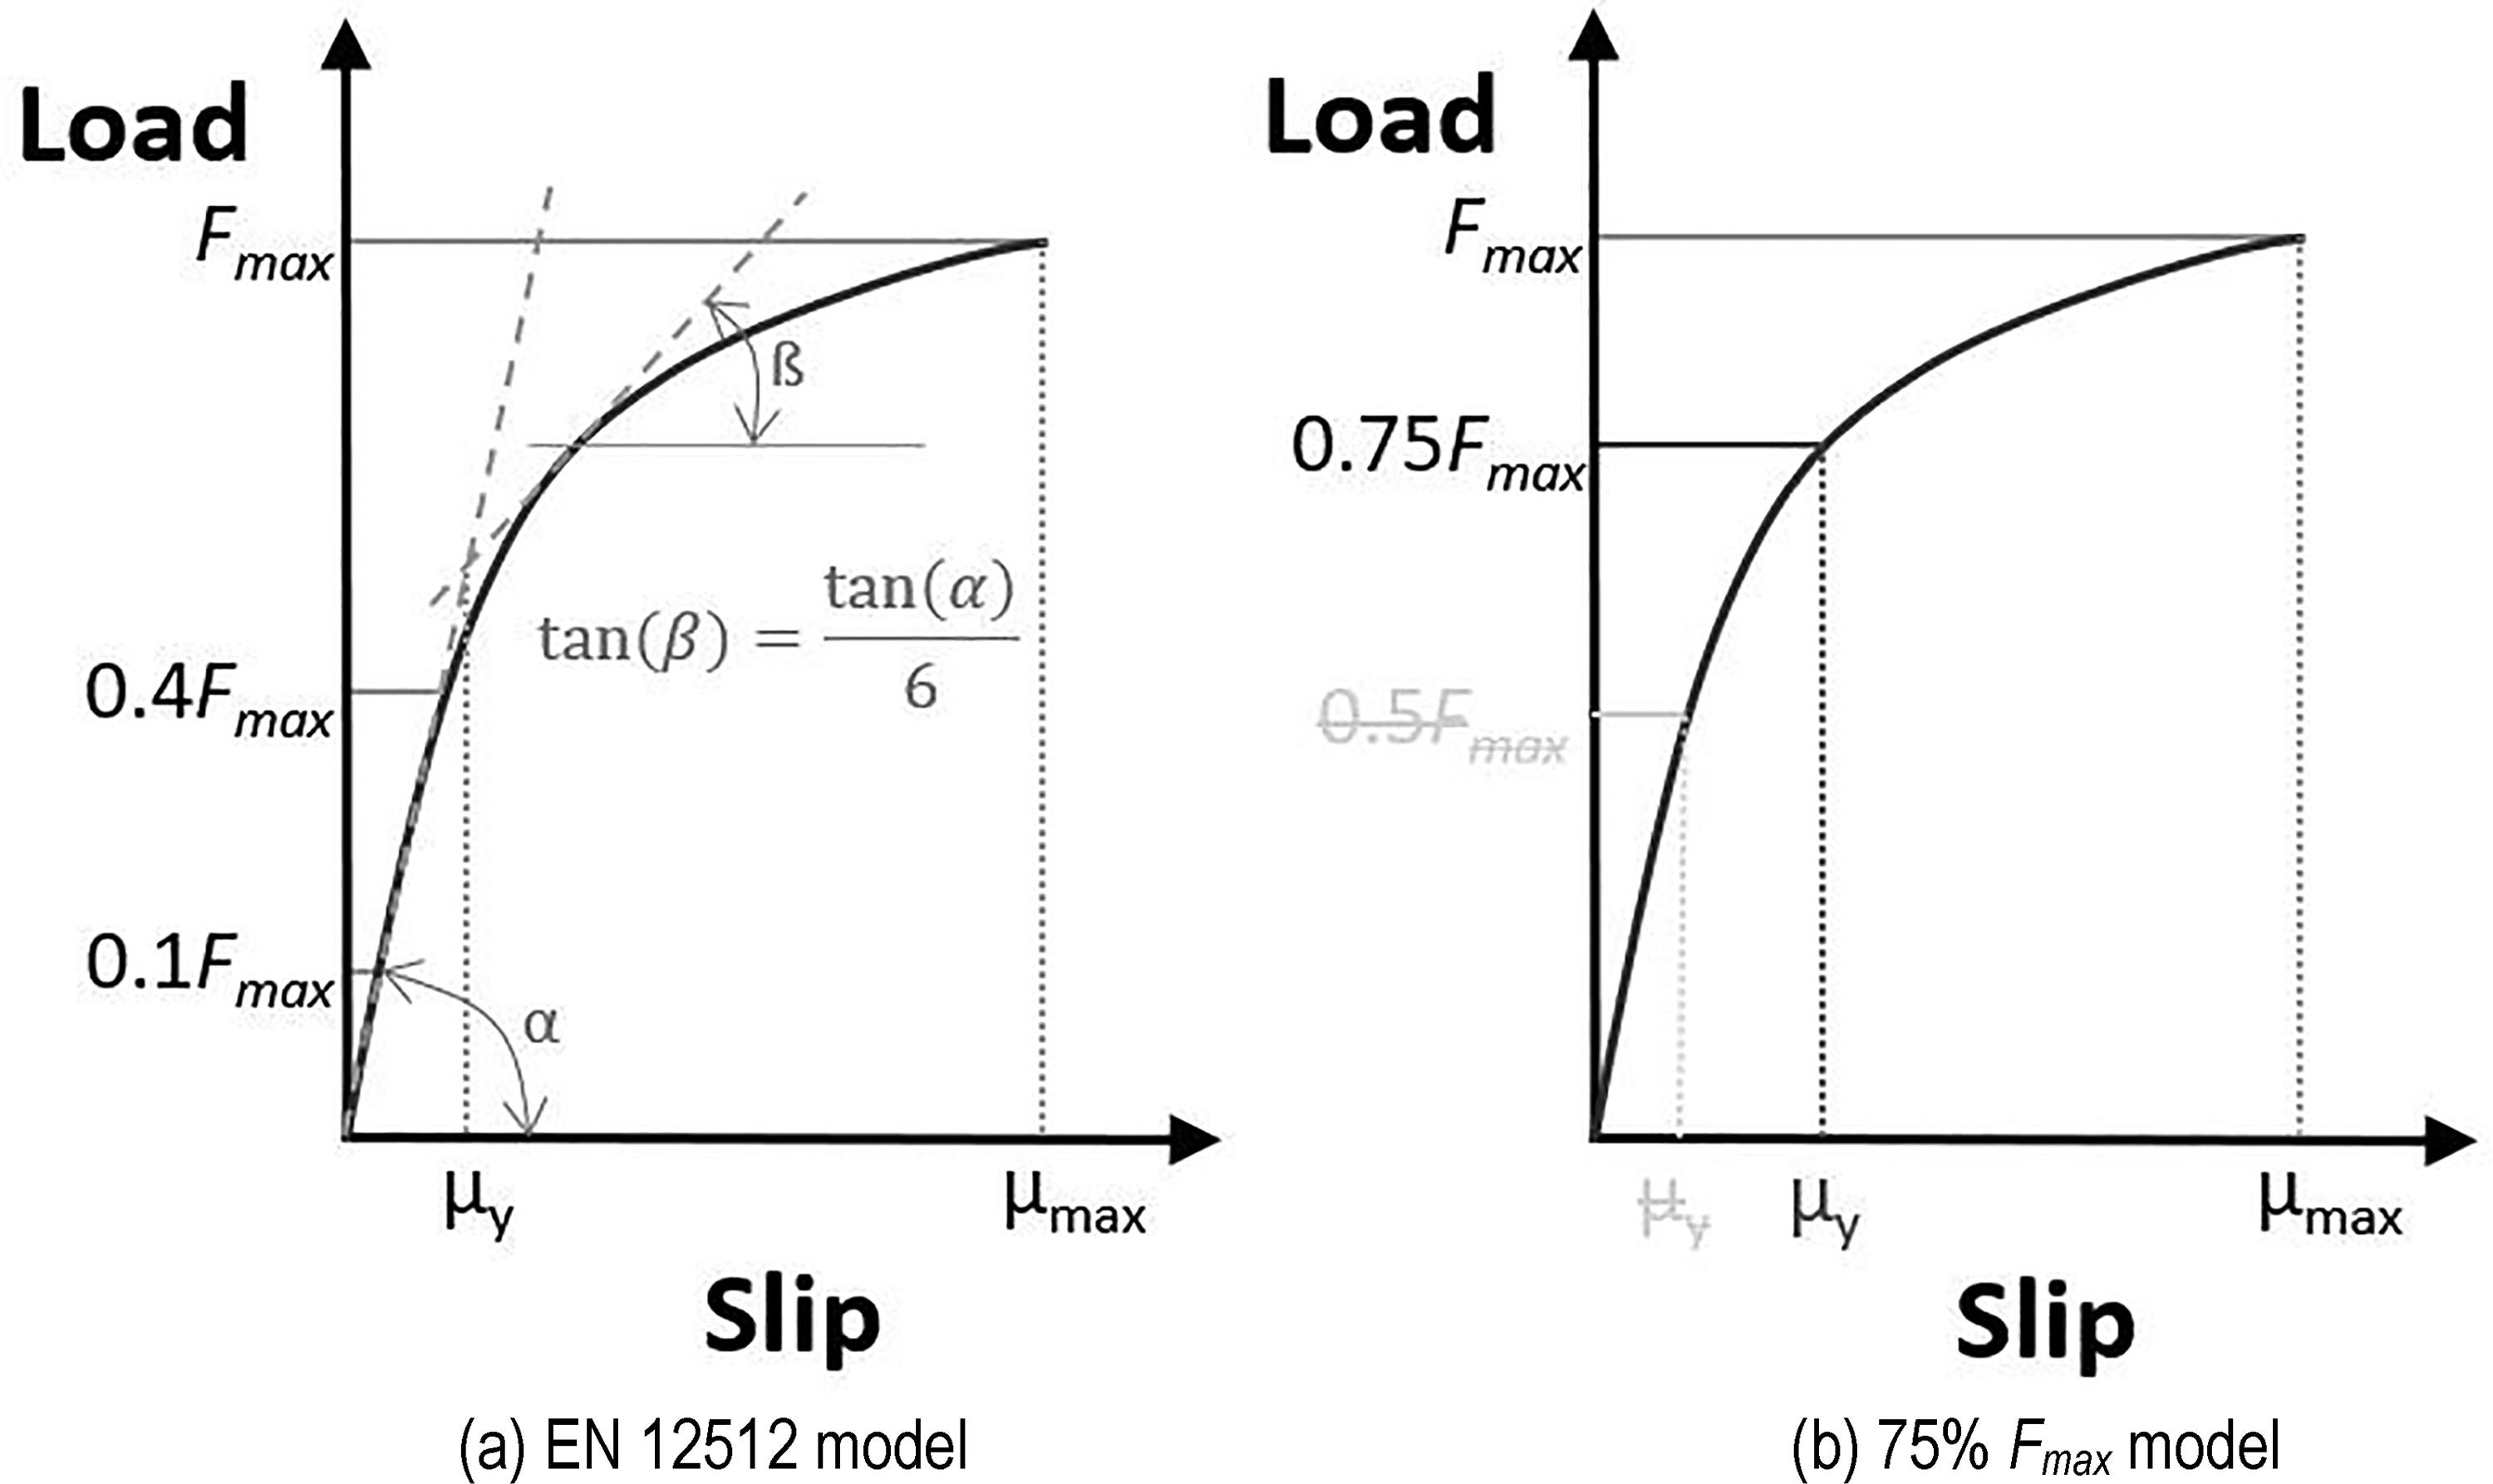
Bi-linear models for estimating the yield point. (a) EN 12512 model. (b) 75% Fmax model.
Experimental results and discussion
Glue spread and bond line thickness
To create strong and consistent glued connections between the flange and web, the glue should be evenly spread while still maintaining an adequately thin glue line thickness for the specific adhesive. 13 The gap filling nature of the adhesive used means that a thicker bond line can still be adequate as opposed to other adhesive types, such as polyurethane, which often require bond line thicknesses less than 0.1 mm. 16 The first indication of an adequate glue spread was the adhesive squeezing out of the specimens’ sides. This indicated that the clamping force was spreading the line(s) of adhesive over the entire contact surface and thus creating a complete coverage between the two halves of the specimen. Of note, the adhesive squeeze out was limited at the corners for some specimens due to some adhesive leaking out the ends (Figure 8). Those configurations with plenty of excess adhesive and higher pressure (i.e., 2 × 6-3L-P3) were still able to have squeeze out at the corners due to the adhesive excess. This phenomenon only occurs at the very ends of gluing specimens due to nothing blocking the adhesive from squeezing out the end. In practice (e.g., gluing a mass timber web and slab), this concern would be very local to the end of the beam and could be solved by adding more adhesive in this local area or blocking adhesive flow out of the ends with dams.
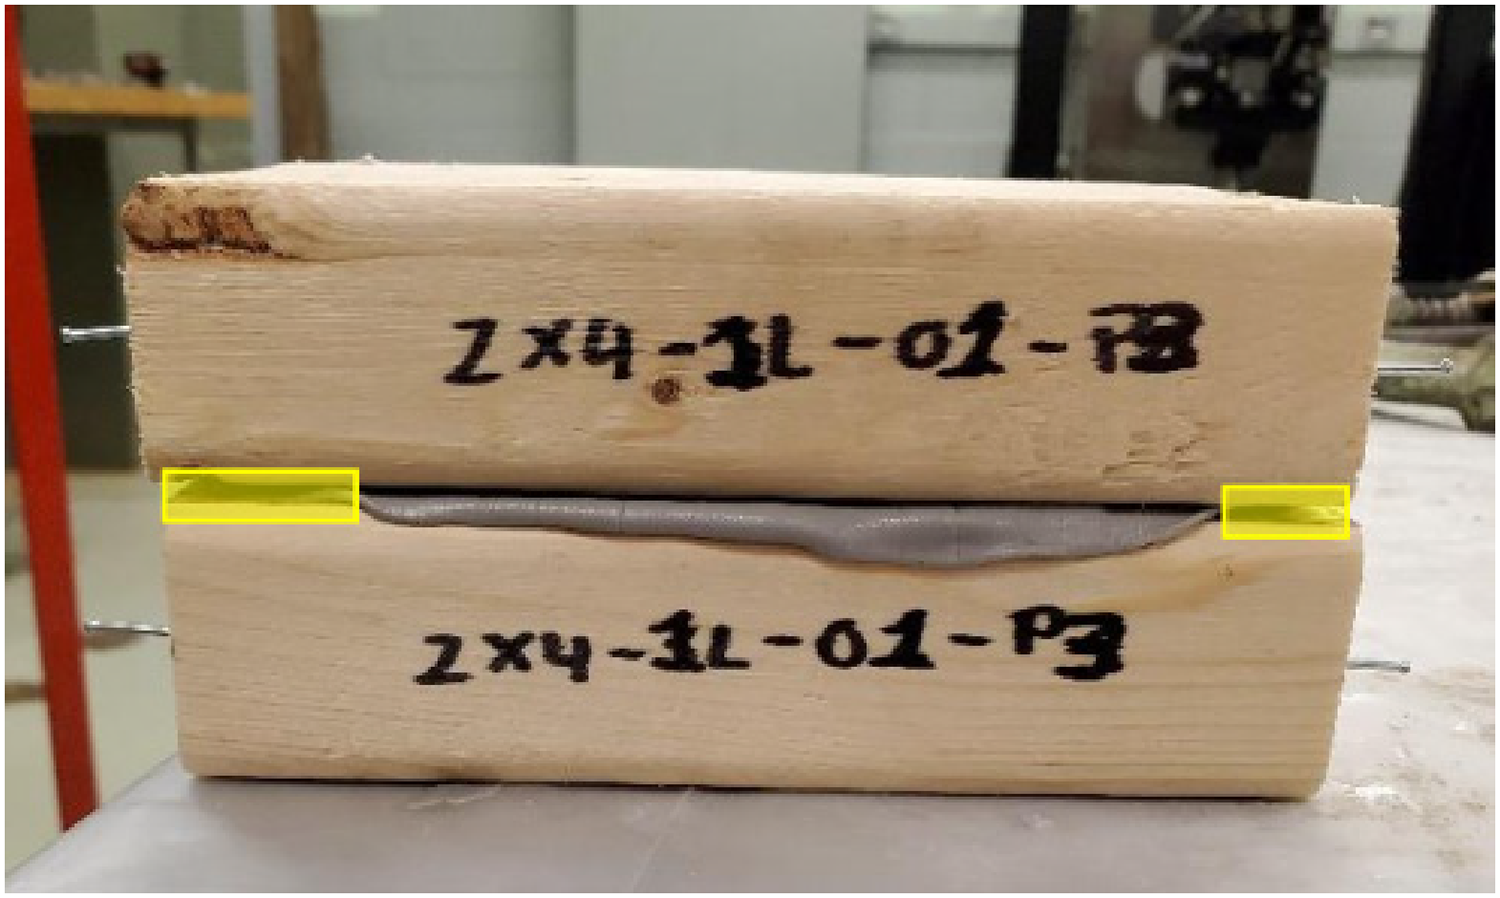
Lack of glue squeeze out at the corners.
The two halves of the specimens were put in clamps and separated, where investigation of the exposed glue surface provided a complete picture of how the glue spread over the contact area. In general, the one line on the 2 × 4 specimens with pressure P1 was not adequate to cover the entire surface area, with squeeze out not occurring on some sides as shown in Figure 9(a). Pressure P2 and P3 were able to cover most of the surface (aside from the corners) but had very minimal coverage at some of the edges indicating one line was likely not enough for the 2 × 4 wide surface area. Conversely, as shown in Figure 9(b), the 2 × 4 specimens with two lines observed significant squeeze out for all pressures. The amount of adhesive squeezed out was found to be almost half of that applied, which was deemed too much and would result in significant wasted adhesive.
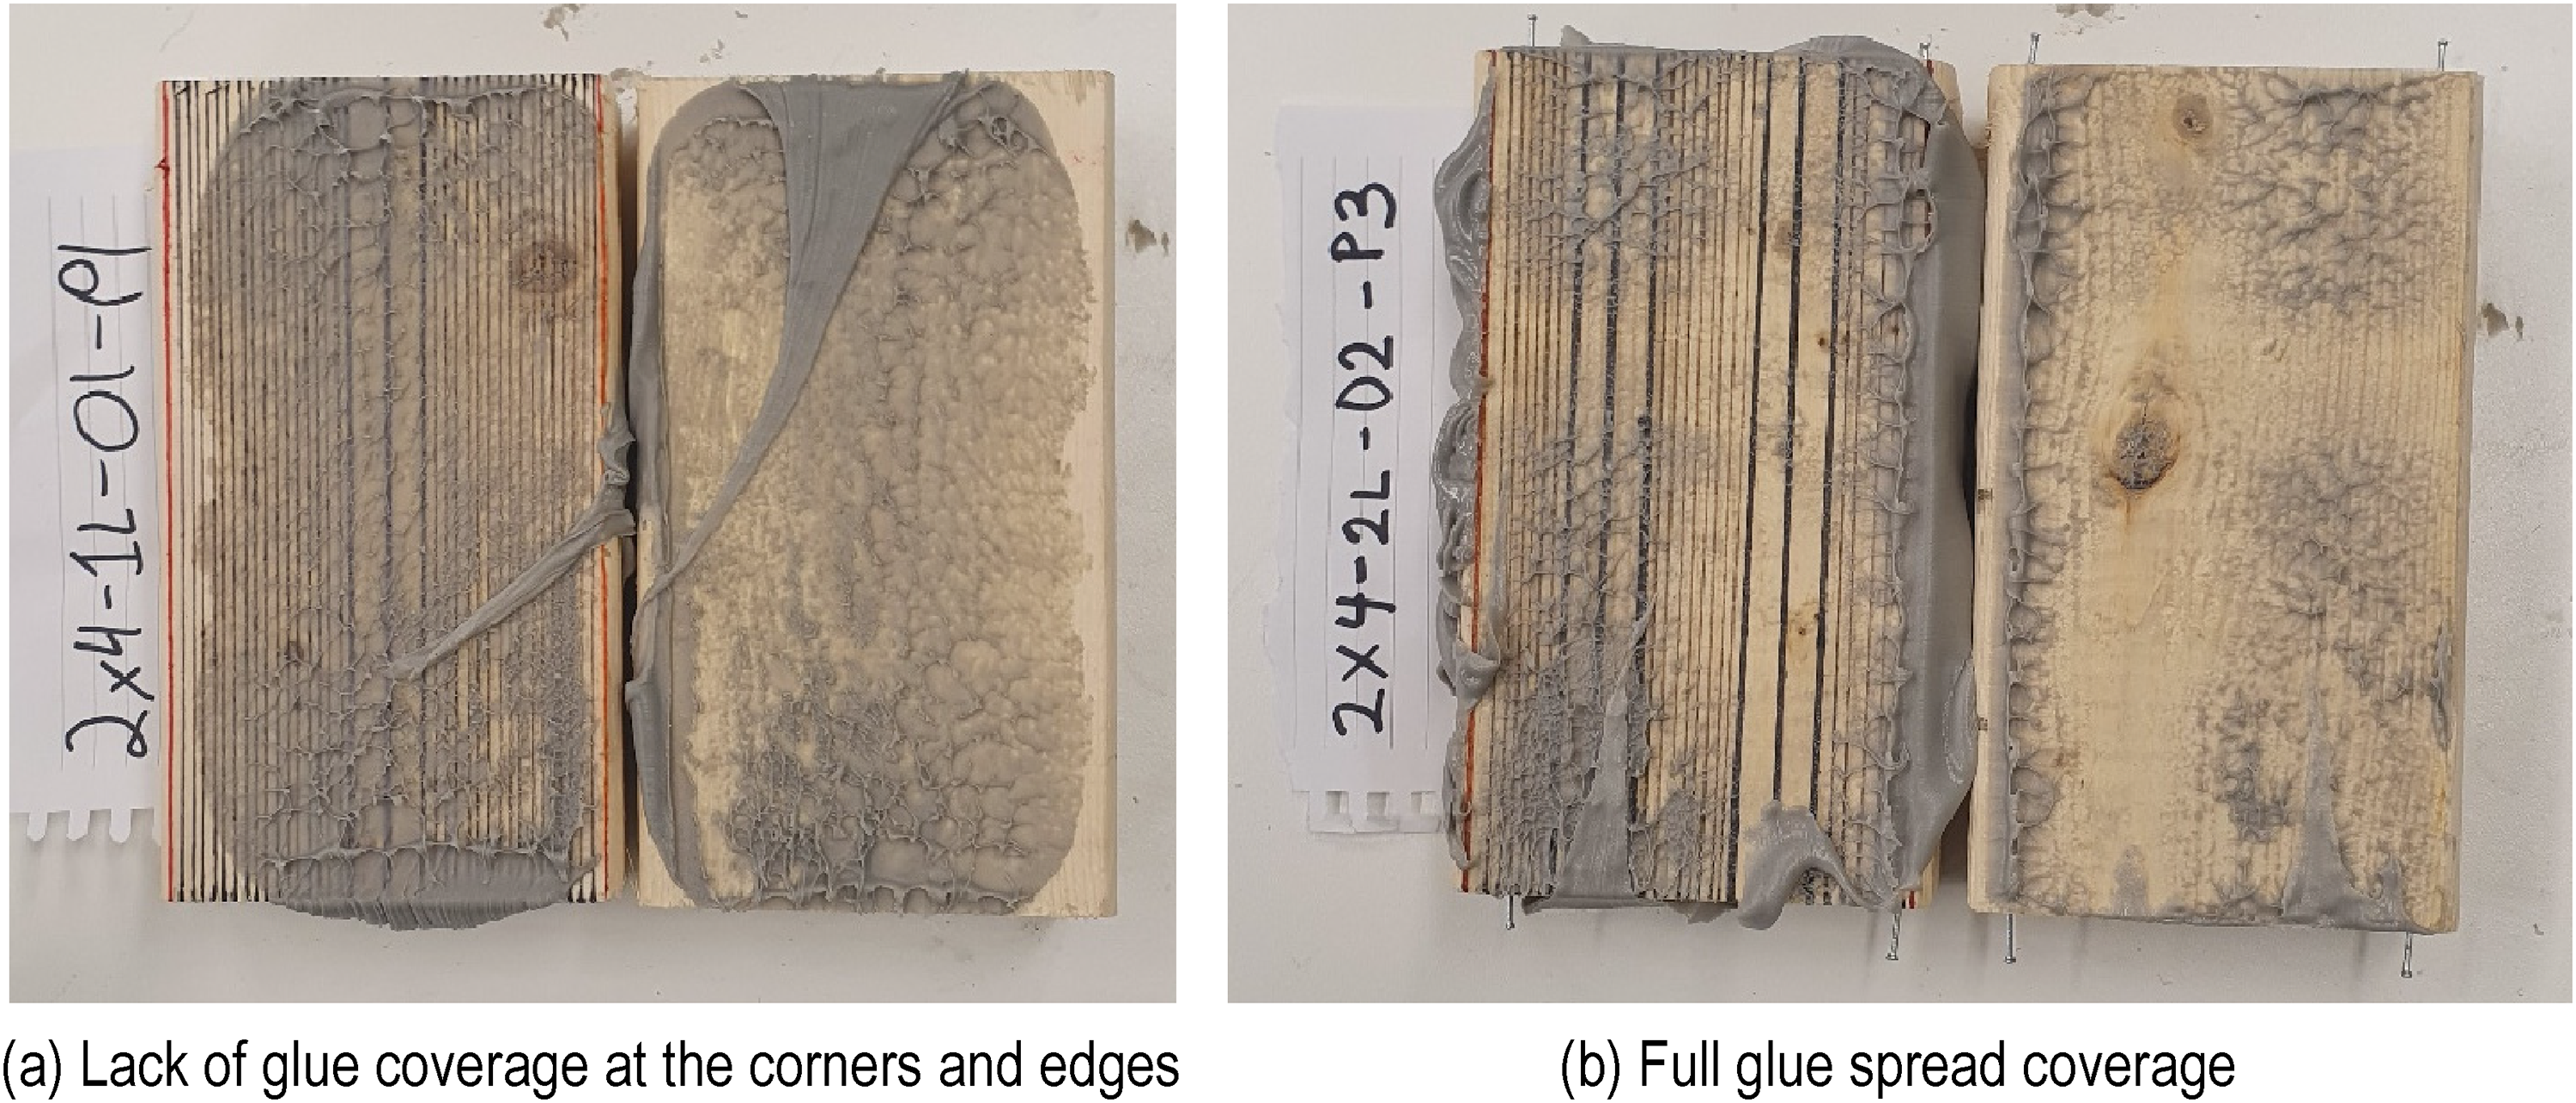
Separated 2 × 4 specimens post-clamping. (a) Lack of glue coverage at the corners and edges. (b) Full glue spread coverage.
For the 2 × 6 specimens, the two-line iterations were found to only just cover the entire surface for all the clamping pressures. However, some sparse squeeze out areas were present, indicating some areas near the edges may not be covered adequately (Figure 10(a)). While these specimens were found to still have adequate coverage, the risk of slightly uneven clamping resulting in squeezing too much adhesive out one side, or elements not being planned as well as those in the current study resulted in the volume of adhesive present in the two lines being deemed inadequate to sufficiently bond the entire surface area. As expected from the two-line results, the three-line 2 × 6 specimens had significant glue squeeze out and the surfaces were adequately covered with adhesive (Figure 10(b)). Similar to the two-line 2 × 4 specimens, this was deemed as too much wasted adhesive and a volume between that of the two and three lines is recommended for the surface area of the 2 × 6 s.
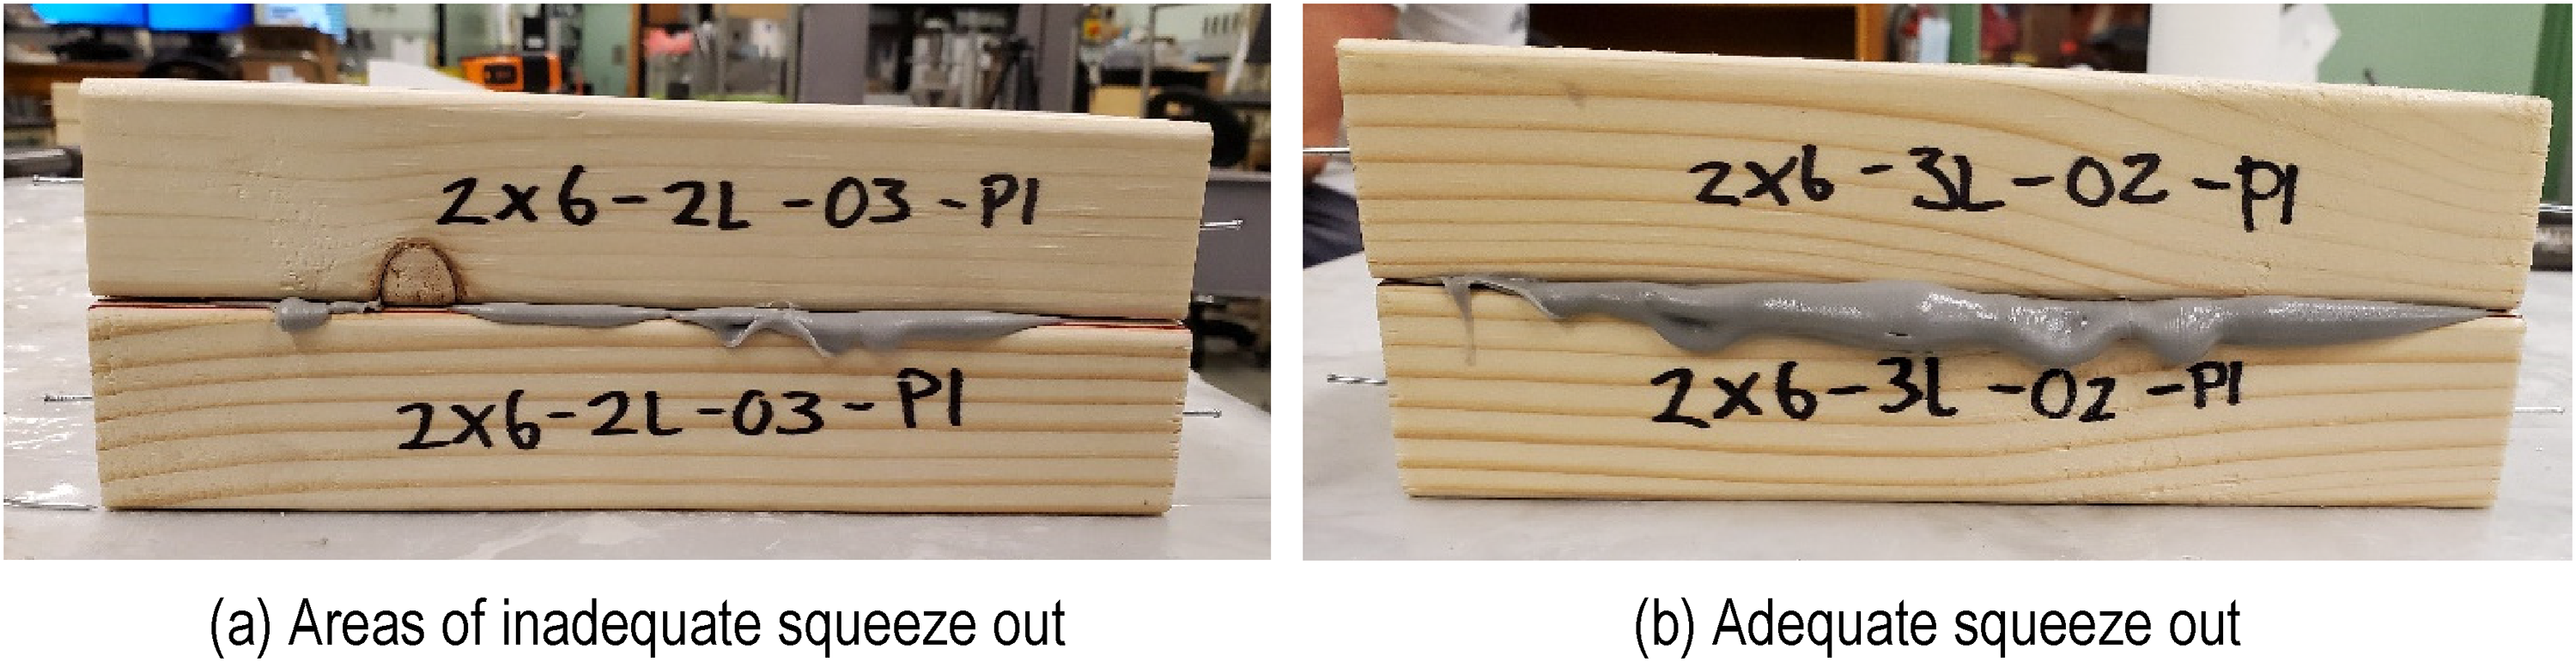
Glue squeeze out of 2 × 6 specimens. (a) Areas of inadequate squeeze out. (b) Adequate squeeze out.
Table 2 presents the average glue line thickness along with the CoV in brackets for all configurations. The average glue line thickness varied from 0.76 mm to 0.33 mm for the lowest to highest pressure, respectively. In general, higher pressures resulted in a thinner glue line. However, it was also observed that if insufficient adhesive is used, irrespective of the applied pressure, it will result in a coverage deficiency (e.g., 2 × 4-1L, 2 × 6-2L). Conversely, adequate coverage can be obtained by adding an additional bead line but as observed it can also lead to excessive squeeze out and wasted adhesive. Therefore, it is important to find the appropriate balance between the quantity of glue to provide to avoid excessive squeeze out. This balance can also depend on whether the surfaces are adequately planned or not, as more adhesive may be required to fill any inconsistencies between the two surfaces.
Glue line thickness for each variation of pressure and glue beads.
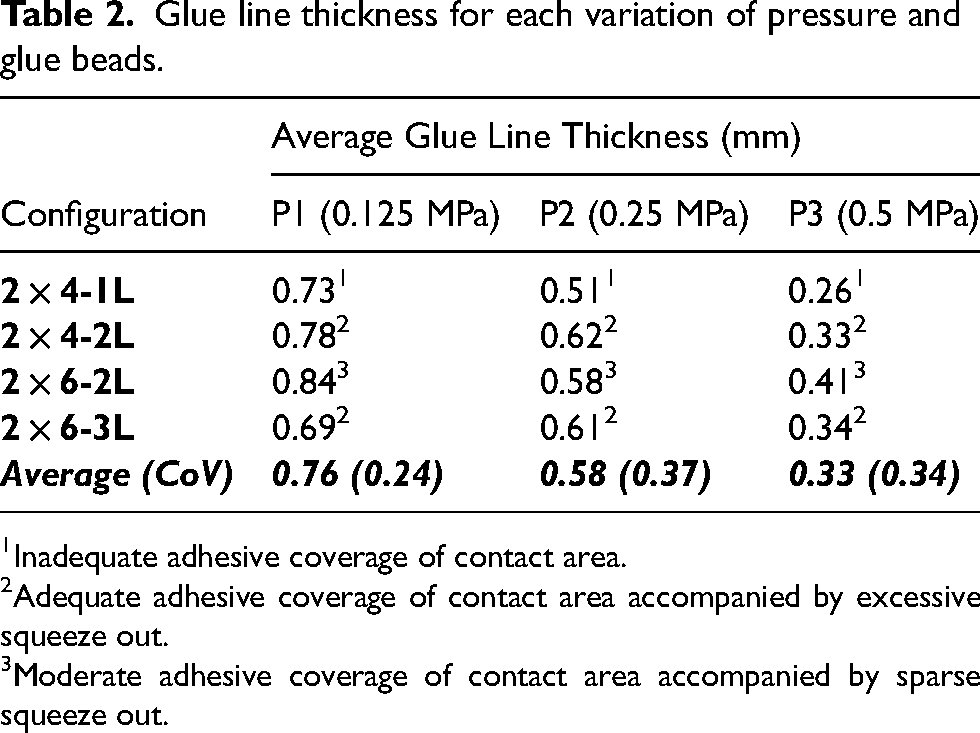
Inadequate adhesive coverage of contact area.
Adequate adhesive coverage of contact area accompanied by excessive squeeze out.
Moderate adhesive coverage of contact area accompanied by sparse squeeze out.
Based on the results, it was determined that for the 80 mm wide shear connection test specimens to reduce the amount of adhesive in the bead lines. Two 10 mm wide beads (60.4 mm2 per mm length of bead, approximately 32% less adhesive), rather than the two 12.7 mm wide beads, were used to limit the amount of wasted adhesive while still being able to adequately cover the full surface area. While excess squeeze out had minimal impact of the small glue line thickness specimens, limiting the amount of wasted adhesive is key for future larger scale applications by researchers and manufacturers where the wasted adhesive can be significant if not optimized.
Table 3 provides an estimate for the recommended amount of adhesive per width of coverage area for commonly available glulam widths based on the results from Table 2 and observations made during the fabrication the shear test specimens. Significant glue squeeze out for all three pressures was observed with two 10 mm wide beads, thus two 9 mm wide beads are proposed for the 80 mm width to limit the squeeze out and wasted adhesive. The recommendations aim to provide sufficient adhesive for the glue bond line which ranged on average from 0.26 mm to 0.84 mm in testing, while also providing some excess adhesive to account for imperfections in the initial setup, uneven clamping pressure squeezing more adhesive out one side, and surfaces which may not be perfectly planed. It is recommended to use 1.2–1.4 mm2 of adhesive per mm width of surface area, with additional adhesive added locally at the ends of the elements to account for end squeeze out. This recommendation can be used for future studies using PL Premium Max adhesive as well as for manufacturers aiming to commercially produce MTC panels for projects.
Glue bead line width recommendation for commonly available glulam widths.
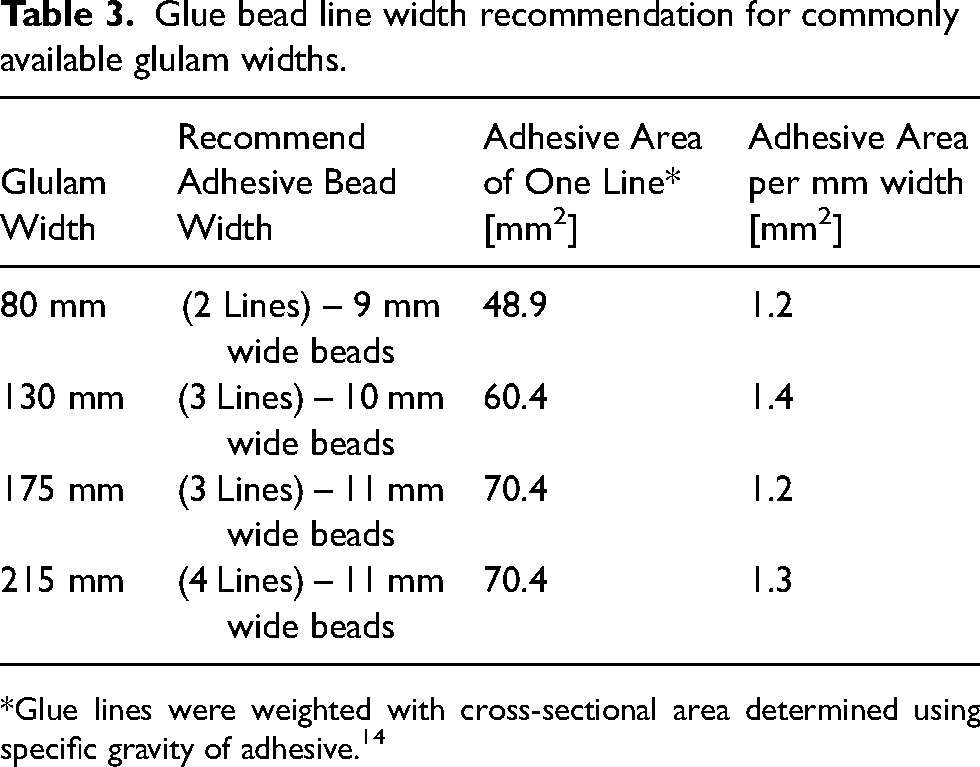
*Glue lines were weighted with cross-sectional area determined using specific gravity of adhesive. 14
Shear connections
The twelve shear connections were inspected after testing to evaluate the performance of the bond. In a first instance, it was observed that nearly all failures were a mixture of wood and glue failure, as shown in Figures 11(a)-(c), where part of the flange or web wood is still attached to the other element in some locations, while in other locations the grey coloured glue can be seen on both elements. It was also observed that the amount of wood failure to glue failure generally decreased as the pressure was increased. This meant for P1 = 0.125 MPa specimens generally had more exchange of wood between the elements at failure than for P3 = 0.5 MPa specimens, which had more glue failure. One notable exception to these observations was specimen 2 of pressure 3, as shown in Figure 11(d), where the failure is almost entirely on a growth ring plane of the wood, deep into the web member. This resulted in a failure plane that went through the line of the one LVDT and resulted in no data from this sensor, while the other sensor gave a much smaller stiffness due to the unusual failure plane. This was not in line with what was observed in the other three P3 specimens and was attributed to the natural growth characteristic of the wood used in the web.
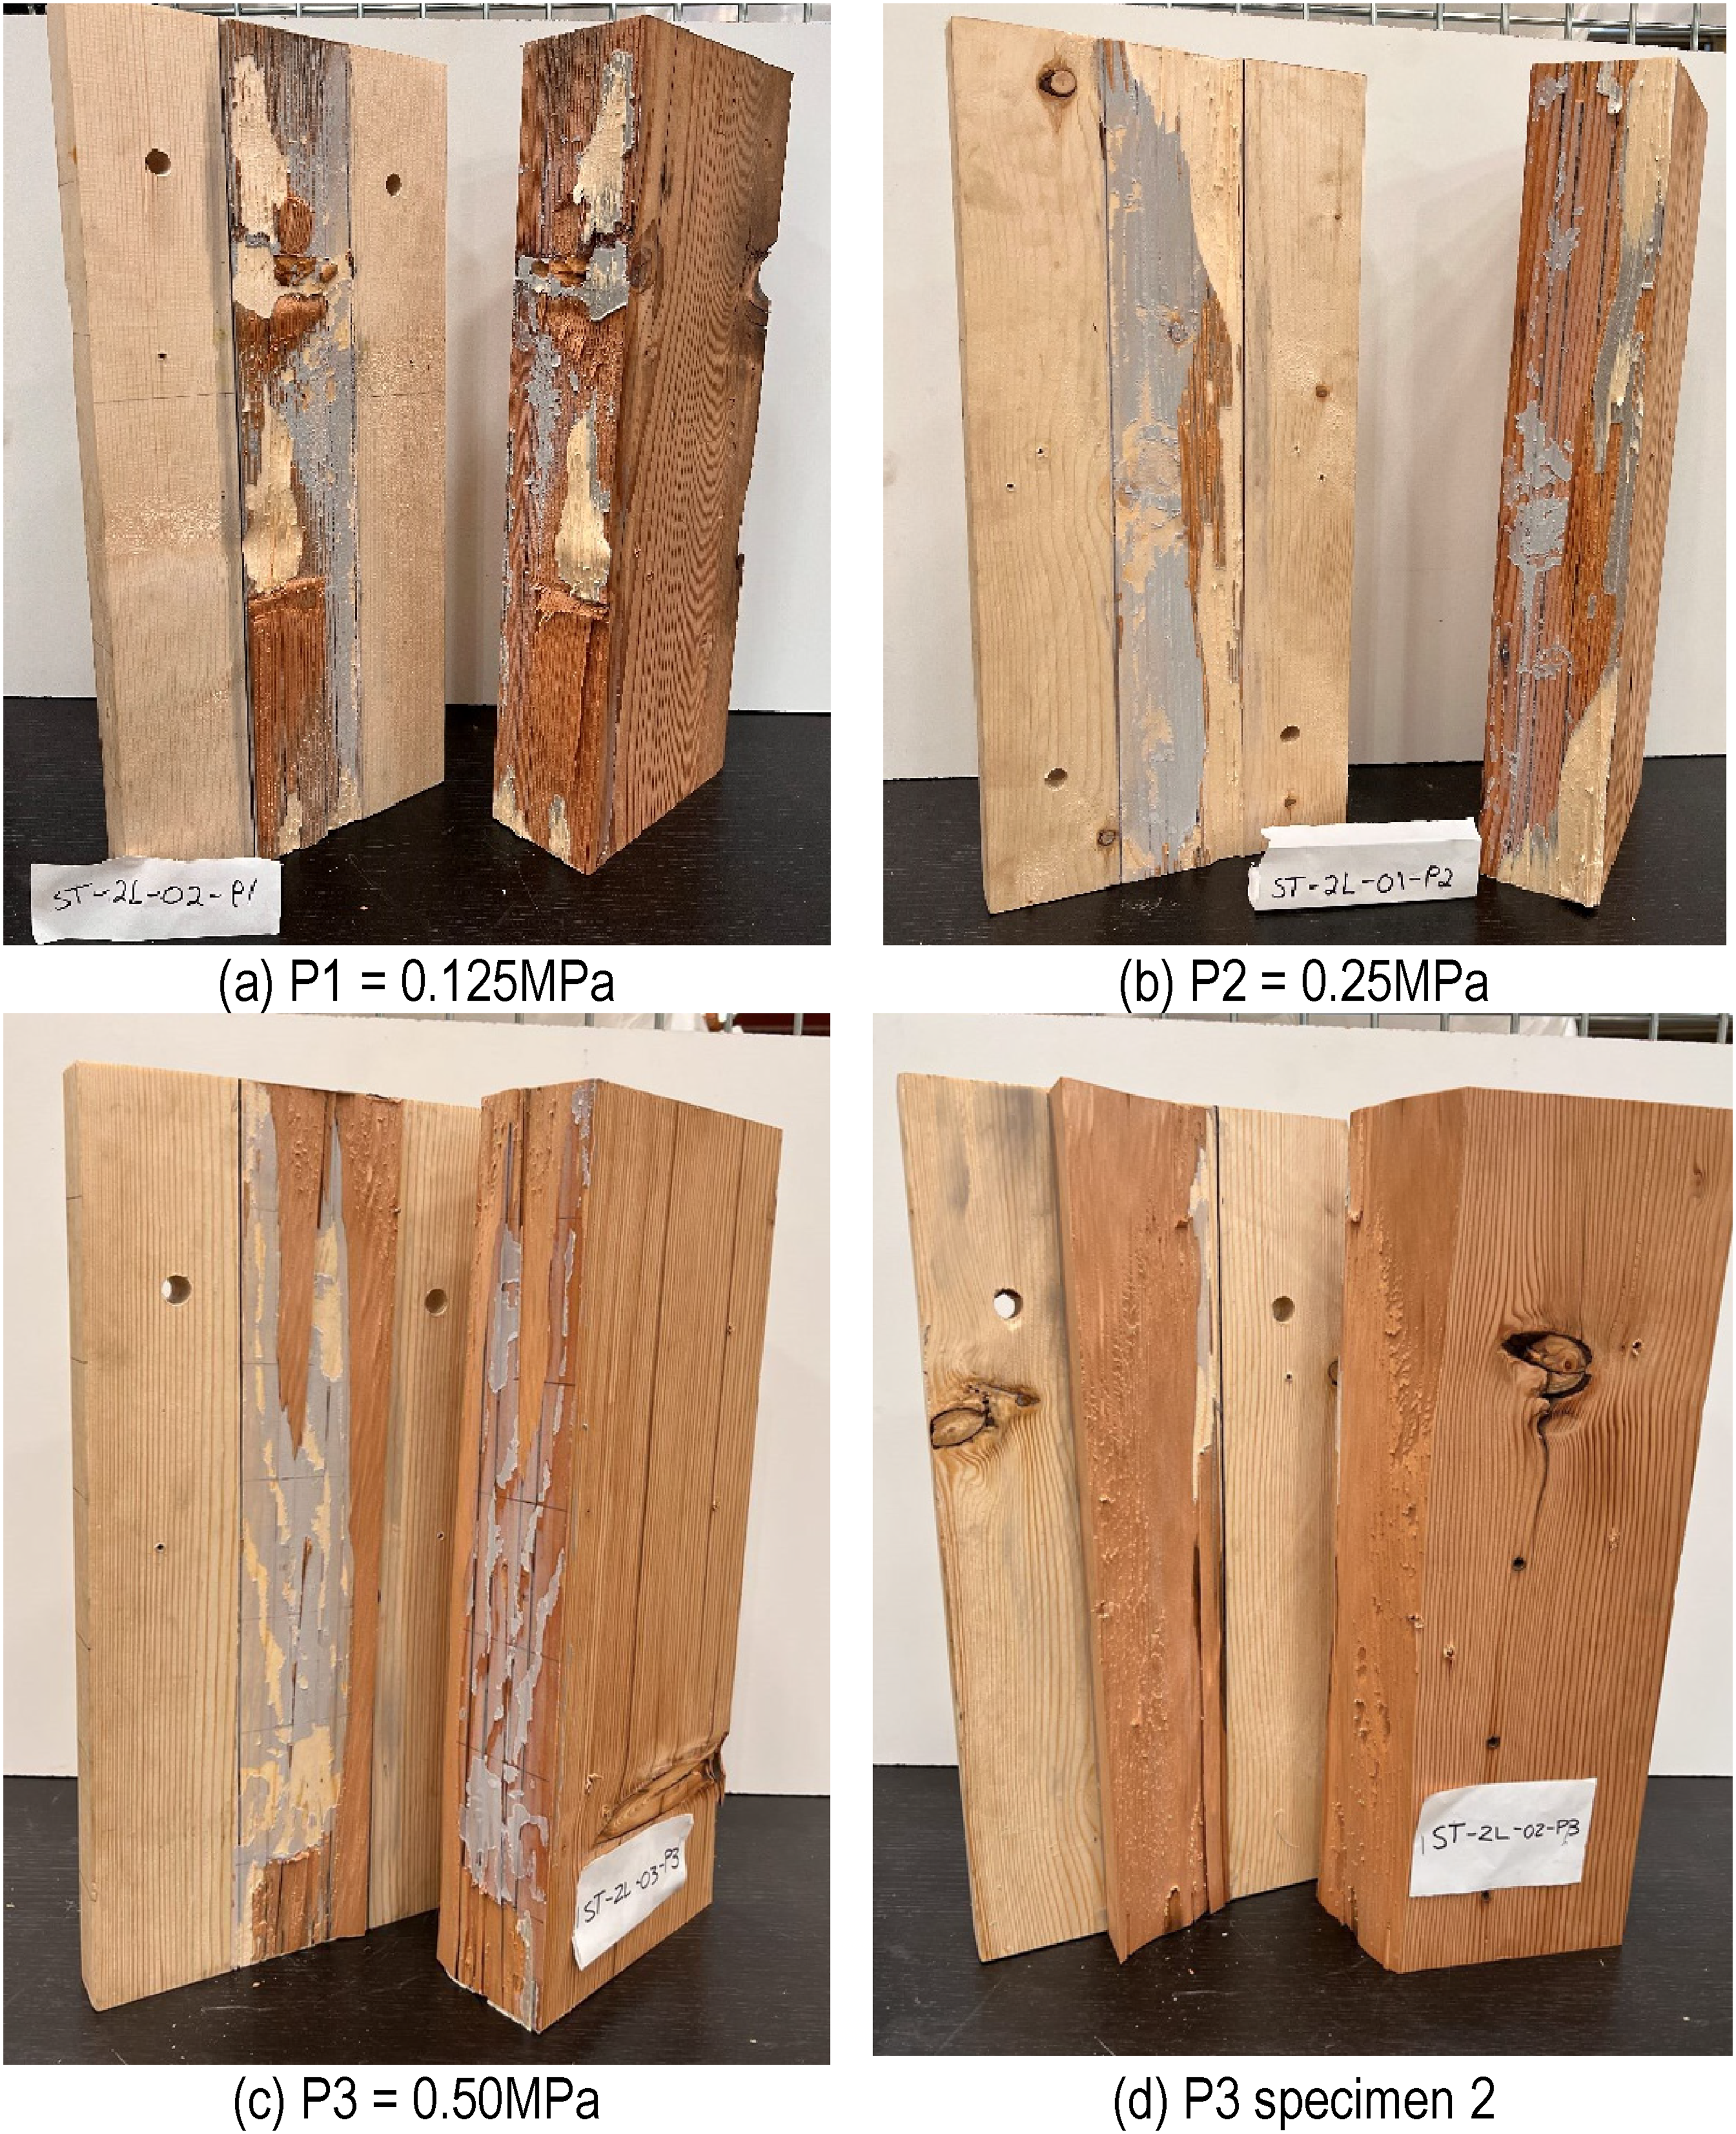
Representative failures of shear specimens for all three clamping pressures. (a) P1 = 0.125 MPa. (b) P2 = 0.25 MPa. (c) P3 = 0.50 MPa. (d) P3 specimen 2.
Key results from each load-slip curve including maximum shear stress at failure, initial shear connection stiffness, yield stress for the two data fit models, and percentage of wood fibre failure are presented in Table 4. The average of each pressure level along with the coefficient of variation (CoV) is also presented.
Summary of shear connection test results.
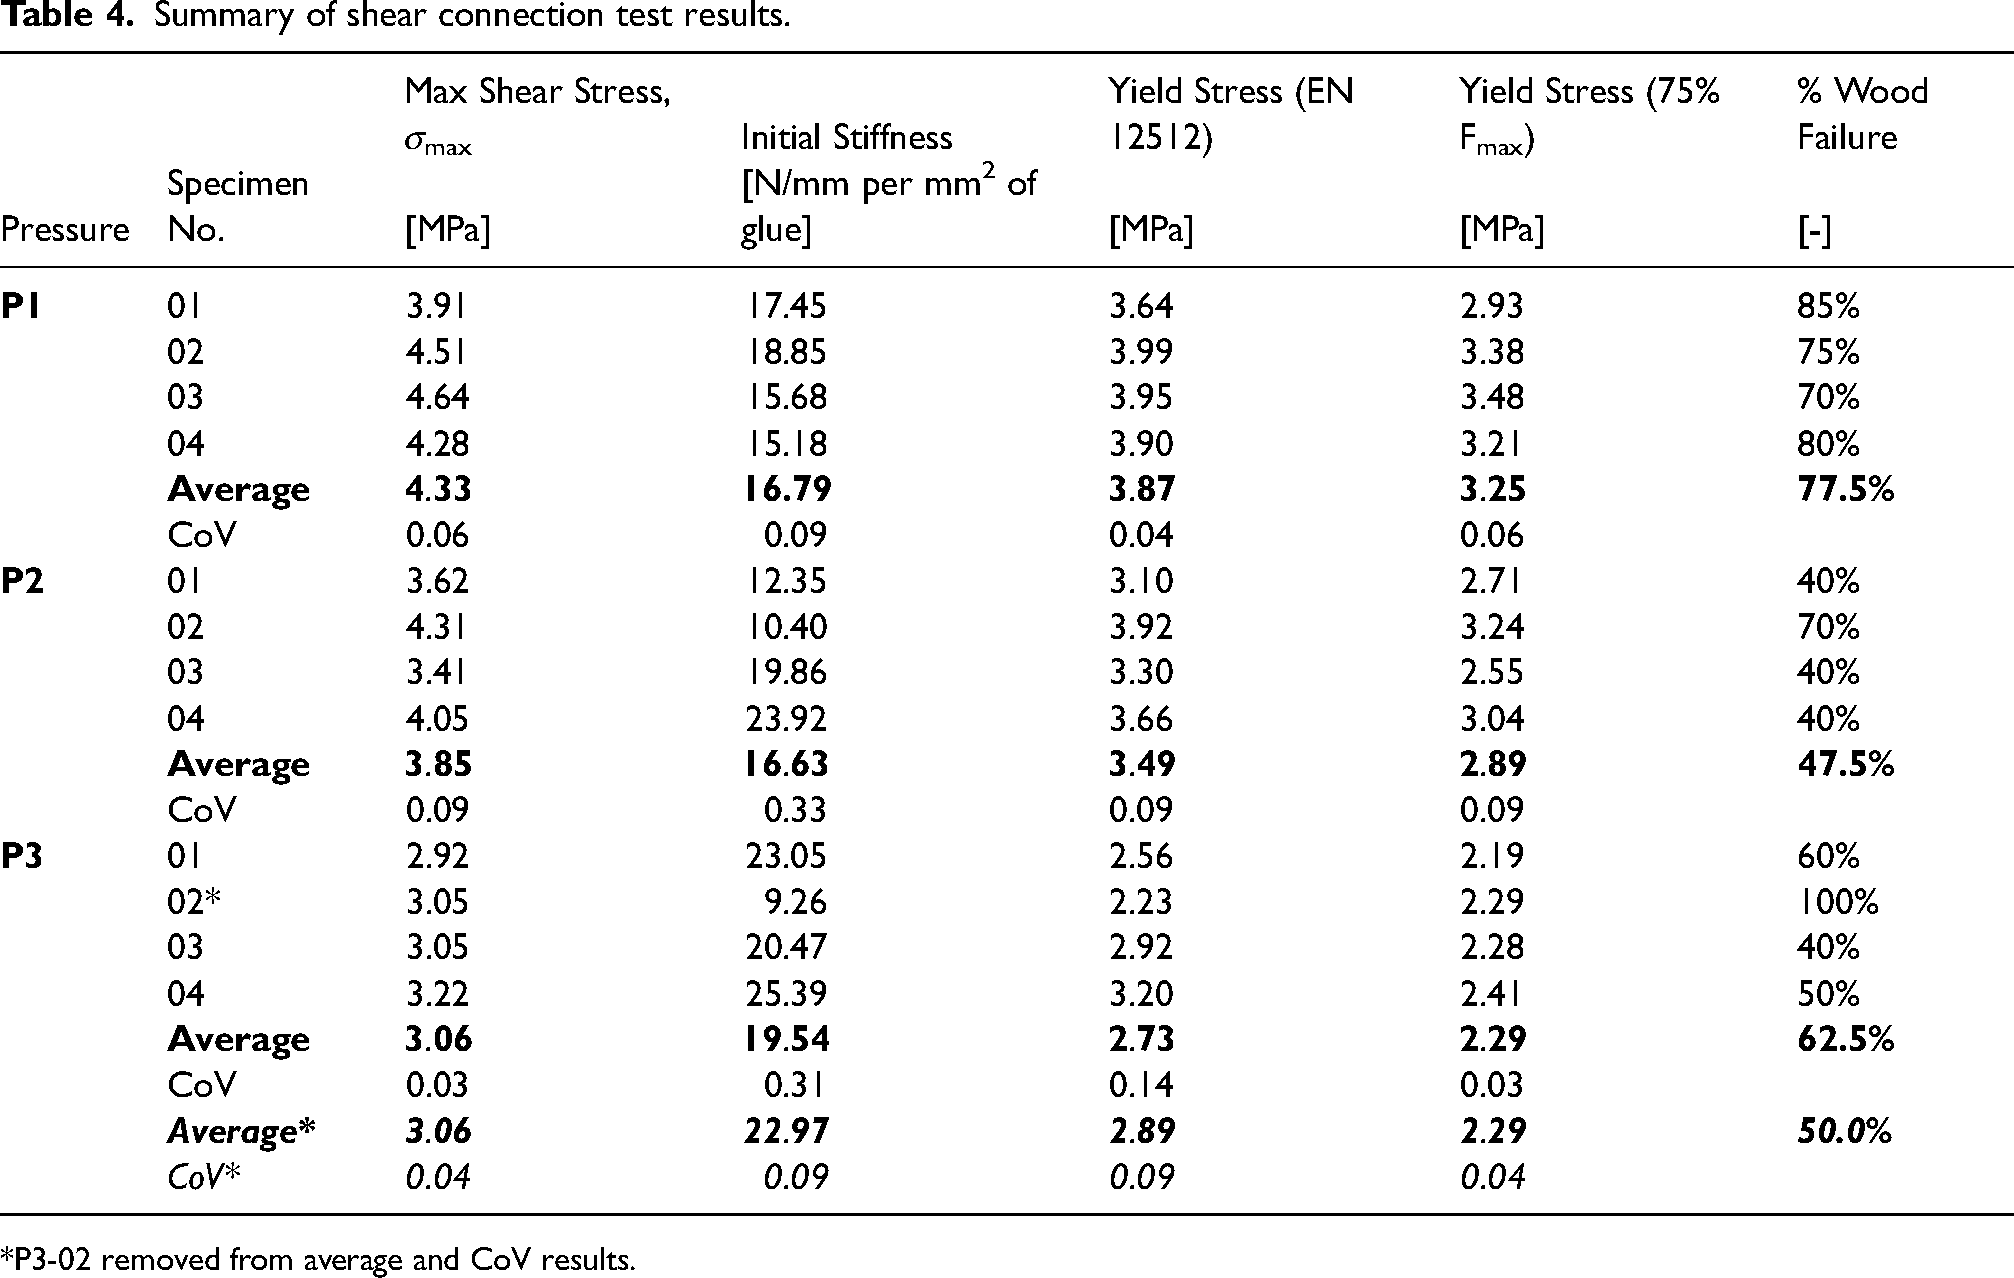
*P3-02 removed from average and CoV results.
The average maximum shear strength of the glue bonds tended to decrease with the usage of increasing clamping pressure varying from 4.33 MPa to 3.06 MPa for the lowest (i.e., P1) to highest (i.e., P3) pressures, respectively. On the other hand, the yield stress (i.e., transition point from linear to non-linear behaviour) varied from 3.87 MPa to 2.89 MPa for the lowest (i.e., P1) to highest (i.e., P3) pressures, respectively. The percentage of wood fibre failure was on average highest for the P1 pressure specimens at 77.5%, decreasing to around 50% for pressures P2 and P3.
From Table 4, it is observed that the average initial stiffness generally increases with increased clamping pressure; however, some variation was observed in the pressure P2 results. The average initial stiffness of 15.71 N/mm per mm2 of glue is less than the average of 16.79 N/mm per mm2 of glue for pressure P1. It was anticipated that the average initial stiffness for pressure 2 lie between pressure 1 and pressure 3 (as seen in specimens 03 and 04). The discrepancy seen in specimens 01-02 for P2 is believed to be attributed to the flange thickness not being able to uniformly spread the clamping pressure, the surfaces not being precisely planed, or variability in the properties of sawn lumber. In the future, it is recommended to use a load spreader on the thinner flange side to better apply a uniform clamping pressure.
Many standards for CLT and glulam20,21 have requirements for the average wood failure and average shear strength of tested glue bond specimens. In terms of average wood failure this is often greater than 75%. 21 However, these tests are typically performed on small (i.e., 45 mm×51 mm) specimens, which are not directly comparable to the 500 mm long specimens used in this study to assess the connection stiffness for use in design. While the percentage of wood fibre failure decreased for pressures P2 and P3, no degradation in the stiffness was observed. A decrease in the maximum shear strength of the connection was observed, which may be attributed to the decrease in wood fibre failure, or quality of wood material. Future investigations should be conducted on glulam and CLT specimens to better correlate the results of the longer shear specimens used in this study, and common in literature for determining the connection stiffness in design,4,5 with the smaller specimens used for quality control of CLT and glulam elements.20,21
The twelve specimens tested in pure shear were analyzed using the two bilinear load slip models (i.e., EN 12512 and 0.75Fmax) with the results for each pressure level then being averaged together to get a representative model for each, as shown in Figure 12. Generally, both models captured the behaviour of the glue bond connection well, with the 75% max load method being slightly better at capturing the transition point and preferable for its simplicity. Overall, the yield stress for all three pressures is similar to the literature on small-scale CLT-glulam joints.4,5 In practice, MTC panels would be designed for the ultimate shear strength of glulam which ranges from 1.75 to 2.0 MPa in codes. 22 Thus, at service level loads (i.e., deflection design) shear stresses on the glue bond are likely to be less than these design values and the yield point is practically unlikely to be exceeded. This allows for the initial stiffness values to be confidently used in the hypothetical design of MTC panels at serviceability in the next section. Future work should evaluate the strength of shear connection using PL Premium Max on CLT and glulam T-sections to corroborate the results herein and to establish the characteristic strength for different pressures. While the results are promising, the limited number of specimens (i.e., four for each pressure) does not allow to confidently establish design level strengths.
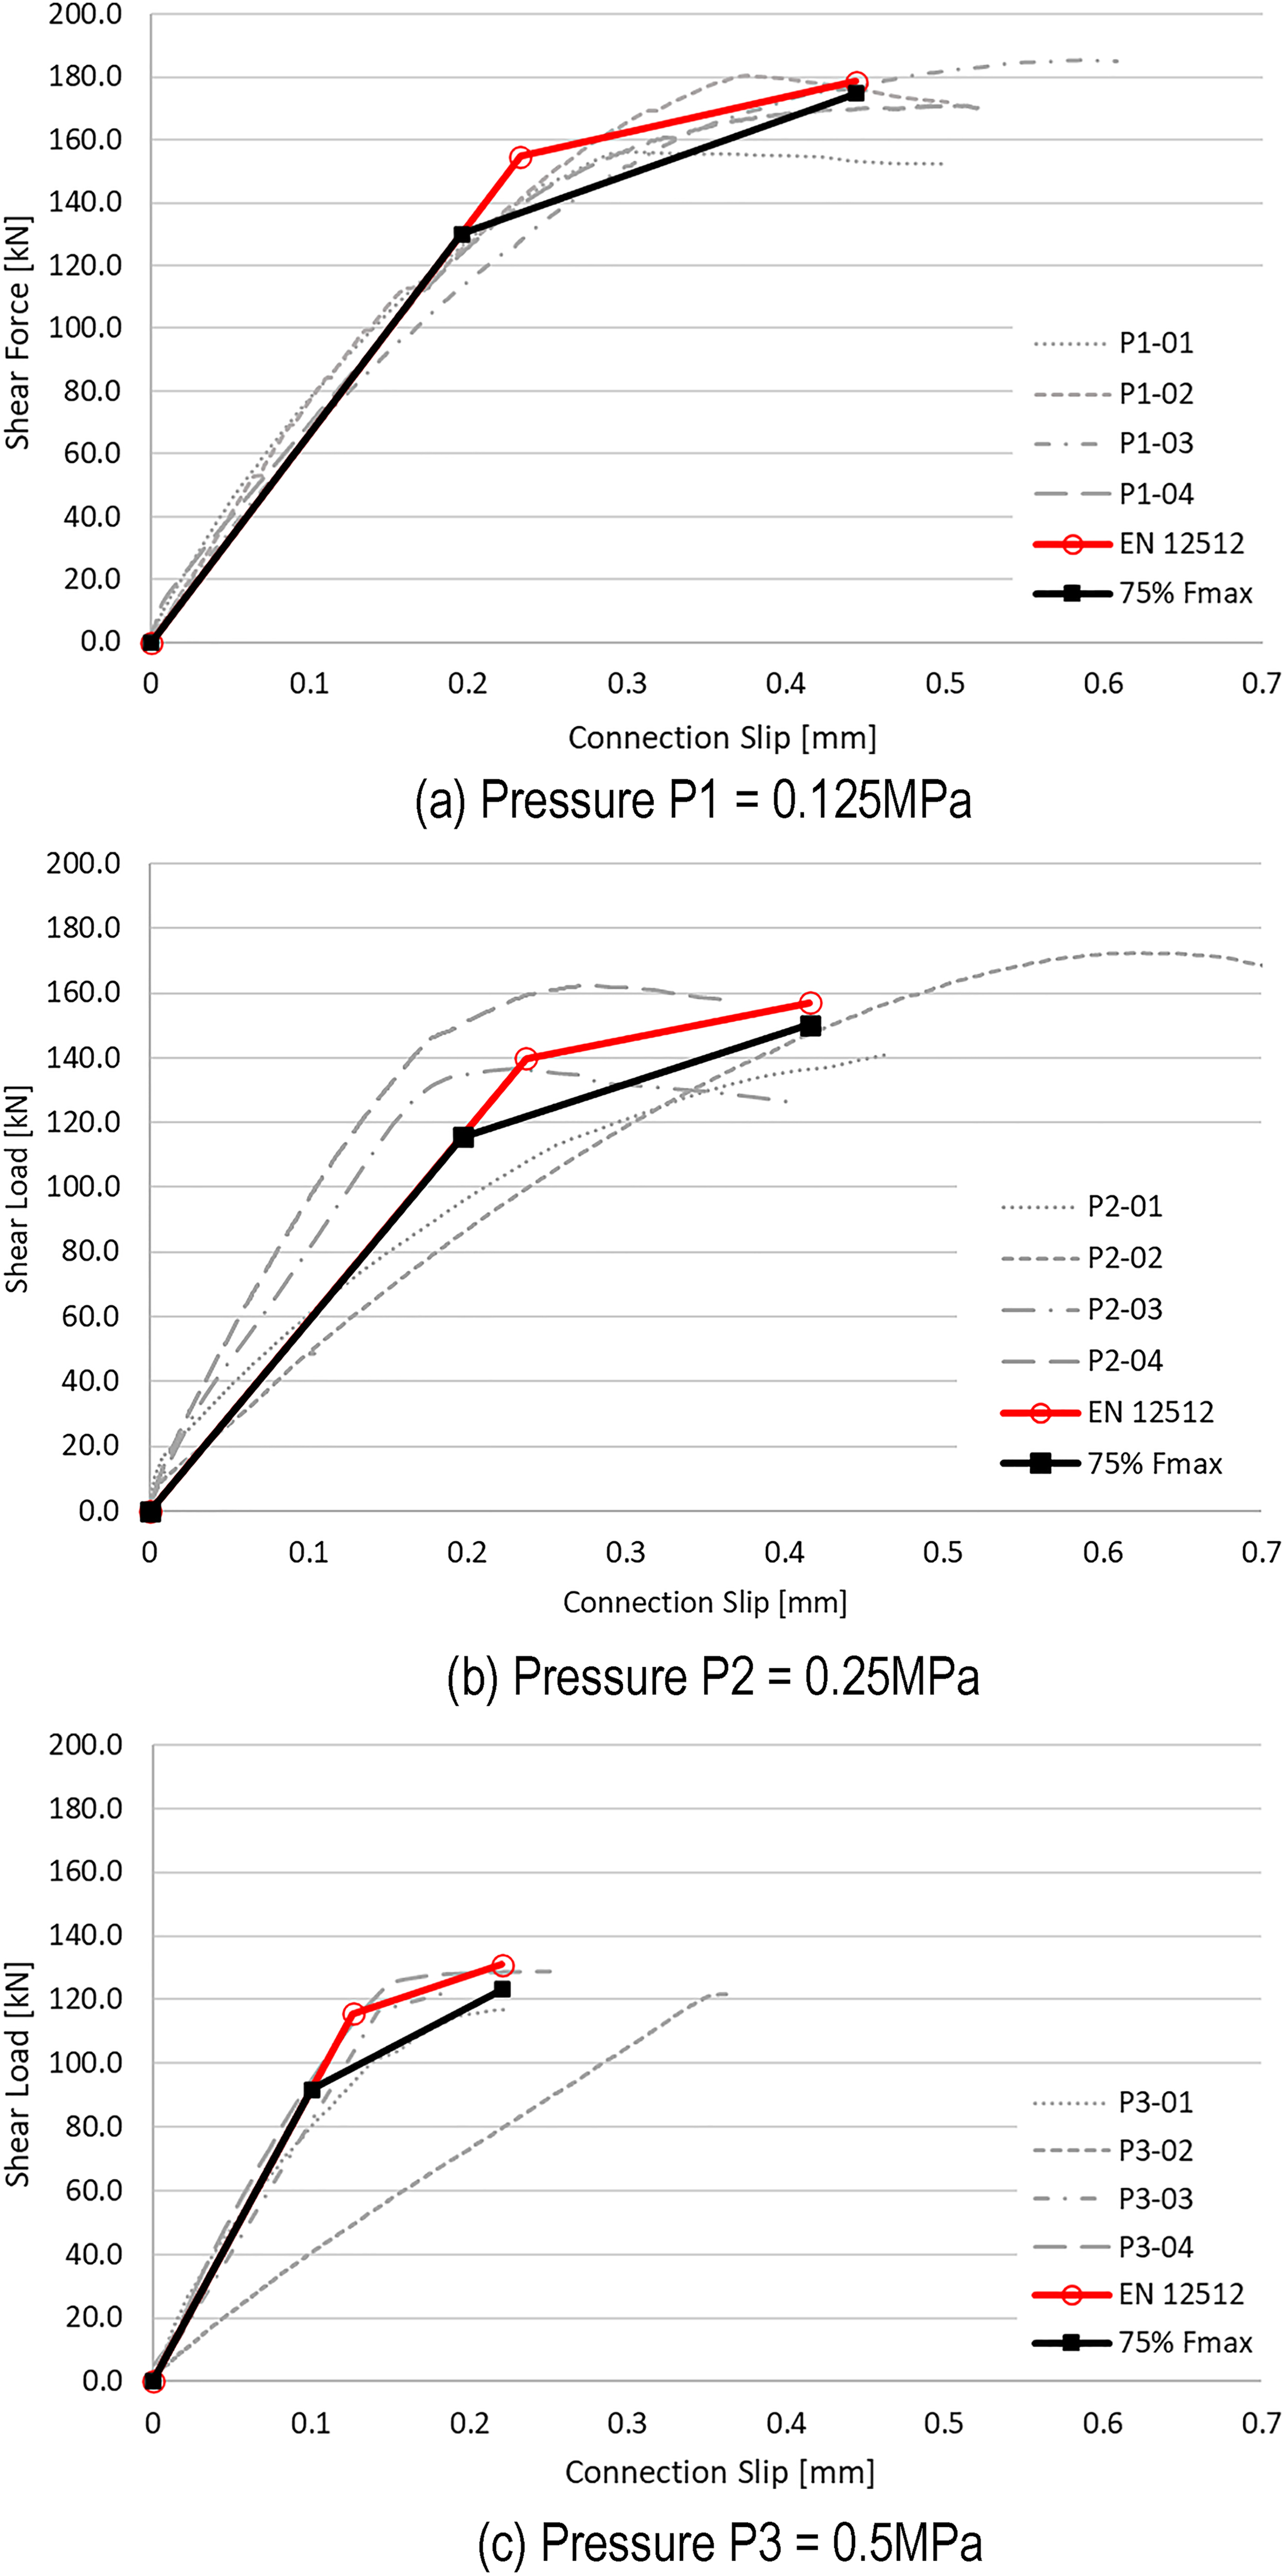
Experimental load-slip curves and average bilinear data fit models for yield strength. (a) Pressure P1 = 0.125 MPa. (b) Pressure P2 = 0.25 MPa. (c) Pressure P3 = 0.5 MPa.
Implication on mass timber composites
To investigate the feasibility of this glue bond connection for use in mass timber composite panels, the experimentally obtained stiffnesses were used in an analytical analysis of a 10 m long CLT-glulam ribbed panel as shown in Figure 13. The ribbed panel is constructed using (2) - 175 mm × 455 mm D.Fir 20f-E glulam webs and (1) – 105 mm × 2400 mm V2 grade CLT panel, and use a glue pressed shear connection with each of the three pressures. The gamma (γ)-method from Annex B of Eurocode 5 23 was used for this analysis of the bending stiffness and comparison. Previous studies have shown the results between the experimental bending tests and the predicted bending stiffness determined using the γ-method agreed reasonably well.4,7 The degree of composite achieved by each clamping pressure in this study, along with comparable connections from literature,4,5 is presented in Figure 13, with the shear connection stiffness plotted on a log plot.
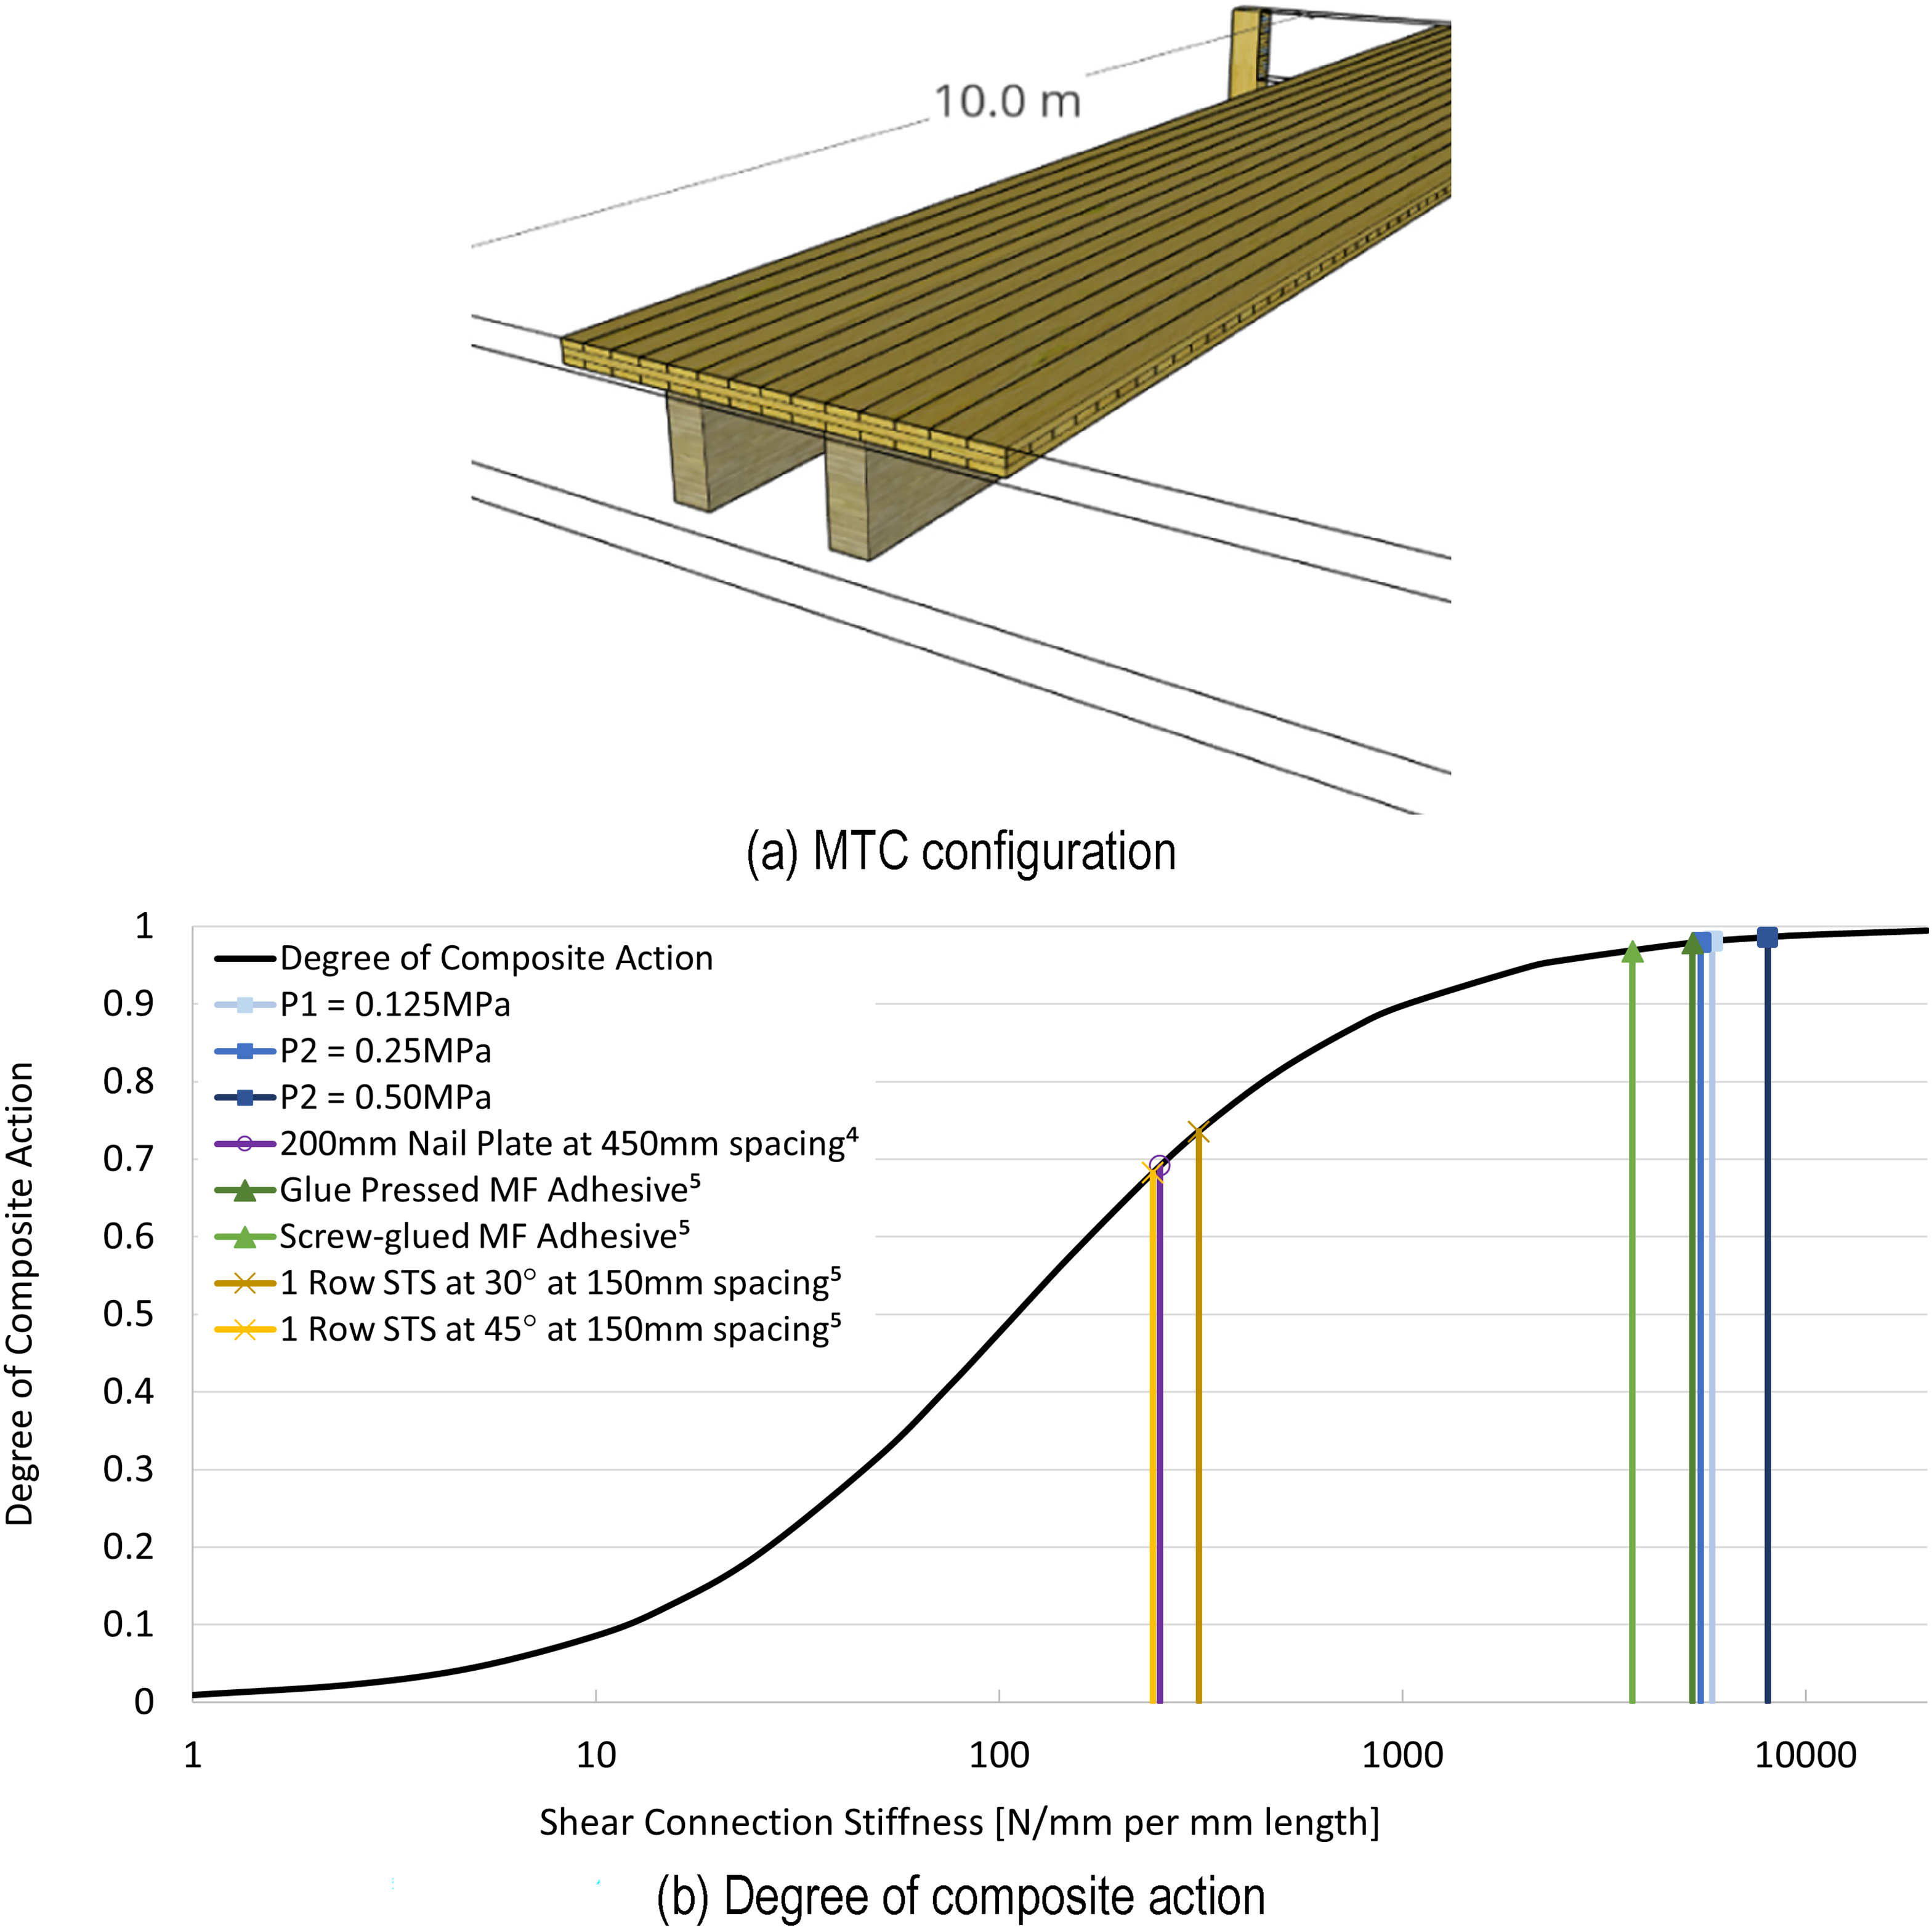
10 m MTC ribbed panel and composite action. (a) MTC configuration. (b) Degree of composite action.
All three clamping pressures were able to produce a shear connection that achieved near fully composite action (>98%) at serviceability, as all were in the upper flat portion of the s-shaped curve. This is comparable to other glued connection tested by Montgomery 5 which also achieved a greater than 97% degree of composite action. Generally, the s-shaped curve in Figure 13 can shift left and right depending on the span of the panel, configuration of the cross-section, and elastic modulus of the materials, with the span being the most critical. When the span is decreased, a higher connection stiffness is required, making short span sections more difficult to achieve a high degree of composite action. The connection stiffnesses of the glued connections were high for all three clamping pressures, likely to achieve a high degree of composite action even for short span panels, and is therefore deemed a viable connection configuration for MTC panels. Due to the bond strength being affected by the surface properties of the wood as well as the physical properties of the wood (e.g., density, porosity, moisture content, dimensional movement), it is recommended that future work investigate the feasibility of using PL Premium Max with CLT and glulam T-beam elements to verify the performance observed in the shear connection testing is similar to shear forces developed when subjected to bending loads. The adhesive connection should also be applied to larger scale mass timber elements to investigate the performance at industry scales. Additional investigations should also be conducted on the adhesive to study the long-term behaviour of the adhesive connection and performance at elevated temperatures.
Conclusions
A series of experiments formed in this study was conducted on the performance of a commonly available construction adhesive based on glue line thickness, surface coverage, and contact pressures, and how these impact the load-slip curve of the glued connections loaded in shear. A total of 60 glue spread tests were performed, along with 12 tests on glued connections. The adhesive used, namely PL Premium Max, was determined to be a promising solution for glued connections with CLT and glulam.
The quantity of glue provided as well as clamping pressure was shown to affect the glue line thickness and coverage area. Providing insufficient glue (i.e., 2 × 4-1L, 2 × 6-2L) resulted in inadequate adhesive coverage of contact area irrespective of clamping pressure, while increasing the number of glue lines (i.e., 2 × 4-2L, 2 × 6-3L) contributed to excessive glue squeeze out for all three clamping pressures. Based on the results, it is recommended to use 1.2-1.4 mm2 of adhesive per mm width of surface area, with additional adhesive added locally at the ends of the elements to account for end squeeze out. Precision planning was found to be more critical than clamping pressure to achieve consistently thinner glue lines, which are typically preferred to limit the amount of gap filling required, and to increase bond strength and stiffness.
The shear connections were observed to fail with a mixture of wood and glue failure, with the ratio of wood-to-glue failure generally decreasing as the clamping pressure was increased. The failure shear stress of the glue bonds varied from 4.33 to 3.06 MPa for the lowest to highest clamping pressures, and the yield stress varied from 3.87 to 2.89 MPa for the lowest to highest pressures. These values are in-line with yield and failure strengths achieved by glue-bonded CLT-glulam shear specimens, thus providing promising results for the implementation of this adhesive for MTCs. The average initial stiffness tended to increase with increased clamping pressure, with an average initial stiffness of 16.97 N/mm per mm2 of glue for pressure P1, 15.71 N/mm per mm2 of glue for pressure P2, and 22.97 N/mm per mm2 of glue for pressure P3. The variation in the results of P2 was attributed to the flange thickness not being able to uniformly spread the clamping pressure, precision of surface planning, or variability in the properties of sawn lumber material. In the future, it is recommended to use a load spreader on the flange side to better apply a uniform clamping pressure. Ultimately, when applied to a hypothetical 10 m long CLT-glulam ribbed panel, iterations employing all three clamping pressures’ average stiffness values were able to achieve near fully composite action (>98%).
Footnotes
Declaration of conflicting interests
The authors declared no potential conflicts of interest with respect to the research, authorship, and/or publication of this article.
Funding
This work was supported by the Natural Sciences and Engineering Research Council of Canada (NSERC) doctoral postgraduate scholarship.