
Abstract
Simple shear, uniaxial tension–compression and bending tests were used to determine the cyclic behaviour of two sheet metals: DP600 and AKDQ. The Yoshida–Uemori two-surface model along with Hill’s quadratic yield function was used to simulate the behaviour of these two materials in each test. For each test, a set of material constants was identified such that the error between the simulated and experimental responses is minimized. Using the material constants obtained from one test, the other tests were simulated to see whether the set of constants obtained from this test is able to describe the material response in the other tests. The results show that depending on the material, the set of constants obtained from one test may or may not be able to reproduce the material response in the other tests. Finally, each set of constants was used to simulate the springback of a U-shaped part formed in a channel draw process. The predicted springback profiles obtained from each set of constants were compared with the experimental profile. It was found that all three tests are suitable to characterize the behaviour of DP600 sheets in view of predicting the springback of channel sections. For AKDQ, however, the error between the predicted and experimental springback profiles was significant regardless of the type of characterization test performed. But for this channel draw process, simulations based on material data obtained from the reverse bending test provided the best prediction of springback.
Keywords
Introduction
In sheet metal forming, the material commonly experiences bending, unbending and unloading over the die and punch radii and sometimes multiple bending–unbending cycles when it is formed through a drawbead. The stress–strain response during reverse loading is usually different from the behaviour in forward loading. In general, the cyclic behaviour of metals is quite complex. Early re-yielding, permanent softening, work hardening stagnation, transient Bauschinger effect and the decrease in unloading modulus are among the most important phenomena observed during cyclic loading of sheet metals at larger strains.1–3
For an accurate simulation of sheet metal forming processes, the simulation tool must be able to effectively describe the cyclic characteristics of deformation. In other words, if the material model fails to describe the so-called cyclic phenomena, then the stress field will not be accurately calculated within the workpiece. As a result, all parameters related to stress will not be accurately predicted by the model. Therefore, several advanced phenomenological models have been developed aiming at a better description of material behaviour during cyclic loading. Chun et al. 4 defined different backstress evolution laws for monotonic loading and reverse loading with the purpose of improving the kinematic hardening model. Choi et al. 5 modelled the yield surface rotation in order to describe the multiaxial plastic behaviour. Vincent et al. 6 included the distortion of yield surface in a nonlinear kinematic hardening model in order to describe the multiaxial ratcheting of 316L stainless steel. They validated their model using both a crystal plasticity model and experimental data obtained from complex tests. They found that the distortional model could describe monotonic tension, uniaxial cyclic hardening, overhardening as well as uniaxial and multiaxial ratcheting tests.
The phenomenological models utilize a set of constants that are usually determined by fitting the simulated response to the experimental stress–strain data. Therefore, it is necessary to obtain the experimental cyclic stress–strain response of the material. However, it is difficult to carry out uniaxial cyclic tension–compression (TC) tests on thin sheet metal specimens because of the tendency for the sheet to buckle in compression. To overcome this problem, many experimental methods have been proposed to render the compression of sheet specimens possible. Kuwabara et al. 7 and Boger et al. 8 used fork-shaped dies and flat dies, respectively, to provide a lateral support for the sheet and prevent its buckling during uniaxial TC tests. Their designs do not support the specimen in the area between the dies and the tensile machine clamps. In order to eliminate the unsupported area, Cao et al. 9 designed two pairs of wedge shape plates to cover the total area of the specimen. Yoshida et al. 3 successfully bonded a few thin sheets of metal to provide support for the sheet during uniaxial compression. Cyclic simple shear and bending tests have also attracted the attention of many researchers as the specimen is not compressed during these tests. Thuillier and Manach 10 successfully used the simple shear test for reverse loading at large strains. And bending tests have been used by Zhao and Lee 11 and Brunet et al. 12 to generate the material response during bending–reverse bending.
Among the three methods mentioned above, the main advantage of the shear test is the possibility of achieving higher strains. The advantage of the uniaxial test is that the strain distribution is uniform, and therefore, it is easy to find the material response from the global response of the specimen. Finally, the advantage of the bending test is that the deformation mode in the test is similar to that in many forming processes where sheet metal is formed over various radii in the die. Carbonnière et al. 13 recently compared the material response obtained from the bending–reverse bending test with that obtained from the simple shear test for both an aluminium alloy and a transformation-induced plasticity (TRIP) steel. However, neither of these materials exhibited any work hardening stagnation. Eggertsen and Mattiasson 14 used the experimental material response of DP600 obtained from both uniaxial TC and bending tests to identify the material parameters for different constitutive models. They found that the material parameters determined from either the uniaxial TC test or the bending test yielded springback predictions with the same level of accuracy compared to experimental measurements.
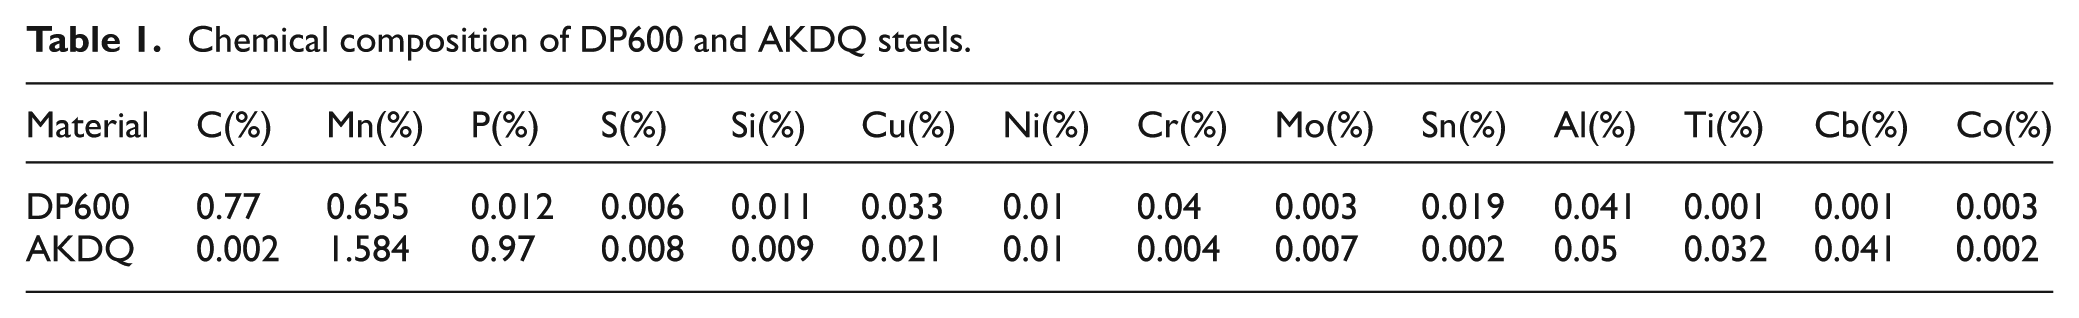
Two different sheet materials that are widely used in the automotive industry for body and closure applications, AKDQ and DP600, were used in this investigation. AKDQ is a single-phase, aluminium-killed, drawing quality mild steel with significant formability (25% uniform elongation), and DP600 is a dual-phase (islands of martensite in a matrix of ferrite) steel with a good combination of strength and ductility; its greater strength (minimum tensile stress > 600 MPa) compared to AKDQ (tensile stress < 350 MPa) allows for thickness reduction and weight saving potential, and therefore, dual-phase steels are increasingly used in automotive body applications. A zinc coating (70 g/m2) was applied to both these sheet materials for corrosion protection using the hot-dip galvanizing process. The chemical composition of these sheet materials is given in Table 1.
Chemical composition of DP600 and AKDQ steels.
In this article, the shear, bending and uniaxial TC tests were used to find the experimental material response of AKDQ and DP600 sheet steels. The material constants associated with the phenomenological constitutive model were determined using the experimental response obtained by each test. Then, the set of material constants obtained by each test were used to predict the material response in the other two tests, and a comparison was made between the predicted and experimental responses. Finally, both the forming stage and subsequent springback of a U-shaped channel section were simulated using each set of constants, and the simulated profiles after springback were compared with those obtained experimentally. In order to reproduce the material behaviour in cyclic loading, the Yoshida–Uemori (YU) model1,2 was selected for this work: indeed, the YU model is able to describe the transient Bauschinger effect, permanent softening and work hardening stagnation and is therefore capable of describing the cyclic material behaviour more accurately than most other phenomenological models. In order to consider the anisotropy of the sheet materials, Hill’s quadratic yield function was used to define both the yield (inner) surface and the bounding (outer) surface of the YU model.
Constitutive model
Hill’s quadratic yield function is defined as follows
where
where
The YU model contains two surfaces in stress space. The inner (yield) surface is only allowed to translate in stress space. However, the outer surface translates while it is expanding in stress space. The rate of kinematic motion of the inner surface is expressed by

where
where b, c, k and Y are all material constants,
where B is the initial size of the outer surface and R denotes its expansion which is expressed by

where
In order to model the period during which no work hardening occurs, the model defines a stagnation surface,
where
where

where
Identification of material constants
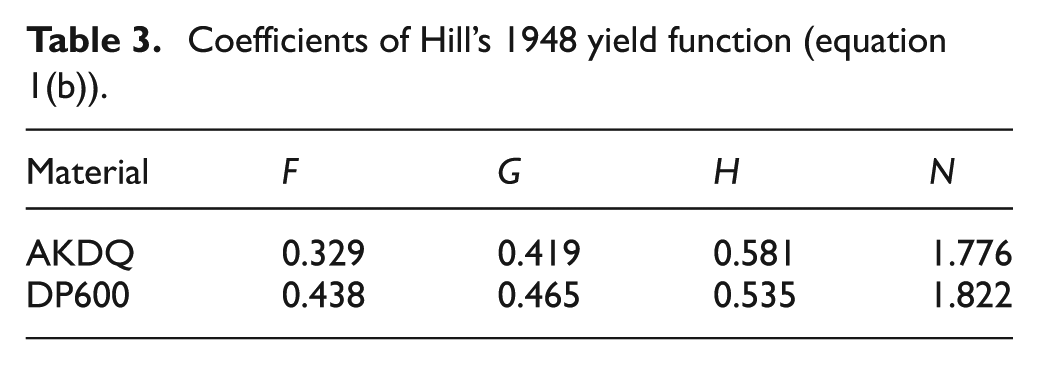
Uniaxial tension tests were carried out in the rolling, transverse and diagonal directions, and the average mechanical properties of both sheet materials are given in Table 2. Simple shear tests were also performed on both materials, and the experimental yield stresses in a shearing mode were found to be 84 MPa for AKDQ and 220 MPa for DP600. The constants in Hill’s function, that is, F, G, H and N, were calculated using these experimental yield stress values. It should be mentioned that the out-of-plane shear strains are equal to zero for the problems simulated in this article, and therefore, the material constants associated with these shear strains, that is, L and M, have not been calculated. The yield stresses shown in Table 2 were used to calculate the coefficients in Hill’s 1948 yield criterion and these are provided in Table 3.
Average mechanical properties of DP600 and AKDQ steels.
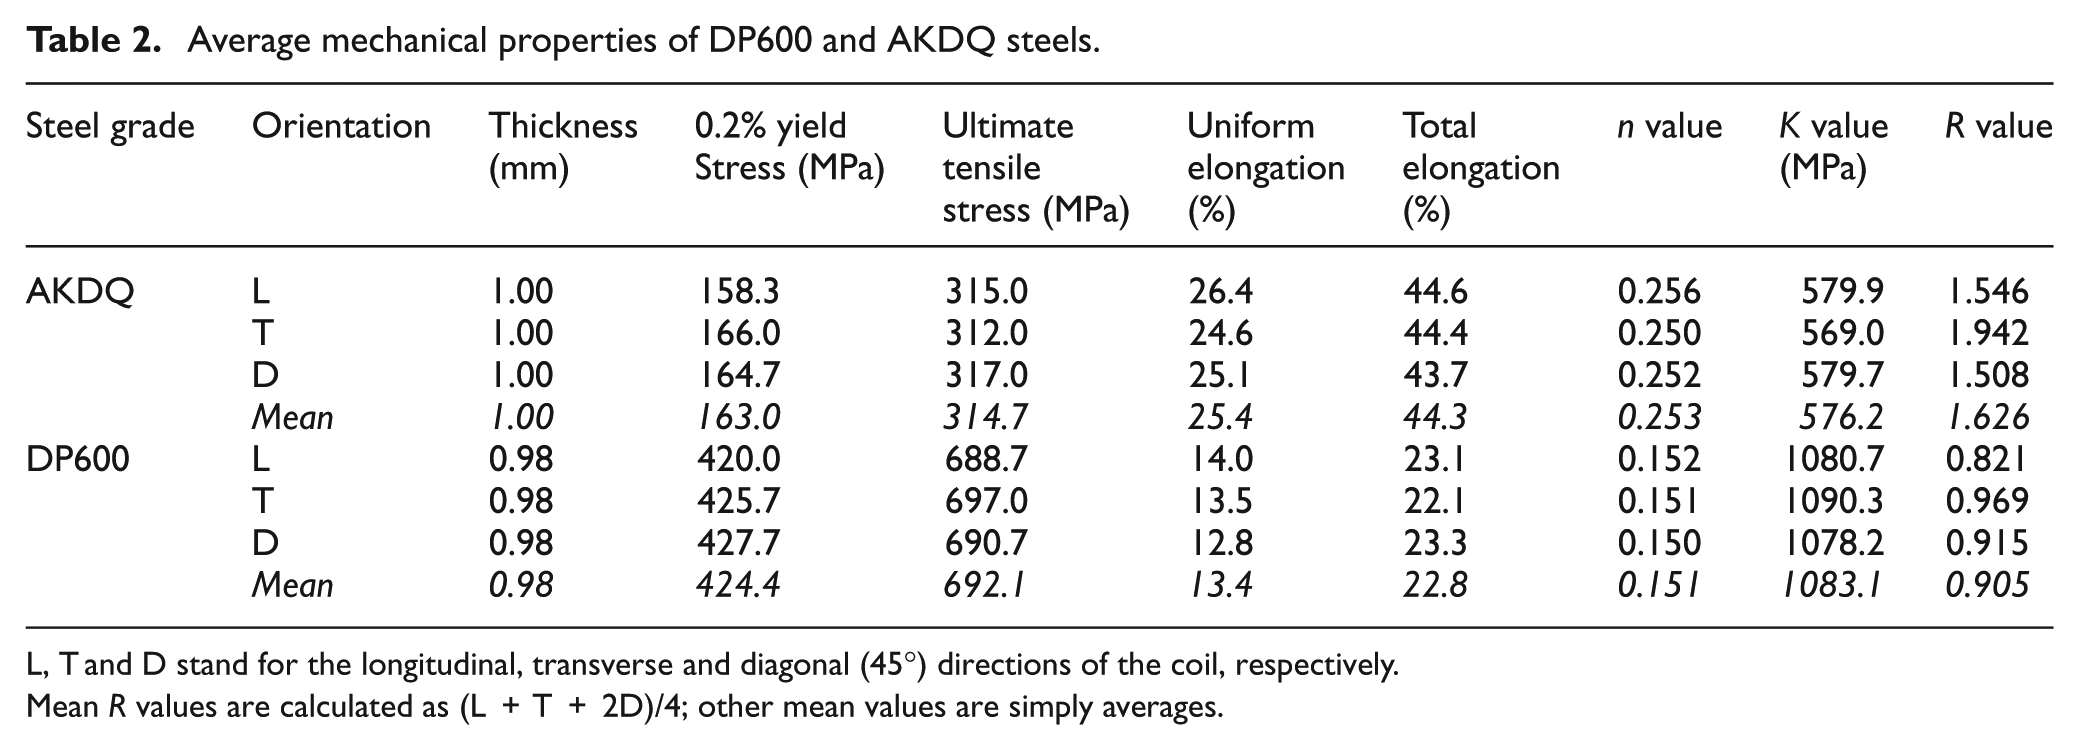
L, T and D stand for the longitudinal, transverse and diagonal (45°) directions of the coil, respectively.
Mean R values are calculated as (L + T + 2D)/4; other mean values are simply averages.
Coefficients of Hill’s 1948 yield function (equation 1(b)).
In order to identify the YU material parameters, the cyclic response of the material is required. Three types of tests were performed to obtain the cyclic behaviour of these materials in the rolling direction of the metal sheets: (1) cyclic simple shear,
10
(2) bending–reverse bending
12
and (3) uniaxial TC.
8
The cyclic response obtained from each test was then used to identify the material parameters associated with the YU model, according to the procedure described by Yoshida and Uemori.
2
Parameter Y represents the yield stress of the material, and parameters B, (Rsat+b) and k are found by fitting the simulated response to the experimental bounding stress. The amount of permanent softening is calculated by integrating equation (3), which is a function of b and k. So, b is also identified as the amount of permanent softening and is determined from the experimental response of the material. Once b and (Rsat+b) are known, Rsat can easily be calculated. Yoshida and Uemori
2
provided a plot of the normalized transient stress offset as a function of plastic strain for various values of parameter
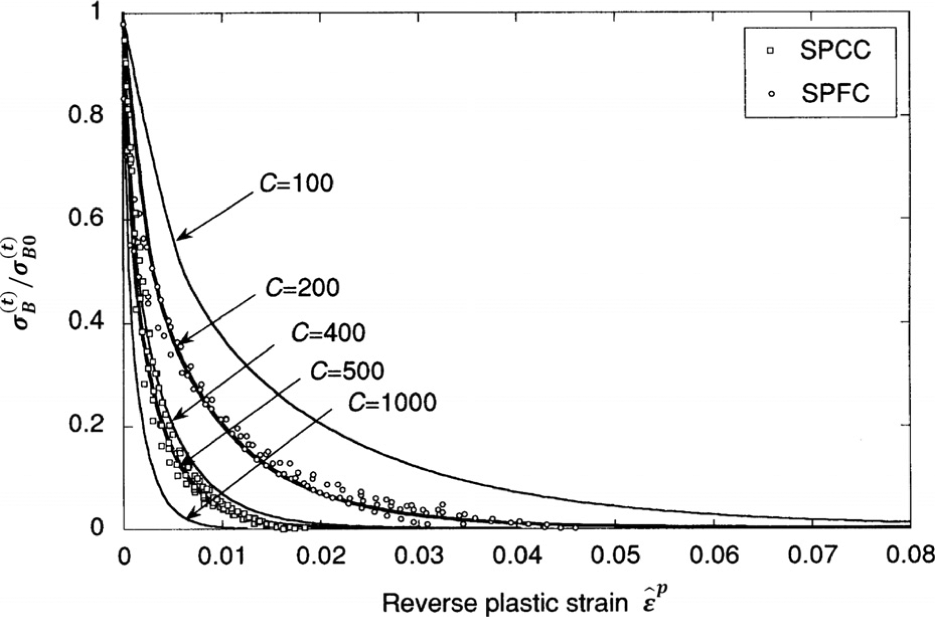
Normalized transient stress offset as a function of reverse plastic strain for various values of parameter C. 2
In order to evaluate the performance of each set of material constants for the simulation of sheet metal forming, care was taken to perform the tests under almost the same conditions, that is, the same number of loading reversals and almost the same effective strain range in each cycle, that is, around 0.04–0.05. Tables 4 and 5 show the YU material parameters for DP600 and AKDQ determined from each test, respectively. The set of constants determined from uniaxial TC, simple shear and bending tests are called Set 1, Set 2 and Set 3, respectively.
The Yoshida–Uemori material constants for DP600.
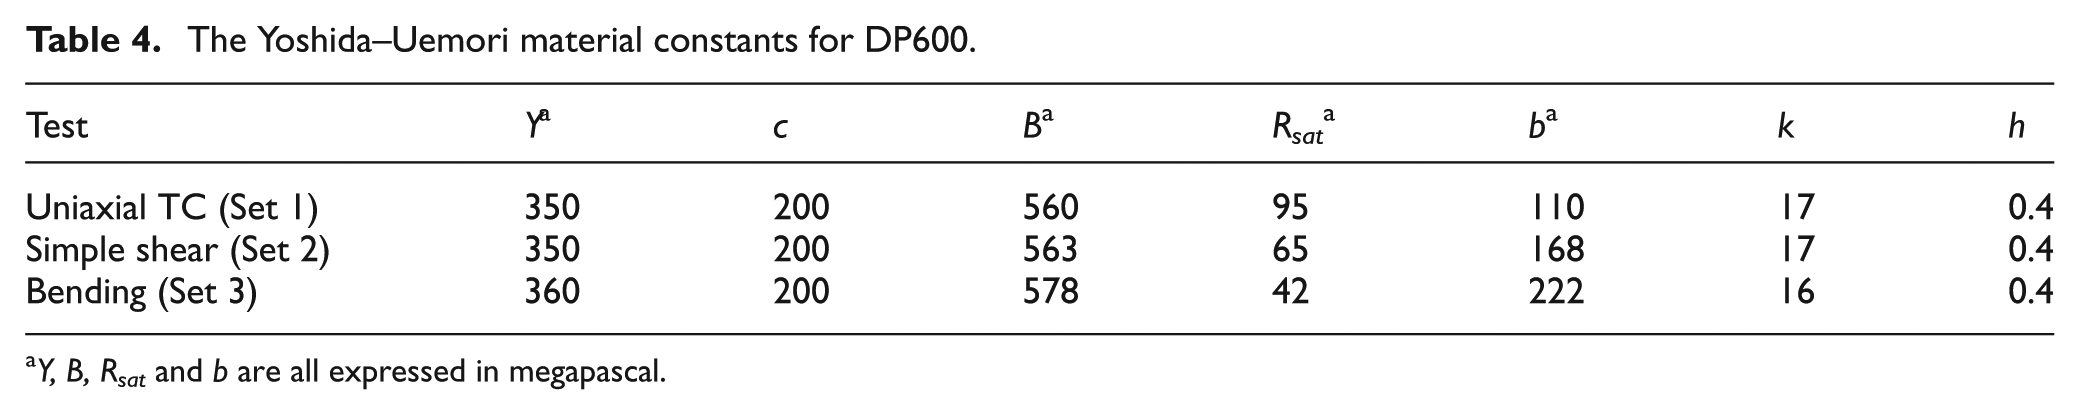
Y, B, Rsat and b are all expressed in megapascal.
The Yoshida–Uemori material constants for AKDQ.
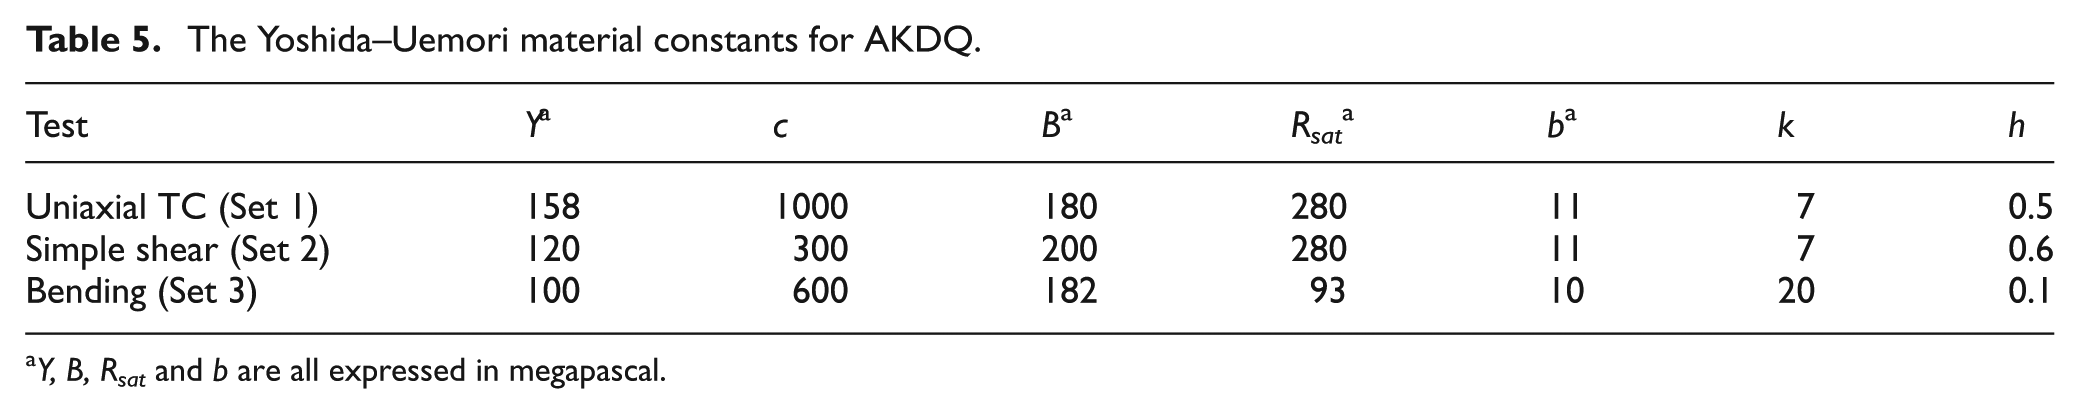
Y, B, Rsat and b are all expressed in megapascal.
It can be observed in Table 5 that there are significant differences between the values of some of the hardening parameters obtained from different loading conditions. For instance, parameter Y, which represents the yield stress of the material, varies from Y = 100 MPa in reverse bending to Y = 158 MPa in TC. But as pointed out by Eggertsen and Mattiasson, 14 ‘no hardening law is able to simulate all experiments with good accuracy and with the same set of parameters’, and therefore, ‘each experiment yields a unique set of hardening parameters’. These differences in hardening constants are therefore due to the inability of the hardening model to accurately predict material behaviour for all loading conditions and for all strain ranges.
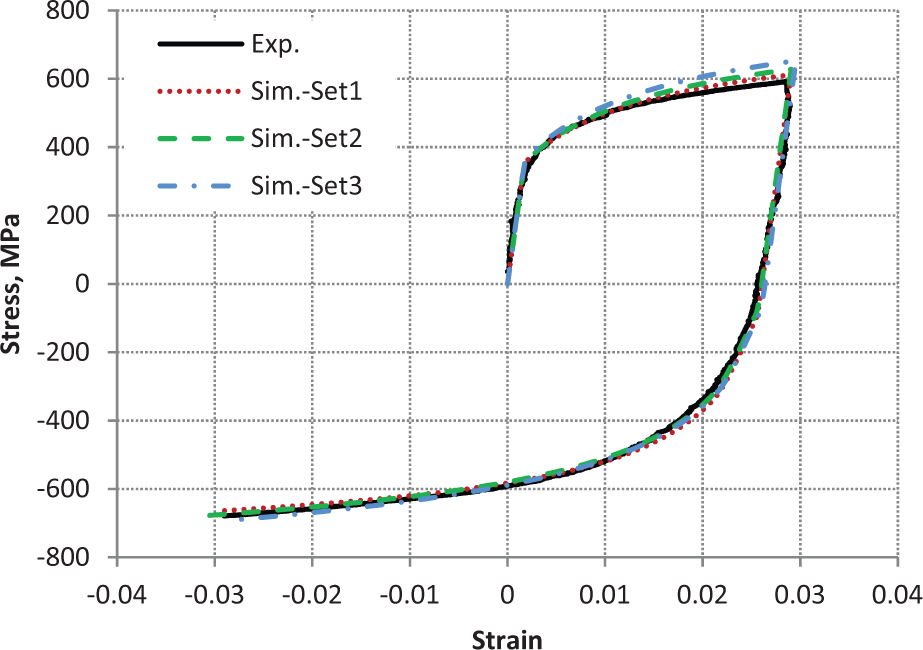
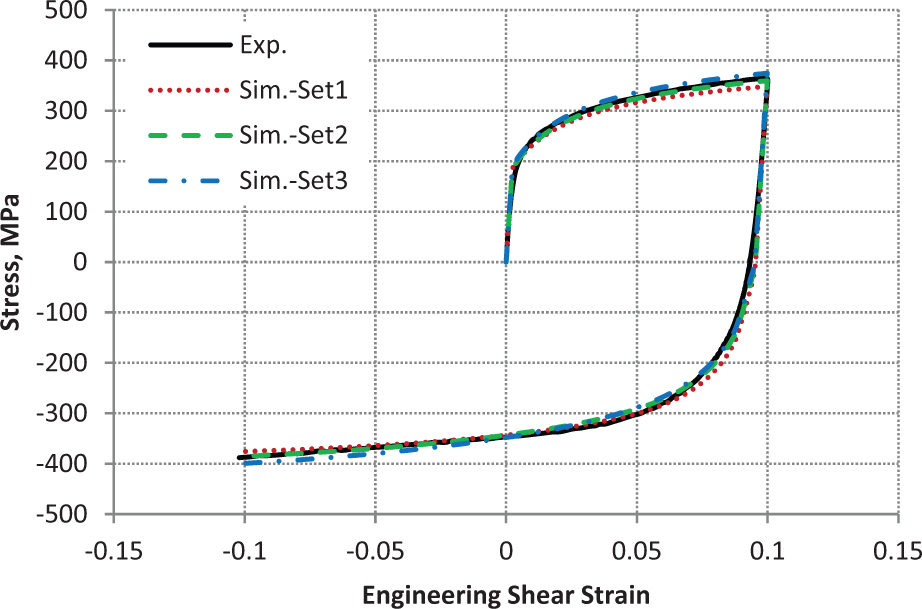
Figures 2 and 3 compare the simulated stress–strain response of DP600 with those obtained by uniaxial TC and simple shear tests, respectively. Figure 4 also compares the moment–curvature response of DP600 in the bending test with that obtained by simulation. A comparison between the simulated and experimental cyclic responses of AKDQ is also shown in Figures 5–7 for each type of test. Figures 2–7 show that the set of constants determined from each test is able to reproduce the experimental cyclic response of the same test fairly well. For example, Set 1 accurately reproduces the experimental response in uniaxial TC test for both DP600 and AKDQ. The ability of the each set to reproduce the material response in other tests is also shown in Figures 2–7, and this issue will be discussed in more detail in the next section.
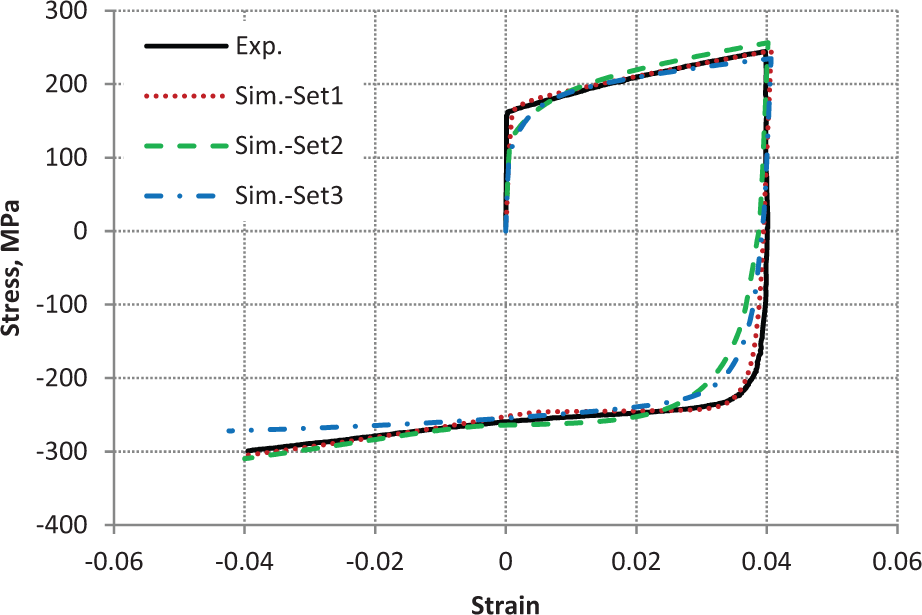
Comparison between the predicted and experimental responses of DP600 in uniaxial TC.
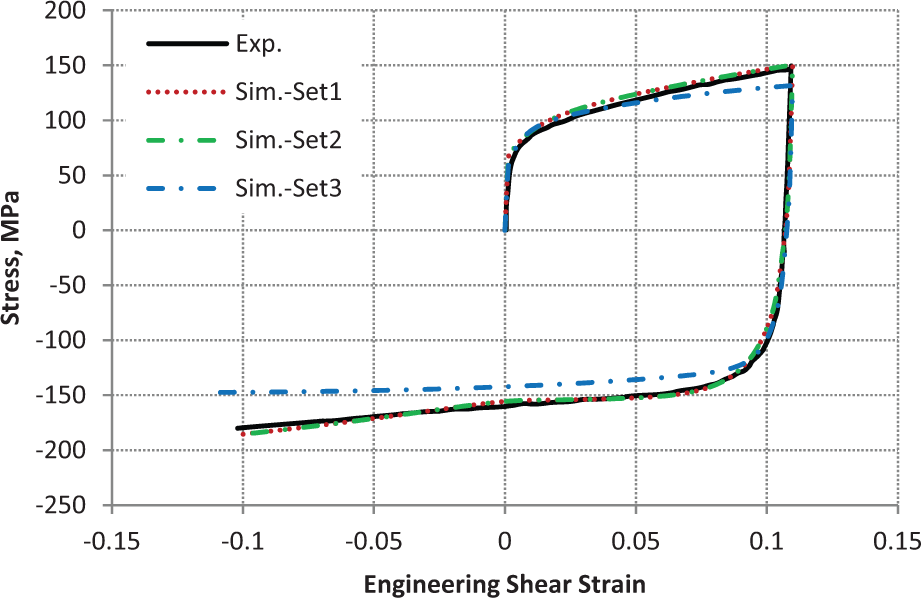
Comparison between the predicted and experimental responses of DP600 in simple shear.
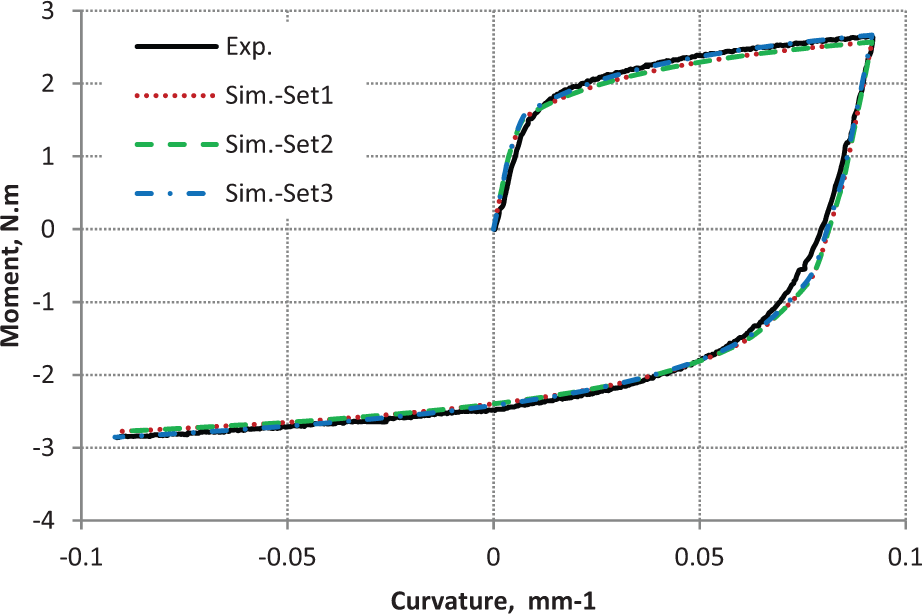
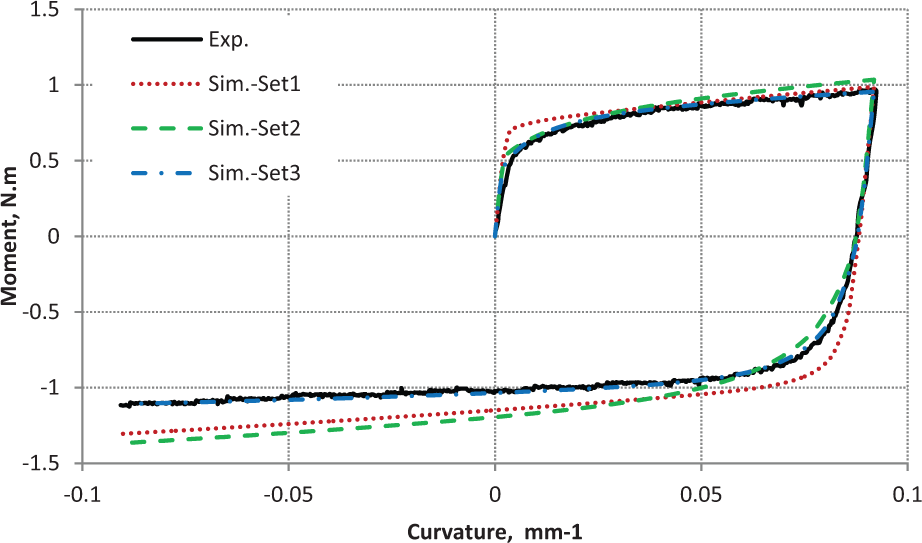
Comparison between the predicted and experimental responses of DP600 in bending.
Comparison between the predicted and experimental responses of AKDQ in uniaxial TC.
Comparison between the predicted and experimental responses of AKDQ in simple shear.
Comparison between the predicted and experimental responses of AKDQ in bending.
Figures 2–7 also show that DP600 does not exhibit work hardening stagnation during reverse loading. However, AKDQ shows a considerable period of work hardening stagnation during reverse loading, but only in the uniaxial TC (Figure 5) and simple shear (Figure 6) tests. It is interesting to note that work hardening stagnation is not observed during load reversal in the bending test with AKDQ.
Simulation of uniaxial TC, shear and bending tests
In the previous section, the material parameters for YU models were identified using uniaxial TC, simple shear and bending tests. In this section, we use the set of material constants obtained by one test to simulate the other two tests, and then, the results are compared.
Simulations using the constants determined from the uniaxial TC test (Set 1)
Figures 3 and 4 compare the simulated cyclic response with the experimental response for DP600 in the shear and bending–reverse bending. It is evident from Figures 3 and 4 that the set of constants determined from the TC test, that is, Set 1, can describe the behaviour of DP600 fairly well in both shear and bending–reverse bending. A comparison between the simulated and experimental responses for AKDQ is also shown in Figures 6 and 7. As can be seen, the behaviour of AKDQ in shear is predicted fairly well by the model. However, there is a considerable discrepancy between the simulated and experimental responses when the bending–reverse bending is simulated using the set of constants obtained from the TC test.
Simulations using the constants determined from the shear test (Set 2)
Figure 2 compares the simulated and experimental stress–strain response of DP600 in the uniaxial TC test. A comparison between the experimental moment–curvature of DP600 with that obtained from simulation is shown in Figure 4. Figures 2 and 4 show that the set of material constants obtained from the shear test, that is, Set 2, is able to reproduce the material response fairly well in TC and bending–reverse bending. Figures 5 and 7 show the experimental and simulated cyclic responses of AKDQ in the uniaxial TC and bending tests, respectively. When the set of constants obtained from the shear test is used to simulate the uniaxial TC loading, the material permanent response is predicted relatively well, but the transient response during reverse loading is not well predicted. This is mainly because of the lower yield strength of the material in shear compared to uniaxial TC test. When the set of constants determined from the shear test is used to simulate the bending–reverse bending, neither the transient response nor the permanent response is in good agreement with the experimental data.
Simulations using the constants determined from the bending test (Set 3)
Figures 2 and 3 compare the experimental response of DP600 with that predicted by simulation of uniaxial TC and shear loading, respectively. Figure 3 shows that the set of constants obtained from the bending test, Set 3, describes the behaviour of DP600 fairly well in simple shear. However, there is some discrepancy between the predicted and experimental behaviour in forward loading when simulating uniaxial TC loading of DP600 (Figure 2). A comparison between the predicted and experimental responses for AKDQ is also shown in Figures 5 and 6. As can be seen, the discrepancy between the simulated and experimental responses, especially during reverse loading, is noticeable indicating that the set of constants determined from the bending test does not reproduce the behaviour of AKDQ well in either simple shear or uniaxial TC.
Simulation of springback
In order to evaluate the ability of each set of constants to predict springback, AKDQ and DP600 blanks were experimentally formed in a channel draw die, and the springback in the sidewalls of the drawn channel sections was measured. This problem is the first stage of the NUMISHEET 2005 Benchmark 3 (BM3), 17 and it should be noted that the AKDQ and DP600 sheet materials described in this article are the very same materials that were used for the NUMISHEET BM3. In the present investigation, each set of material constants (Tables 3–5) was used to simulate the forming and the subsequent springback of the drawn channel sections, and the predicted profiles of the channel sidewalls are compared with the experimental profiles after springback. The ability of each set of constants to predict springback will be discussed.
NUMISHEET 2005 BM3
To form U-shaped channel sections, 1067-mm-long, 254-mm-wide and 1.0-mm-thick rectangular blanks were drawn through the tooling shown in Figure 8. Four spacer blocks, as shown in Figures 8 and 9, have been used to create a larger distance than the nominal thickness of the sheet between the sheet and the binder (see Figure 9). This minimizes the effect of friction that can significantly affect both the forming and springback stages. The channel profiles after springback were recorded using a Virtek LaserQC™ two-dimensional (2D) laser scanner. A typical example of a channel section after springback is shown in Figure 10. The interested reader is referred to Green 17 for more detailed information on this BM.
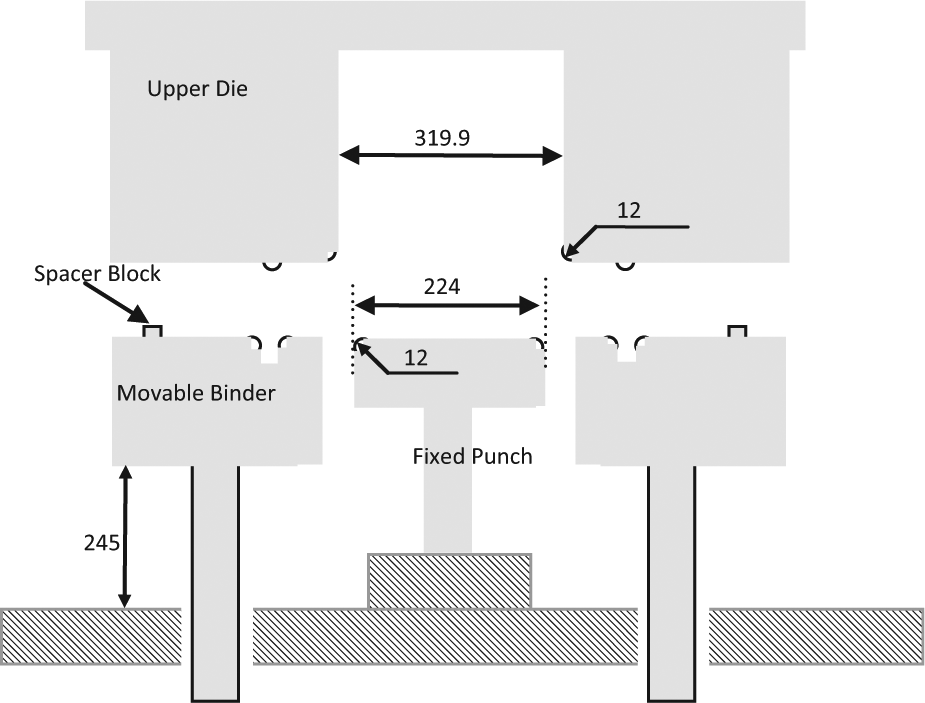
Schematic illustration of the NUMISHEET 2005 BM3 channel draw die (all dimensions in millimetre). 17
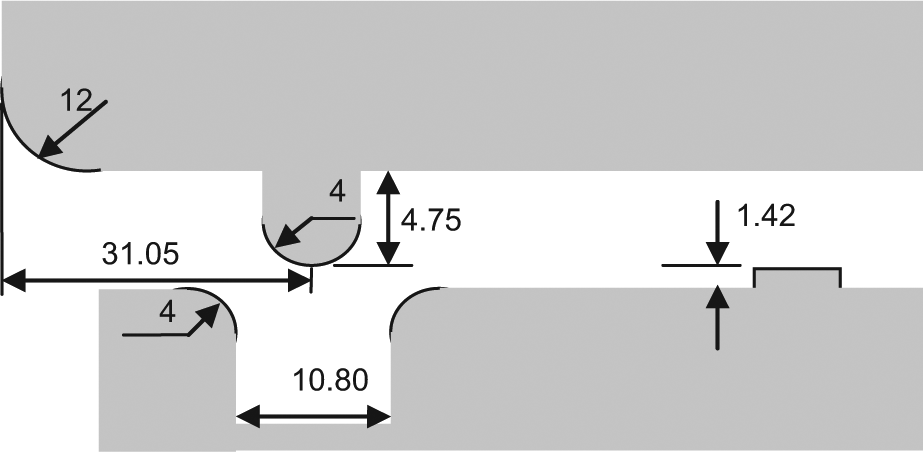
Schematic representation of the drawbead tooling in the A/SP channel draw die (all dimensions in millimetre). 17
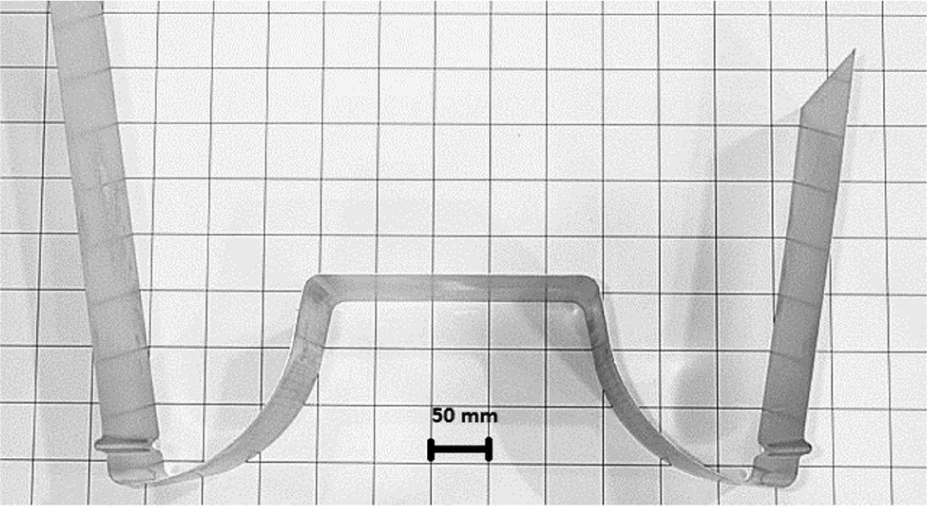
Photograph of a drawn channel section after springback.
Numerical modelling
The forming stage was simulated using ABAQUS/Explicit, and the subsequent unloading stage was modelled using ABAQUS/Standard. Due to the symmetric geometry of the drawn channels, only half of the sheet and tooling were modelled. A linear plane-strain solid element with reduced integration, named as CPE4R in ABAQUS, was used to model the sheet. A mesh convergence study showed that a mesh size of 0.25 × 0.25 mm 2 was required to guarantee the convergence of the finite element model. The coefficient of friction was determined to be 0.12 based on the data obtained from twist compression tests. 18 The three sets of constants, listed in Tables 4 and 5, were used to model the material behaviour.
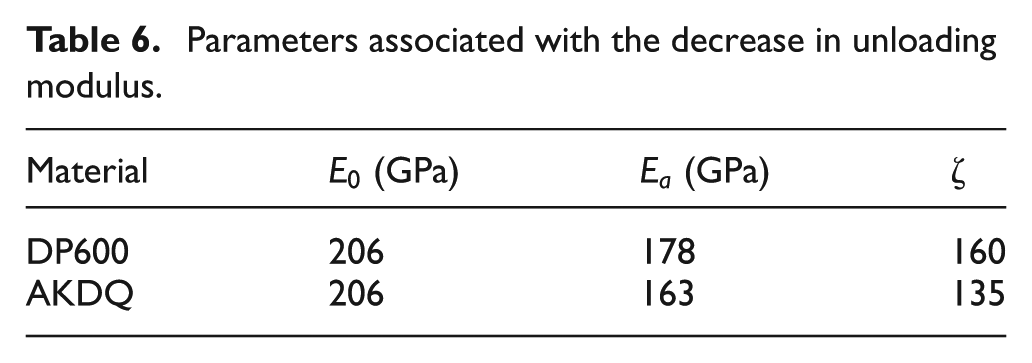
The decrease in elastic modulus during unloading is an important factor to consider for accurate simulation of springback. Several researchers have reported that the elastic modulus during unloading decreases with plastic deformation.19–21 Benito et al. 21 proposed the following empirical equation to calculate the decrease in unloading modulus with plastic strain

where E is the instantaneous elastic modulus, E0 is the elastic modulus of the as-received material, Ea is the elastic modulus at infinitely large plastic strains, p is the effective plastic strain and
Parameters associated with the decrease in unloading modulus.
Results and discussion
The simulations were repeated for each set of constants obtained from bending, simple shear and uniaxial TC tests. Figures 11 and 12 compare the springback profile obtained by experiment and simulations using different set of constants.
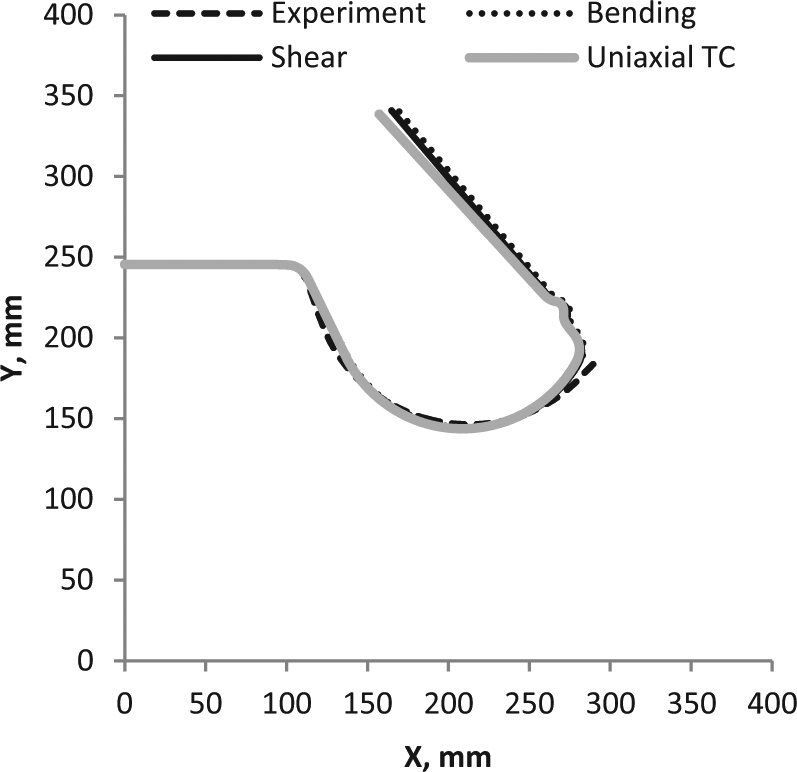
Predicted and experimental profiles of DP600 channel sections after springback.
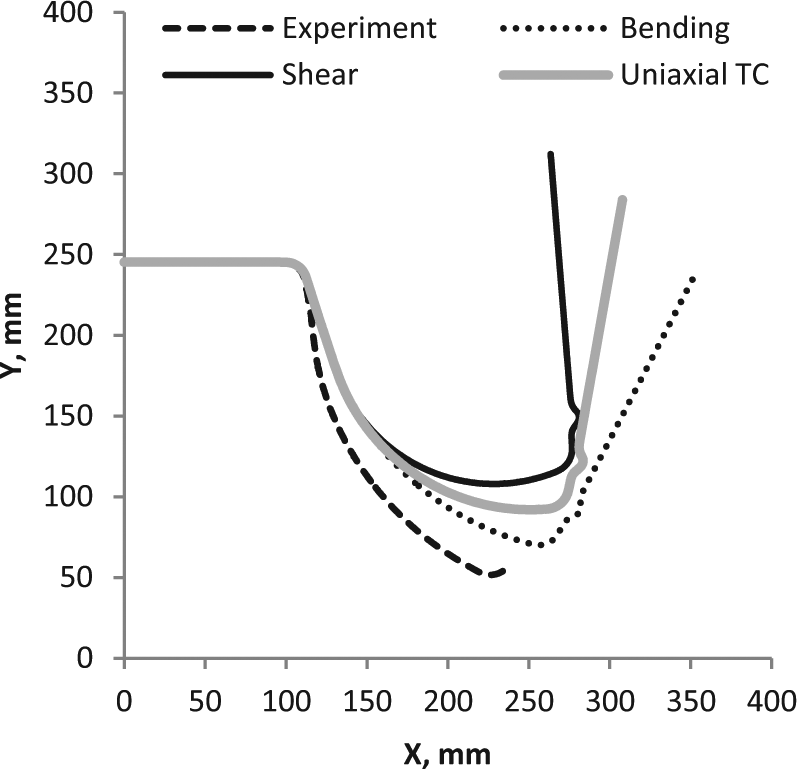
Predicted and experimental profiles of AKDQ channel sections after springback.
Figure 11 shows that the predicted springback profiles correlate very well with the experiments for DP600 channels. It is also evident that all three different sets of constants result in almost the same springback profile for DP600. In order to explain this, let us consider the history of deformation in this problem. A material point that flows through the drawbead and ends up in the channel sidewall actually experiences 2.5 cycles of bending–unbending–reverse bending in the drawbead and over the die radius followed by tension in the sidewall. Therefore, the dominant deformation mode is one of bending, and consequently, it is expected that the set of constants obtained from the bending test will produce the best results. However, since the other two sets of constants describe the material response in bending fairly well, as shown in Figure 4, it is not surprising that the springback profiles obtained by each set of constants are practically identical.
The number of cycles and the strain magnitude in each cycle during the test are also important factors that must be considered when performing cyclic tests for identification of material constants. If the strain magnitude in the simulation extends beyond the strain magnitude in the test, there is no guarantee that the material response will be accurately modelled. However, the maximum strain magnitude that can be achieved varies from one test to another. It is usually possible to achieve greater strains in the shear test compared to the other two tests. Therefore, if the material behaviour in shear, bending and uniaxial TC tests do not change significantly, as is the case for DP600, it makes no difference which type of test is used to determine the material behaviour. So, when the dominant deformation mode is one of bending or TC and if it is not possible to achieve the required strain magnitudes with such tests, then the simple shear test can be selected to obtain the material response.
Unlike DP600, the springback profiles predicted from each set of constants differ significantly for AKDQ channel sections. The least error in springback prediction is associated with the set of constants obtained from the bending test. When the material constants obtained from the uniaxial TC and shear tests are used to simulate the bending–reverse bending, as shown in Figure 7, the stress response is overestimated. Consequently, when simulating a process such as BM3 where bending is the dominant type of deformation, the stress will also be overestimated at the end of the forming stage, thus resulting in an overprediction of the springback. Therefore, for materials whose behaviour is dependent on the type of loading, such as AKDQ, it is preferable to select a characterization test based on the dominant deformation mode in the forming stage. Figure 12 shows that the error in springback prediction for AKDQ is quite large even when the set of constants obtained from the bending test is used. It is thought that if the bending test could be performed up to larger strain magnitudes and with a greater number of cycles, the hardening constants would likely reproduce the material behaviour more accurately at larger strains, and consequently, the springback profile may be predicted more accurately. The complex friction conditions in the drawbead region and a possible difference in unloading modulus in plane-strain tension compared to uniaxial tension could be further sources of error in springback prediction for this material. It should be mentioned that the unloading modulus for this material was experimentally obtained in a uniaxial deformation mode, whereas the unloading of the BM3 channel sections actually occurs in plane strain.
Conclusion
Three different cyclic tests were utilized to identify the material constants for the YU hardening model. Hill’s quadratic yield function was also used to describe the anisotropy of two different materials: DP600 and AKDQ. The set of material constants obtained from each test was used to model the loading path in the other tests, and the simulated response was compared with that of the experiment. Finally, each set of material constants was used to simulate springback in a channel draw process. The following observations and conclusions can be drawn from this work:
Different material characterization tests lead to different sets of hardening parameters.
The cyclic behaviour of DP600 in shear, bending and uniaxial TC is similar. Therefore, the set of constants obtained from each test is able to describe the material behaviour in the other tests. Furthermore, each set of hardening parameters leads to a very good prediction of springback.
If the material response is similar in bending, shear and uniaxial TC tests, any of these tests can be used to identify the material constants. But, if the material cyclic response is required at large strains, the shear test would be preferred to characterize the material behaviour since it is capable of achieving greater strain amplitudes than the other two tests.
The behaviour of AKDQ in bending is different from that in uniaxial TC and shear loading. Indeed, work hardening stagnation is not observed in the reverse bending test.
If the material response is different for different types of loading, the material characterization test should reflect the dominant deformation mode in the forming process that is to be simulated. Eggertsen and Mattiasson 14 came to this same conclusion when they observed that ‘tests that best resemble the actual springback problem result in the most accurate springback predictions’.
Footnotes
Acknowledgements
Professor R.H. Wagoner and Dr P. Raghupathy from Ohio State University are gratefully acknowledged for carrying out the experimental cyclic tension–compression tests.
Declaration of conflicting interests
The authors declare that there is no conflict of interest.
Funding
This study received financial support from the Natural Science and Engineering Research Council (NSERC) of Canada.