
Abstract
Background:
Driving while undergoing pharmacological treatment poses a significant risk to road safety. The Driving under the Influence of Drugs, Alcohol, and Medicines (DRUID) system, currently used to classify medicines according to their impact on driving ability, has important limitations, including the absence of classification for numerous drugs, low reproducibility, and limited clinical applicability.
Objectives:
To develop a continuous, multifactorial metric capable of refining the estimation of medication-related driving risk and to assess its preliminary performance compared with the traditional DRUID system.
Design:
Methodological development and initial validation study.
Methods:
In this study, we propose a new multifactorial risk scale, validated by healthcare professionals and engineers, which integrates key pharmacological and clinical variables. The scale combines six weighted criteria: DRUID category, frequency and severity of adverse reactions, number of driving-related adverse reactions, marketed dose, treatment initiation versus chronic treatment, and pharmaceutical dosage form. Each variable was normalized to a 0–1 scale to ensure comparability. In addition, correction mechanisms were introduced to avoid bias arising from the presence of multiple adverse reactions with unknown frequencies, ensuring robustness to incomplete data.
Results:
When applied to different clinically used medicines, the scale showed greater sensitivity and accuracy in discriminating risk compared with the traditional DRUID system, reproducing its qualitative categorization while providing finer intraclass resolution, particularly for medicines situated near risk thresholds.
Conclusion:
This tool offers a more flexible, reproducible, and clinically applicable approach with the potential for integration into e-prescribing, mobile health applications, and community pharmacy support systems, supporting more nuanced and evidence-based clinical decision-making.
Plain language summary
Many medicines can make people sleepy, slow their reactions, or blur their vision. This can raise the risk of a crash when driving. Today, information about these risks is scattered across leaflets and drug labels, and it is hard for patients and health professionals to compare medicines fairly. We created a simple scoring system that sums up how likely a medicine is to affect safe driving. The score combines several practical elements: which side effects related to driving are reported (such as drowsiness or dizziness) and how likely they are; the usual dose and timing; how the medicine is taken (e.g., by mouth or as a patch); whether people develop tolerance; and whether combining medicines or alcohol could make things worse. The final output is an easy-to-read risk level that can be shown in electronic prescriptions, pharmacy software, or patient apps. It can help patients and clinicians discuss options (for instance, choosing a non-sedating antihistamine instead of a sedating one when driving is essential) and plan safer behaviors, like avoiding night driving during the first days of a new treatment. This tool does not replace clinical judgment. It gives a clear summary to support shared decisions. More studies are needed to confirm the score against real-world outcomes (such as simulator performance or crash data) and to refine the levels for different patients.
Keywords
Introduction
Road safety is compromised by multiple factors, including the use of medicines that affect the central nervous system and psychomotor ability. Scientific evidence has shown that commonly used drugs, such as anxiolytics, antidepressants, and antihistamines, can reduce attention, reaction time, and coordination, thereby increasing the risk of traffic accidents. Within the European Union, the need arose to harmonize communication regarding the impact of medicines on driving. To that end, in 2011, the Driving under the Influence of Drugs, Alcohol, and Medicines (DRUID) system was adopted, classifying medicines into four categories (0–3) according to their influence on fitness to drive, 1 as summarized in Table 1.
Classification and meaning of the DRUID categories.

Source: Adapted from Ravera et al. 1
DRUID, Driving under the Influence of Drugs, Alcohol, and Medicines.
This classification has helped standardize safety messaging, implement alert measures, and serve as a reference for both professionals and patients.
However, accumulated experience has highlighted certain operational limitations of this approach. First, numerous medicines lack an assigned classification, 2 creating information gaps or reliance on extrapolations.
Second, in parallel with the categorization framework, the DRUID project included extensive epidemiological and experimental studies in different European countries, which provided harmonized estimates of the prevalence of driving under the influence of medicines, alcohol, and drugs, but also revealed substantial methodological variability between countries and biological matrices. For example, the limited availability of correlation data between blood, oral fluid, and urine hindered the comparability of impairment assessments across roadside studies conducted within DRUID. 3 Similarly, subsequent analyses of the policy recommendations derived from the project pointed to difficulties in translating the findings into coherent regulatory practices across Member States, partly due to the heterogeneity in national legal frameworks and implementation pathways. 4 Additional reports have identified persistent gaps in the surveillance of driving under the influence of medicines and drugs in Europe, particularly the greater availability of data from injured or deceased drivers than from the general driving population, which limits the representativeness and operational applicability of the information derived from DRUID. 5 Taken together, these findings indicate that although DRUID provides an essential regulatory reference, there are methodological and operational limitations that affect the reproducibility and overall consistency of the risk information it provides.
Third, the categorization showed low reproducibility across evaluators and regulatory documents. This is due to the qualitative nature of the descriptors and the absence of universal numerical thresholds; the heterogeneity of sources (Summary of Product Characteristics (SmPCs)/product information from different marketing authorization holders or countries, scientific literature, and pharmacovigilance data) that do not always agree on the naming or frequency of ADRs; the fact that a single active substance may display different profiles depending on dose/presentation, pharmaceutical form/route, and treatment phase (initiation, dose adjustments, and chronic use), aspects that evaluators integrate in different ways; and to updating lags between documents, such that decisions made with different data cut-off dates may diverge.
These limitations are consistent with the methodological heterogeneity described in DRUID-related studies, in which variations in sampling protocols, analytical methods, and classification criteria have been identified as sources of limited reproducibility across investigations.3–5
Lastly, key clinical factors, such as dose and presentation, treatment timing (initiation, titration/adjustments, and chronic use), and pharmaceutical form, were not considered, even though they can substantially modify the real-world influence on driving.
Beyond these shortcomings, the DRUID categories are qualitative descriptors of a medicine’s effect on driving (“none/negligible,” “minor,” “moderate,” and “severe”). By their nature, they constitute an ordinal scale: they rank the level of influence but do not establish proportional distances between categories. It is not methodologically correct to interpret a change from 1 to 2 as “double” the risk, nor to assume that the jump from 2 to 3 is equivalent to the increase from 0 to 1. These levels are useful for clinical counseling and risk communication; however, they do not constitute a linear metric.
There is also an intraclass heterogeneity. A single active substance may fall into different categories depending on the dose and presentation, pharmaceutical form and route of administration, or treatment phase (initiation, dose adjustments, and chronic use). 6 This variability means that two medicines in the same category do not necessarily share the same risk profile in practice and that one medicine may shift categories depending on the context of use.
These limitations justify complementing the DRUID with a continuous, multifactorial signal that refines risk discrimination and improves clinical applicability. In this study, we present a risk scale that explicitly and reproducibly integrates medicine-level variables: the DRUID category, frequency and severity of adverse reactions relevant to driving, number of such reactions, pharmaceutical form/route, and treatment phase (initiation vs chronic use). The methodology also incorporates a robust treatment of uncertainty when the frequency of adverse reactions is unknown, thereby avoiding under- or overestimation bias in the results.
Consistent with the above, we set out to develop and describe a continuous, multifactorial scale to estimate the risk of medicines for driving and evaluate its performance in representative cases, comparing it with the DRUID classification. We also examined its consistency through a review by healthcare professionals and basic sensitivity analyses and assessed its feasibility for implementation in e-prescribing, dispensing software, and a public health mobile application.
Methods
A methodological study was conducted to develop and initially validate a multifactorial scale applicable to medicines with a potential impact on driving. Each criterion of the scale was quantified from 0 to 10 and, after standardization to 0–1, integrated into a composite index (FMB_norm, 0–1) using a weighted sum. For presentation purposes and to allow comparison with the DRUID classification, the index was transformed using a nonlinear saturating function, yielding a 0–3 scale (practical maximum ≈ 3.77) that preserves ordering and gives greater weight to high-risk profiles. The selection of domains, their operational definitions, and the weights were established by consensus of a panel of healthcare professionals and engineers. Double independent data extraction was performed, discrepancies were resolved by consensus, and sensitivity analyses of the model parameters were performed.
Information sources and data extraction
For each active substance and presentation evaluated, the current SmPC was reviewed,7–20 and when appropriate, clinical and pharmacovigilance literature was reviewed. Adverse drug reactions (ADRs) relevant to driving (e.g., drowsiness/sedation, dizziness/vertigo, ataxia/clumsiness, blurred vision, psychomotor slowing, decreased attention/concentration, confusion, and symptomatic hypotension) and their frequency according to the SmPC (very rare, rare, uncommon, common, and very common) were identified, explicitly recording ADRs with unknown frequency. Extraction was performed by two independent reviewers, and discrepancies were resolved by consensus. The assigned DRUID classification, total number of ADRs, marketed doses, pharmaceutical form, and treatment phase (initiation/adjustment vs chronic) were documented.
Inclusion and exclusion criteria
Medicines were eligible for inclusion if they were authorized for marketing in Spain and had a publicly available and up-to-date SmPC at the time of data extraction. The analysis was designed with a broad scope, applicable to medicines across the full spectrum of driving-related risks, without preselection based on the expected impact on driving ability. For each included active substance, analyses were conducted under standardized conditions by selecting the maximum marketed dose and the pharmaceutical presentation with the highest expected impact on driving ability to ensure comparability across medicines.
Medicines were excluded if no SmPC was available, if they had been withdrawn from the market at the time of analysis, or if they were investigational products that were not authorized for marketing. Fixed-dose combination medicines were excluded unless the contribution of each individual active substance to the driving-related risk could be independently characterized based on the available information.
For external validation analyses, active substances without an assigned DRUID category were included, provided that sufficient SmPC-based safety information was available to calculate the FMB score using the no-DRUID variant of the model.
Construction of the FMB scale and structure of the criteria
The scale integrates six criteria, each initially scored from 0 to 10 and subsequently normalized to a 0–1 scale for weighted aggregation into a composite index, as detailed in Table 2.
Criteria for the FMB risk scale.
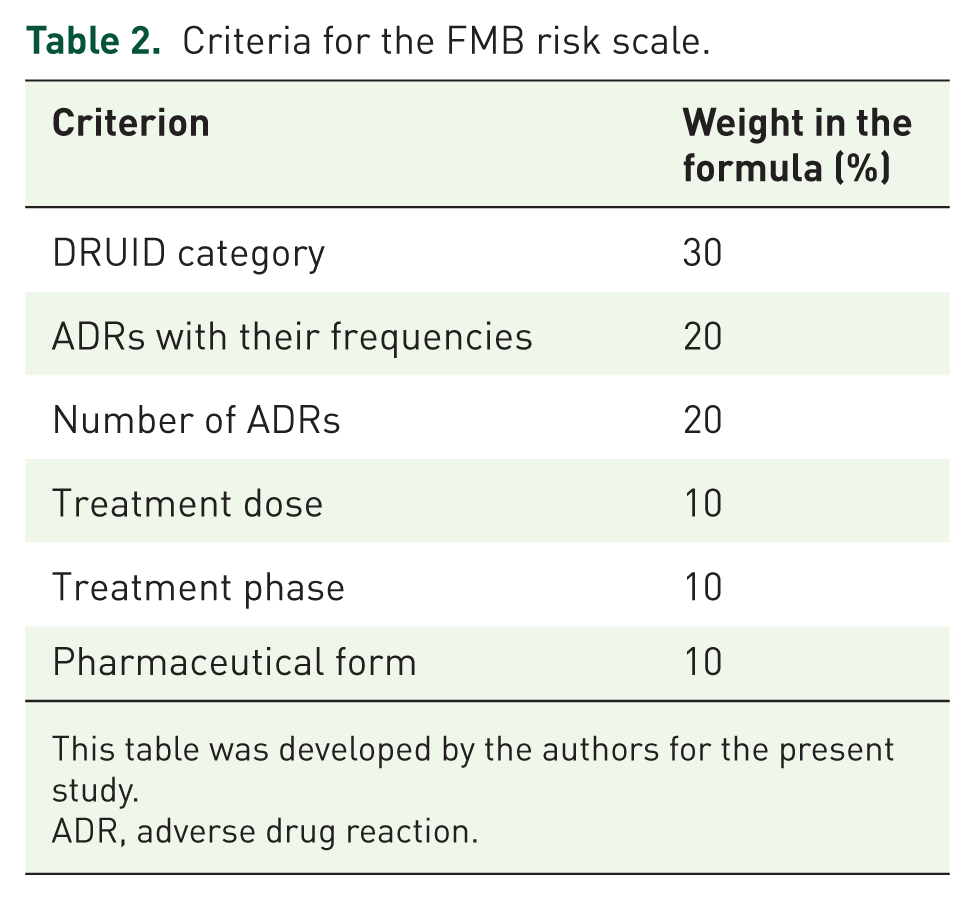
This table was developed by the authors for the present study.
ADR, adverse drug reaction.
DRUID category
The DRUID category (0–3) is the European reference framework for communicating the influence of drugs on fitness to drive. It is a qualitative, ordinal scale that synthesizes pharmacological, psychometric, and epidemiological evidence into risk levels. Although it is not a linear metric, its widespread use in clinical practice and regulation makes it a necessary anchor point for any proposal aspiring to interoperate with current systems in clinical settings.
To integrate it into the scale, equidistant mapping to a 0–10 scale was performed, preserving the order and interpretability of the levels, as shown in Table 3. When an active substance presents multiple categories depending on its presentation, the most restrictive is adopted or, where appropriate, the results are reported by presentation to preserve granularity. If a medicine lacks a DRUID classification, it is explicitly assigned a neutral value, thereby avoiding either favoring or penalizing the absence of classification and allowing the remaining criteria to modulate the risk signals.
Equivalences with the DRUID scale.

This table was developed by the authors for the present study.
DRUID, Driving under the Influence of Drugs, Alcohol, and Medicines.
The contribution of this criterion to the overall formula is as follows:
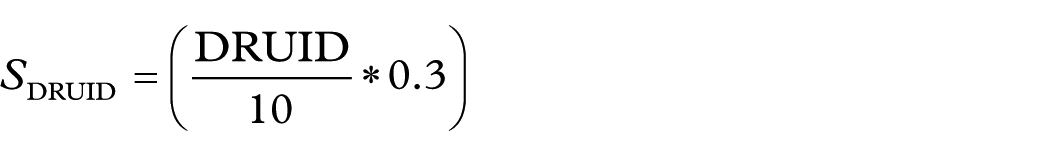
Assigning the greatest weight to DRUID is grounded in methodological and operational reasons. First, DRUID represents a European regulatory consensus and provides traceability; because it is aligned with educational materials and the driving pictogram on the packaging, it facilitates the clinical interpretation of the final score. Second, its category encapsulates a synthesis that is difficult to replicate with a single formula, combining pharmacodynamic and pharmacokinetic data, psychomotor performance tests, simulated driving studies, and evidence from clinical practice. In contexts where ADR documentation is heterogeneous or frequencies are unknown, this signal provides stability, which justifies its relative prominence within the composite metric.
Simultaneously, safeguards are introduced to prevent DRUID from “dominating” the result, since the 0–10 mapping is bounded and linear and therefore does not by itself pull the score toward extreme values.
Taken together, DRUID serves as the interpretive backbone of the scale: it provides continuity with the current standard and an immediate read for clinicians, while the remaining criteria contribute granularity and context to refine risk estimation for real-world use.
ADRs by frequency and impact
ADRs relevant to driving constitute the clinical core of risk, as they directly affect vigilance, coordination, and psychomotor performance. In this criterion, we considered the severity of each ADR and its frequency of occurrence. Thus, frequent headache or nausea (medium impact) can impair day-to-day driving more than a very rare syncope. Conversely, critical effects (e.g., transient loss of consciousness, marked ataxia) retain a high weight even if their frequency is lower. Therefore, the ADR block contributes 20% to the composite signal.
The quantification and scoring rules rely on two discrete, reproducible scales. Frequency (
Frequency score mapping for ADRs.

This table was developed by the authors for the present study.
ADR, adverse drug reaction.
The hazard/severity (
Level 1.0 (high) group effects that directly and severely compromise fitness to drive, such as intense/hypnotic somnolence, transient loss of consciousness, syncope, seizures, and marked ataxia. Under these conditions, driving is imprudent or unfeasible; hence, the maximum factor.
Level 0.8 (medium-high) includes reactions that, without complete incapacitation, significantly impair relevant sensory or cognitive functions, such as blurred vision or diplopia, moderate confusion, disorientation, and unsteadiness/clumsiness. Their potential to cause perception or execution errors justifies their high impact.
Level 0.6 (medium) corresponds to indirect interference (e.g., nausea, headache, and fatigue). They may distract or slow responses, but typically do not critically affect the essential sensory or motor mechanisms.
Level 0.3 (low) covers complaints with minimal impact on the functions required for safe driving (e.g., tearing, mild paresthesia, and mild agitation). They can be bothersome, but their translation into operational risks is limited.
This block faces two challenges when the evidence is incomplete: underestimation arises if ADRs with unknown frequency are abundant—the average is pulled toward the midpoint—and potential overestimation when, in the absence of data, the same frequency is systematically assigned to almost everything. To correct both biases, we apply an adjusted mean with two general mechanisms: (i) adaptive compression of the aggregate weight of unknowns beyond a threshold X (recommended: 5 hazard units), so they continue to count but progressively less as they accumulate; and (ii) an effective frequency for unknowns that adapts to the coverage of known data (ρ). If little is known, it converges to a prudent value (4), and if the evidence is sufficient, it approaches the midpoint (5). The resulting expression preserves the clinical logic of “frequency × hazard” and explicitly manages the uncertainty (parameters X, λ, γ).
In practice, the result is a monotonic, stable, and reproducible score: if well-characterized relevant ADRs are added, the signal increases; unknown-frequency ADRs neither inflate nor excessively dilute it; and the calculation is traceable across evaluators because it is fully parameterized. This score (0–10) was standardized to 0–1 and contributed 0.20 to the weighted sum of the overall index:

Let the weighted sum of ADRs with known frequency be,
The sum of the hazard of ADRs with unknown frequency would be given by
The compression factor C modulates the aggregate weight of ADRs with unknown frequencies to avoid diluting the average when they are numerous. It is defined as:

Interpretation is straightforward: as long as the volume of unknown information is moderate (
The choice of X = 5 is based on interpretability and robustness. Expressed in “hazard units” (
The term

The effective requency (

where
The term ρ acts as an indicator of the coverage of known evidence: the larger ρ, the greater the (hazard-weighted) proportion of ADRs with known frequency and, therefore, the more confidence there is to bring the unknowns closer to the midpoint value. It is defined as:

Let
The exponent γ determines the curvature of the transition. With γ = 2, the rise from 4 toward 5 is gentle when known coverage is limited (avoiding overestimation) and accelerates only when ρ is clearly high. This specification guarantees that
All model parameters (X, λ, γ, ε) were pre-specified and held fixed in the primary analyses; they were not tuned to the data, thereby avoiding overfitting. The model parameters and their selected values are summarized in Table 5.
Summary of the model parameters and values.

This table was developed by the authors for the present study.
ADR, adverse drug reaction.
The contribution of this criterion to the overall formula is as follows:

Number of ADRs
This criterion captures the breadth of the safety profile and its impact on driving. Whereas the ADR-by-frequency-and-impact block reflects the expected intensity of specific effects, the number of ADRs introduces the multiplicity of risk pathways: the more distinct, potentially disruptive reactions exist, the greater the likelihood that a patient will experience one that compromises their fitness to drive. In practice, this criterion acts as a counterbalance to the adjusted ADR block, particularly when unknown or heterogeneous frequencies are abundant. Its weight in the composite index was 20%.
Relevant ADRs for driving are listed exactly as they appear in the SmPC for that presentation (product/formulation), without introducing frequency or hazard (already modeled in the previous criterion) and without applying additional grouping or redistribution rules. The goal was to measure the diversity of potentially compromising effects reported for that presentation.
The raw number of ADRs was transformed into a 0–10 score in steps of 2 ADRs per half-point, with a ceiling of 10 from ⩾20 ADRs onward, as shown in Table 6.
Mapping for the number of ADRs.

This table was developed by the authors for the present study.
ADR, adverse drug reaction.
The contribution to the composite index is calculated as:

Marketed dose strengths (mg) for the presentation
This criterion introduces a quantitative, simple, and clinically pertinent signal for potential exposure intensity within the same active substance. Although the dose alone does not determine the impairment of driving abilities, many driving-relevant ADRs exhibit a dose-dependent component. All else being equal, a presentation with a higher strength makes the occurrence of adverse effects that compromise driving more likely. With this logic, the dose contributes 10% to the composite index, acting as a modulator without eclipsing the more important domains.
For each active substance and specific presentation (same dosage form and route), all marketed strengths were ordered from lowest to highest and assigned equidistant steps between 0 and 10, such that the highest strength always received 10/10 and the remaining strengths were distributed at equal intervals. Examples of this strength score mapping are presented in Table 7. Thus, if only one strength exists, it scores 10; if two, they score 5 and 10; if three, 3.33, 6.67, and 10; if four, 2.50, 5.00, 7.50, and 10.00; and so on. In spreadsheets, it is sufficient to sort the strengths and assign these steps; it is advisable to round to two decimals and fix the top value at 10.00 to avoid 9.99 due to rounding. “Strength” is taken according to the SmPC’s standardized unit dose (e.g., mg per tablet/capsule, mg/mL per mL, and IU per dose). Pack sizes are not considered as different strengths.
Strength score equivalences (examples).
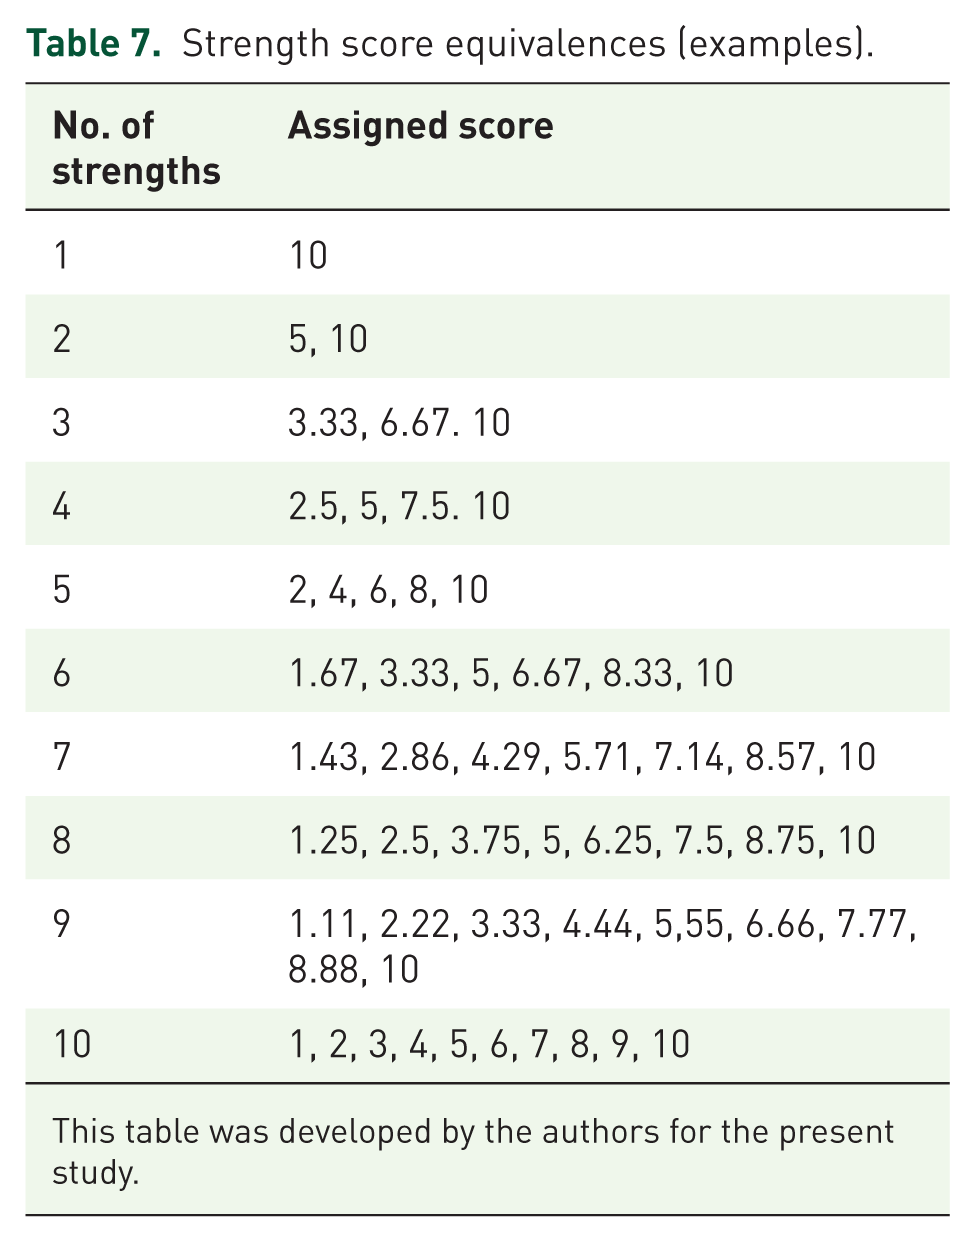
This table was developed by the authors for the present study.
The dose score (0–10) was standardized to 0–1 by dividing by 10 and then multiplying by its 10% weight; this product was the contribution of this criterion to the composite metric:
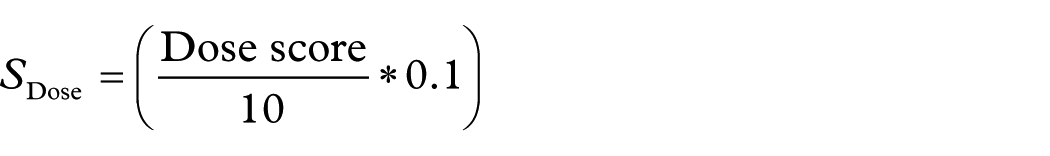
Although this criterion is defined by drug and presentation, its clinical relevance is strongly dependent on the context. The prescribed strength typically depends on interindividual characteristics (e.g., body weight, comorbidity, renal/hepatic function, and tolerability) and therapeutic objectives. Therefore, the dose functions as a marker of exposure intensity under real-world conditions of use. This context dependence justifies its moderate weight within the index, as it provides a signal when a higher probability of dose-dependent ADRs is plausible, without over-representing differences that are, in practice, titrated to the patient.
Treatment phase
The treatment phase substantially modulates the operational driving risk. Many relevant effects—sedation, dizziness, and impairments of attention or coordination—are more likely and more intense at treatment initiation or during dose adjustments/titration, and tend to attenuate after stabilization due to tolerance and adaptation. Incorporating this temporal dimension brings the estimate closer to real-world use and prevents over- or underestimation, which depends on the therapeutic moment. For simplicity and reproducibility, the variable was binary-coded: “initiation/adjustment” = 10/10 (includes first administrations, restarts after a clinically relevant interruption, and periods of titration or dose change); “stable chronic” = 0/10 (maintenance without recent changes, with consolidated tolerability). If the phase could not be reliably established in the source, a pre-specified neutral value of 5/10 was imputed; this did not describe a clinical state but prevented missing-data bias and maintained coherence with the other criteria.
Contribution to the composite index (standardize 0–1, then apply 10% weight):

Accordingly, a patient in the initiation/adjustment phase (score 10/10) adds 0.10 to; in the chronic phase (0/10) adds 0.00; and with neutral imputation (5/10) adds 0.05. Conceptually, the treatment phase acts as a contextual modulator, more tied to the patient and therapeutic setting than to the intrinsic properties of the drug. Its moderate weight provides sensitivity to identify vulnerable periods (initiation, titration, and restart) without coming to dominate the integrated clinical signal provided by the DRUID and ADR block.
Pharmaceutical form
The dosage form conditions the kinetics of release and absorption of the active substance, and with it, the onset speed, peak magnitude, and concentration fluctuation. For the same drug and dose, faster release with higher peaks favors acute effects that may compromise driving; modified-release formulations or designs that blunt the peak tend to attenuate this operational risk. Therefore, the dosage form was incorporated as a pharmacokinetic modulator with a 10% weight, complementing the other criteria.
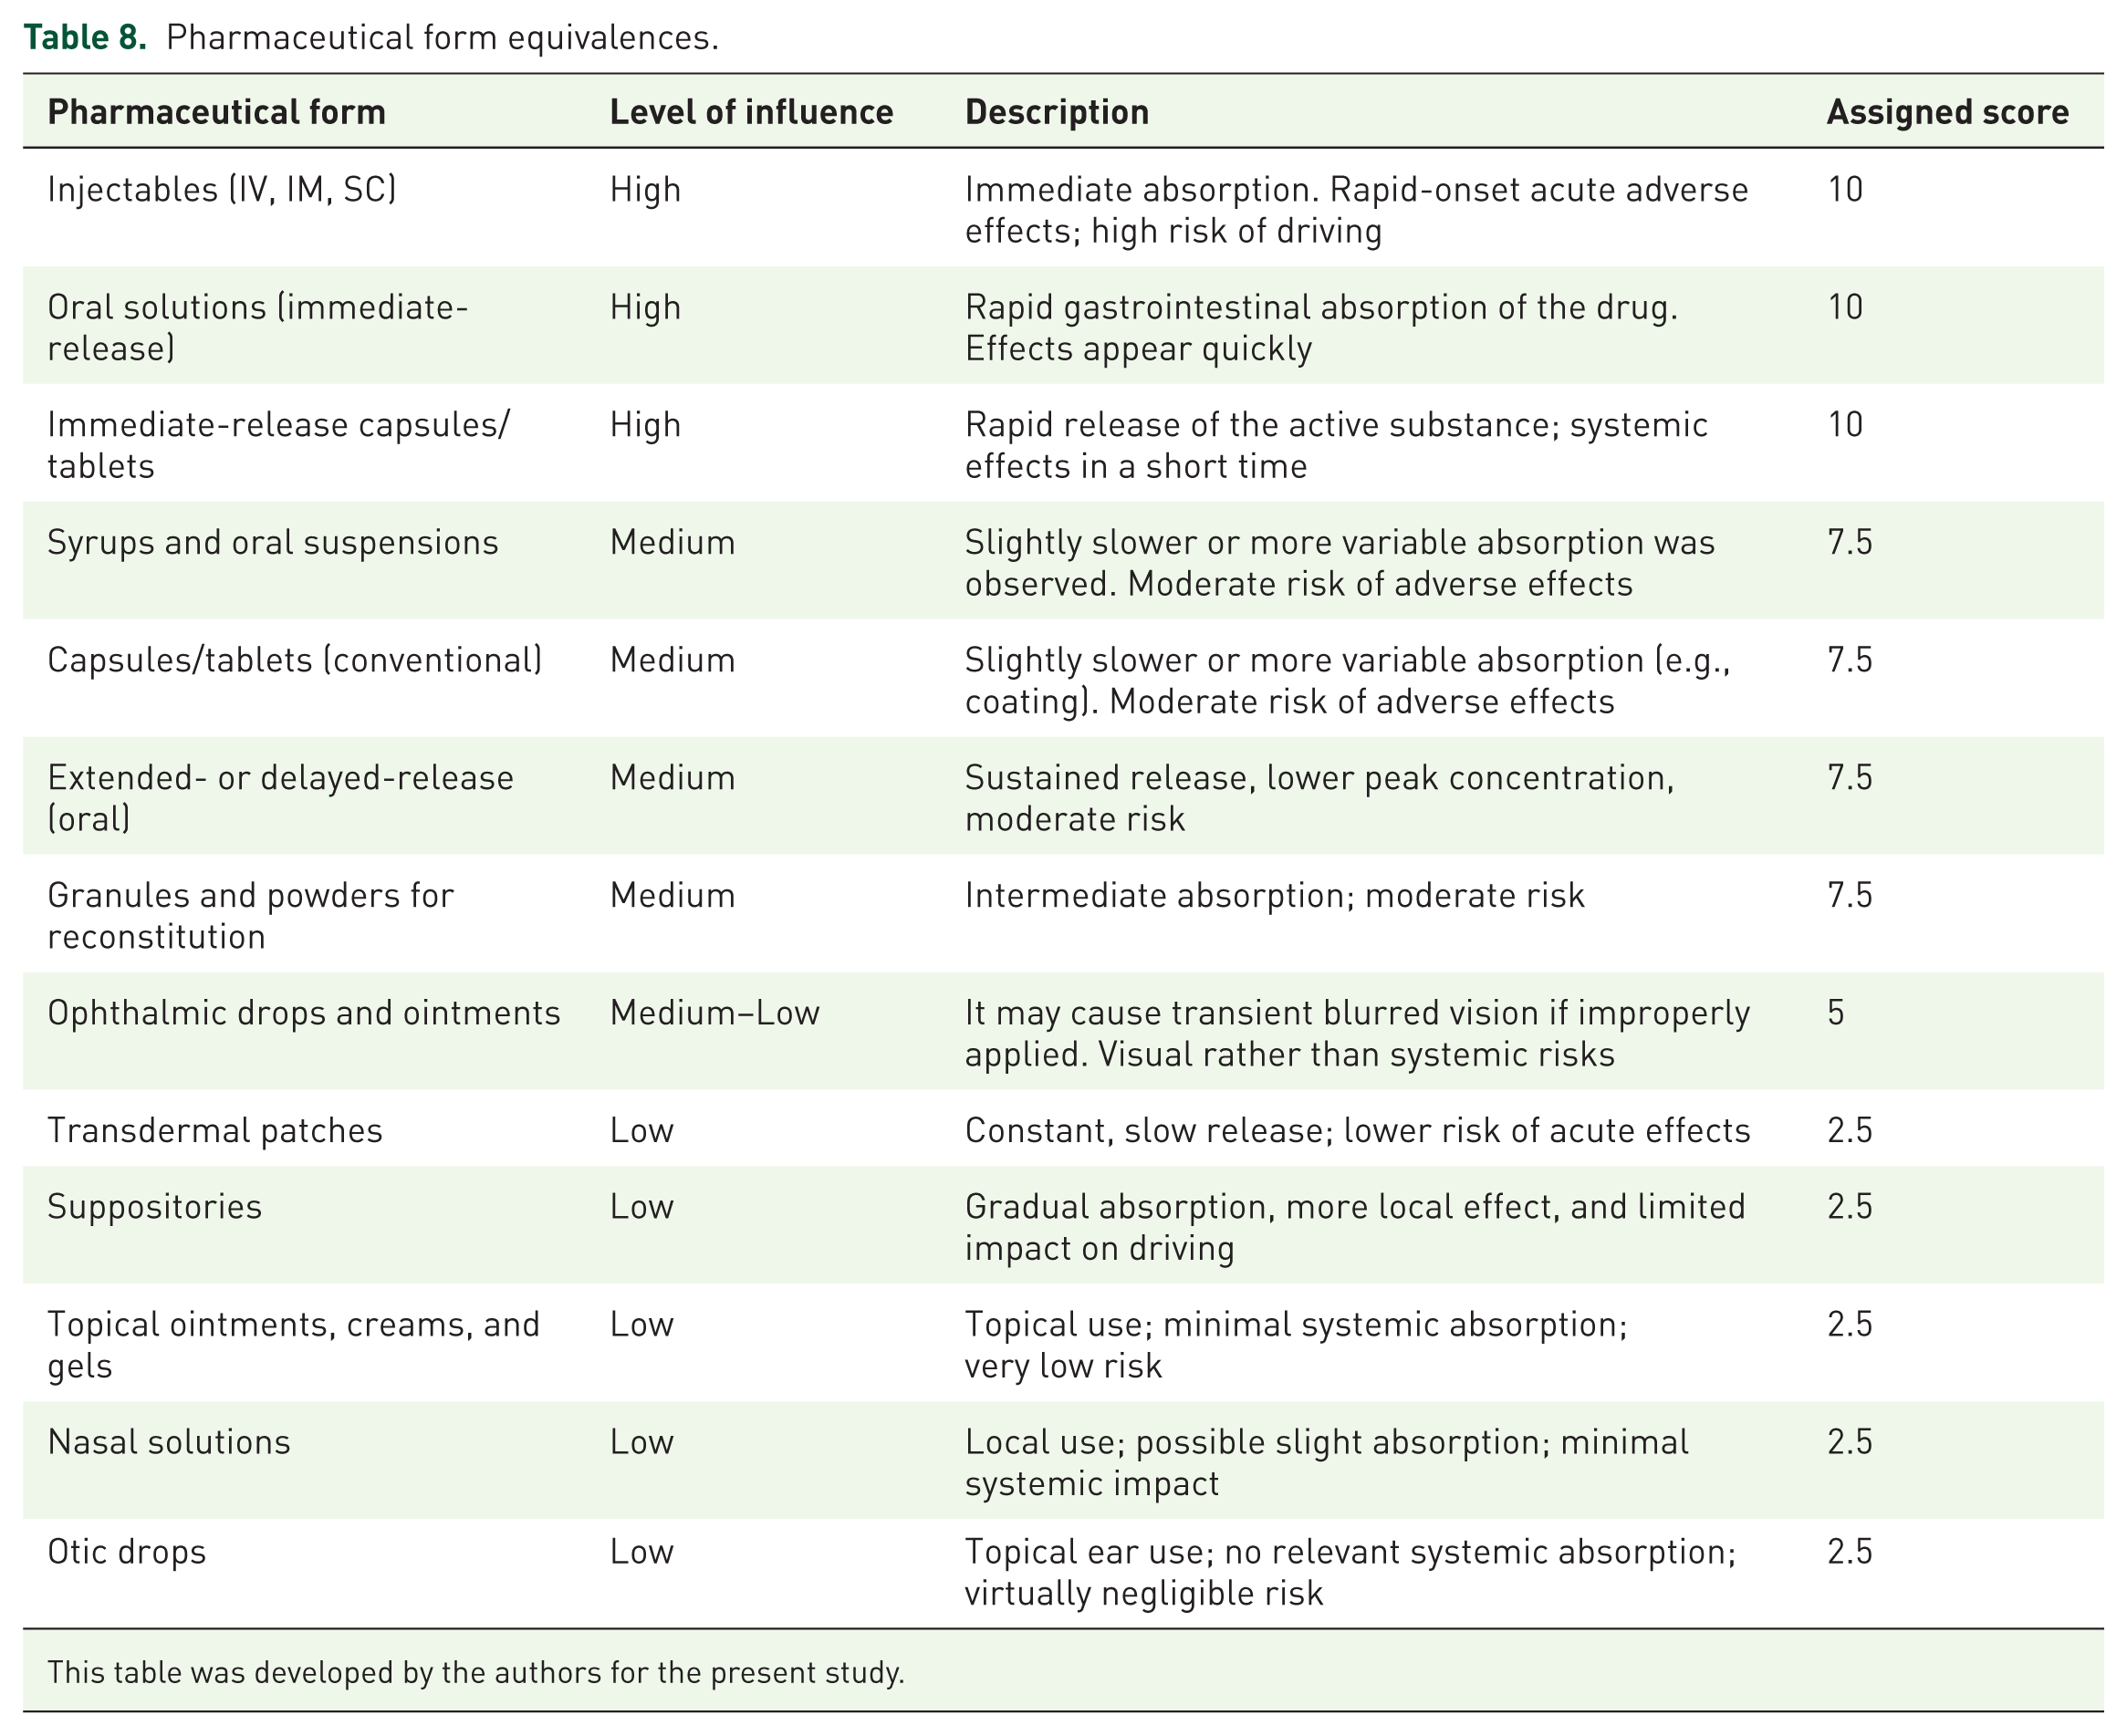
The assignment was made per presentation using an ordinal 0–10 scale consistent with the potential for acute exposure characteristics of each form. The classification and assigned scores are detailed in Table 8.
Pharmaceutical form equivalences.
This table was developed by the authors for the present study.
The pharmaceutical form score (0–10) was standardized to 0–1 (by dividing by 10) and multiplied by its 10% weight:

This criterion translates pharmaceutical (galenic) differences into an operational risk signal: it prioritizes presentations with rapid onset and pronounced peaks and attenuates those with sustained release or low systemic exposure. Its moderate weight ensures that it nuances the profile without displacing the core information provided by DRUID and the ADR block multiplied by frequencies and count.
Taken together, the first three domains—DRUID, ADRs by frequency, and number of ADRs—reflect the intrinsic properties of the medicine (baseline risk, expected intensity, and breadth of the safety profile). The remaining three—dose, treatment phase, and dosage/route—capture conditions of use closely tied to the patient and the clinical setting (exposure intensity, therapeutic moment, and absorption kinetics). This architecture allows the metric to integrate a stable drug-based signal with contextual modulators that bring the risk closer to individual use, maintaining a balanced and reproducible weighting before applying the nonlinear transformation of the global index.
After scoring each domain on a 0–10 scale and standardizing it to a 0–1 scale, the normalized index was obtained as a weighted sum:

To facilitate interpretation and comparison with DRUID, the normalized value is transformed using a saturating, Hill-type nonlinear function (k = 1.65) that preserves ordering and accentuates profiles with high signal across several domains:

resulting in a 0 to >3 scale (practical maximum ≈ 3.77).
Interpretación
The final
Banded interpretation (equivalence to DRUID).

This table was developed by the authors for the present study.
DRUID, Driving under the Influence of Drugs, Alcohol, and Medicines.
The bands were defined by calibration against DRUID in a reference set, not by numerical identity. The nonlinear transform used is monotonic: it preserves the ordering between medicines and compresses the mid-range; thus, entry into the upper band requires a high and consistent aggregated signal, reducing the risk of false positives at the high end. On this basis, the thresholds were set as follows: DRUID 3 equivalent for
For those active substances lacking an official DRUID classification, imputing a “neutral” value (e.g., 5/10) is not neutral in inferential terms because it introduces a systematic bias that can underestimate high-impact medicines by granting them an insufficient baseline signal or overestimating others with a benign profile by adding a baseline signal that does not exist. In this context, retaining the DRUID term with an imputed value degrades the construct validity of the metric and compromises its comparative fairness across the molecules.
To preserve model coherence and clinical interpretability, we adopted a “no-DRUID” variant that removed the term and redistributed its weight according to the structural principle of the scale: approximately 70% of the signal derived from intrinsic drug features and 30% from contextual modulators (patient or disease). In the absence of DRUID, the 70% intrinsic portion is split equally between the two blocks that continue to capture the intensity and breadth of pharmacological risk: adjusted ADRs by frequency and impact (35%) and the number of driving-relevant ADRs (35%). The three contextual modulators retained their original weights.
Reporting rules
For medicines with five years or less since the first marketing authorization, the FMB result is marked with an asterisk (*) to indicate that the set of ADRs may be incomplete and that the frequency of some ADRs remains uncertain.
The reporting of this study adheres to the transparent reporting of a multivariable prediction model for individual prognosis or diagnosis (TRIPOD) statement for the development and validation of multivariable prediction models. 21
The completed TRIPOD checklist is provided as Supplemental Table.
Results
Analyzed set and standardization of conditions
Nine active substances with well-characterized driving risk profiles were evaluated. All included substances already had an assigned DRUID category, which allowed us to assess the qualitative concordance of the proposed scale and, at the same time, to estimate its discriminative capacity within each category. To avoid interpersonal biases and ensure comparability, the three contextual domains (30% of the index) were fixed uniformly across all comparisons: maximum marketed dose (10/10), stable chronic treatment phase (0/10), and highest-impact dosage form marketed for each active substance. Thus, differences in the scores mainly reflect the intrinsic components of the drug (DRUID, adjusted ADRs, and number of ADRs).
Overall description and concordance with DRUID
The results for the analyzed medicines are presented in Table 10. The
Results by medicine (ordered by

This table was developed by the authors for the present study.
DRUID, Driving under the Influence of Drugs, Alcohol, and Medicines.
Intraband discrimination
Within the DRUID-3 equivalent band, the scale ranks mirtazapine (2.899) ≈ diazepam (2.879) > fentanyl (2.764), adding granularity where DRUID is categorical. In DRUID-2, duloxetine (2.336) was closer to the upper threshold than methyldopa (2.189). Among the low-risk medicines, amantadine (1.853) clearly exceeded omeprazole (1.381). In DRUID-0, simvastatin (0.968) was very close to the 1.0 cut-off, whereas paracetamol (0.388) remained well below it; these nuances are useful for clinical prioritization.
The FMB scale reproduces the qualitative DRUID classification in all cases and adds continuous resolution within each category, enabling the prioritization of higher-risk medicines and identification of situations near thresholds that warrant finer clinical appraisal.
External validation for unevaluated active substances
To estimate the scale’s generalizability beyond the calibration set, we applied the no-DRUID version of the index (described in the “Methods” section) to four active substances without an official classification. To minimize contextual variability and focus on the drug’s intrinsic signal, all were assessed under standardized conditions: maximum marketed strength (10/10), stable chronic phase (0/10), and highest-impact marketed dosage form (10/10). The results for the unevaluated active substances are summarized in Table 11.
Results by medicine (ordered by FMBfinal

This table was developed by the authors for the present study.
DRUID, Driving under the Influence of Drugs, Alcohol, and Medicines.
Esketamine, the enantiomer of ketamine with N-methyl
Tetrabenazine, a vesicular monoamine transporter 2 inhibitor indicated for chorea, causes drowsiness, fatigue, hypotension, and extrapyramidal symptoms such as parkinsonism or psychomotor slowing, all of which are pertinent to driving. Although the average intensity of several ADRs is lower than that of esketamine, the concurrence and diversity of relevant effects sustain a moderate risk, which our scale consistently places in band 2. This intermediate position reflects a profile that is less extreme than potent hypnotics and sedatives but clearly higher than that of medicines with minimal psychomotor interference.
Loxapine is a dopaminergic antagonist with sedation and dizziness as dominant ADRs and an intermediate overall burden of ADRs. The adjusted ADR signal and the number of ADRs placed the compound under mild influence (band 1), consistent with exercising caution at initiation or dose adjustment and the absence of a severe signal under stable conditions.
Citicoline is an endogenous prodrug that acts as a neuromodulator in mild cognitive disorders. In addition to promoting neuronal membrane synthesis, it modulates dopaminergic and noradrenergic pathways, which may translate into slight improvement in alertness. The most frequently described ADRs were headache, insomnia or nervousness, and gastrointestinal discomfort. In terms of fitness to drive, the intrinsic impact is low under stable conditions, consistent with our metric. During isolated symptomatic episodes (e.g., dizziness or insomnia), driving should be postponed until resolution; this does not alter the drug’s low baseline classification on the scale.
Discussion
This study proposes and tests a continuous, multifactorial metric—the FMB scale—to estimate the impact of medications on driving fitness. In the reference set, the scale reproduced the qualitative DRUID classification 22 for all active substances analyzed and added resolution within each category: it consistently ordered medicines in the DRUID-3 equivalent band (mirtazapine ≈ diazepam > fentanyl) and discriminated nuances in DRUID-2 and DRUID-1 that the ordinal scale does not distinguish. This complete band-level concordance (9/9), together with intraband granularity, supports the construct validity of the proposal. This pattern is consistent with the available epidemiological evidence, which shows an increased crash risk associated with the use of benzodiazepines and hypnotics, particularly during the initial phases of treatment or at higher doses, and identifies these groups as psychotropic medications with the greatest adverse impact on driving performance.23–25
The added value of the FMB is twofold. First, it integrates heterogeneous information (DRUID category; driving-relevant ADRs by frequency and severity; number of ADRs; dose; treatment phase; and dosage form) into a single index on an explicit normalization basis (0–1) with pre-specified weights, facilitating inter-rater reliability. Second, it formally manages uncertainty when ADR frequency is unknown, via compression of the aggregate weight and a prudent, adaptive “effective frequency.” This avoids the two biases described in the study (dilution when unknowns are abundant and overestimation when most evidence is uncertain) while preserving the clinical logic of “frequency × hazard.” By turning the underlying concept of medicine-related driving risk into a continuous index grounded in multiple criteria—the DRUID category, the quantitative structure of driving-relevant ADRs, and a small set of straightforward but clinically meaningful modulators (dose, pharmaceutical form, and treatment phase)—the FMB scale addresses the long-standing limitations of DRUID and other international classification schemes. These systems rely on qualitative ordinal categories, lack explicit weighting rules, and cannot accommodate presentation- or dose-dependent variability. In contrast, the multicriteria architecture of the FMB provides intraclass discrimination and integrates contextual variability in a reproducible and structured manner. To our knowledge, this makes the FMB the first continuous, weighted, multicriteria model for medicines, and fitness to drive, representing a substantial methodological advance over existing frameworks.
Operationally, the scale was designed to coexist with DRUID and improve its clinical applicability. To minimize contextual bias and evaluate the intrinsic drug signal, comparative analyses were conducted under standardized conditions: maximum marketed strength, stable chronic phase, and highest-impact marketed dosage forms. Thus, the observed differences chiefly reflect medicine-level components rather than patient or use-context factors. This methodological decision strengthens the comparability and traceability of the results. These considerations align with recent pharmacotherapeutic evaluations from regional safety agencies, which underscore that the DRUID characterization of medicines with a potential impact on driving frequently remains predominantly qualitative and may vary according to dose, route of administration, or formulation, introducing meaningful discrepancies in how risk is interpreted. 26
In addition to the European DRUID framework, several international systems have attempted to classify driving-impairing medicines, including pictogram-based approaches (e.g., France), fixed warning categories (e.g., Australia and New Zealand), and guideline-driven clinical advisories adopted in North America. However, as highlighted in the scoping review “Categorization and labeling systems concerning driving-impairing medicines,” 27 these schemes differ substantially in terms of methodology, evidence base, clinical granularity, and operational consistency. Most rely on broad qualitative categories, lack explicit weighting rules, and do not integrate dose- or formulation-dependent variability, leading to heterogeneous risk communications and limited comparability across settings. Positioning the FMB scale within this international context underscores its methodological distinctiveness.
External validation of actives without an assigned DRUID category suggests generalizability by therapeutic class. The hierarchy is consistent with the pharmacology and expected ADRs of each compound and supports the use of FMB as a continuous signal when the DRUID label is unavailable.
The proposal is transparent (explicit extraction rules, scales, and weights), reproduces DRUID in its qualitative reading, and adds a clinically interpretable continuous resolution. Correction for missing data (unknown-frequency ADRs) is formalized and parameterized, avoiding ad hoc rules and facilitating audits. By design, the nonlinear transformation of the global metric prioritizes specificity at the high end (entry into DRUID-3 equivalence), in alignment with the principle of clinical prudence.
The FMB scale can add value in within-class selection (prioritizing by road-safety profile), prescribing, and e-prescribing or decision-support systems. Its continuous nature helps identify medicines “near threshold” that merit additional monitoring or education beyond the aggregate DRUID category. From a clinical perspective, a continuous and weighted metric allows more refined decisions than ordinal systems. Two medicines with the same DRUID category may differ substantially in their FMB scores, enabling clinicians to select safer alternatives within a therapeutic class, adjust monitoring intensity, or reinforce driving-related counseling during initiation or dose escalation. In electronic prescribing environments, a continuous index can support graduated warnings rather than binary alerts, thereby reducing alert fatigue and providing more actionable information. Similarly, pharmacy and primary care safety protocols could use this metric to flag near-threshold cases, aligning the level of monitoring with the magnitude of the estimated risk. From a policy and systems perspective, the explicit structure of the scale—its visible parameters, reproducible scoring rules, and standardized calculation—enhances its transparency and auditability. This facilitates its integration into national or international medication safety programs and supports harmonization across healthcare settings by providing a consistent and comparable risk signal.
Future work should include: (i) expanding the corpus of medicines and presentations; (ii) assessing inter-rater reliability in extracting driving-relevant ADRs; (iii) prospective validation against objective measures and, where feasible, crash-related indicators; (iv) exploring thresholds and weights by therapeutic class; and (v) developing a personalization layer that incorporates additional patient modulators.
Looking ahead, research efforts should also focus on strengthening the dynamic and real-world applicability of the FMB scale. Priority areas include establishing links with large crash and insurance databases to quantify its predictive performance in operational settings, developing dedicated driving simulator paradigms capable of characterizing short-term trajectories of impairment, and implementing periodic recalibration cycles informed by evolving pharmacovigilance evidence.
Equally relevant is the exploration of pathways for translating the FMB framework into digital health tools, particularly its integration into government-promoted or endorsed health applications. Embedding the scale within such platforms would enable the generation of personalized patient alerts when driving ability may be compromised as a consequence of pharmacological treatment, thereby supporting more informed decision-making and enhancing patient awareness of treatment-related driving risk.
In parallel, the development of more sophisticated personalization layers capable of integrating patient-specific modulators, such as comorbidity profiles, polypharmacy patterns, sleep quality, or alcohol use, would allow for individualized risk estimation and more precise driving-related counseling. Taken together, these efforts would consolidate the FMB framework as a robust, adaptive, and clinically actionable tool for assessing medication-related driving risks, with a clear potential impact on both clinical practice and public health policy.
Limitations
The study relied on regulatory and pharmacovigilance sources—the SmPCs of marketed medicines—whose granularity and updating may vary by active substance and presentation. Although domain weights were defined by expert consensus, they have not yet been recalibrated against hard outcomes (e.g., crash risk or driving simulator performance), and external validation, while informative, is still limited in the number of compounds.
In addition, the standardization of conditions (maximum dose, highest-impact dosage form) favors comparability but may over-represent the risk in routine practice scenarios with conservative titrations. Finally, the index does not incorporate individual modulators, such as age, comorbidity, alcohol consumption, or sleep deprivation, whose integration is a natural line of model evolution.
There is also a limitation regarding ADR coverage in recently marketed drugs. For drugs with a marketing authorization of five years or less, it is plausible that the safety profile is not fully characterized and that ADRs remain undescribed or of indeterminate frequency. To avoid a false sense of precision and reflect this uncertainty, the FMB index results for these medicines are presented with an asterisk (*). This mark indicates that pharmacovigilance evidence is still being consolidated; accordingly, the estimated risk of driving should be interpreted with heightened caution, and re-evaluation should be prioritized as SmPCs and safety databases are updated.
Conclusion
A continuous, standardized, and weighted metric, such as the FMB, can preserve DRUID’s qualitative reading of the DRUID while adding clinical granularity where the ordinal scale cannot capture it. The explicit incorporation of ADR information—with a formal correction for uncertainty in frequencies—and simple, use-related modulators (dose, phase, and dosage form) yields a stable, reproducible, and clinically interpretable signal. In the analyzed set, band-level concordance with DRUID was complete, and external validation of active substances without an official category showed results consistent with their pharmacological and safety profiles, suggesting generalizability. These findings support the use of FMB as an operational complement to or replacement for DRUID in clinical practice and as a basis for decision-support systems and health education. The priority now is prospective validation against objective outcomes and the progressive incorporation of individual modulators to refine risk estimation at the patient level.
Supplemental Material
sj-docx-1-taw-10.1177_20420986261430228 – Supplemental material for The FMB scale: a multifactorial metric to assess the driving hazard of medicines beyond the DRUID system
Supplemental material, sj-docx-1-taw-10.1177_20420986261430228 for The FMB scale: a multifactorial metric to assess the driving hazard of medicines beyond the DRUID system by Salvador Borja Ripoll, Vicente Traver, Lola Franco, Teresa Ballester, Úrsula Alvado, Rosa Soriano, Pablo Garate and Ferran Mocholí in Therapeutic Advances in Drug Safety
Footnotes
Acknowledgements
With gratitude and dedication to Ferran Mocholí Belenguer. Thank you for being the origin of this research; your ingenuity, guidance, and passion continue to inspire us.
Declarations
Supplemental material
Supplemental material for this article is available online.
References
Supplementary Material
Please find the following supplemental material available below.
For Open Access articles published under a Creative Commons License, all supplemental material carries the same license as the article it is associated with.
For non-Open Access articles published, all supplemental material carries a non-exclusive license, and permission requests for re-use of supplemental material or any part of supplemental material shall be sent directly to the copyright owner as specified in the copyright notice associated with the article.