
Abstract
Background:
Adverse drug reactions (ADRs) are a leading cause of morbidity and mortality worldwide. Despite advances in pharmacovigilance, population-level evidence on long-term trends and disparities in ADR-related mortality in the United States remains limited.
Objectives:
This study aimed to characterize national temporal trends and demographic, geographic, and drug-class disparities in ADR-related mortality.
Design:
Population-based, cross-sectional analysis of US death certificate data using age-adjusted mortality rates (AAMRs) and log-linear estimated annual percentage changes (EAPCs) to assess temporal trends.
Methods:
ADR-related deaths were identified using International Classification of Diseases, Tenth Revision (ICD-10) codes Y40–Y59. AAMRs and EAPCs were calculated to assess temporal trends. Frontier analysis evaluated the relationship between AAMR and the Socio-Demographic Index (SDI) across states, and the leading drug categories contributing to ADR-related deaths were identified.
Results:
A total of 8425 ADR-related deaths were recorded over the study period. The national AAMR increased from 0.086 per 100,000 in 1999 to 0.140 in 2020 (EAPC: 1.49). Men, older adults, Black individuals, and rural residents experienced disproportionately high AAMRs. The West and Midwest regions exhibited steeper increases than other regions. Frontier analysis identified high-SDI states performing comparatively better. Among specific drug classes, anticoagulants were the leading contributors to ADR-related deaths, followed by immunosuppressive agents, antineoplastic drugs, and opioids.
Conclusion:
ADR-related mortality in the United States rose steadily, with pronounced disparities by sex, age, race, geography, and rurality. These findings should be interpreted with caution, given the observational study design and reliance on death certificate-based data.
Plain language summary
Introduction
Adverse drug reactions (ADRs) are a leading cause of morbidity and mortality worldwide, posing significant challenges to patient safety, healthcare systems, and socioeconomic well-being. 1 In developed countries, ADRs rank among the top ten causes of death, with direct healthcare costs between 37.6 and 50 billion dollars annually in the United States alone. 2 These events encompass predictable side effects and preventable injuries arising from medication errors. 3 As new therapeutics emerge and clinical regimens become increasingly complex, identifying and managing ADR risks is critical. Severe drug-induced outcomes, including heart failure, serious skin reactions, liver injury, and anaphylactic shock, have prompted regulatory authorities to strengthen post-marketing surveillance through mandatory phase IV trials and black box warnings.4,5 Despite advances in pharmacovigilance and safer prescribing practices, ADR-related mortality remains a persistent challenge, particularly among vulnerable populations.
The burden of ADRs is not uniform across populations. Prior studies have highlighted disparities in drug safety outcomes based on age, sex, ethnicity, and comorbidities.6–8 Structural and environmental factors, including healthcare access, socioeconomic status, and regional differences, also influence the risk of adverse outcomes and the timeliness of management. 9 Geographic disparities between urban and rural populations have been noted for multiple health outcomes, including cancer survival and chronic disease management.4,10 However, whether such disparities extend to ADR-related mortality remains unclear.
National mortality patterns are commonly examined using the Centers for Disease Control and Prevention Wide-ranging Online Data for Epidemiologic Research (CDC WONDER) database, 11 which provides comprehensive data derived from US death certificates coded using the International Classification of Diseases, Tenth Revision (ICD-10). For ADR-related mortality, ICD-10 codes capture medicaments and biological substances causing adverse effects during therapeutic use. CDC WONDER facilitates systematic assessment of temporal trends, offering a robust platform for population-level analyses. 12
Despite the substantial and persistent burden of ADR-related mortality and growing concerns regarding health inequities, population-level evidence describing disparities and long-term trends remains insufficient. Previous studies have largely focused on specific clinical settings or selected populations, limiting broader understanding at the national level. Therefore, this study aimed to evaluate temporal trends in drug-related adverse reaction mortality in the United States from 1999 to 2020, and to identify the drug classes most frequently implicated, providing insights to guide targeted strategies to prevent ADR-related deaths.
Methods
Study design and data source
We conducted a cross-sectional study using mortality data obtained from the CDC WONDER platform (https://wonder.cdc.gov). Our inclusion criteria were: (1) we utilized the Underlying Cause of Death files derived from US death certificates. (2) Drug-related adverse reactions were identified using the ICD-10 codes Y40–Y59, representing “drugs, medicaments, and biological substances causing adverse effects in therapeutic use.” All ADR-related ICD-10 codes within the Y40–Y59 range were listed in Supplemental Table 1. (3) The study population included all US residents with deaths occurring between January 1, 1999 and December 31, 2020. Data were extracted from the CDC WONDER system between September 10 and September 15, 2025. Exclusion criteria were: deaths were excluded if ADR-related ICD-10 codes were not present, if records contained missing or suppressed information for key variables (such as age or sex), or if the number of deaths in a given stratum was fewer than 20, consistent with CDC WONDER data suppression rules. This study was reported in accordance with the Strengthening the Reporting of Observational Studies in Epidemiology (STROBE) guidelines for observational studies (Supplemental Table 2). 13
Data extraction and variables
Mortality data were extracted for the total population and stratified by sex, race/ethnicity, 10-year age categories, US Census region (Northeast, Midwest, South, and West), and urbanization level (metropolitan vs non-metropolitan), state of residence, and place of death. Race and ethnicity were generally reported by funeral directors based on next-of-kin input. Urban–rural status followed the 2013 National Center for Health Statistics (NCHS) Urban–Rural Classification Scheme, defining counties with populations ⩾50,000 as metropolitan (urban) and all others as non-metropolitan (rural). Consistent with CDC WONDER protocols, cells with fewer than 20 deaths were suppressed to avoid unstable rate estimates.
Statistical analysis
Annual death counts and population denominators were obtained directly from CDC WONDER. Age-adjusted mortality rates (AAMRs) per 100,000 population were computed using the direct method with the 2000 US standard population as reference. Ninety-five percent confidence intervals (CIs) were estimated assuming a Poisson distribution. Temporal trends were assessed using the estimated annual percentage change (EAPC) derived from log-linear regression of ln(AAMR) against calendar year:

where b is the regression coefficient. Positive EAPC indicates an upward trend, negative EAPC indicates a downward trend, and an EAPC that is not significantly different from zero indicates a stable trend.
Frontier analysis was applied to describe heterogeneity in AAMR across states in relation to sociodemographic development. To allow for a potentially nonlinear frontier, the estimated frontier was interpreted as representing the lowest achievable AAMR conditional on sociodemographic status, reflecting the possibility that the minimum attainable mortality burden may vary nonlinearly across levels of the Socio-Demographic Index (SDI). By comparing each state against this development-adjusted frontier, which represents comparatively lower mortality levels under similar SDI conditions, the analysis enables the identification of states performing closer to the lower boundary of AAMR. The SDI, developed within the Global Burden of Disease framework, is a summary indicator designed to characterize regional socioeconomic development. It combines information on income per capita, educational attainment, and fertility rates into a normalized metric ranging from 0 to 1. 14 A stochastic frontier model was applied:

where yi denotes the AAMR for states i, SDIi is the sociodemographic index, α and β are regression coefficients, vi is a two-sided random error term, and ui is a non-negative term representing technical inefficiency.
Subgroup-specific analyses were conducted by sex, race/ethnicity, age group, census region, urbanization level, and state. All analyses and data visualizations were performed using R software (version 4.2.0; Free Software Foundation, Boston, USA).
Results
Overall trends
From 1999 to 2020, 8425 deaths were attributed to ADRs in the United States, corresponding to an overall AAMR of 0.120 per 100,000 (95% CI: 0.117–0.123). The AAMR increased from 0.086 (95% CI: 0.074–0.098) in 1999 to 0.140 (95% CI: 0.127–0.153) in 2020, with an EAPC of 1.49% (95% CI: 0.780–2.200), indicating a sustained upward trend. Age-stratified analysis showed that mortality rose sharply with age, peaking in the oldest groups (Table 1).
Age-adjusted mortality rates and temporal trends of drug-related adverse event deaths in the United States, 1999–2020.

AAMR, age-adjusted mortality rate; EAPC, estimated annual percentage change.
Age-specific trends
Age-specific analyses showed higher ADR-related mortality rates in older age groups. As shown in Figure 1(a), mortality rates increased steeply with advancing age, with individuals aged ⩾65 years—particularly those ⩾85 years—contributing the majority of ADR-related deaths. Both males and females exhibited this age-dependent escalation. Temporal patterns in Figure 1(b) revealed that, from 1999 to 2020, the proportional contribution of younger age groups (<45 years) remained consistently low, while deaths among adults aged ⩾65 years dominated the overall mortality burden. Notably, the ⩾85-year group accounted for the largest and steadily increasing share of ADR-related deaths over time.

ADR-related age-specific mortality rates in the United States, 1999–2020. (a) Age- and sex-specific mortality rates of ADR-related deaths; (b) Temporal trends in the age distribution of ADR-related mortality.
Sex-specific trends
Men consistently exhibited higher AAMRs than women, with rates increasing from 0.093 (95% CI: 0.075–0.111) in 1999 to 0.151 (95% CI: 0.132–0.170) in 2020 (EAPC: 2.05%; 95% CI: 1.410–2.700). Female rates rose from 0.078 (95% CI: 0.062–0.094) to 0.118 (95% CI: 0.103–0.133; EAPC: 1.62%; 95% CI: 0.390–2.870). Although both sexes showed parallel upward trajectories, the mortality gap slightly widened over time (Figure 2).
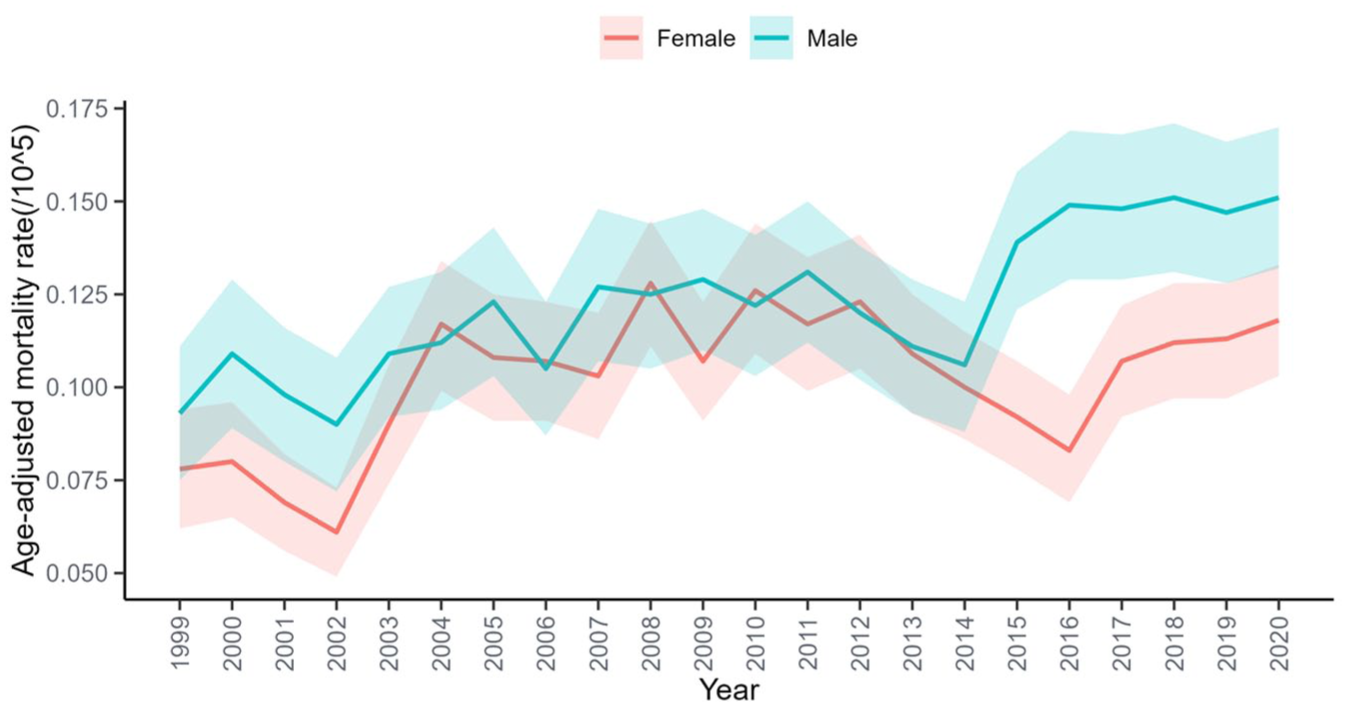
ADR-related AAMR per 100,000 among individuals stratified by sex in the United States, 1999–2020.
Racial disparities
Black or African American individuals had the highest mortality burden, with AAMRs increasing from 0.114 (95% CI: 0.077–0.163) to 0.201 (95% CI: 0.161–0.248). Non-Hispanic (NH) Whites accounted for most deaths (n = 6995) and showed an increase from 0.073 (95% CI: 0.061–0.084) to 0.127 (95% CI: 0.114–0.139; EAPC: 1.76%; 95% CI: 0.846–2.687). Asian or Pacific Islanders had the lowest mortality (overall AAMR: 0.042; 95% CI: 0.034–0.049), while data for American Indian or Alaska Natives were limited. Racial gaps in ADE-related mortality persisted across the study period (Figure 3).
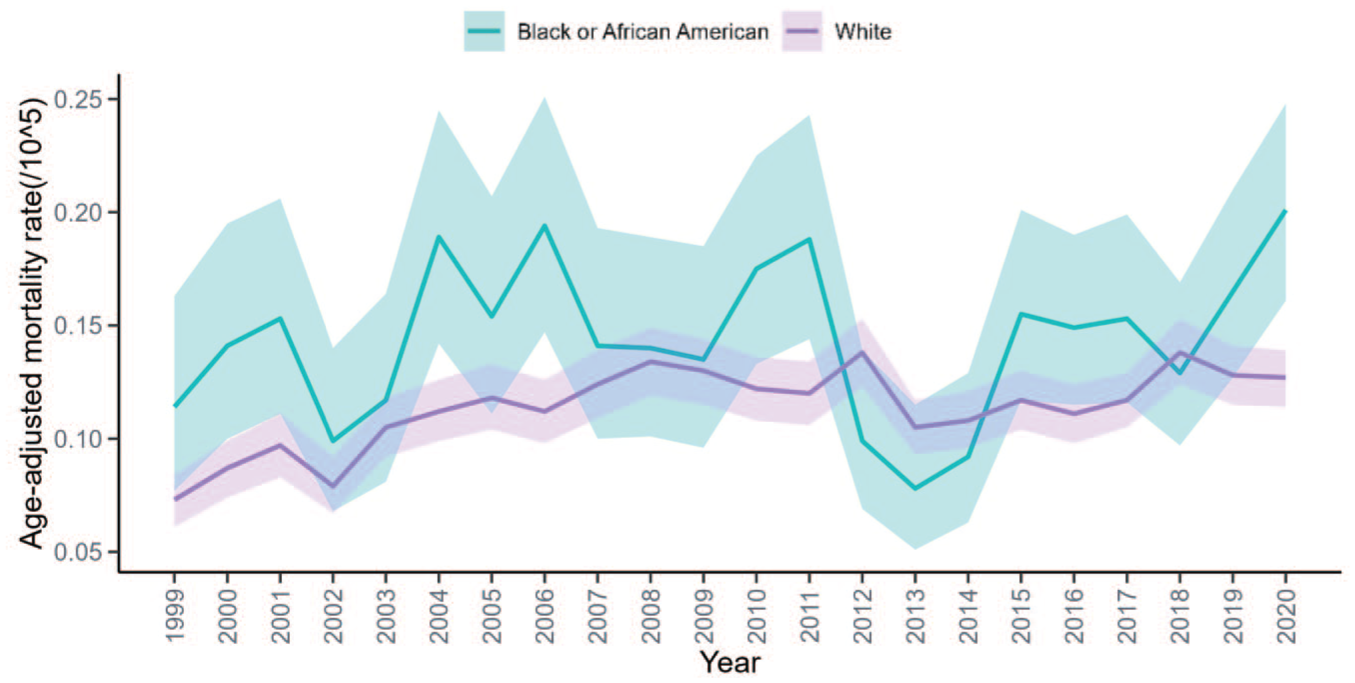
ADR-related AAMR per 100,000 among individuals stratified by race in the United States, 1999–2020.
Urban–rural disparities
Non-metropolitan (rural) areas consistently showed higher AAMRs than metropolitan (urban) areas. Rural rates nearly tripled, increasing from 0.066 (95% CI: 0.046–0.092) in 1999 to 0.188 (95% CI: 0.149–0.226) in 2020 (EAPC: 4.09%; 95% CI: 2.153–6.069). Conversely, urban AAMRs rose more modestly from 0.086 (95% CI: 0.073–0.100) to 0.125 (95% CI: 0.112–0.138; EAPC: 1.28%; 95% CI: 0.688–1.865; Figure 4).

ADR-related AAMR per 100,000 among individuals stratified by urban–rural status in the United States, 1999–2020.
Regional variation
The South reported the highest number of deaths (n = 3260), followed by the Midwest (n = 1915) and Northeast (n = 1672), while the West accounted for the lowest burden (n = 1578; Table 1). In terms of mortality rates, the Northeast (AAMR: 0.115 per 100,000; 95% CI: 0.110–0.121) and South (AAMR: 0.114; 95% CI: 0.110–0.118) showed higher values than the Midwest (AAMR: 0.109; 95% CI: 0.104–0.115) and West (AAMR: 0.095; 95% CI: 0.089–0.100). Temporal trends also varied: the West exhibited the most pronounced increase (EAPC = 2.67%, 95% CI: 1.507–3.851), followed by the Midwest (EAPC = 2.07%; 95% CI: 0.317–3.843), whereas the South showed a more modest rise (EAPC = 0.95%; 95% CI: −0.054 to 1.955). The Northeast displayed a moderate but statistically nonsignificant upward trend (EAPC = 1.49%; 95% CI: −0.168 to 3.170).
State-level variation
State-level heterogeneity was observed between 1999 and 2020 (Figure 5). States in the highest quintile of AAMR (0.18–0.40 per 100,000) were concentrated in North Dakota, Wyoming, Mississippi, Tennessee, Vermont, and New Jersey. These states consistently showed the greatest mortality burden. By contrast, states with the lowest AAMRs (0.06–0.09 per 100,000) were predominantly located in California, Wisconsin, Illinois, Florida, New York, and Hawaii. Notably, South Dakota reported fewer than 20 ADR-related deaths across the study period; following CDC WONDER guidance, such rates are considered statistically unreliable and are excluded from Figure 5.

State-level map of ADR-related AAMR per 100,000 among individuals in the United States, 1999–2020.
An inverse relationship between SDI and AAMR was evident, with high-SDI states clustering at lower ADR-related mortality and many lower-SDI states exhibiting elevated rates (Figure S1). Outliers included New Jersey, Massachusetts, and Pennsylvania, which exhibited disproportionately high AAMRs relative to SDI. Conversely, California, Texas, and Florida exhibited lower AAMRs than expected for their SDI levels.
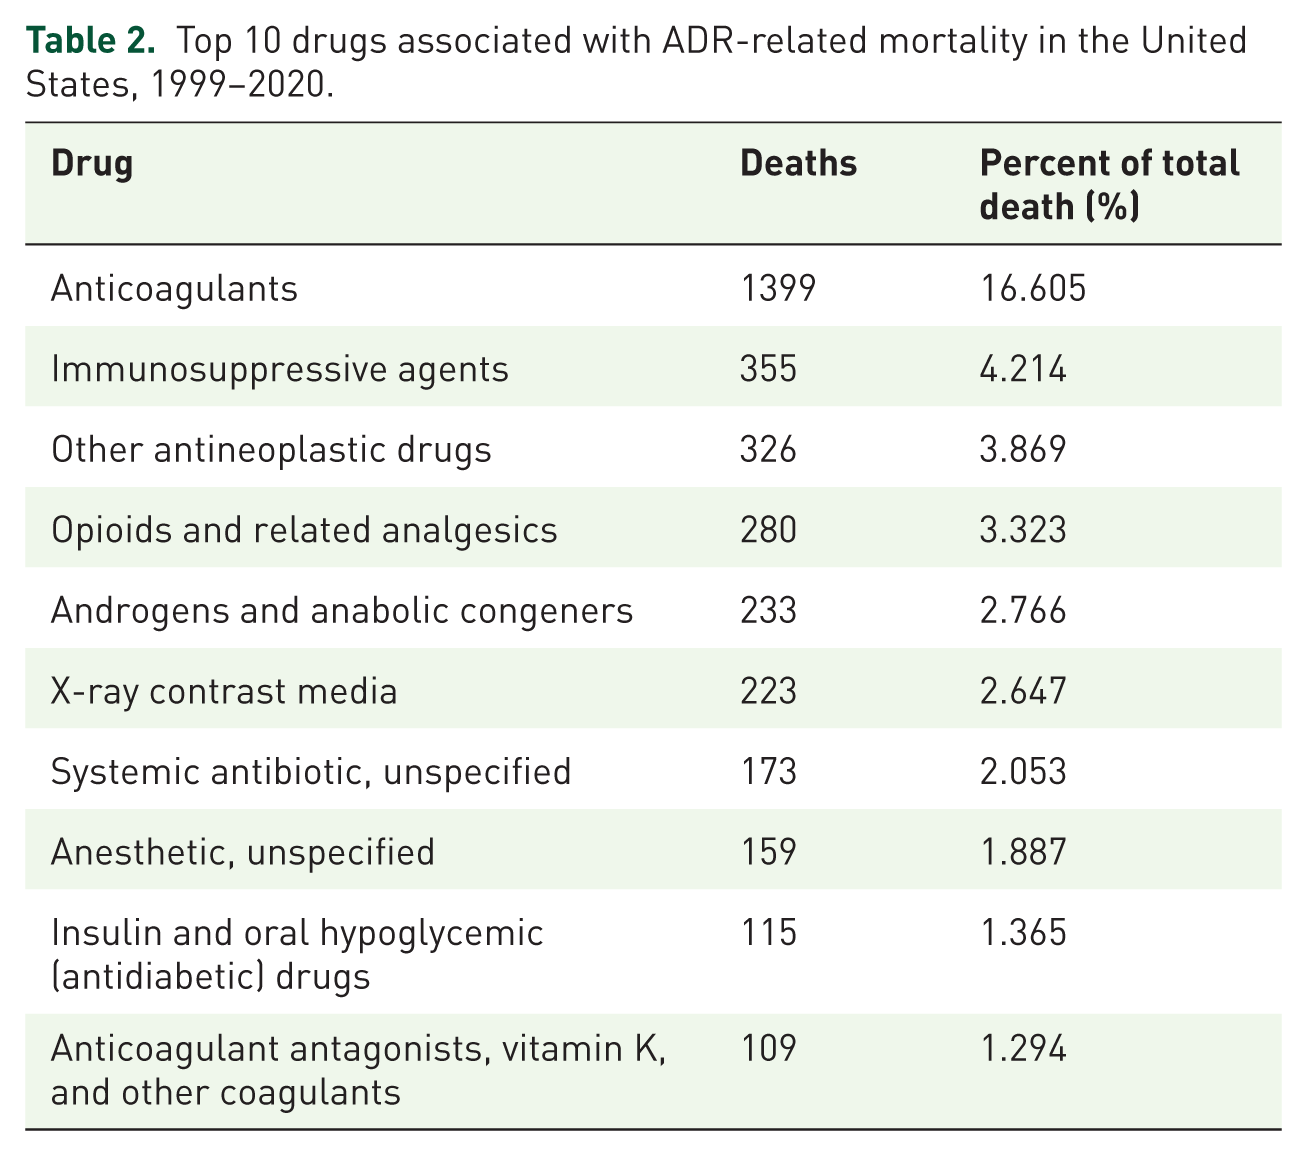
Drug-specific mortality
Among ADR-related deaths, a substantial proportion was coded as Y57.9 (drug or medicament, unspecified), accounting for 40.985% of cases, reflecting limited drug-specific information recorded on death certificates. Among deaths with identifiable drug categories, anticoagulants were the leading contributors to ADE-related mortality (n = 1399; 16.6%), followed by immunosuppressants (4.2%), antineoplastic drugs (3.9%), and opioids or related analgesics (3.3%). Smaller contributions were from androgens/anabolic congeners (2.8%), X-ray contrast media (2.6%), systemic antibiotics (2.1%), anesthetics (1.9%), and antidiabetic agents (1.4%). These findings highlight anticoagulants as a primary target for preventive strategies (Table 2).
Top 10 drugs associated with ADR-related mortality in the United States, 1999–2020.
Discussion
ADRs represent a substantial public health burden in the United States, affecting hundreds of thousands annually and generating tens of billions of dollars in economic costs. 1 This national analysis demonstrated a steady increase in ADR-related mortality from 1999 to 2020. Men, Black individuals, older adults, and rural residents consistently exhibited higher AAMRs. The West and Midwest experienced steeper increases than other regions, and several states (such as North Dakota, Wyoming, and Mississippi) exhibited elevated AAMRs. In contrast, large states such as California, New York, and Texas maintained relatively low rates. Frontier analysis revealed that high-SDI states such as New Jersey, Massachusetts, and Pennsylvania performed worse than expected, whereas California, Texas, and Florida outperformed their SDI levels. By drug class, anticoagulants were the leading contributors to ADR-related deaths, followed by immunosuppressants, antineoplastic agents, and opioids.
Several categories of ADRs are most frequently implicated in drug-related mortality. Previous population-based studies have reported that anaphylaxis—a rapid-onset, potentially fatal ADR—remains a leading cause of drug-related deaths, accounting for 58.8% of all deadly anaphylaxis cases between 1999 and 2010. 15 Beyond acute allergic reactions, other serious ADRs also pose considerable mortality risks. Severe cutaneous adverse reactions, including Stevens–Johnson syndrome (SJS) and toxic epidermal necrolysis (TEN), though rare, are frequently lethal, with mortality rates of 19.4% for SJS/TEN overlap and 14.8% for TEN in US adults. 16 Drug-induced liver injury (DILI) is another significant cause, with nearly 10% of patients dying or requiring liver transplantation within 6 months of onset in an extensive prospective study. 17 Together, these findings underscore the substantial and multifaceted mortality burden of ADRs. Therefore, early identification and treatment of these ADRs can minimize the occurrence of fatalities.
The fatal risk of ADRs varies across racial and ethnic groups. In a multiethnic cohort receiving anthracycline-based chemotherapy, cardiotoxicity risk was significantly higher among NH Black, Hispanic, and Asian patients than among NH White patients. 6 Similarly, a prospective study reported more severe DILI among African Americans than Whites, with higher hospitalization rates (76.7% vs 57.6%) and greater risk of death or liver transplantation within 6 months (10.2% vs 5.8%). 18 These findings, consistent with our results, suggest that genetic or environmental factors may contribute to racial differences in ADR-related mortality. 19
Advanced age is another significant risk factor. Age-related decline in organ function and polypharmacy increase susceptibility to life-threatening ADRs. Our data show a rise in ADR-related mortality with age. Epidemiological studies confirm that older adults are at higher risk for fatal drug-induced anaphylaxis. 7 Among men with nonmetastatic castration-resistant prostate cancer, those ⩾80 years experienced a higher incidence of grade ⩾3 adverse events with second-generation androgen receptor inhibitors compared with younger patients (55% vs 44%). 20 Outcomes for SJS/TEN are also poorer in older adults, and age ⩾50 years is an independent predictor of in-hospital mortality in the ABCD-10 prognostic model. 21 These observations emphasize the need for age-specific risk assessment and cautious drug prescribing in older adults.
Sex differences influence both the risk and clinical presentation of ADRs, although the mechanisms remain incompletely understood. An analysis of clofazimine-related ADRs demonstrated significant sex-specific differences in adverse event signals, suggesting the need to incorporate sex-based risk considerations in clinical decision-making. 8 In children, the sex distribution of severe anaphylaxis varies with age: boys predominate among those younger than 13 years, whereas girls predominate in adolescents ⩾13 years. 22 These differences may reflect sex-specific immune responses, hormonal influences, and behavioral exposures. Variations in drug distribution and clearance between sexes also merit further investigation to enable more precise sex-specific risk assessment and management of ADRs.
Interactions between medical and social determinants shape drug-related mortality. Rönkä et al. reported a strong association between social disadvantage and drug-related deaths in Finland, with long- and short-term unemployment, and retirement identified as significant predictors. Drug-related deaths, including psychoactive substance use disorders and drug-induced poisonings, were threefold higher among socially disadvantaged individuals, underscoring the importance of socioeconomic factors in drug-related mortality. 23 These findings highlight the need for public health strategies that integrate medical and social interventions to reduce premature drug-related deaths, especially in vulnerable populations.
Several drug classes carry substantial risks of fatal ADRs, consistent with our finding that anticoagulants are the leading contributors to ADR-related deaths. Anticoagulant-associated bleeding remains a significant cause of preventable mortality, with risks heightened by drug–drug interactions (such as novel oral anticoagulants combined with diltiazem or verapamil) 24 and comorbidities such as chronic kidney disease, which impairs clearance. 25 Misuse of prescription anticoagulants has also been linked to drug-related deaths and overdoses in population studies, 26 emphasizing the need for cautious prescribing and patient education. Immune checkpoint inhibitors, widely used in advanced cancers, can induce immune-related adverse events (irAEs) that can be fatal, especially myocarditis. 27 Older patients (65–84 years) are at higher risk for irAEs, and the proportion of deaths from irAEs rises with age. 28 Opioids represent another critical contributor. In a cohort of >130,000 surgical inpatients, 10.6% experienced opioid-related ADEs, which were strongly associated with increased mortality (adjusted odds ratio 28.8), longer hospitalization, and higher costs. 29 The ongoing opioid crisis, driven by misuse of synthetic opioids such as fentanyl, has dramatically increased overdose deaths in the United States. 30 Coexisting chronic pain and depression may worsen outcomes in opioid use disorder, highlighting the need for integrated physical and mental health interventions. 31 Acetaminophen overdose is the leading cause of DILI and acute liver failure in the United States, with relevant mechanisms involving reactive metabolite (N-acetyl-p-benzoquinone imine, NAPQI) formation, oxidative stress, mitochondrial injury, and c-Jun N-terminal kinase (JNK) pathway activation. 32 N-acetylcysteine, administered within 16 h, remains the standard antidote to prevent death. 33
Limitations
Taken together, these findings should be interpreted as sentinel signals highlighting concerning patterns in ADR-related mortality across demographic and geographic groups in the United States. This study also has several limitations. First, it relied on the CDC WONDER database, which uses death certificate data and is subject to reporting or classification errors, including inaccuracies in cause of death, race/ethnicity, and residence. Although proportional changes and long-term temporal trends are likely to be robust, absolute estimates of ADR-related mortality may be influenced by secular increases in medication use over time and by changes in diagnostic awareness, coding practices, and reporting behavior. These limitations are inherent to population-level mortality datasets. Second, while we assessed temporal trends in ADR-related mortality across major demographic groups, cross-stratified analyses (such as age-specific trends within racial or sex groups, or across states) were not performed. Third, the database lacks granular socioeconomic information (income, education, and insurance status), limiting the assessment of these determinants in driving disparities. Fourth, suppressed estimates for groups or states with <20 deaths may have underestimated or destabilized rates, particularly for small-population states or minority groups (such as American Indian or Alaska Native populations). Fifth, interpretation of findings derived from CDC WONDER relies on adherence to publicly available documentation and standard practices; the absence of a team member with long-term, specialized experience in this database should be considered when interpreting the results. Lastly, urban–rural classification followed the NCHS Urban–Rural Classification Scheme, which may not fully represent the urban–suburban continuum, potentially limiting interpretation of urban–rural disparities.
Conclusion
ADR-related mortality in the United States rose steadily between 1999 and 2020, with pronounced disparities by sex, age, race, geography, and rurality. These findings highlight concerning patterns in ADR-related mortality and underscore the need for further investigation to better understand their underlying drivers.
Supplemental Material
sj-docx-1-taw-10.1177_20420986261421278 – Supplemental material for Disparities and trends in drug-related adverse reaction mortality in the United States, 1999–2020
Supplemental material, sj-docx-1-taw-10.1177_20420986261421278 for Disparities and trends in drug-related adverse reaction mortality in the United States, 1999–2020 by Liwei Guo and Xiuxun Dong in Therapeutic Advances in Drug Safety
Footnotes
Acknowledgements
We gratefully acknowledge Bullet Edits Limited for its assistance with the linguistic editing and proofreading of this manuscript.
Declarations
Supplemental material
Supplemental material for this article is available online.
Artificial intelligence assistance
Artificial intelligence (AI)-assisted tools were used only at the manuscript preparation stage to support language polishing and grammatical revision. All aspects of study design, data extraction, statistical analysis, and result interpretation were conducted independently by the authors without the involvement of AI-based systems.
References
Supplementary Material
Please find the following supplemental material available below.
For Open Access articles published under a Creative Commons License, all supplemental material carries the same license as the article it is associated with.
For non-Open Access articles published, all supplemental material carries a non-exclusive license, and permission requests for re-use of supplemental material or any part of supplemental material shall be sent directly to the copyright owner as specified in the copyright notice associated with the article.