
Abstract
Background:
While recipient cytochrome P450 (CYP) genetic polymorphisms are established modulators of tacrolimus (TAC) pharmacokinetics, the combined effects of donor-derived hepatic and recipient intestinal CYP3A4/5 and CYP2C19 genotypes during voriconazole (VRC)-mediated CYP3A inhibition remain inadequately elucidated in liver transplantation.
Objectives:
This study evaluated the impact of donor and recipient CYP3A4/5 and CYP2C19 polymorphisms on TAC pharmacokinetics during VRC co-therapy in liver transplant recipients.
Design:
A retrospective study was conducted on 139 liver transplant patients receiving TAC-based immunosuppressive therapy at the First Affiliated Hospital of Sun Yat-sen University from December 2016 to June 2025.
Methods:
The liver transplant recipients were stratified into a VRC co-therapy group (n = 33) and a non-VRC control group (n = 106). TAC dose-corrected trough concentrations (C0/D) were analyzed in relation to donor and recipient genotypes of CYP3A4*1G (rs2242480), CYP3A5*3 (rs776746), CYP2C19*2 (rs4244285), and CYP2C19*3 (rs4986893).
Results:
During VRC co-therapy, dual donor-recipient CYP3A4*1G CC carriers exhibited a 73% increase in TAC C0/D compared with TT/TC genotypes (6.83 vs 3.95, p = 0.0031). Recipients grafted from CYP3A5 non-expresser donors exhibited 34% higher TAC C0/D than those from CYP3A5 expressers (6.35 vs 4.75, p = 0.0196). Recipient CYP2C19 poor metabolizers demonstrated 36% elevated TAC C0/D compared to extensive or intermediate metabolizers (6.47 vs 4.76, p = 0.0401). The magnitude of TAC-VRC interaction was modulated by both donor and recipient genotypes. Comparing with the control group, VRC co-therapy increased TAC C0/D by 3.80- and 2.75-fold increases in CYP3A5 expresser and non-expresser recipients, respectively, and by 3.44- and 3.53-fold in recipients grafted from CYP3A5 expresser and non-expresser donors, respectively. Post-VRC discontinuation, TAC C0/D remained significantly elevated for 5 days before returning to baseline level by day 6 (p < 0.0001).
Conclusion:
In summary, Donor and recipient CYP3A4/5 and CYP2C19 genotypes jointly influence TAC pharmacokinetics during VRC co-therapy. Genotype-guided dosing strategies integrating both donor and recipient genotypes may improve TAC dosing precision. TAC dose reinstatement may be deferred until day six following VRC discontinuation to avoid overexposure.
Plain language summary
Why was the study done? For patients who have received a liver transplant, finding the right dose of the anti-rejection drug Tacrolimus (TAC) is crucial. Another drug, Voriconazole (VRC), used to prevent fungal infections, is known to strongly increase TAC levels in the blood, raising the risk of overexposure and toxicity. While a patient’s own genes can affect how they process drugs, the role of the donor’s liver genes in this specific drug interaction has been unclear.
What did the researchers do? The researchers followed 139 liver transplant patients receiving TAC (Of these, 33 patients also received VRC). They investigated how the genes involved in drug metabolism (CYP3A4, CYP3A5, and CYP2C19) of both the organ donor and the recipient influences TAC blood levels when the two drugs (TAC and VRC) are used together after a liver transplant.
What did the researchers find? When both the donor and the recipient carried a specific gene type (CYP3A4*1G CC), TAC levels were 73% higher compared to other gene combinations. Livers from donors with a CYP3A5*3 GG gene type led to 34% higher TAC levels in recipients than livers from donors with a CYP3A5*3 AA or CYP3A5*3 AG gene type. Recipients who were CYP2C19 poor metabolizers had 36% higher TAC levels than extensive or intermediate metabolizers. After VRC was discontinued, TAC levels remained significantly elevated for 5 days and returned to baseline by the 6th day.
What do the findings mean? Using genetic information from both the donor and the recipient could help doctors personalize TAC dosing more accurately when TAC and VRC are used together in liver transplant patients, improving safety and effectiveness. When stopping VRC therapy, it may be safer to wait until at least the 6th day before adjusting the TAC dose back up, to prevent accidental overexposure.
Keywords
Introduction
Liver transplantation is a life-saving intervention for patients with end-stage liver disease. 1 Long-term immunosuppressive therapy is essential after transplantation to prevent graft rejection and improve survival outcomes. 2 Tacrolimus (TAC), a first-line immunosuppressant for liver transplantation, exhibits a narrow therapeutic index and significant interpatient pharmacokinetic variability. 3 Standard initial TAC dose is 0.1–0.15 mg/kg/day when co-administered with mycophenolate and corticosteroids, and could be adjusted to maintain TAC C0 of 6–10 ng/mL during the first month after liver transplantation.4–6 Despite standardized dosing regimens, substantial interpatient differences in TAC trough concentrations may occur. Subtherapeutic TAC levels increase the risk of rejection, whereas supratherapeutic concentrations can lead to adverse effects that compromise patients’ quality of life. 3 Following oral administration, TAC is metabolized primarily by the cytochrome P450 3A (CYP3A) enzymes, particularly CYP3A4 and CYP3A5, in the liver and intestine.3,7 Notably, the genetic polymorphisms of CYP3A5 play a pivotal role in influencing TAC pharmacokinetics. 8 The CYP3A5*3 allele (6986A>G, rs776746) results in loss of CYP3A5 expression of the functional protein, which reduces TAC metabolism and consequently elevates TAC exposure. 8 For CYP3A5 expressers (CYP3A5*1 allele carriers), increasing the TAC starting dose to 1.5–2 times the standard dose is recommended. 8 The genetic variants of CYP3A4 are also correlated with TAC dosage-adjusted trough concentrations.9,10 For liver transplant recipients, the metabolic enzymes in the transplanted liver are encoded by the donor’s genome, while the intestinal enzyme genotypes reflect the recipient’s genetic makeup. Consequently, TAC metabolism in post-transplant patients may be jointly modulated by CYP3A4/5 polymorphisms in both the donor’s liver and the recipient’s intestine.11,12 Therefore, a comprehensive analysis of donor and recipient genotype pairs is essential for evaluating the impact of CYP3A4/5 polymorphisms on TAC pharmacokinetics in liver transplant patients. In addition to genetic variants, TAC trough concentrations could be modulated by several clinical factors such as age, hematocrit (HCT), albumin (ALB), and concomitant medications in transplant recipients.13–15
Fungal infections are common complications after liver transplantation and are one of the causes of graft dysfunction.16–18 Voriconazole (VRC), a triazole antifungal agent derived from fluconazole, is the first-line treatment for invasive aspergillosis, typically with a treatment duration of approximately 12 weeks following diagnosis.18–20 VRC is also commonly used for antifungal prophylaxis in transplant recipients at high risk for invasive aspergillosis during the early post-transplant period, with a course of 14–21 days.19,20 However, concomitant administration of VRC with TAC results in a marked elevation of TAC exposure,21–23 which is mediated by VRC-induced inhibition of CYP3A4 and CYP3A5 enzyme activities.24,25 VRC exhibits extensive extravascular distribution to the liver and small intestine following administration, and is metabolized by hepatic and intestinal CYP enzymes (especially CYP2C19).26–28 Particularly, VRC shows wide interpatient variability in trough concentrations due to CYP2C19 polymorphisms.29,30 Current prescribing information for TAC and VRC recommends reducing the TAC dose to one-third of the original dose upon initiation of co-therapy. However, studies indicate that VRC can increase TAC concentrations by more than fivefold, suggesting that the recommended dosage adjustment may not adequately address inter-individual variability.22,31–33 Genetic polymorphisms are likely a key factor modulating the magnitude of the interaction between TAC and VRC. 34
Studies have demonstrated that CYP3A4/5 and CYP2C19 polymorphisms significantly influence the interaction between TAC and VRC.31,35–37 Most research, however, focused on recipients’ genetic polymorphisms, with few studies examining the combined impact of donor and recipient genotypes. This is a critical issue for liver transplant patients, as the donor liver directly contributes to the metabolism of both TAC and VRC. Therefore, comprehensive consideration of both donor hepatic and recipient intestinal genotypes is imperative for optimizing TAC personalized dosing strategies. Furthermore, another underexplored aspect is the optimal timing of TAC dosage adjustments after VRC discontinuation, highlighting the need for further investigation. Hence, this study evaluated the combined effects of donor and recipient CYP3A4/5 and CYP2C19 polymorphisms on TAC pharmacokinetic variability during VRC co-administration in liver transplant recipients, providing a reference for genotype-based TAC dose adjustment following VRC co-therapy. We also characterized TAC concentration dynamics following VRC discontinuation and proposed recommendations for the timing of TAC dose adjustments. We hypothesized that both donor and recipient CYP3A4/5 and CYP2C19 polymorphisms exert influence on the drug–drug interaction between TAC and VRC in liver transplantation.
Methods
Study design, setting, and population
This is a single-center retrospective cohort study. This study was conducted on liver transplant patients receiving TAC (Prograf®; Astellas, Killorglin, Ireland; or Saifukai®; Huadong Medicine, Hangzhou, China) at the First Affiliated Hospital of Sun Yat-sen University in Guangzhou from December 2016 to June 2025. Patients who underwent liver transplantation at the Organ Transplant Center between December 2016 and January 2020 and met the inclusion criteria were included. The reporting of this study conforms to the Strengthening the Reporting of Observational Studies in Epidemiology (STROBE) statement (Supplemental Material 1). 38 Autonomous consent free from coercion was obtained from the donors or their next of kin, and the organs were not sourced from executed prisoners or prisoners of conscience. Patients were stratified into a VRC co-therapy group and a control group based on the use of VRC (VFEND®; Pfizer, New York, NY, USA) during TAC-based immunosuppressive therapy. Inclusion criteria for the VRC co-therapy group: (1) age ⩾18 years; (2) post-transplant treatment with TAC-based immunosuppressive therapy and regular monitoring of TAC blood concentrations; (3) concomitant use of VRC for at least 3 days; (4) both the recipient and the donor were genotyped. Inclusion criteria for the control group: (1) age ⩾18 years; (2) post-transplant treatment with TAC-based immunosuppressive therapy and regular monitoring of TAC blood concentrations; (3) both the recipient and the donor were genotyped. Exclusion criteria for the VRC co-therapy group: (1) combined organ transplantation; (2) co-administered with other medications known to significantly affect TAC metabolism (e.g., fluconazole, Wuzhi tablet, rifampin, or phenytoin sodium); (3) severe infections or graft rejection. Exclusion criteria for the control group: (1) combined organ transplantation; (2) co-administered with medications known to significantly affect TAC metabolism (e.g., VRC, fluconazole, Wuzhi tablet, rifampin, or phenytoin sodium); (3) severe infections or graft rejection.
Immunosuppression protocol and VRC treatment
Patients received a TAC-based triple immunosuppressive regimen with a mycophenolic acid drug (mycophenolate mofetil (MMF) or enteric-coated mycophenolate sodium (EC-MPS)) and methylprednisolone after liver transplantation. TAC was initiated at 0.05–0.15 mg/kg/day in two divided doses. MMF (CellCept®; Roche, Shanghai, China) was administered at 500–1000 mg twice daily, or EC-MPS (Myfortic®, Novartis Pharma Stein AG, Stein, Switzerland) was given at 360–720 mg twice daily. Methylprednisolone was administered intravenously at 500 mg once daily in the first 3 days post-transplantation and then switched to an oral formulation (Medrol®; Pfizer, New York, NY, USA) with an initial dose of 30 mg once daily and tapered to a maintenance dose of 5 mg once daily. VRC was administered at 200 mg twice daily, either as prophylaxis starting within the first 3 days post-transplantation for patients at high risk of invasive aspergillosis or as treatment upon diagnosis of invasive aspergillosis.
Data collection
Data were retrospectively collected from the hospital’s electronic medical records. Demographic, biochemical characteristics, and medication information of patients in both groups were collected, including gender, age, height, weight, days post-transplant, red blood cell count (RBC), hemoglobin (HGB), HCT, ALB, TAC trough concentration (C0), and corresponding dose (D) in the first month post-transplantation, as well as concomitant medications. For the VRC co-therapy group, the duration and dosage of VRC administration were also recorded. Measurement of TAC C0 was performed in the laboratory at the First Affiliated Hospital of Sun Yat-sen University. Two milliliters of peripheral venous blood were routinely collected from the recipients in the morning (prior to taking the next dose of TAC) following TAC administration, and the blood samples were placed in ethylene diamine tetra-acetic acid anticoagulant tubes. Whole blood concentrations of TAC were measured by the chemiluminescent particle immunoassay method using the ARCHITECT reagent kit (Abbott, Chicago, IL, USA). TAC C0 measurements of the recipients who received a consistent TAC dose for at least three consecutive days (reaching a steady state) were included in the analysis, and the dose-corrected trough concentration C0/D (ng/mL/mg) of TAC was calculated as TAC C0 in ng/mL divided by the weight-adjusted daily dose (mg). Baseline characteristics of the patients were compared between the two groups to assess potential sources of bias and are presented in Table 1.
Baseline characteristics of the liver transplant recipients.

Mean ± SDs.
Median (25th to 75th quartiles).
ALB, albumin; BMI, body mass index; Hb, hemoglobin; HBV, hepatitis B virus; HCT, hematocrit; RBC, red blood cell count; TAC, tacrolimus; VRC, voriconazole.
Genotype detection and analysis
Peripheral venous blood was collected from liver transplant recipients and their corresponding donors. Genomic DNA was extracted from the blood samples using the TIANGEN Blood Genome Extraction Kit (TIANGEN, Beijing, China), and genotyping was performed using the Illumina Asian Screening Array (ASA) single-nucleotide polymorphism (SNP) chip (Illumina, San Diego, CA, USA) at Capitalbio Co., Ltd in Wuhan, China in 2020. In brief, Illumina ASA SNP array probes were incubated with genomic DNA samples, which were subsequently scanned using the Illumina iScan system. The genetic analysis was conducted for CYP3A4*1G (20230G>A, rs2242480), CYP3A5*3 (6986A>G, rs776746), CYP2C19*2 (681G>A, rs4244285), and CYP2C19*3 (636G>A, rs4986893) variants in both the donors and recipients in the VRC co-therapy group, and for CYP3A4*1G and CYP3A5*3 in the control group. CYP3A5 expressers were defined as individuals carrying the *1/*1 (AA) or *1/*3 (AG) genotypes, while non-expressers were those with the *3/*3 (GG) genotype. Donors and recipients were stratified into three CYP2C19 metabolizer phenotypes based on genotype: extensive metabolizers (EMs, *1/*1), intermediate metabolizers (IMs, *1/*2 or *1/*3), and poor metabolizers (PMs, *2/*2, *2/*3, or *3/*3).
Statistical analysis
Statistical analysis was performed using IBM SPSS Statistics 25.0 (IBM Corp., Armonk, NY, USA), GraphPad Prism 8.0 software (GraphPad Software, San Diego, CA, USA), and Plink 1.90 (https://www.cog-genomics.org/plink/1.9/). The normality of the data was assessed by the Shapiro-Wilk test, and the homogeneity of variance was evaluated by Levene’s test. Quantitative data following a normal distribution were presented as mean ± standard deviation, while non-normally distributed quantitative data were expressed as median (25th to 75th quartiles), and qualitative data were reported as frequency (percentage). The chi-square test was employed for the comparison of qualitative data between groups. For continuous variables with normal distribution and homogeneity of variances, t test was used for comparisons between two independent groups, and the one-way analysis of variance (ANOVA) was applied for comparisons across multiple groups. For continuous variables not following a normal distribution, the non-parametric Mann-Whitney test was used for comparisons between two groups, and the non-parametric Kruskal-Wallis test was applied for comparisons across multiple groups. Dunn’s test was conducted for post hoc multiple comparisons. A p-value <0.05 was considered statistically significant. Hardy-Weinberg equilibrium (HWE) of the SNPs was assessed using Plink 1.90 software, with a p-value >0.05 indicating that the HWE was met.
Results
Patient characteristics
A total of 199 liver transplant patients receiving TAC with available genotyping data for both recipients and their donors were screened. Of these, 32 patients were excluded due to co‑administration of fluconazole or Wuzhi tablets, 27 were excluded due to the absence of steady‑state TAC C0 during the first month post‑transplantation, and one patient was excluded because of combined liver‑kidney transplantation. Ultimately, 139 patients were included in the study and divided into a VRC co-therapy group and a control group based on VRC co‑administration. The baseline characteristics of both groups are shown in Table 1. The VRC co-therapy group consisted of 33 patients with 62 TAC C0 measurements, while the control group comprised 106 patients with 354 TAC C0 measurements. The two groups showed no significant differences in recipients’ gender, age, BMI, laboratory parameters (RBC, Hb, HCT, and ALB), primary disease, CYP3A4/5 genotypes, or CYP2C19 phenotypes (p > 0.05). In the VRC co-therapy group, donor and recipient genotype distribution of CYP3A5 expressers were 63.6% and 54.5% respectively, with non-expressers accounting for 36.4% and 45.5%; donor and recipient CYP3A4 TT/TC frequencies were 41.4% and 48.4%, with CC at 58.6% and 51.6%; donor and recipient CYP2C19 EM/IM frequencies were 84.4% and 84.8%, with PM at 15.6% and 15.2%. In the control group, donor and recipient CYP3A5 expressers genotype distribution were 49.1% and 48.1%, with non-expressers at 50.9% and 51.9%; donor and recipient CYP3A4 TT/TC frequencies were 49.5% and 42.7%, with CC at 50.5% and 57.3%; donor and recipient CYP2C19 EM/IM frequencies were 82.7% and 83.7%, with PM at 17.3% and 16.3%. The allele distribution of CYP3A4, CYP3A5, and CYP2C19 was consistent with the HWE in both groups (p > 0.05).
Univariate analysis of the impact of donor or recipient CYP3A4, CYP3A5, or CYP2C19 genotypes on TAC C0 /D during VRC co-therapy
The variations in TAC C0/D between different donor/recipient CYP3A4, CYP3A5, or CYP2C19 genotypes in the VRC co-therapy group were analyzed to investigate the correlations between these genetic polymorphisms and TAC pharmacokinetics during VRC co-therapy. The results showed that donor and recipient CYP3A4*1G, donor CYP3A5*3, and recipient CYP2C19 genotypes were significantly associated with TAC C0/D (Table 2). Recipients carrying intestinal CYP3A4*1G CC genotype exhibited 33% higher TAC C0/D compared with recipients carrying TT/TC genotypes (5.73 vs 4.30, p = 0.0321; Table 2). Recipients receiving grafts from donors with CYP3A4*1G CC genotype showed 40% higher TAC C0/D than those receiving grafts from donors with CYP3A4*1G TT/TC genotypes (5.85 vs 4.18, p = 0.0118; Table 2). In terms of CYP3A5, recipients who were CYP3A5 non-expresser (GG) had no significant difference in TAC C0/D compared with those who were CYP3A5 expresser (AA/AG; 5.25 vs 4.76, p = 0.2084; Table 2). Patients receiving grafts from CYP3A5 non-expresser (GG) donors exhibited 34% higher TAC C0/D than those receiving grafts from CYP3A5 expresser (AA/AG) donors (6.35 vs 4.75, p = 0.0196; Table 2). In addition, recipients categorized as CYP2C19 PM displayed 36% higher TAC C0/D than those classified as CYP2C19 EM or IM (6.47 vs 4.76, p = 0.0401; Table 2). Recipients receiving grafts from CYP2C19 PM donors showed no significant difference in TAC C0/D compared with those receiving grafts from CYP2C19 EM/IM donors (5.40 vs 4.59, p = 0.1252; Table 2).
TAC C0/D in the liver transplant recipients with different donor/recipient CYP3A4, CYP3A5, or CYP2C19 genotypes during VRC co-therapy.
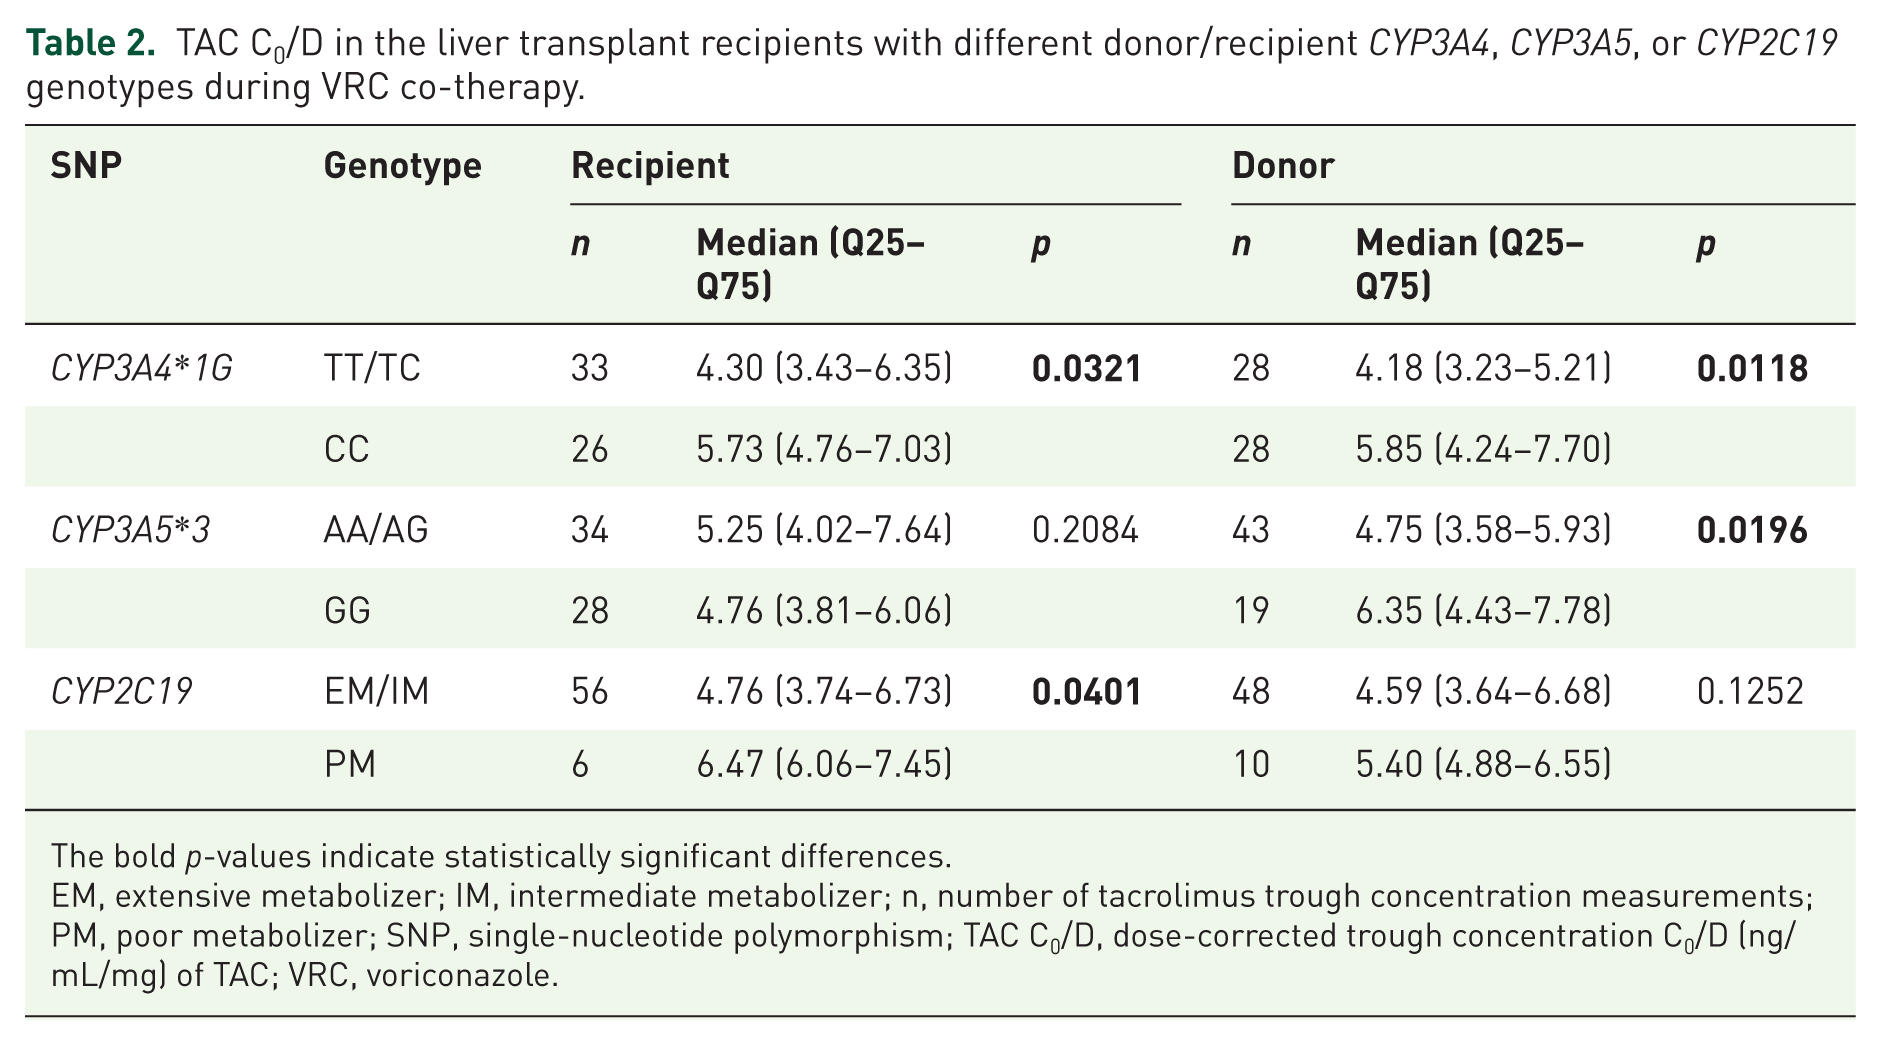
The bold p-values indicate statistically significant differences.
EM, extensive metabolizer; IM, intermediate metabolizer; n, number of tacrolimus trough concentration measurements; PM, poor metabolizer; SNP, single-nucleotide polymorphism; TAC C0/D, dose-corrected trough concentration C0/D (ng/mL/mg) of TAC; VRC, voriconazole.
Combined impact of donor and recipient CYP3A4, CYP3A5, or CYP2C19 genotypes on the TAC C0/D during VRC co-therapy
To further investigate the combined impact of liver transplant donor and recipient genotypes of CYP3A4, CYP3A5, or CYP2C19 on TAC pharmacokinetics during VRC co-therapy, recipients were stratified into four groups based on the donors and recipients genotypes of each SNP. Specifically, for CYP3A5*3, recipients were categorized into four groups according to whether CYP3A5 is expressed (Table 3): recipient expresser/donor expresser (ReDe), recipient expresser/donor non-expresser (ReDn), recipient non-expresser/donor expresser (RnDe), and recipient non-expresser/donor non-expresser (RnDn).
Liver transplant recipient groups based on donor and recipient CYP3A5 genotypes.
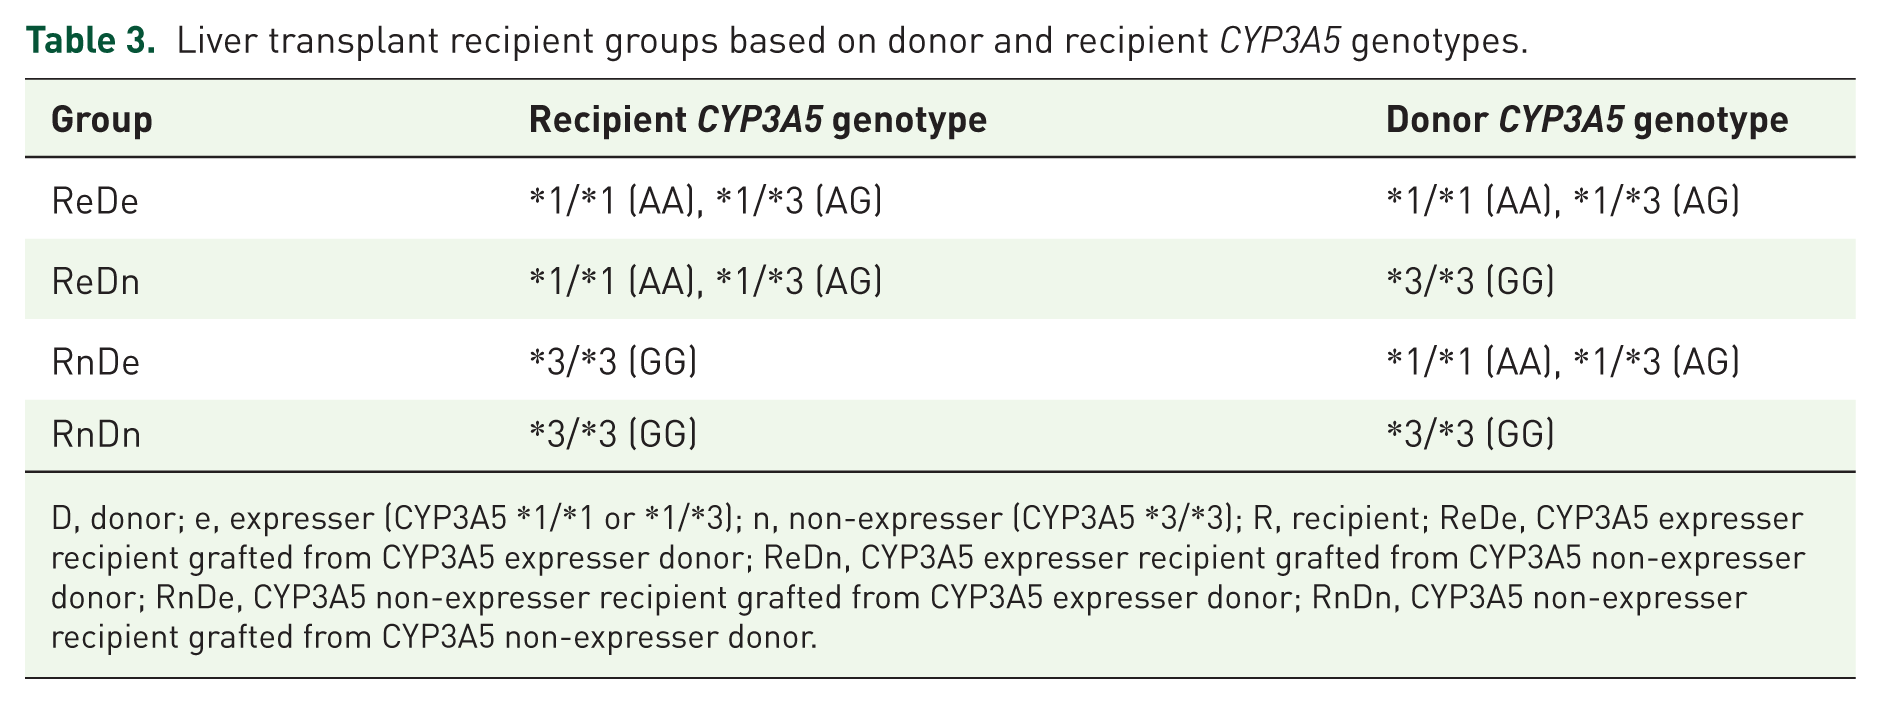
D, donor; e, expresser (CYP3A5 *1/*1 or *1/*3); n, non-expresser (CYP3A5 *3/*3); R, recipient; ReDe, CYP3A5 expresser recipient grafted from CYP3A5 expresser donor; ReDn, CYP3A5 expresser recipient grafted from CYP3A5 non-expresser donor; RnDe, CYP3A5 non-expresser recipient grafted from CYP3A5 expresser donor; RnDn, CYP3A5 non-expresser recipient grafted from CYP3A5 non-expresser donor.
When taking donor and recipient CYP3A5*3 genotypes into consideration, the ReDn and RnDn groups exhibited significantly higher TAC C0/D compared with the RnDe group (5.98 vs 4.63, p = 0.0366, and 6.83 vs 4.63, p = 0.0186, respectively; Figure 1(a)), while no significant differences in TAC C0/D were detected between other donor and recipient genotype combinations (p > 0.05; Figure 1(a)). For CYP3A4*1G, recipients carrying dual donor-recipient CYP3A4*1G CC genotypes showed 73% higher TAC C0/D than dual CYP3A4*1G TT/TC genotypes carriers (6.83 vs 3.95, p = 0.0031; Figure 1(b)). No significant differences were observed among other donor and recipient genotype combinations (p > 0.05; Figure 1(b)). For CYP2C19 genotype, no significant differences were observed across any donor and recipient genotype combinations (p > 0.05; Figure 1(c)).

Combined impact of donor/recipient CYP3A4, CYP3A5, or CYP2C19 genotypes on TAC C0/D during VRC co-therapy. Recipients were stratified into four groups based on their own and corresponding donor genotypes of CYP3A5 (a), CYP3A4 (b), or CYP2C19 (c), respectively.
Effects of donor/recipient CYP3A4/5 genotypes on the extent of TAC concentration elevation during VRC co-therapy
VRC increases TAC blood concentrations primarily by inhibiting CYP3A4/5 enzyme activities; therefore, we compared TAC C0/D between the VRC co-therapy group and the control group across recipients stratified by donor/recipient CYP3A4/5 genotypes to elucidate the impact of these genetic polymorphisms on the extent of TAC C0/D elevation induced by VRC co-administration.
When taking only recipient CYP3A5 genotypes into consideration, for CYP3A5 expresser recipients, the VRC co-therapy group displayed 3.80-fold higher TAC C0/D compared with the control group (5.25 vs 1.38, p < 0.0001; Figure 2(a)). In addition, for CYP3A5 non-expresser recipients, the VRC co-therapy group exhibited 2.75-fold higher TAC C0/D than the control group (4.76 vs 1.73, p < 0.0001; Figure 2(a)). Furthermore, we compared TAC C0/D between recipients with different CYP3A5 genotypes in the control group and the VRC co-therapy group, respectively. Notably, no significant difference was observed between CYP3A5 non-expresser and CYP3A5 expressers recipients in the VRC co-therapy group (5.25 vs 4.76, p = 0.2048; Figure 2(a)), while for the control group, CYP3A5 non-expresser recipients exhibited significantly higher TAC C0/D than CYP3A5 expressers recipients (1.73 vs 1.38, p < 0.0001; Figure 2(a)). When taking only donor CYP3A5 genotypes into consideration, for recipients receiving grafts from CYP3A5 expresser donors, the VRC co-therapy group showed 3.44-fold higher TAC C0/D compared with the control group (4.75 vs 1.38, p < 0.0001; Figure 2(b)). In recipients receiving grafts from CYP3A5 non-expresser donors, the VRC co-therapy group exhibited 3.53-fold higher TAC C0/D than the control group (6.35 vs 1.80, p < 0.0001; Figure 2(c)). Comparing TAC C0/D between recipients with different donor CYP3A5 genotypes in the control group, recipients with CYP3A5 non-expresser donors demonstrated higher TAC C0/D than those with CYP3A5 expresser donors (1.80 vs 1.38, p < 0.0001; Figure 2(b)), and the significant difference was also observed in the VRC co-therapy group (6.35 vs 4.75, p = 0.0196; Figure 2(b)).

Effects of donor or recipient CYP3A4/5 genotypes on the extent of TAC concentration elevation during VRC co-therapy. Difference in TAC C0/D between the VRC co-therapy and the control groups in subjects stratified by recipient CYP3A5*3 (a), donor CYP3A5*3 (b), recipient CYP3A4*1G (c), or donor CYP3A4*1G genotypes (d).
When taking only recipient CYP3A4 genotypes into consideration, for recipients carrying CYP3A4*1G TT/TC genotypes, the VRC co-therapy group displayed 3.16-fold higher TAC C0/D compared with the control group (4.30 vs 1.38, p < 0.0001; Figure 2(c)). In recipients carrying CYP3A4*1G CC genotype, the VRC co-therapy group showed 3.27-fold higher TAC C0/D than the control group (5.73 vs 1.75, p < 0.0001; Figure 2(c)). Then we compared TAC C0/D between recipients with different CYP3A4 genotypes in the control group and the VRC co-therapy group, respectively. Within both groups, recipients with the CYP3A4*1G CC genotype showed higher TAC C0/D than those with TT/TC genotypes (1.75 vs 1.38, p < 0.0001 and 5.73 vs 4.30, p = 0.0321, respectively; Figure 2(c)). When taking only donor CYP3A4 genotypes into consideration, for recipients receiving grafts from CYP3A4*1G TT/TC genotypes, the VRC co-therapy group displayed 2.99-fold higher TAC C0/D than the control group (4.18 vs 1.40, p < 0.0001; Figure 2(d)). In recipients receiving grafts from CYP3A4*1G CC genotype, the VRC co-therapy group showed 3.25-fold higher TAC C0/D than the control group (5.85 vs 1.80, p < 0.0001; Figure 2(d)). Comparing TAC C0/D between recipients with different donor CYP3A4 genotypes in the control group, recipients with donors carrying the CYP3A4*1G CC genotype displayed higher TAC C0/D than those with TT/TC genotype donors in both groups (1.80 vs 1.40, p < 0.0001 and 5.85 vs 4.18, p = 0.0118, respectively; Figure 2(d)).
Combined effects of donor and recipient CYP3A4/5 genotypes on the extent of TAC concentration elevation during VRC co-therapy
Further combining donor and recipient genotypes, in recipients categorized as ReDe, TAC C0/D was 4.06-fold higher in the VRC co-therapy group compared with the control group (4.83 vs 1.19, p < 0.0001; Figure 3(a)). In recipients categorized as RnDn, the VRC co-therapy group exhibited TAC C0/D 3.63-fold that of the control group (6.83 vs 1.88, p < 0.0001; Figure 3(a)). Within the control group, RnDn recipients exhibited significantly higher TAC C0/D than ReDe recipients (p < 0.0001, Figure 3(a)); however, no significant difference was observed between ReDe and RnDn groups in the VRC co-therapy group (p = 0.1571; Figures 3(a)).

Combined effects of donor and recipient CYP3A4/5 genotypes on the extent of TAC concentration elevation during VRC co-therapy. (a) Difference in TAC C0/D between the VRC co-therapy and the control groups in ReDe or RnDn recipients; (b) Difference in TAC C0/D between the VRC co-therapy and the control groups in recipients with donor and recipient CYP3A4*1G TT/TC or CYP3A4*1G CC genotypes.
In recipients with dual donor-recipient CYP3A4*1G TT/TC genotypes, the VRC co-therapy group had 3.04-fold higher TAC C0/D compared with the control group (3.95 vs 1.30, p < 0.0001; Figure 3(b)). In recipients with dual donor-recipient CYP3A4*1G CC genotypes, the VRC co-therapy group displayed 3.60-fold higher TAC C0/D compared with the controls (6.83 vs 1.90, p < 0.0001; Figure 3(b)). Within both the control and VRC co-therapy groups, recipients carrying dual donor-recipient CYP3A4*1G CC genotypes demonstrated higher TAC C0/D than dual CYP3A4*1G TT/TC genotypes carriers (p < 0.0001 and p = 0.0031, respectively; Figure 3(b)).
Timing for TAC dose reinstatement after VRC discontinuation
To determine the appropriate timing for TAC dose adjustment after discontinuation of VRC, we analyzed the variations in TAC C0/D before (baseline levels), during, and after VRC co-therapy. Among the 33 patients in the VRC co-therapy group, 20 patients had steady‑state TAC C0 measurements available within 2 weeks after VRC discontinuation, and 55 samples from these patients were included in the analysis. The results showed that, during day 1 to day 5 after discontinuation of VRC, TAC C0/D exhibited no significant difference compared with the period of VRC co-therapy (p > 0.05, Figure 4), and it remained higher than the baseline levels (p = 0.0057, Figure 4). From days 6 to 10 after discontinuation of VRC, TAC C0/D was significantly lower than that during VRC co-therapy (p < 0.0001, Figure 4). In addition, TAC C0/D from day 6 to day 10 after discontinuation of VRC showed no significant difference compared with the baseline levels before VRC co-therapy (p > 0.05, Figure 4). Therefore, TAC dose reinstatement may be deferred until day 6 post-VRC discontinuation to avoid overexposure.
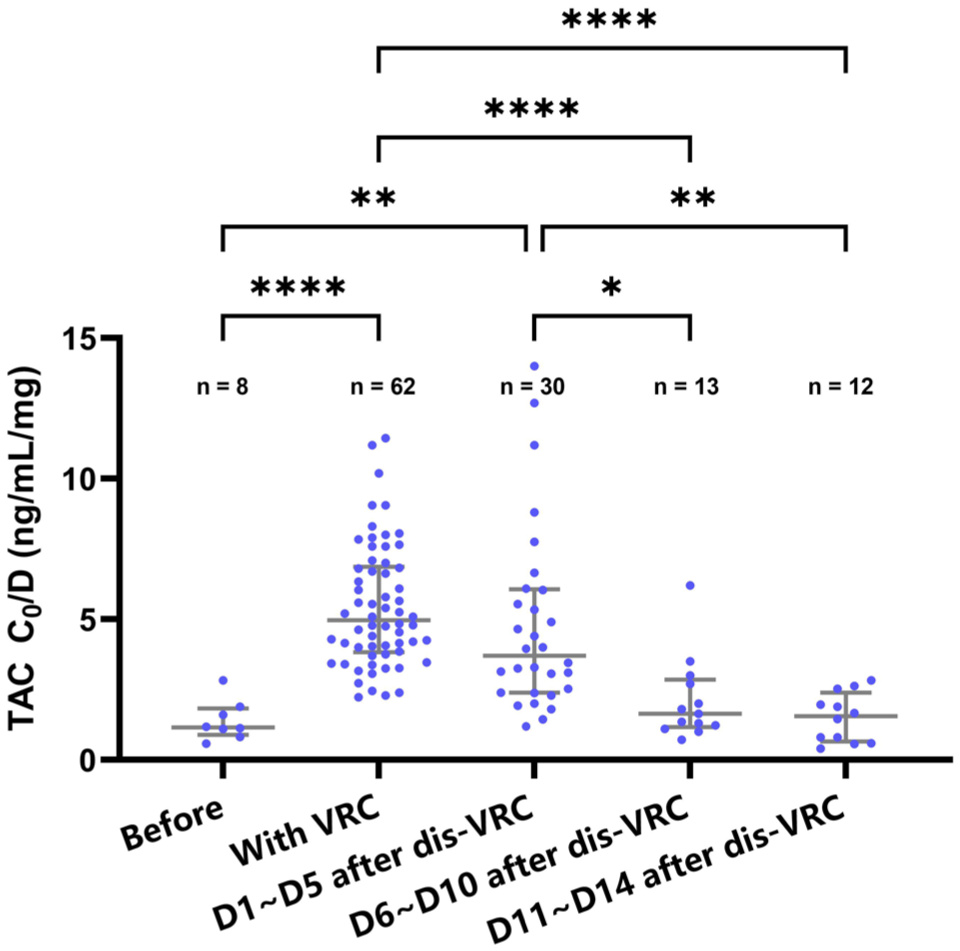
Variations of TAC C0/D before, during, and after VRC co-therapy. TAC C0/D during D1 ~ D5 after dis-VRC showed no significant difference compared with the period of VRC co-therapy and remained higher than the baseline levels. TAC C0/D during D6 ~ D10 after dis-VRC was significantly lower than that during VRC co-therapy and showed no significant difference compared with the baseline levels.
Discussion
This study explored TAC dosing strategies in liver transplant recipients during VRC co-therapy by taking the combined effect of donor and recipient genetic polymorphisms into consideration. Our data revealed that donor and recipient genotypes, particularly CYP3A4*1G, CYP3A5*3, and CYP2C19 genotypes, significantly influence TAC pharmacokinetics during VRC co-therapy. Notably, dual donor-recipient CYP3A4*1G CC carriers exhibited 73% higher TAC exposure than non-carriers, while recipients grafted from CYP3A5 non-expresser donors also displayed significantly increased TAC concentrations. Recipient CYP2C19 PMs demonstrated elevated TAC exposure compared to EMs/IMs. Furthermore, we demonstrated that TAC levels remained elevated up to 5 days after VRC discontinuation, and TAC dose reinstatement may be deferred until day 6 following VRC discontinuation to avoid overexposure.
TAC is the first-line immunosuppressant for liver transplant recipients. 39 However, infection is a common postoperative complication that could lead to graft dysfunction. 40 Balancing anti-rejection and anti-infection treatment is a clinical challenge, especially when facing fungal infections. 16 Triazole antifungals can significantly increase TAC concentration, complicating TAC dose adjustment. 41 In addition, the drug–drug interaction of TAC and concomitant medications can be affected by genetic polymorphisms.42,43 TAC pharmacokinetics are greatly influenced by CYP3A5 genotypes in the liver and intestine. 8 Following liver transplantation, the CYP3A5 genotype of the transplanted liver (donor-derived) may differ from that of the recipient’s native intestine. Donor CYP3A5 genotype determines CYP3A5 enzyme activity in the liver, whereas recipient CYP3A5 genotype influences intestinal CYP3A5 activity. Studies have demonstrated that both donor and recipient CYP3A5*3 substantially affect TAC pharmacokinetics in liver transplant recipients.11,44–47
VRC can inhibit CYP3A5 enzyme activity to reduce TAC metabolism. 48 Evidence from previous study indicated that donor CYP3A5 genotypes exert an influence on the TAC C0/D from the early post-liver transplantation phase, as early as postoperative day 3. 47 In the VRC co-therapy group of our study, all TAC C0 samples were measured after day 7 post-transplantation. Therefore, the liver donor genotype may also affect the drug–drug interaction between VRC and TAC. For donor genotypes, our study revealed that recipients of grafts from CYP3A5 non-expresser donors exhibited higher TAC C0/D than those receiving grafts from CYP3A5 expresser donors during VRC co-therapy, a finding consistent with that observed in the control group. In contrast, in terms of recipient genotypes, recipient CYP3A5 genotype showed no significant association with TAC C0/D during VRC co-therapy, while CYP3A5 non-expresser recipients exhibited significantly higher TAC C0/D than CYP3A5 expressers in controls. Studies showed that in lung and kidney transplant recipients receiving VRC co-administration, recipients with CYP3A5*3/*3 genotypes showed higher median TAC C0/D than those with CYP3A5*1/*1 or *1/*3 genotypes.36–37 However, the impact of donor CYP3A5 genotype on TAC pharmacokinetics in liver transplant recipients during VRC co-administration remained unexplored before. Our findings suggested that donor-derived hepatic CYP3A5 variants, rather than recipient intestinal CYP3A5 polymorphisms, primarily account for the interpatient heterogeneity in TAC concentrations during VRC co-administration in liver transplant recipients. We further assessed the impact of donor/recipient genotypes on TAC C0/D between the VRC co-therapy and the control groups. Regardless of donor or recipient CYP3A5 genotypes, recipients receiving VRC showed significantly elevated TAC C0/D compared with those without VRC. Notably, recipients who were CYP3A5 expressers exhibited greater VRC-induced TAC C0/D elevation (3.80-fold) than non-expressers (2.75-fold), potentially explaining the lack of statistical significance between CYP3A5 expressers and non-expressers recipients during co-therapy. When taking only donor CYP3A5 genotypes into consideration, recipients receiving grafts from CYP3A5 expresser donors or CYP3A5 non-expresser donors showed similar VRC-induced TAC C0/D elevation levels (3.44- and 3.53-fold, respectively). A semi-physiologically based population pharmacokinetic model developed in liver transplant recipients indicated that VRC highly inhibits the CYP3A activity in the intestine more than in the liver. 49 Our findings further suggest that VRC’s stronger inhibition of intestinal CYP3A5 likely mitigates the impact of recipient CYP3A5 polymorphisms on TAC exposure during co-administration. Regarding the combined effects of donor and recipient CYP3A5 genotypes on TAC C0/D during VRC co-administration, ReDe recipients exhibited a slightly greater VRC-induced TAC C0/D increase (4.06-fold) compared with RnDn recipients (3.63-fold), which might lead to the non-statistical significance between ReDe and RnDn groups during VRC co-therapy.
Genetic polymorphisms in CYP3A4, including CYP3A4*1G (rs2242480), CYP3A4*22 (rs35599367), and CYP3A4*1B (rs2740574), significantly influence TAC pharmacokinetics.9,10,50–53 Given the low allele frequencies of rs35599367 and rs2740574 in East Asian populations, this study focused on rs2242480. Our findings showed that recipients with either donor or recipient CYP3A4*1G CC genotype had higher TAC C0/D than those with TT/TC genotypes. Dong et al. demonstrated that CYP3A4*1G CC carriers exhibited nearly twofold higher TAC C0/D than non-carriers in the early post-liver transplant period. 9 However, the relationship between CYP3A4 polymorphisms and TAC blood concentrations during VRC co-administration remains poorly characterized. Our study indicated that both donor and recipient CYP3A4*1G genotypes could influence TAC C0/D during VRC co-therapy after liver transplantation. Regarding the combined donor and recipient effects of CYP3A4 genotypes on TAC C0/D during VRC co-administration, recipients carrying hepatic and intestinal CYP3A4*1G TT/TC exhibited a slightly lower VRC-induced TAC C0/D increase (3.04-fold) compared with CYP3A4*1G CC carriers (3.60-fold). During VRC co-therapy, recipients carrying hepatic and intestinal CYP3A4*1G CC genotypes showed significantly higher TAC C0/D than CYP3A4*1G TT/TC carriers, consistent with the results observed in controls. Therefore, dual donor-recipient CYP3A4*1G CC genotypes could be a biomarker for excessive TAC concentrations during VRC co-therapy.
As VRC metabolism is predominantly mediated by CYP2C19, genetic variations in this enzyme exert a significant influence on VRC pharmacokinetic profiles and are consequently associated with differential VRC concentrations in patients. Individuals who are CYP2C19 PMs have increased VRC trough concentrations, potentially enhancing its inhibitory effects on TAC-metabolizing enzymes. 29 In healthy volunteers, when co-administered with VRC in CYP2C19 IMs and PMs, TAC AUC0–24 was significantly higher than that in EMs. 54 This pattern was similarly observed in heart transplant recipients, where CYP2C19 EMs exhibited significantly lower TAC C0/D than IMs or PMs during VRC co-administration. 35 Nevertheless, the influence of donor CYP2C19 phenotypes on TAC pharmacokinetics in liver transplant recipients during VRC co-administration remained unclear. In our study, we inferred the magnitude of VRC concentration on TAC through CYP2C19 phenotypes. We demonstrated that liver transplant recipients categorized as CYP2C19 PMs showed significantly elevated TAC C0/D compared with those classified as CYP2C19 EMs or IMs, while the donor CYP2C19 metabolizer phenotypes showed no significant association with TAC C0/D during VRC co-therapy. These findings suggested that the recipient native intestinal CYP2C19 polymorphisms may exert greater influence on TAC pharmacokinetics than donor hepatic CYP2C19 genotypes when co-administered with VRC.
VRC-mediated inhibition of TAC metabolism leads to elevated TAC C0/D levels that persist for several days post-discontinuation due to delayed metabolic enzyme recovery. 55 In renal transplant, a retrospective study recommended that the initial TAC dose should not be immediately reinstated upon VRC discontinuation for 2–4 days, as TAC C0/D did not return to pre-VRC baseline levels until 5–7 days post-discontinuation. 55 However, the optimal timing for TAC dose adjustments after VRC withdrawal in liver transplant recipients remains unclear. This study found that after VRC discontinuation in liver transplant recipients, TAC C0/D remained significantly elevated for 5 days before declining to the baseline levels on day 6 post-VRC discontinuation. A semi-physiological population pharmacokinetic model predicted full CYP3A activity recovery 4 days after the last VRC dose, 56 whereas our data indicated that the VRC-inhibited CYP3A activity in liver transplant recipients recovered by approximately day 6 post-VRC discontinuation. Based on these findings, we recommend maintaining a reduced TAC dose for 5 days after VRC discontinuation in liver transplant recipients before reverting to pre-VRC dosing levels.
Limitations
Certain limitations existed in this study. As a single-center retrospective investigation, the findings necessitate validation through multicenter prospective studies. In addition, the relatively small sample size in the VRC co-therapy group precluded evaluation of the combined effects of CYP3A4/5 and CYP2C19 polymorphisms on TAC exposure during VRC co-therapy, as well as the combined impact of donor/recipient genetic polymorphisms on the timing of TAC dose reinstatement after VRC discontinuation. Furthermore, in the absence of direct quantification of VRC concentrations, the extent of the impact of VRC concentration on TAC pharmacokinetics was inferred based on CYP2C19 phenotypes. Therefore, further studies with larger sample sizes and VRC concentration measurements are warranted to validate and extend the findings.
Conclusion
When co-administered with VRC, the inter-individual difference in TAC pharmacokinetics is significantly associated with donor and recipient CYP3A4*1G, donor CYP3A5*3, and recipient CYP2C19 metabolizer phenotypes. Dual donor-recipient CYP3A4*1G CC genotypes could serve as a critical biomarker for supratherapeutic TAC concentrations. In addition, TAC dose reinstatement may be deferred until at least 6 days after VRC discontinuation to avoid overexposure. These findings support genotype-guided TAC dosing strategies that incorporate both donor and recipient pharmacogenetic profiles to optimize immunosuppression during VRC co-administration in liver transplant recipients. Individualization of TAC dosing is advised according to donor and recipient CYP3A4/5 and CYP2C19 genotypes during TAC-VRC co-therapy, thereby facilitating the achievement of target TAC trough concentrations to ensure the efficacy and safety of TAC-based immunosuppressive therapy.
Supplemental Material
sj-docx-1-taw-10.1177_20420986261420282 – Supplemental material for Donor and recipient genetic polymorphisms modulate tacrolimus pharmacokinetics during voriconazole co-therapy: a drug–drug interaction study in liver transplant recipients
Supplemental material, sj-docx-1-taw-10.1177_20420986261420282 for Donor and recipient genetic polymorphisms modulate tacrolimus pharmacokinetics during voriconazole co-therapy: a drug–drug interaction study in liver transplant recipients by Jieling Li, Liubing Li, Yanzhe Xia, Jie Chen, Jiali Li, Xiaobin Lin, Xiao Chen, Ke-Jing Tang, Pan Chen and Xiaoman Liu in Therapeutic Advances in Drug Safety
Footnotes
Acknowledgements
The authors thank the Organ Transplant Center at the First Affiliated Hospital of Sun Yat-sen University for their support in accessing samples and clinical data.
Declarations
Supplemental material
Supplemental material for this article is available online.
References
Supplementary Material
Please find the following supplemental material available below.
For Open Access articles published under a Creative Commons License, all supplemental material carries the same license as the article it is associated with.
For non-Open Access articles published, all supplemental material carries a non-exclusive license, and permission requests for re-use of supplemental material or any part of supplemental material shall be sent directly to the copyright owner as specified in the copyright notice associated with the article.