
Abstract
Background:
Studies have shown conflicting results when using thrombopoietin-related drugs (TPORD) for thromboembolic events (TEEs). Our study aimed to explore the correlation between TPORDs and TEEs.
Method:
Drug-targeted Mendelian randomization (MR) and multivariate MR (MVMR) analysis were used to explore the causal relationship between TPORDs and TEEs such as venous thromboembolism (VTE), deep vein thrombosis (DVT), pulmonary embolism (PE), myocardial infarction (MI) and ischemic stroke (STR). At the same time, a real-world study was conducted by extracting adverse events (AEs) from the FDA Adverse Event Reporting System database included in AERSMine to further validate our findings.
Outcome:
In drug-target MR, TPORDs were associated with VTE (OR = 1.193, 95% confidence interval (CI): 1.001–1.423, p = 0.049], DVT (OR = 1.321, 95% CI: 1.027–1.700, p = 0.030), MI (OR = 1.216, 95% CI: 1.010–1.464, p = 0.039), STR (OR = 1.224, 95% CI: 1.021–1.468, p = 0.029). VTE/DVT/STR remained stable in MVMR (VTE: OR = 1.3, 95% CI: 1.187–1.422, p < 0.001; DVT: OR = 1.465,95% CI:1.285–1.671, p < 0.001; STR: OR = 1.119, 95% CI: 1.018–1.229, p = 0.019) and real-world studies [lower bound of proportional reporting ratio (ROR) greater than 1]. The significance of myocardial infarction disappeared in MVMR (OR = 0.996, 95% CI: 0.894–1.109, p = 0.942) and in real-world studies (lower ROR lower than 1). There was no evidence of a causal relationship between TPORD and PE (OR = 1.244, 95% CI: 0.969-1.597, p = 0.087), but it generated a signal from a real-world study (lower bound of ROR greater than 1).
Conclusion:
This study suggests that TPORDs may be associated with an increased risk of TEEs, particularly AEs leading to VTE/DVT/STR. In addition, the relationship between TPORDs and PE/MI is debatable and requires more research.
Easy-to-understand language summaries
Background
Thrombopoietin (THPO) is synthesized and secreted in the liver, then released into the circulation. It can promote the differentiation and maturation of megakaryocytes, affect early progenitor cells of other lineages, and have a high affinity with the platelet THPO receptor, the major physiological regulator of platelet production.1,2 Several thrombopoietin-related drugs (TPORDs) have been developed, including recombinant THPOs, hetrombopag (approved by China), romiplostim, eltrombopag, avatrombopag, and lusutrombopag (approved by FDA), which have markedly changed the practice of medicine.
TPORDs can significantly elevate platelet levels, but they may also cause some adverse events (AEs), among which thromboembolic events (TEEs) have attracted much attention and controversy. Rodeghiero et al. 3 gathered an analysis of 13 clinical studies of romiplostim, which reported occurrence in 39/653 (5.9%) patients. Similar rates were reported in clinical studies of eltrombopag (19/302) and avatrombopag (4/63).4,5 According to the International Council for Harmonisation of Technical Requirements for Pharmaceuticals for Human Use (ICH) specification (https://www.ich.org/), AEs in drug clinical trials refer to all adverse medical events after the subject has received the investigational drug, which may not be causally related to the investigational drug. The patient’s underlying diseases of hypertension, diabetes, heart failure (HF), coronary heart disease (CHD), atrial fibrillation (AF) and tumors, obesity, smoking, oral contraceptives (OC), and hormone replacement therapy (HRT) are risk factors for TEEs.6 –10 It is unlikely that all these patients will be excluded in a clinical trial, so there will be bias in the judgment of adverse drug reactions. Tjepkema et al. 11 pooled 11 studies to find a non-significant higher chance of thrombosis in immune thrombocytopenia (ITP) patients with THPO receptor agonist treatments. Venous thromboembolism (VTE), which includes deep vein thrombosis (DVT) and pulmonary embolism (PE), ischemic stroke (STR), and myocardial infarction (MI) are serious TEEs that increase the burden of patients in clinical practice. 12 The limited sample size in clinical trials cannot capture all AEs. Moreover, we consulted the labels of TPORDs, most of which only mentioned that they may cause TEEs, but did not mention specific TEE. Therefore, it is more difficult to clarify the correlation of each TEE with TPORDs.
Mendelian randomization (MR) analysis uses single-nucleotide polymorphisms (SNPs) as instrumental variables to help assess the causal effects of exposure factors on outcomes. 13 Because the association between genes and disease outcomes is not disturbed by common confounding factors, and the causal time order is reasonable, it can be useful to discern the relationship between drugs and AEs. Yu et al. 14 used MR analysis to find that statins may independently increase the risk of overall and deep intracerebral hemorrhage. FDA Adverse Events Reporting System (FAERS) database is a spontaneous reporting system for post-marketing drug AEs, which can unearth some late-onset or rare AEs easily overlooked in clinical studies. 15 In this study, we applied the genome-wide association study (GWAS) published by United Kingdom Biobank (UK Biobank), FinnGen, IEU OpenGWAS Database Project (IEU Project) to perform drug-target MR and multivariable MR (MVMR) to explore the relationship between TPORDs and TEEs. Meanwhile, we mined TPORDs-related TEEs AEs from the FAERS database. A real-world study was conducted to validate our conclusions further and explore the effects of different TPORD on different TEE.
Materials and methods
Study design
As shown in Figure 1, we conducted this study from two aspects. Conceptual MR design is based on three core assumptions: (1) instrumental variables (IVs) associated with the exposure, (2) IVs are independent of all confounders known thus far, and (3) IVs do not directly influence the outcome. 16 In MR analysis, we first performed drug-target MR based on three core assumptions to analyze the effect of TPORDs on all types of TEEs. In assumption 1, we used platelet count (PLT) variants at or near the THPO loci to proxy TPORDs. After removing the SNPs horizontally pleiotropic by the PhenoScanner database and deleting the SNPs significant with the outcome, we blocked the path signed with the red cross. Then, MVMR analysis examined the red paths, and multiple MVMR models were established to analyze different risk factors on the TEEs. The reporting of our study conforms to the strengthening the reporting of observational studies in epidemiology using mendelian randomisation(STROBE-MR)statement. 17

Overview of the MR analysis and real-world study for TPORDs and risk of TEEs.
In the real-world study, AEs from the FAERS database were extracted to conduct disproportionality analysis. This was used by the reporting odds ratio (ROR) and proportional reporting ratio (PRR) to assess the relationship between four TPORDs (romiplostim, eltrombopag, avatrombopag, lusutrombopag) and TEEs. Thus, this real-world study was also a pharmacovigilance study. The ROR and PRR were calculated in three models: (1) database without any restrictions; (2) drug was reported as the ‘primary suspect’; and (3) patients were excluded who already had tumors, hypertension, diabetes, HF, CHD, and AF before therapy based on model 2. The reliability of the conclusions was further confirmed by repeated validation of the three models. Meanwhile, TPORDs are frequently used in treating ITP, which may be associated with an increased risk of thrombosis. 18 Subgroup analysis was conducted according to the indication to explore the effect of ITP on our results.
GWAS data sources and instrumental variable selection
GWAS summary statistical data for PLT were retrieved from the UK Biobank with a sample size of 350,474 patients. Referred to the study of Huang et al., 19 we proposed IVs by selecting SNPs (MAF > 1%, r2 < 0.30) within 100 kb windows from the THPO gene were associated with PLT at a genome-wide significance level (p < 5.0 × 10⁻⁸) to proxy the exposure of TPORDs. The PhenoScanner database was used to examine the associated phenotype of selected SNPs. 20 F-statistics were calculated to detect the strength of each SNP. Only the IVs at a threshold of F > 10 which indicates a strong correlation between the IVs and exposure were considered sufficient in drug-target MR analysis.21,22
The summary statistics for obesity, AF, OC, and HRT also were obtained from the UK Biobank. The summary statistics for smoking, hypertension, diabetes, HF, lung cancer (LC), breast cancer (BC), and lymphomas (these three cancer types with large sample sizes and high incidence rates represent tumors) were derived from the IEU Project. To maximize the strength and compensate for the lack of SNPs, we extracted individual SNPs for each trait concerning the significance and linkage disequilibrium threshold settings for Ding et al. 23 To adjust pleiotropic effects across TPORDs traits, we performed 13 models in MVMR analyses: model 1 included all traits; models 2–13 included individual traits, in the order of OC, HRT, hypertension, diabetes, CHD, HF, AF, LC, BC, lymphomas, obesity, and smoking. GWAS summary-level data for TEE outcomes were obtained from FinnGen results, including VTE, DVT, PE, MI, and STR. The corresponding phenotypic codes obtained were ‘I9_VTE’, ‘I9_PHLETHROMBDVTLOW’, ‘I9_PULMEMB’, ‘I9_MI_STRICT’, and ‘I9_STR_EXH’. All data were obtained from the European ancestry population. The details of the GWAS data sources and definitions are listed in Supplemental Tables 1 and 2.
FAERS data sources and mining
The FAERS data files consist of DEMO (demographic and administrative information), DRUG (drug information), REAC (reactions), OUTC (outcomes), RPSR (report sources), THER (drug therapy start and end dates), and INDI (indications). AERSMine (https://research.cchmc.org/aers/), an updated online analysis tool, was developed to mine the FAERS data from 2004 Q1 to 2022 Q4, with 19,089,556 AEs. 24 AEs in the FAERS database are cored by the MedDRA dictionary from system organ class, high-level group terms (HLGTs), high-level terms, preferred terms (PTs), and lowest-level terms. Our study employed three models to mine all TPORDs (including romiplostim, eltrombopag, avatrombopag, lusutrombopag), romiplostim, eltrombopag, and avatrombopag-related TEEs through AERSMine. In model 1, by searching AERSMine based on the search term of HLGT (embolism and thrombosis) and PT (VTE, DVT, PE, MI, STR), we obtained the numbers of TPORD-associated TEE AEs. In model 2, to guarantee that TPORDs were likely to induce AEs during drug administration, we reserved the AEs when the drug was considered ‘primary suspected’. In model 3, to further strengthen the accuracy, we excluded patients with tumors, hypertension, diabetes, HF, CHD, and AF before therapy based on model 2. In the subgroup analyses, we performed computational analyses by stratifying ITP and other indications.
Statistical analyses
MR analysis
In drug-target MR analysis, we used three MR methods25 –27 [inverse variance weighting (IVW), median weighting, and MR-Egger] to infer causal relationships between TPORDs and five TEEs. IVW was used as the primary method to identify the causal because it provided the most precise estimates, whereas the other methods were used as complementary.28,29 The MR-PRESSO (MR-pleiotropy residual sum and outlier) global test and outlier test were used to detect potential horizontal pleiotropy, and effectively controlled for pleiotropic effects by removing outliers. 30 If the IVW method result is significant (p < 0.05), even if the results of other methods are not significant, and no pleiotropy and heterogeneity was identified, provided that the beta values of the other methods are in the same direction, it can be regarded as a positive result. 31
At the same time, we conducted a sensitivity analysis. The Cochran’s Q statistical test was used to evaluate heterogeneity, where p < 0.05 indicates the evidence of heterogeneity of selected SNPs. 32 The MR-Egger intercept was used to inspect horizontal pleiotropy, where p < 0.05 indicates evidence of horizontal pleiotropy. 33 We also performed a leave-one-out sensitivity analysis to test whether the stability of the results was affected by a single SNP. We generated a forest plot to illustrate the results.
The extent of the random-effect IVW method in MVMR analysis was used as the primary method to reduce the effects of the results by heterogeneity within SNPs. 34 We applied the MV MR-Egger and MR-LASSO methods to adjust for measured and unmeasured pleiotropy. The MV MR-Egger intercept was also used to inspect pleiotropy. 35 The ‘MendelianRandomization’, ‘TwoSampleMR’, and ‘MR-PRESSO’ packages of the R software (version 4.2.2, https://www.r-project.org/) were used to perform MR.
Real-world study
Disproportionality analyses are currently the most widespread method of adverse reaction signal detection. We adopt the ROR and PRR of disproportionality analyses to evaluate the generation of the signal of TPORD-associated TEEs. The signal was considered generated when the number of AE reports was 3 or more, and the lower limit of the 95% confidence interval (CI) of the ROR and PRR was greater than 1. 36 The ‘forestplot’ packages of the R software (version 4.2.2) and Microsoft Excel version 2013 were used to perform a pharmacovigilance study.
Results
Drug-target MR
In the present study, 34 SNPs within 100 kb windows from the THPO gene were selected for proxying TPORDs. Two SNPs (rs9944, rs56172794) correlated with confounders were ruled out. F-statistics of selected SNPs ranged from 30.917 to 542.840 (Supplemental Table 3). MR-PRESSO did not detect any potential pleiotropic outliers. All SNPs did not have a significant correlation with the TEEs (Supplemental Table 4).
As depicted in Figure 2, the IVW model revealed suggestive evidence for the association of TPORDs with VTE [odds ratio (OR) = 1.193, 95% CI: 1.001–1.423, p = 0.049], DVT (OR = 1.321, 95% CI: 1.027–1.700, p = 0.030), MI (OR = 1.216, 95% CI: 1.010–1.464, p = 0.039), STR (OR = 1.224, 95% CI: 1.021–1.468, p = 0.029), indicating that TPORDs might increase the risk of VTE/DVT/MI/STR. At the same time, there was a yet-to-confirm causal relationship between TPORDs and PE (OR = 1.244, 95% CI: 0.969–1.597, p = 0.087). MR-Egger and weighted median showed that the IVW association pattern remained directionally consistent in all statistical models, demonstrating the robustness of the inferred causal relationships between TPORDs and TEEs. In sensitivity analysis, the Cochran’s Q test did not find evidence of heterogeneity between TPORDs and each TEE (all p > 0.05; Table 1), and the intercept term in MR-Egger regression did not deviate from zero that there was no significant horizontal pleiotropy (all p > 0.05; Table 1, Supplemental Figure 1). The leave-one-out analysis also confirmed that no causal estimates were driven by any single SNP (Supplemental Figure 2).
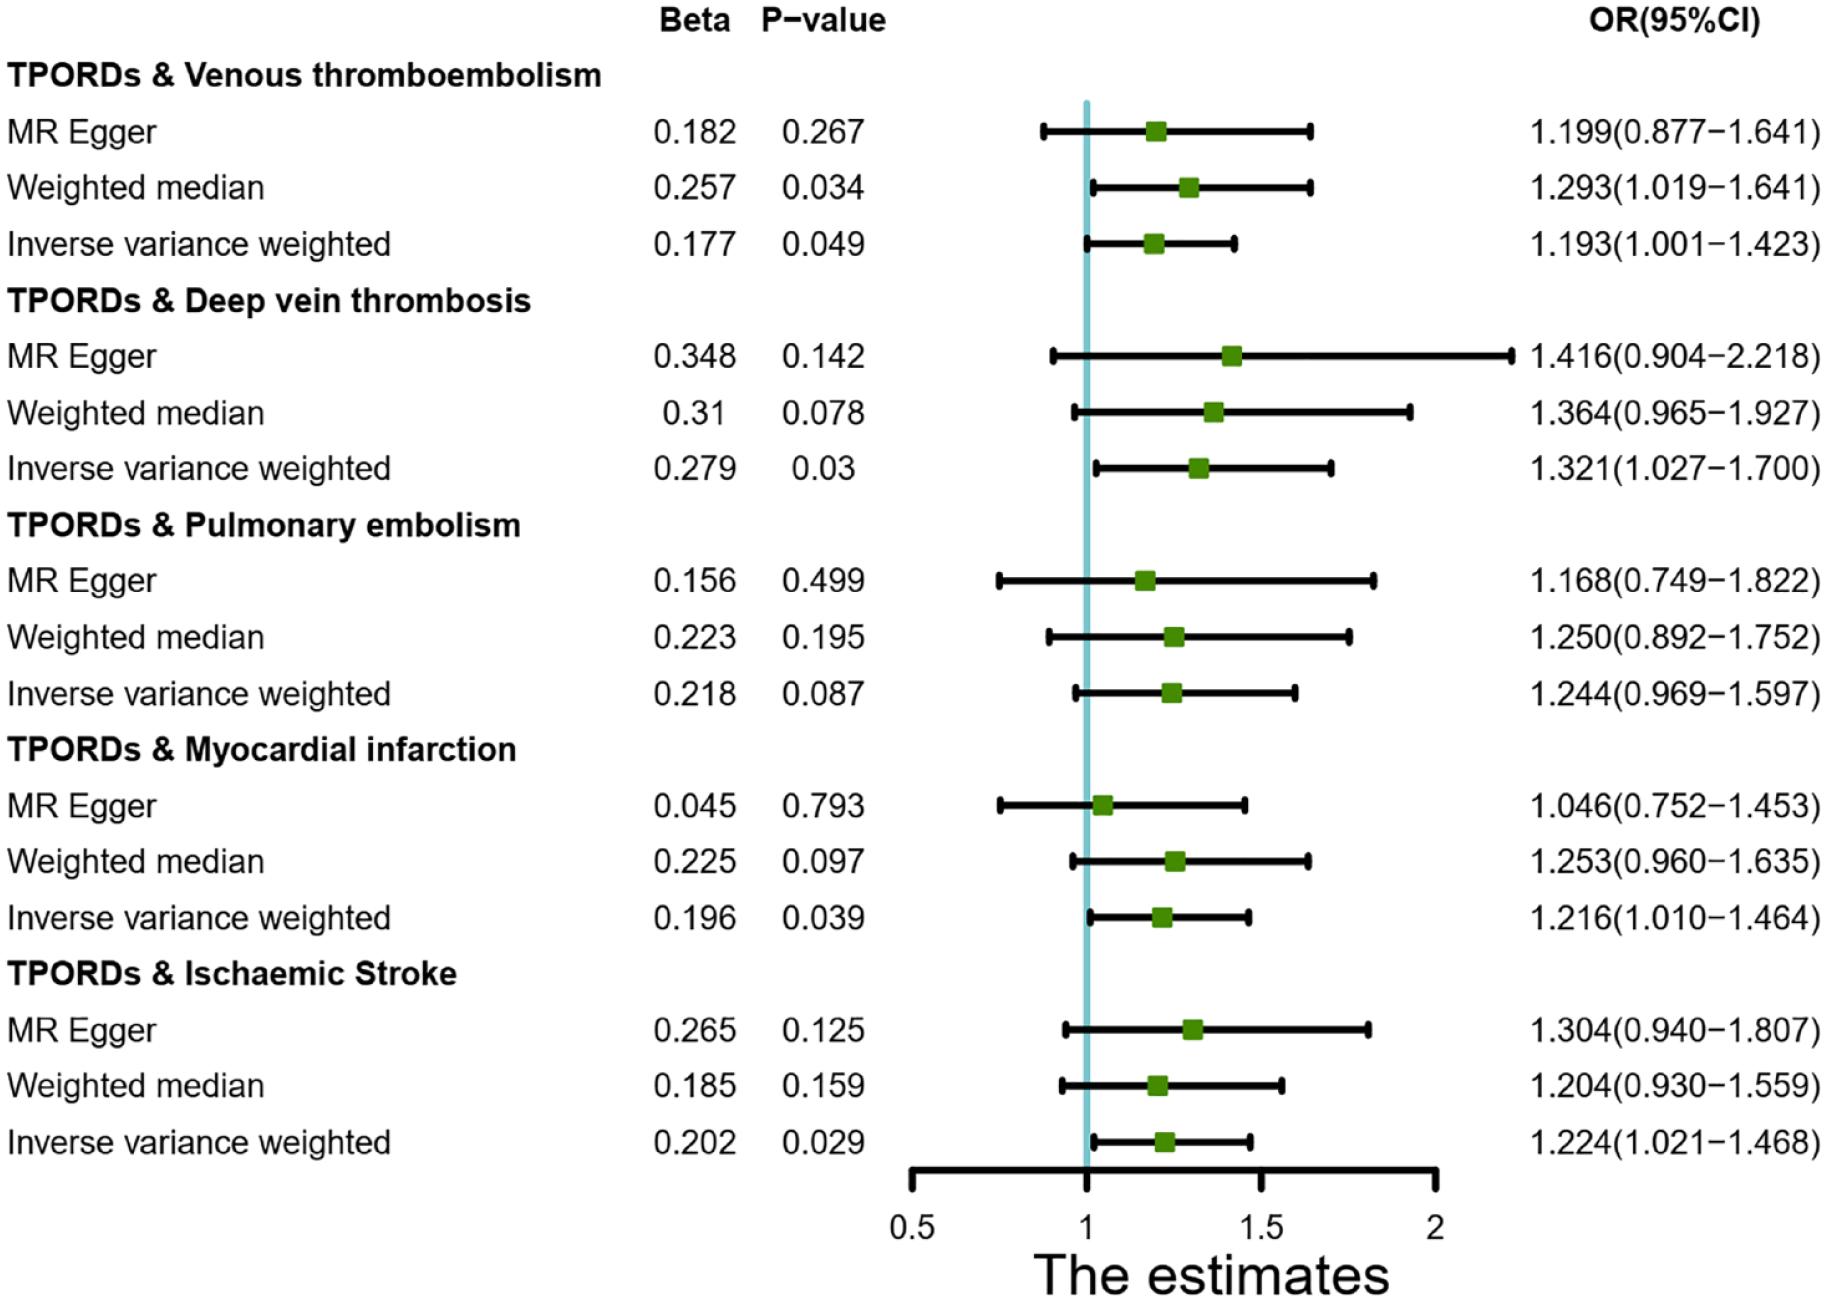
Estimation of TPORD and TEE risk based on Mendelian randomization analysis.
Heterogeneity and pleiotropic test for association between TPORD and VTE/DVT/PE/MI/STR.
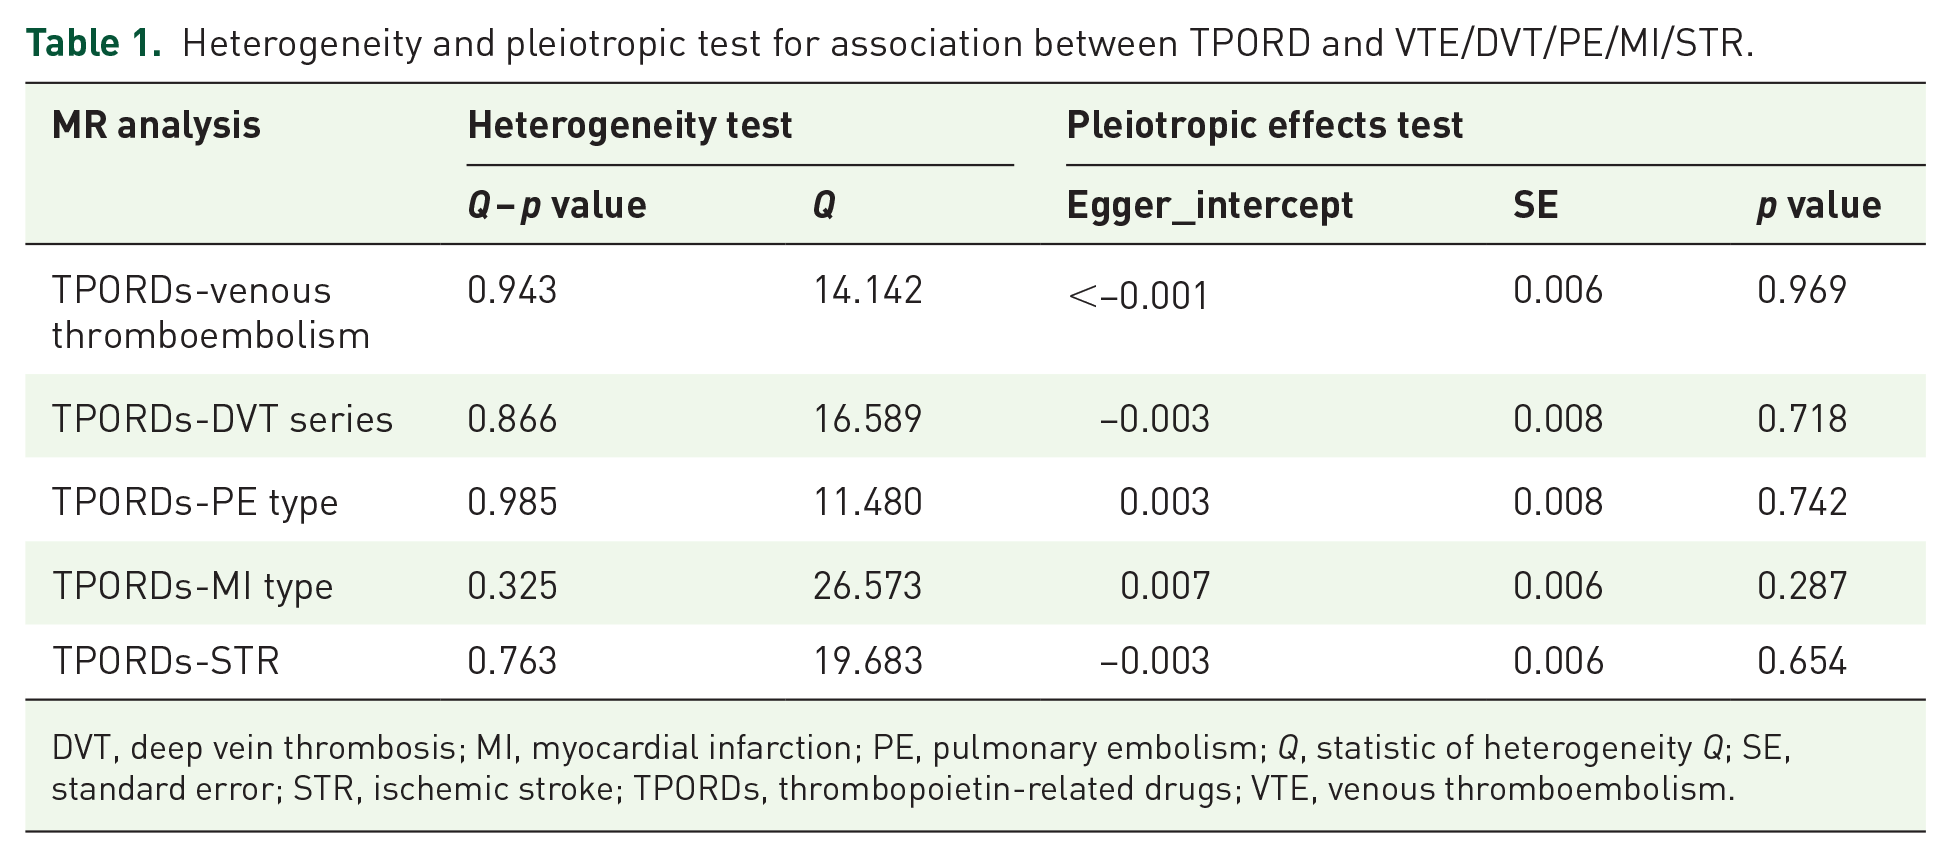
DVT, deep vein thrombosis; MI, myocardial infarction; PE, pulmonary embolism; Q, statistic of heterogeneity Q; SE, standard error; STR, ischemic stroke; TPORDs, thrombopoietin-related drugs; VTE, venous thromboembolism.
Multivariate magnetic resonance imaging
The SNPs related to obesity, smoking, drugs and underlying diseases were 34, 25 SNPs, 35 SNPs and 696 SNPs respectively. As can be seen from Figure 3 and Supplementary Tables 5-8, the results obtained from the MV MR-Egger and MR-LASSO calculations are in the same direction as the IVW method, and most of the conclusions are consistent.

Multivariate MR results of TPORD and risk of VTE/DVT/MI/STR.
In VTE MVMR (Supplementary Table 5, Figure 3), the genetic causal relationship of TPORD for VTE remained statistically significant when adjusting for OC, hypertension, CHD, HF, smoking, LC, BC, and all traits (adjusted OC: OR = 1.206, 95% CI: 1.013–1.435, p = 0.036; hypertension: OR = 1.204, 95% CI: 1.032–1.406, p = 0.019; Coronary heart disease: OR = 1.381, 95% CI: 1.228–1.554, p<0.001; HF:OR = 1.387,95% CI: 1.109–1.734, p = 0.004; LC: OR = 1.213,95% CI: 1.027–1.433, p = 0.023; BC: OR = 1.188,95% CI: 1.007–1.4, p = 0.042; Cigarette smoking: OR = 1.217, 95% CI 1.002–1.477, p = 0.048; All traits: OR = 1.3, 95% CI: 1.187–1.422, p < 0.001). Although a significant relationship between TPORDs and VTE disappeared when adjusted for HRT (p = 0.063), diabetes mellitus (p = 0.150), AF (p = 0.145), lymphoma (p = 0.207), and obesity (p = 0.054). These results suggest that these traits partially affect the association between TPORDs and VTE. The MV MR-Egger intercept indicates no horizontal pleiotropy.
In DVT and STR MVMR (Supplementary Tables 6 and 8, Figure 3), the association between TPORDs and DVT/STR remained statistically significant after adjusting for all traits (DVT: OR = 1.465, 95% CI: 1.285–1.671, p <0.001; STR: OR = 1.119,95% CI: 1.018–1.229, p = 0.019). The association between TPORD and DVT may be partially influenced by HRT (p = 0.052), diabetes mellitus (p = 0.214), AF (p = 0.080), cancer-associated traits (LC: p = 0.080, BC: p = 0.062, lymphoma: p = 0.079). While HRT (p = 0.082), diabetes mellitus (p = 0.302), LC (p = 0.075), lymphoma (p = 0.084), and obesity (p = 0.054) may affect the relationship between TPORD and STR. In MI MVMR (Supplementary Table 7, Figure 3), after adjusting for all traits (OR=0.996, 95% CI: 0.894–1.109, p = 0.942), significant disappearance may be related to diabetes mellitus (p = 0.967), coronary heart disease (p = 0.409), AF (p = 0.120), BC (p = 0.120). 0.564) and obesity (p = 0.061).
Real-world research
Between Q1 2004 and Q4 2022, the FAERS file contained 20,015 romiplostim-related AEs, 27,191 eltrombopag-related AEs, 1041 avatrombopag-related AEs, 41 rutrombopag-related AEs, 3058 TPORD-related embolism and thrombosis, 61 TPORD-related VTEs, 763 TPORD-related DVTs, 749 TPORD-related PEs, and 428 cases TPORD-associated myocardial infarction and 77 TPORD-related STR reports.
Embolism and thrombosis signals were significant at HGLT levels for all TPORDs/romiplostim/eltrombopag in all three models (Figure 4). By further restricting conditions and excluding confounders, a signal for avatrombopag was generated in model 3 (ROR = 2.757, 95% CI: 2.023–3.756). PT levels of VTE/DVT/PE signal were also significant in all 3 models of TPORDs/romiplostim/eltrombopag, while no signal was generated for avatrombopag in all models. The lower limit of ROR for myocardial infarction was below 1 in all 3 models of TPORDs/romiplostim/eltrombopag/avatrombopag. In terms of STR signals, the lower limit of ROR of all TPORDs/romiplostim in the three models was greater than 1. Eltrombopag produces a signal in Model 1 but is not sustained in Models 2 and 3. Avatrombopag did not report STR in the FAERS database.

ROR and 95% CI for TPORD-related TEEs reported in FAERS. The RORs of TPORD-related TEEs were compared in three models: (1) an unlimited database; (2) the drug was reported as the “prime suspect”; and (3) excluded patients with pre-existing tumors, hypertension, diabetes, HF, CHD, and AF prior to model 2-based treatment.
In the subgroup analysis (Figure 5), the signal of embolism and thrombosis/VTE/DVT was significantly retained in all TPORDs/romiplostim/eltrombopag, while the signal of MI remained unsignaled. The lower limit of ROR for PE in all TPORDs/romiplostim/eltrombopag and all TPORDs/romiplostim was less than 1 when the patient indicated ITP. When the patient has other indications, the lower ROR of eltrombopag PE/STR is only less than 1. In our subgroup analysis, no signals were generated other than avatrombopag-related embolism and thrombosis in patients with ITP. The PRR results are shown in Supplementary Figures 3 and 4, and the response signals obtained are completely consistent with the ROR results.
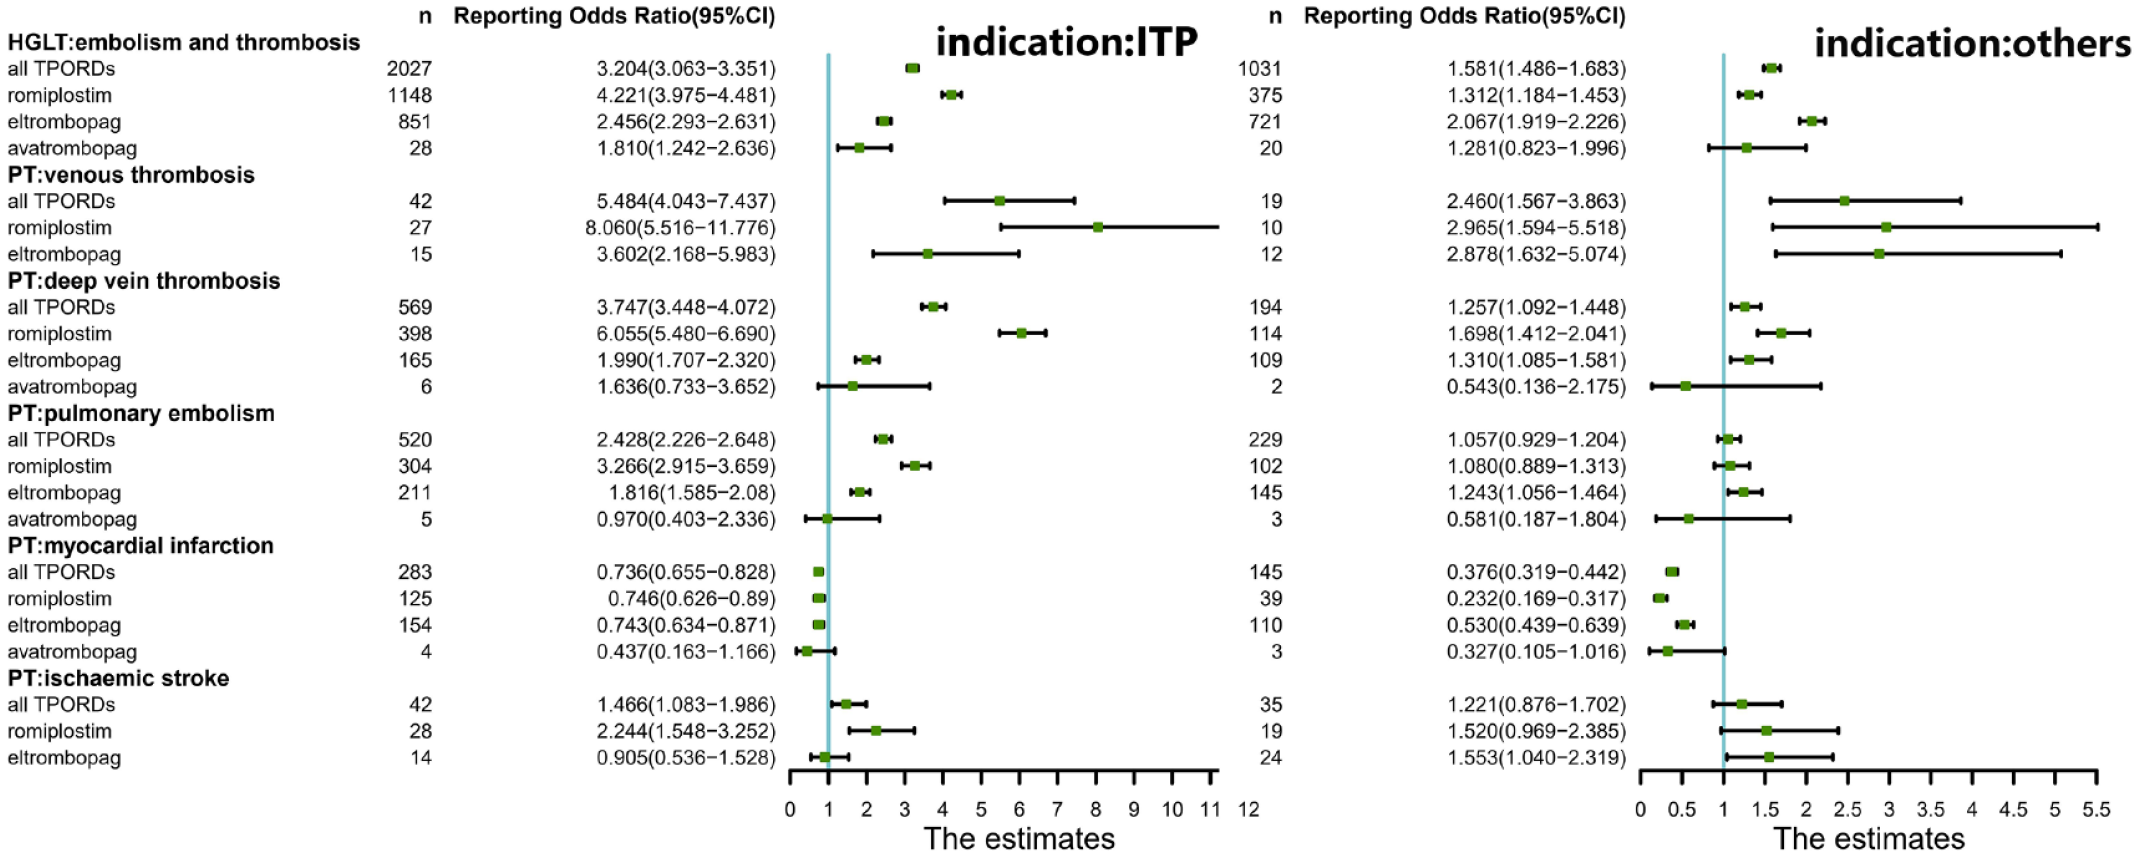
Subgroup analysis of ROR and 95% CI of TPORD-related TEEs reported in FAERS stratified by indication.
Discuss
Previously, the association between TPORDs and TEEs was controversial due to the limitations of reporting methods and sample sizes of adverse reactions in clinical trials. Drug-targeted MR can reveal target-mediated adverse reactions. MVMR is an extension of MR that allows for an estimate of the direct causal effect of each exposure on the outcome. A FAERS database with a large sample size can reflect the occurrence of AEs in the real world. These methods are powerful tools for detecting adverse drug reactions. Our study used drug-targeted MR, MVMR, and real-world studies to provide evidence on the positive association of TPORD with TEE risk.
In the MR analysis of drug targets, the results of IVW analysis suggest that TPORDs may increase the risk of VTE/DVT/MI/STR. After adjusting for the risk factors of TEEs, MVMR analysis showed that the significance between TPORDs and VTE/DVT/STR still existed, and HRT, diabetes mellitus and lymphoma may affect three significant relationships. In real-world studies, all TPORD-related embolism and thrombosis were significant in the three model and subgroup analyses, implying that TPORDs may trigger thrombosis and embolism. All TTE/DVT/STR associated with TPORD also generated signals in three real-world study models. The correlation between TPORDs and these three TEEs is further supported. At the same time, the relationship between TPORDs and MI/PE was inconsistent in MR analysis and pharmacovigilance studies. In the MR analysis of drug targets, TPORDs had a significant effect on myocardial infarction, but disappeared after adjusting for multiple influencing factors of TEEs in MVMR. In the 3 models of pharmacovigilance studies, the lower limits of ROR and PRR were less than 1. Venous thromboembolism is known to include deep vein thrombosis and pulmonary embolism. Although the effect of TPORDs on PE showed the same significant signal as VTE and DVT in the three models of pharmacovigilance studies, no significance was found in the MR analysis of drug targets. This seemingly contradictory result can be explained by the possibility that there is no direct causal relationship between TPORD and PE since PE is primarily a secondary event after DVT.
The specific TEE is not documented in detail on most TPORD labels. This study uses the FAERS database to mine and analyze TPORD-related TEEs in the database. Different TPORDs have different signal responses to different TEEs. Romiplostim produced signals for embolism and thrombosis/VTE/PE/DVT/STR in all three models. Eltrombopag-related embolism and thrombosis/VTE/DVT/PE produced signals in 3 models. Avatrombopag was launched in the United States in 2018 and has powerful pharmacological effects.37,38 Our study only found that avatrombopag may promote embolism and thrombosis but may not be associated with the development of VTE/DVT/PE/MI/STR. In subgroup analyses, only avatrombopag-related embolism and thrombosis produced signals in patients with ITP. Clinically, patients with a high risk of thrombosis can be appropriately selected.
In addition to TEEs reported in clinical trials, TEEs have been reported in patients in long-term postmarketing follow-up safety studies of romiplostim and eltrombopag. 39 Additionally, various cases of TPORD-induced TEE have been reported.40–42 There are several potential prothrombotic mechanisms by which TPORDs contribute to thrombosis. First, it may be related to the ability of TPORDs to significantly increase platelet counts in a short period of time. In a baboon model simulating human ulcerative atherosclerosis, platelet deposition in extravascular shunts directly correlates with platelet counts following administration of pegylated recombinant human megakaryocyte growth and development factor (PEG-rHuMGDF).43,44 Second, Fontana et al. TPORDs have also been found to increase the risk of thrombosis by increasing microparticle formation, which is associated with increased rates of thrombosis in many diseases with increased platelet turnover. 45 More recently van Dijk et al.46 Studies have also shown that eltrombopag treatment increases plasma thrombin generation potential. Finally, some scholars have found that TPORDs can enhance P-select, an adhesion molecule mainly expressed on the surface of activated platelets and endothelial cells, which may be the pathogenesis of VTE.47,48
Our study is the first to employ MR analysis to explore the potential causal relationship between TPORD and TEE and validate it using real-world research data. When conducting MR analyses, we tested these relationships in populations of the same ethnicity. We used various methods to verify the accuracy of the results, such as calculating F statistics to exclude weak IVs bias, and detecting heterogeneity and pleiotropy to ensure reliability. We also conducted MVMR to discover possible confusion between TPORD and different TEEs. In real-world studies, we not only explored whether there is a signaling response between TPORDs and embolism and thrombosis/VTE/DVT/PE/MI/STR, but also explored the signals of specific TPORDs, providing some insights for future clinical drug selection. Reference evidence. We calculated the signal of AE using both methods simultaneously to make the results more robust.
Limitation
On the other hand, some limitations must be noted in our study. First, we were unable to perform multi-database validation due to the limited number of GWAS available for study subjects. Second, to maximize the strength of SNPs and compensate for the lack of SNPs, we selected some trait SNPs at relaxed thresholds (p < 5 × 10⁻⁶) and low weak linkage disequilibrium (r2 < 0.30). Third, the calculated acoustic emission signals in the FAERS database only represent statistical correlations rather than definite biological causation. 49 Although we used two methods to ensure statistical relevance, more extensive studies are needed to further investigate the biological relevance.
Conclusion
This retrospective study combines MR analysis and real-world research for the first time to explore the relationship between TPORDs and TEEs. We found that TPORDs may be related to an increased risk of TEEs, especially leading to the AEs of VTE/DVT/STR. Early prevention and avoidance of these TEEs is needed in the future clinical use of TPORDs. Meanwhile, we also found that avatrombopag was related to fewer TEEs than romiplostim/eltrombopag in the pharmacovigilance study. It may be appropriately selected for patients with a high risk of thrombosis. Subgroup analyses stratified by indication (ITP and others) could not refute our conclusions. Although the relationship between TPORDs and PE/MI is debatable in MR analysis and real-world studies, more research is required for further determine.
Supplemental Material
sj-doc-1-taw-10.1177_20420986231224236 – Supplemental material for Association of thrombopoietin-related drugs with thromboembolic events: Mendelian randomization and a real-world study
Supplemental material, sj-doc-1-taw-10.1177_20420986231224236 for Association of thrombopoietin-related drugs with thromboembolic events: Mendelian randomization and a real-world study by Cuilv Liang, Qiying Chen and Yin Zhang in Therapeutic Advances in Drug Safety
Footnotes
References
Supplementary Material
Please find the following supplemental material available below.
For Open Access articles published under a Creative Commons License, all supplemental material carries the same license as the article it is associated with.
For non-Open Access articles published, all supplemental material carries a non-exclusive license, and permission requests for re-use of supplemental material or any part of supplemental material shall be sent directly to the copyright owner as specified in the copyright notice associated with the article.