
Abstract
Background:
To assess cardiovascular risk among various hemoglobin (Hb) rates of rise (RoR) in chronic kidney disease (CKD) patients with anemia who have initiated therapy with erythropoiesis stimulating agents (ESAs).
Methods:
Observational cohort of CKD patients initiating ESA therapy from the Centricity® database, 1990–2011. Proportional hazards models tested the hypothesis that a slower Hb RoR (0 < g/dl/month ⩽ 0.125) is associated with a lower cardiovascular (CV) incidence [composite of fatal/nonfatal myocardial infarction (MI) and stroke] compared with faster RoR (0.125 < g/dl/month ⩽ 2.0, and >2.0 g/dl/month).
Results:
A total of 9220 patients receiving ESAs were followed for an average of 3.1 years. Slow (group B) RoR versus medium (group C′) and fast (group D′) RoR in Hb, throughout all Hb milestones, was associated with lower risk of the composite endpoint [B (slow) versus D′ (fast) [hazard ratio (HR) = 0.20 (0.11, 0.39), p < 0.0001]; B versus C′ (medium) [HR = 0.34 (0.19, 0.62), p = 0.0004], and C′ versus D′ [HR = 0.60 (0.42, 0.85), p = 0.005]]. Within achieved Hb milestones, HRs were: B versus D′ at milestone ⩾ 14.1 g/dl [HR = 0.17 (0.05, 0.56); p = 0.004] and at milestone 12.6−14.0 [HR = 0.18 (0.07, 0.46), p = 0.0004].
Conclusion:
Rapid Hb rise is associated with adverse CV outcomes, with markedly lower risk for rates below a threshold trajectory of 0.125 g/dl/month, even with complete correction.
Keywords
Introduction
Anemia is a common complication of chronic kidney disease (CKD).1,2 Observational studies have suggested an increased risk of cardiovascular (CV) and renal complications, lower quality of life, and higher mortality with lower hemoglobin (Hb) levels.2–12 However, large randomized clinical trials (RCTs) have demonstrated that correction of anemia with an erythropoiesis stimulating agent (ESA) is associated with either an increased risk of CV complications or possibly death,13–16 or no benefit in outcomes.17,18 Although the mechanism for this heightened risk remains obscure, possibilities include rapid rates of rise (RoR) in Hb, exposure to high ESA dose and dose escalation, a high Hb target range, and off-target effects of ESAs.
The US Food and Drug Administration (FDA), in the labels of ESAs and in FDA advisory reports, has raised the possibility that a rapid RoR in Hb or hematocrit (Hct) may have harmful effects. Indeed, the FDA noted in the darbepoetin-α licensing review that an RoR ⩾ 0.5 g/dl/week is associated with an increased risk for CV and thromboembolic events19,20 suggesting that RoR has a substantial impact on the increased risk of adverse outcomes.
A secondary analysis of an RCT 21 and a meta-analysis of RCTs, 22 along with some epidemiologic studies,23–26 suggested an association between CV risk and increasing ESA doses, particularly among poor responders. 21 The risk associated with ESA dose did not necessarily correlate with the level of Hb 21 or was shown to be independent from Hb levels 23 in predicting mortality. These studies highlight the difficulty in discerning whether the risk is associated with the dose or with the clinical profile necessitating the dose. 27
There remains a lack of consensus on the optimal strategy for using ESAs in the treatment of CKD anemia.21,28–35 It is possible that simply increasing Hct may not lead to effective therapy, 36 as a rapid increase in Hct may lead to excess morbidity and mortality.37,38 Current guidelines31,33 reflect this concern, and recommend maintaining Hb below 11 g/dl, while using the lowest possible ESA dose, and avoiding a rapid rise in Hb.
This study tested the hypothesis that a slower Hb RoR (0 < g/dl/month ⩽ 0.125) is associated with a lower incidence of CV events among CKD patients with anemia using ESA as compared with a faster Hb RoR (0.125 < g/dl/month ⩽ 2.0, and >2.0 g/dl/month) throughout all Hb milestones (i.e. target ranges). The secondary hypothesis tested is that a slower Hb RoR is associated with a lower incidence of CV events as compared with a faster Hb RoR within each Hb milestone (i.e. target range) achieved including the normal range (>12.5 g/dl).
Methods
Epidemiological design and rationale
The working hypothesis is that Hb RoR is directly linked to changes in whole blood viscosity (WBV) which is, in turn, linked to increases in the adverse outcomes of myocardial infarction (MI) and stroke. If change in viscosity is, indeed, the factor related to the increased risk, then: (1) is there a trajectory (i.e. RoR) that is safe(r) and, if so, (2) how far/high (i.e. to what Hb milestone or target range) along that trajectory can one go and still maintain a positive benefit/risk balance?
Physiological basis
WBV is the major determinant of normal blood flow 39 and Hct is the major determinant of WBV, 40 with Hct and WBV having a logarithmically linear relationship.40,41 Disease states with elevated Hb/Hct, such as polycythemia vera, have demonstrated such relationships between Hct and WBV, where WBV increases exponentially with a rise in Hct. 41 This relationship tended to be log-linear at any given protein concentration 42 and at both high and low rates of shear. 40 Experiments to induce polycythemia in animals showed a marked reduction in cerebral blood flow due to WBV, with approximately 60% of this reduction attributed to the increase in Hct. 43 As WBV increases, blood flow through the microvasculature is impaired, 39 resulting in corresponding increases in clinical complications. 42 Subsequent recommendations emphasize measuring WBV at low rates of shear to assess the risk of vascular complications. 42
Numerous studies have demonstrated the ability of ESAs to increase Hct,13–16,19,44–48 often quite rapidly relative to a slow, ‘disease correlated’, pathophysiological decline in Hct. Effective therapy may not be simply a matter of increasing Hct, 36 as a rapid increase in Hct leads to an exponential increase in WBV, 41 which may in turn lead to excess morbidity and mortality due to ischemia, thrombosis and elevated blood pressure.37,38 Therefore, estimating this ‘disease correlated’ rate of decline in Hb/Hct may offer a target trajectory for the RoR when ESA intervention is warranted.
Hb rate-of-rise variable and milestone determination
Estimating the pathophysiological rate of Hb decline in CKD requires the juxtaposition of: (1) the renal compensatory response, (2) the relationship between renal excretory function and Hb levels, and (3) a time estimate to calculate the pathophysiological rate of Hb decline.
Compensation in renal disease is structural. Animal experiments have shown that renal dysfunction is the result of a loss of nephron mass. 49 This concept holds true in humans, with extreme efficiency gained through hypertrophy 49 of the nephron mass. At approximately 40–60 ml/min/1.73 m2, the definition of CKD,50,51 the renal remnant reaches peak efficiency with subsequent loss of nephron mass resulting in an increasingly declining compensatory capability.49,52
Anemia is a useful marker of the degree of renal impairment 35 and national survey data have shown that an eGFR below 60 ml/min/1.73 m2 is strongly associated with anemia. 53 Numerous studies have demonstrated that when eGFR declines to approximately 40 ml/min/1.73 m2, the renal remnant becomes insufficient to compensate via hypertrophy and can no longer maintain either excretory function or erythropoietic stimulation. After this point of ‘decompensation’, a further decline in renal excretory function has been shown to be linearly related to Hb/Hct decline.54–58
A time estimate for the pathophysiological rate of Hb decline was based on Table 109 of the Kidney Disease Outcomes Quality Initiative (KDOQI) Guidelines. 59 The highest average rate of decline is 12.6 ml/min/year, which equates to approximately a 12.5% decline in renal function per year (normal GFR of 90–120 ml/min). Applying this 12.5% rate of decline to Hb at the point of renal ‘decompensation’ and ensuing anemia (12 g/dl; male/female combined) results in a ‘disease correlated’ estimate of −1.5 g/dl/year decline in Hb. Reversing this estimated decline in Hb provides a target RoR trajectory of +1.5 g/dl/year (+0.125 g/dl/month), hypothetically suggesting that this RoR trajectory allows for ‘physiologic adaptation’ to occur, whereas adaptability is inadequate at higher trajectories.
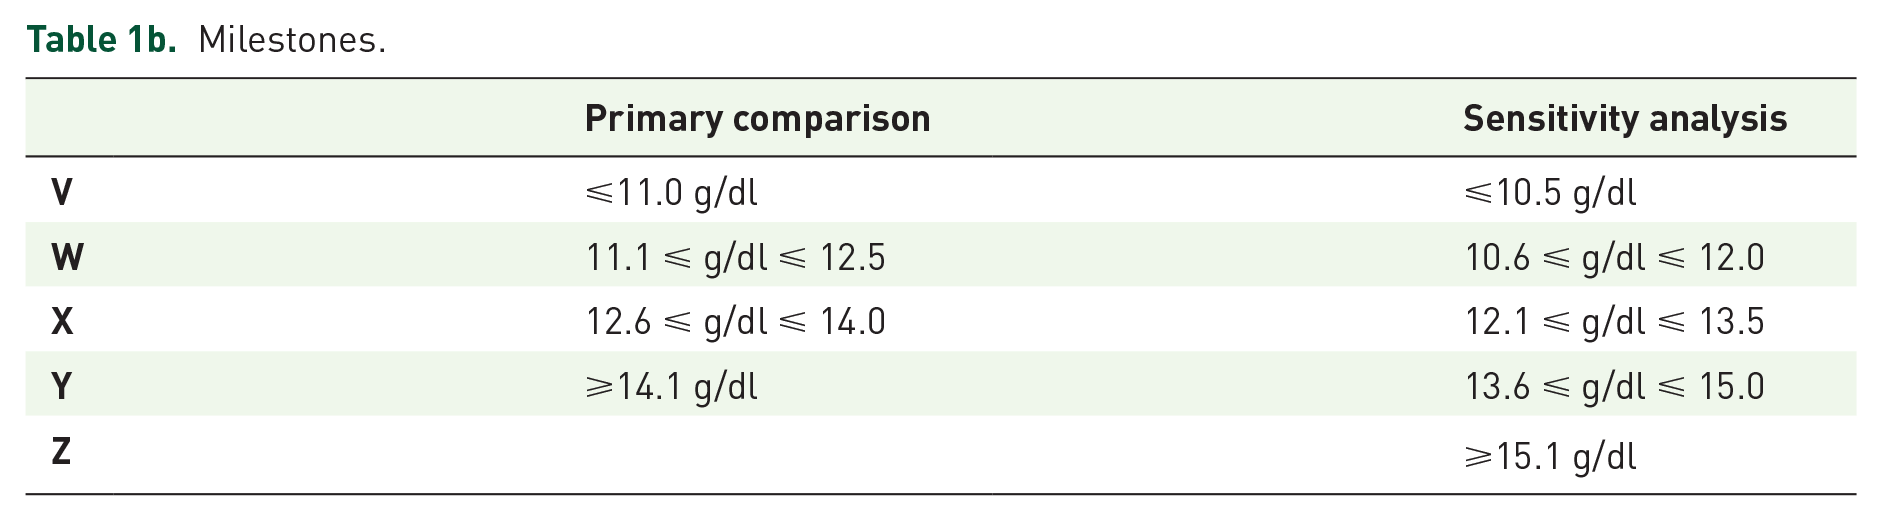
The Hb milestone criteria for the primary analysis used the lower target Hb (11.0 g/dl) recommended by the KDOQI Clinical Practice Guideline in the US, 31 increasing stepwise by 1.5 g/dl, including and beyond the upper target Hb (12.5 g/dl) in the UK NICE guideline. 33 The sensitivity analysis used the lower target Hb (10.5 g/dl) in the UK, increasing stepwise by 1.5 g/dl, including and beyond the upper target Hb (12.0 g/dl) recommended by the KDOQI.
Study population
Figure 1 details the study population inclusion and exclusion criteria. Inclusion: (1) diagnosis with CKD between 1 January 1990 (first availability of ESA) and 20 November 2011, (2) under continuous care ⩾ 180 days before an ESA prescription (baseline), (3) >18 years of age at index date (i.e. first ESA prescription date or cohort entry date), (4) >1 Hb test within 120 days before index date and >1 Hb test during follow up (valid if ⩾5 g/dl and ⩽20 g/dl). Exclusion: (1) MI, stroke or pregnancy during baseline, (2) diagnosis of cancer at any time, (3) kidney transplant or blood transfusion at any time. The cohort (96% nondialysis, 4% dialysis) was followed from the index date (first ESA treatment) to the end of database (Centricity®) activity.
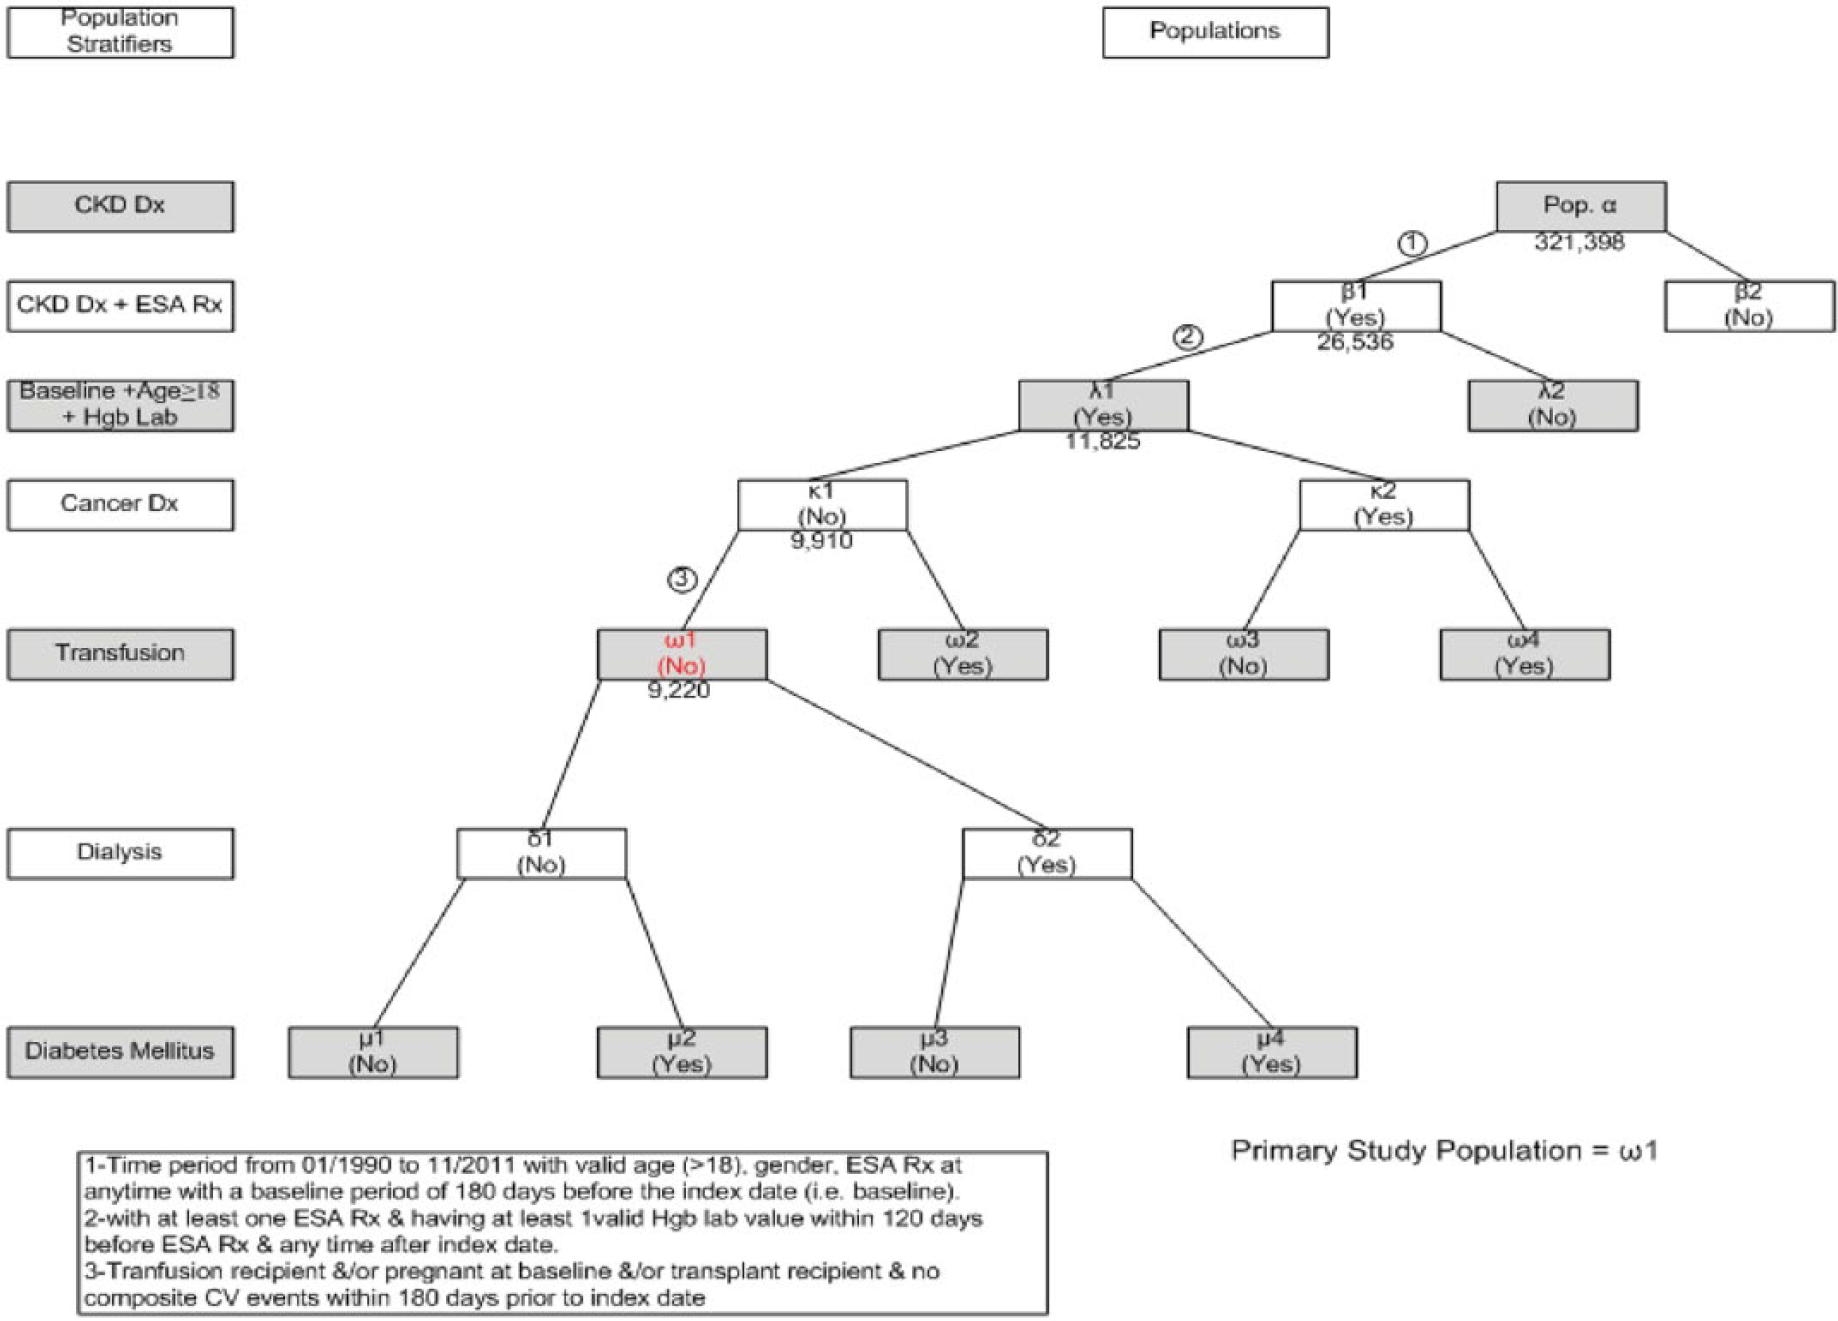
Study population.
The Centricity EMR database includes health records from over 35 million patients across 49 US states with location codes and demographic distributions similar to that of the overall US population. The database originates from over 1300 installations, including 30,000 clinicians, from mid- to large-size group practices, the majority of which are primary care providers. These data are prospectively collected and reflect routine medical care as practiced by each individual physician and medical practice, with visits, plans, treatment and testing scheduled and performed at the discretion of the treating physician.
Endpoints
The primary endpoint was a composite of fatal/nonfatal MI (ICD-9, 410.xx) and fatal/nonfatal stroke (ICD-9, 430, 431, 433.x1, 434.xx (excluding 434.x0), 436). Secondary CV outcomes are the individual events of fatal/nonfatal MI, fatal/nonfatal stroke, and heart failure (428.xx).
Covariates of interest and rationale
Covariates of interest, based on a priori considerations of clinical significance were: (1) baseline (within 180 days prior to the index date): age, sex, Hb level, hypertension; (2) history (any time during the preindex observation period) of: smoking (ever/never), dyslipidemia, heart failure, angina; (3) prebaseline: history of MI, stroke; (4) time dependent: diabetes, dialysis, and functions of Hb during follow up, such as the RoR (first Hb in highest milestone achieved, minus last baseline Hb, divided by time difference), maximum Hb slope (the largest slope between consecutive Hb measurements), highest milestone achieved and oscillations (a normalized measure of Hb variability, defined 60 as the number of changes of at least |1| g/dl between consecutive Hb measurements, divided by the number of Hb measurements per year).
Responses to ESA dosing are highly variable, with subsequent doses depending upon clinical condition and patient (hypo)responsiveness.23,61 Studies have related ESA responsiveness to clinical factors,62–66 with others relating dose to clinical factors necessitating the dose.23,67–70 A secondary analysis of an RCT, 21 a meta-analysis of RCTs, 22 and a few epidemiologic studies23–26 all suggested an association between CV risk and increasing ESA doses, particularly among poor responders. 21 The risk associated with dose did not necessarily correlate with the level of Hb, 21 or was shown to be independent from Hb levels 23 in predicting mortality. RCTs and epidemiologic study designs each have yielded conflicting dose-outcome results. The large RCTs13–15,20 all concluded that risk increased with higher Hb targets, with a dose-outcome relationship being seen with one secondary analysis, 21 while not in another. 61 Similarly, epidemiologic studies, with varying levels of nuance, have suggested that dose is both related24–26 and unrelated71–73 to adverse outcomes. These conflicting data have focused the dose-outcome debate toward the direct effect of dose escalation versus its role as a prognostic marker: that is, whether the risks are associated specifically with dose escalation 45 or whether the risks are associated with the ability to respond. 67
Hb variability has been related to a constellation of clinical factors such as comorbidities, inflammation, intercurrent events, endogenous and exogenous ESA levels, ESA dose, dosing algorithms, red blood cell (RBC) lifespan, (hypo)responsiveness, demographics and overall clinical status,60,74,75 and can be viewed as an integrated response of the patient and interpreted as a mathematical function of time and clinical condition. 60 The oscillation variable was, therefore, incorporated as a biologically rational, esemplastic ‘exposure’ variable 76 that was used as a surrogate for the above clinical constellation and which provided the additional benefit of model simplification.76,77 The primary endpoint chosen [composite of MI and stroke (fatal/nonfatal)] was based on the hydro-/hemodynamic principles surrounding viscosity.
Statistical analysis plan
Table 1a details the RoR categories used for incidence rate (IR) calculations and the primary analyses and Table 1b details the Hb milestones used for the primary comparison and in the secondary analyses. Group A is the flat/negative slope group (i.e. no increase or a decrease in Hb). For the primary comparison, group B remained group B (slow), groups C through F became group C′ (medium), and groups G and H became group D′ (fast). For the sensitivity analysis, groups B and C became group B′, and groups D through F became group C″. Group D′ remained defined as groups G and H.
Rate of rise and milestones.
Table 1a.
Rate of rise categorizations.
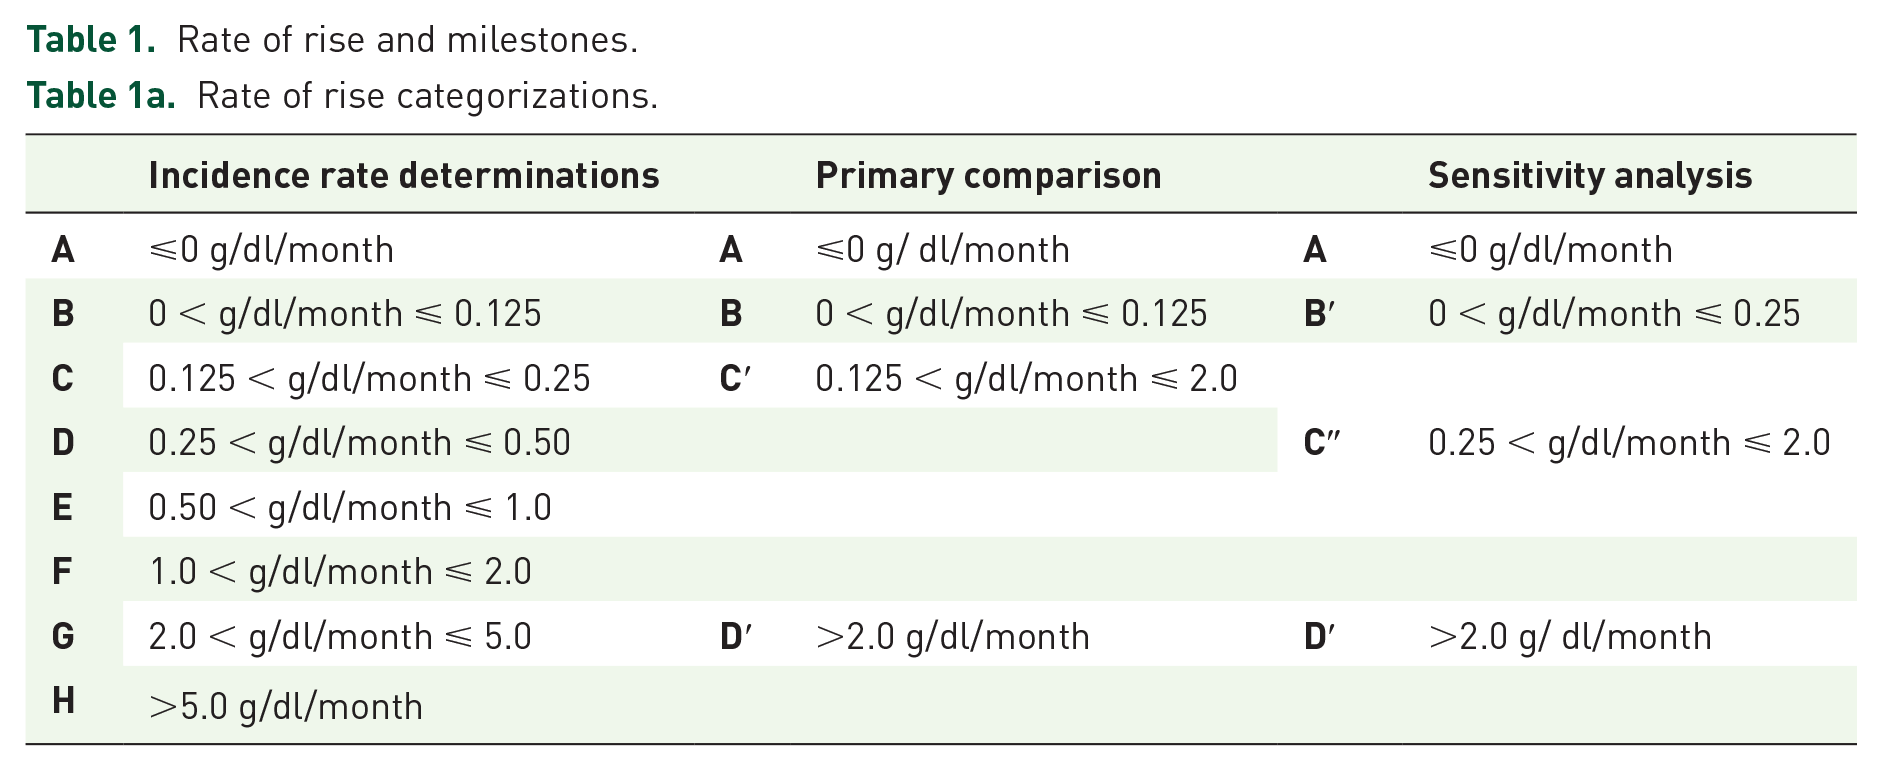
Milestones.
In an effort to follow a practical approach to variable selection, an empirical selection process was combined with the previously described causal (biologic) analysis by the subsequent fitting of a stepwise model. 78
To compare the IR in different RoR groups, a Cox proportional hazards model was fit. The primary comparison was a two-sided (α = 0.05) test of significance of the hazard ratio (HR) for RoR [group B (slow) versus group D′ (fast)] across all milestones in a Cox model adjusted for the full set of baseline covariates. A stepwise model was fit, which gradually added regressors and retained only significant covariates (p < 0.05). Hb RoR was kept in the model, and the 95% confidence interval (CI) and p value of its HR used to determine statistical significance.
Three secondary comparisons were performed within milestones: group B (slow) versus group D′ (fast), but restricted to patients within each corresponding milestone being achieved. If the primary comparison was significant, the Holm method 79 would be applied to correct for multiple secondary comparisons.
A Cox model was fit to data for patients in group D′ (fast) to perform comparisons across milestones in the primary categorization, with milestone ⩽ 11 g/dl in the position of reference, and milestones 11.1–12.5, 12.6–14.0, and ⩾14.1 serving as comparators. If every primary and secondary hypothesis test was previously rejected, the Holm method would be applied again to the three milestone comparisons, continuing until the first nonrejection.
The crude overall IRs of the secondary endpoints, MI, stroke and heart failure, were reported individually by RoR with 95% CIs. The results of the primary comparison, the HR of group B versus group D′ in a Cox model, were documented for each of the three endpoints, but interpreted with caution due to multiplicity.
Sensitivity analyses used the alternative milestone definitions for group B′ (0 < g/dl/month ⩽ 0.25) and group C″ (0.25 < g/dl/month ⩽ 2.0). Subgroup analyses by sex and diabetes status were performed. Data were analyzed with SAS v9.2 (SAS, Cary, NC, US).
Results
Characteristics of ESA patients qualifying for the primary analysis (n = 9220) are shown in Table 2, both for the overall population and according to RoR. The slowest RoR group (group B) had the smallest percentage of men, the youngest average (or median) age and the lowest frequency of heart failure history.
Patient characteristics at baseline by hemoglobin rate of rise to milestone.
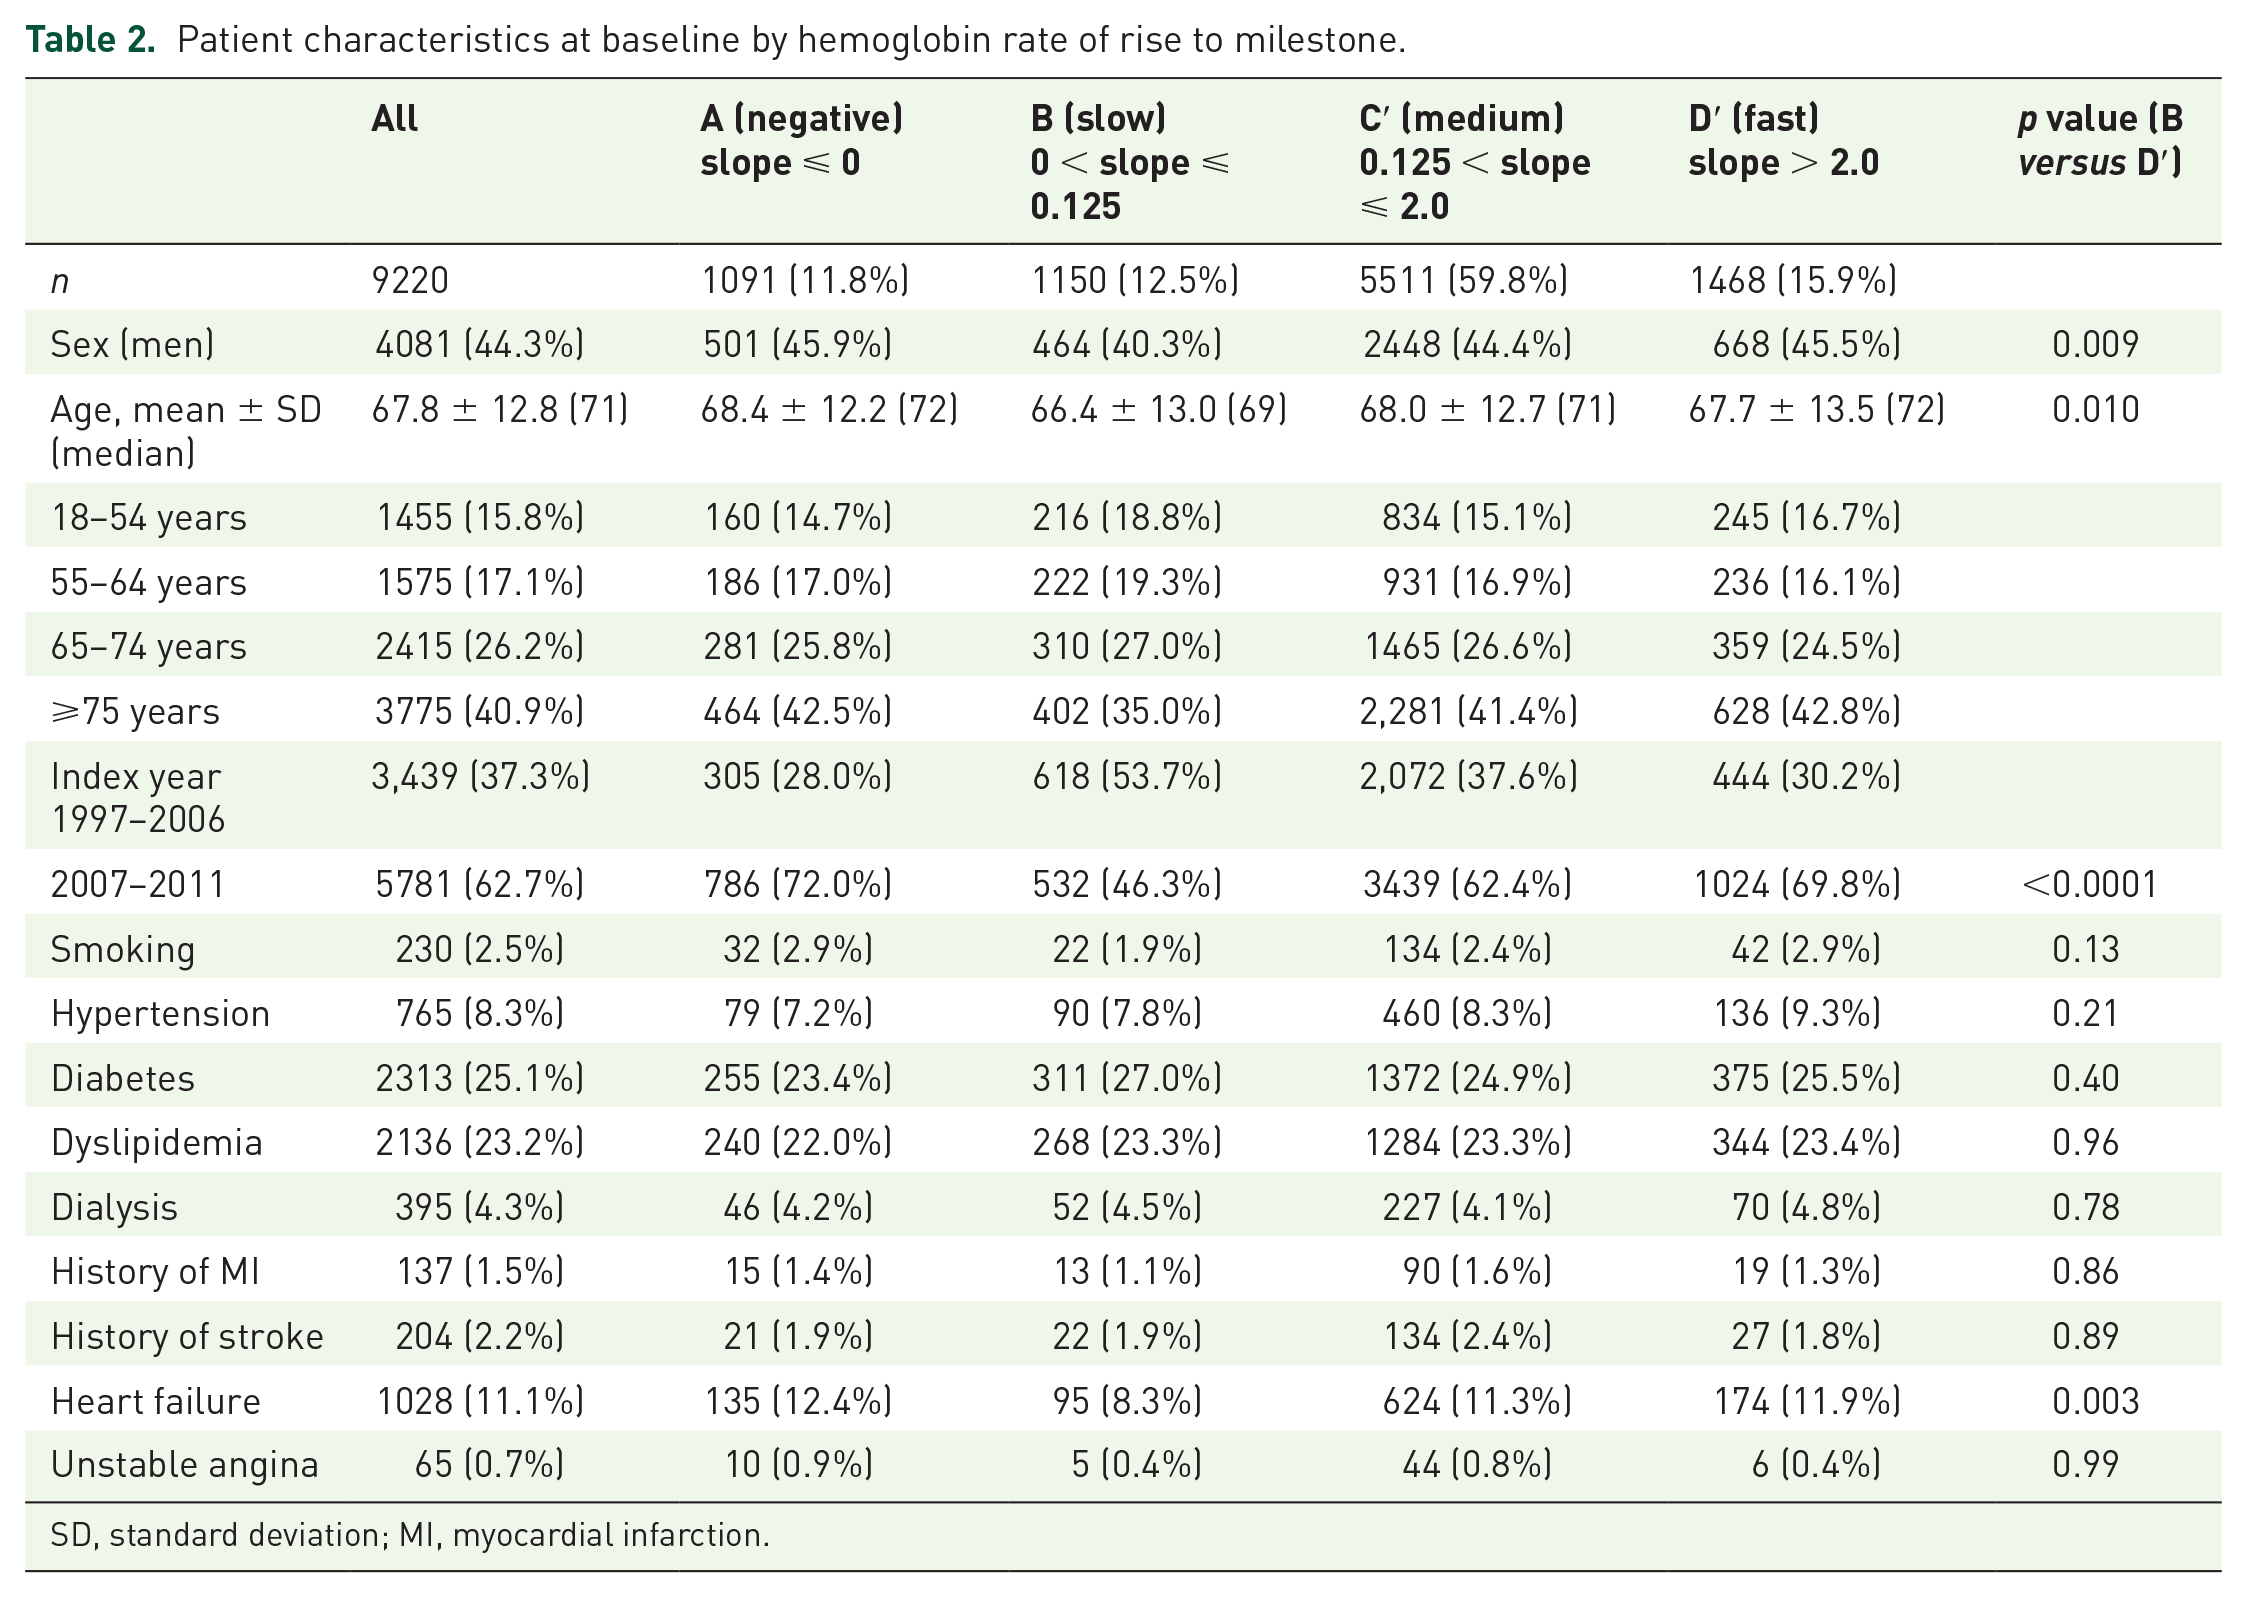
SD, standard deviation; MI, myocardial infarction.
Table 3 shows patient distribution and characteristics according to baseline Hb level and Hb milestone achieved. The average follow-up time to MI/stroke was 3.1 years for the entire cohort, with an average of 29 Hb measurements (median = 16) per patient. The follow-up time was longest in ‘slow’ group B, and shortest in ‘negative’ group A. The baseline Hb was highest in group A, descending sequentially through group D′ and maximum Hb slope ascended from group A through group D′ (a possible correlation between RoR and maximum slope). Oscillations exhibited a pronounced peak for group B, a group that may be more tightly monitored. A greater proportion (71.9%) of ‘slow’ group B reached the two highest milestones as compared to ‘medium’ group C′ (66.2%) and ‘fast’ group D′ (53.8%).
Patient characteristics related to hemoglobin measurements and follow up.
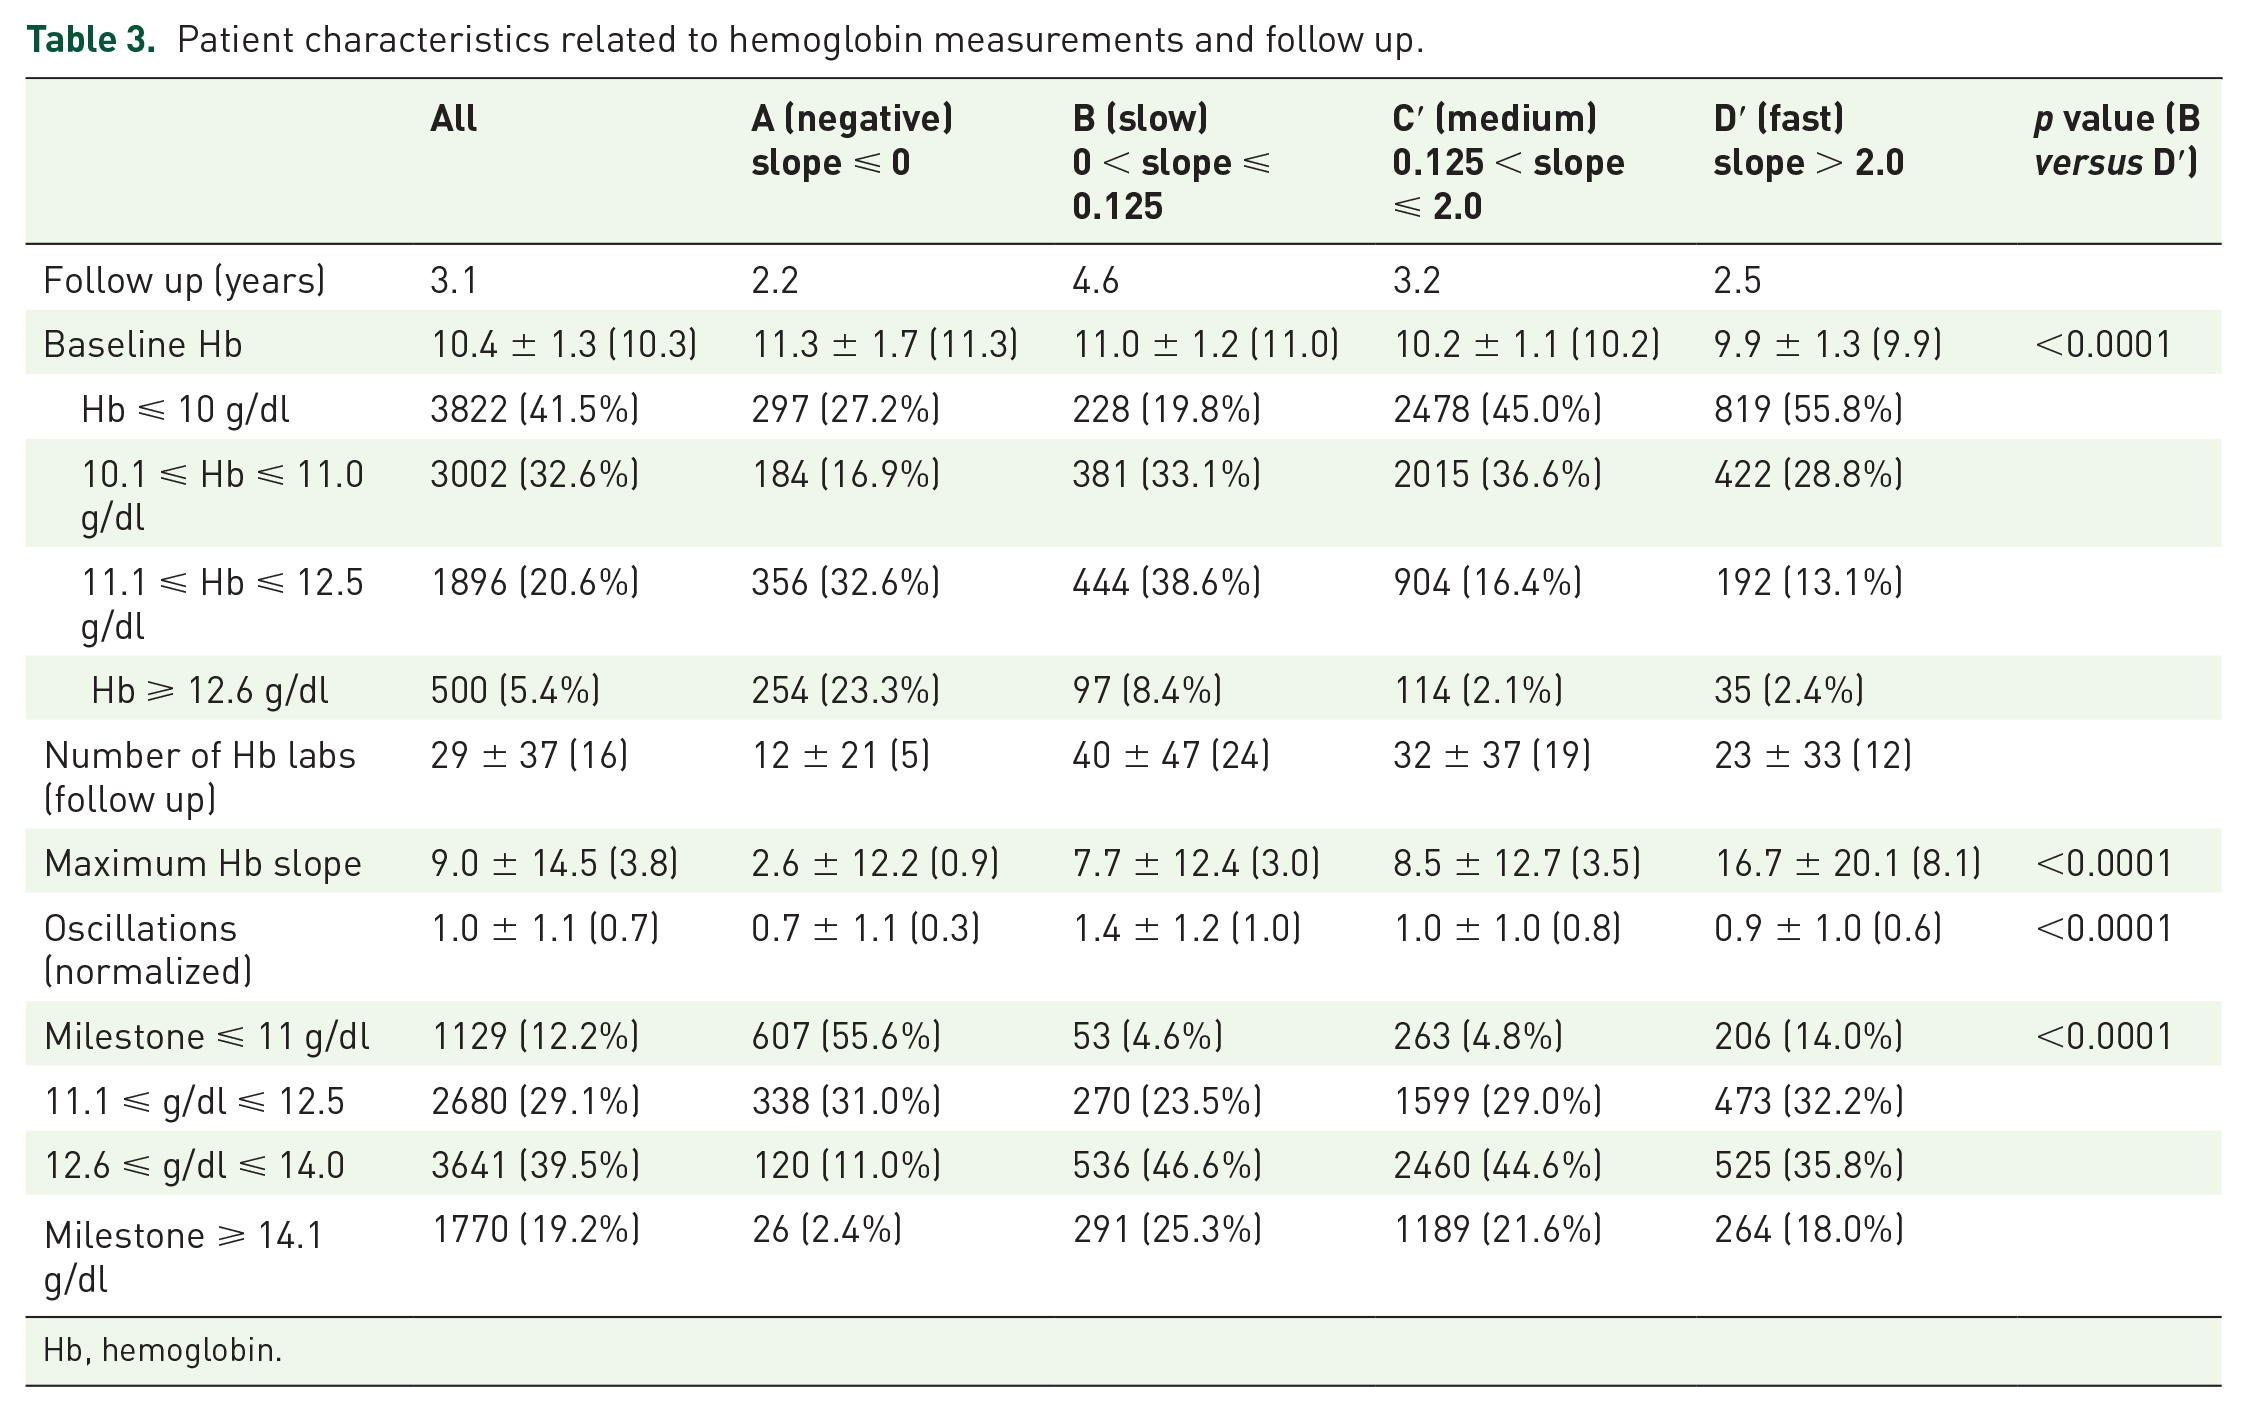
Hb, hemoglobin.
The data in Tables 4, 5a and 5b show the impact of RoR on adverse complications both across and within Hb milestones. The IRs for each RoR are shown in Table 4, and suggest that it is the RoR that drives complications, specifically when the RoR surpasses the ⩽0.125 g/dl/month threshold. Group B features a markedly lower IR for MI/stroke compared to all other RoR groups, its CI not overlapping those of any other group. Group H, with RoR above 5 g/dl/month, highlights a second critical threshold demonstrating more than twice the overall IR.
Incidence rates per 1000 person-years by hemoglobin rate of rise.
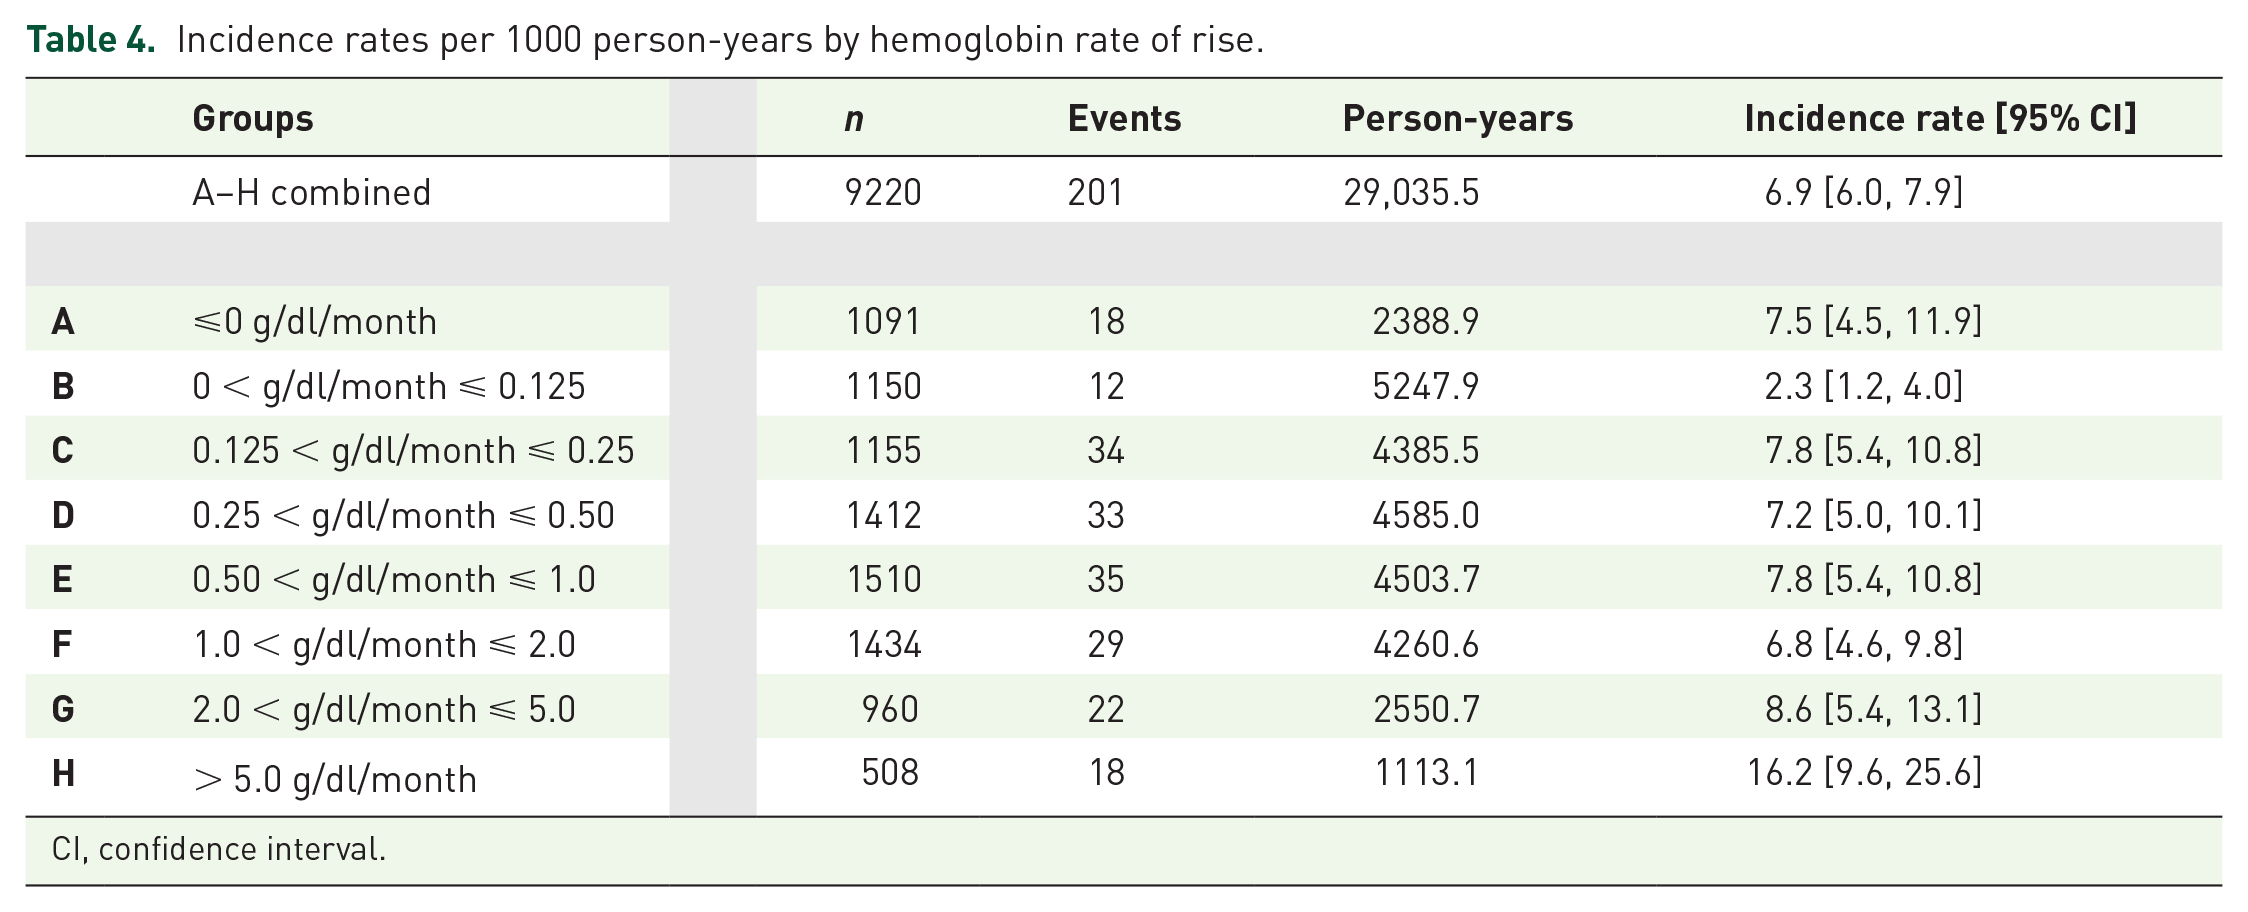
CI, confidence interval.
Hazard ratio comparisons.
Table 5a.
Hazard ratios throughout milestones [comparing trajectories B (slow), C′ (medium) and D′ (fast)].
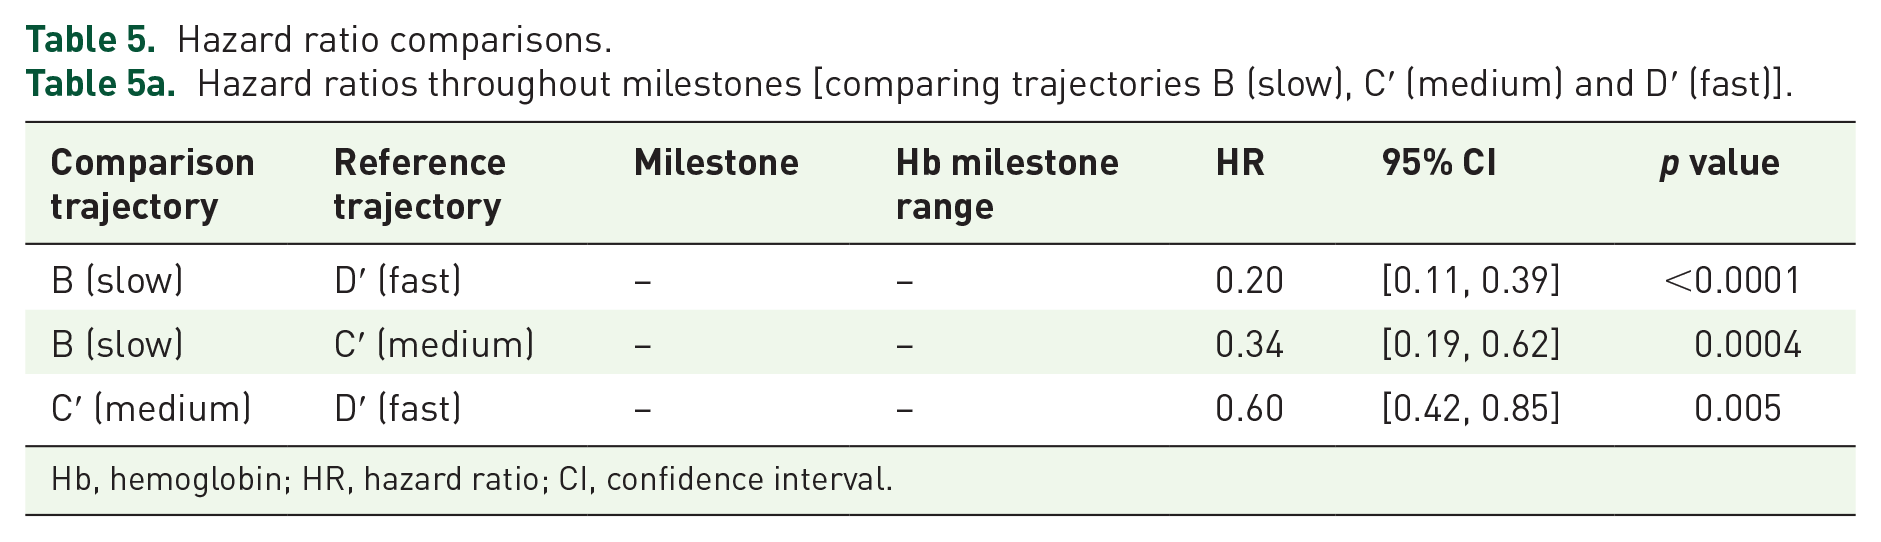
Hb, hemoglobin; HR, hazard ratio; CI, confidence interval.
Hazard ratios within Hb milestone achieved [comparing B (slow) versus D′ (fast)].
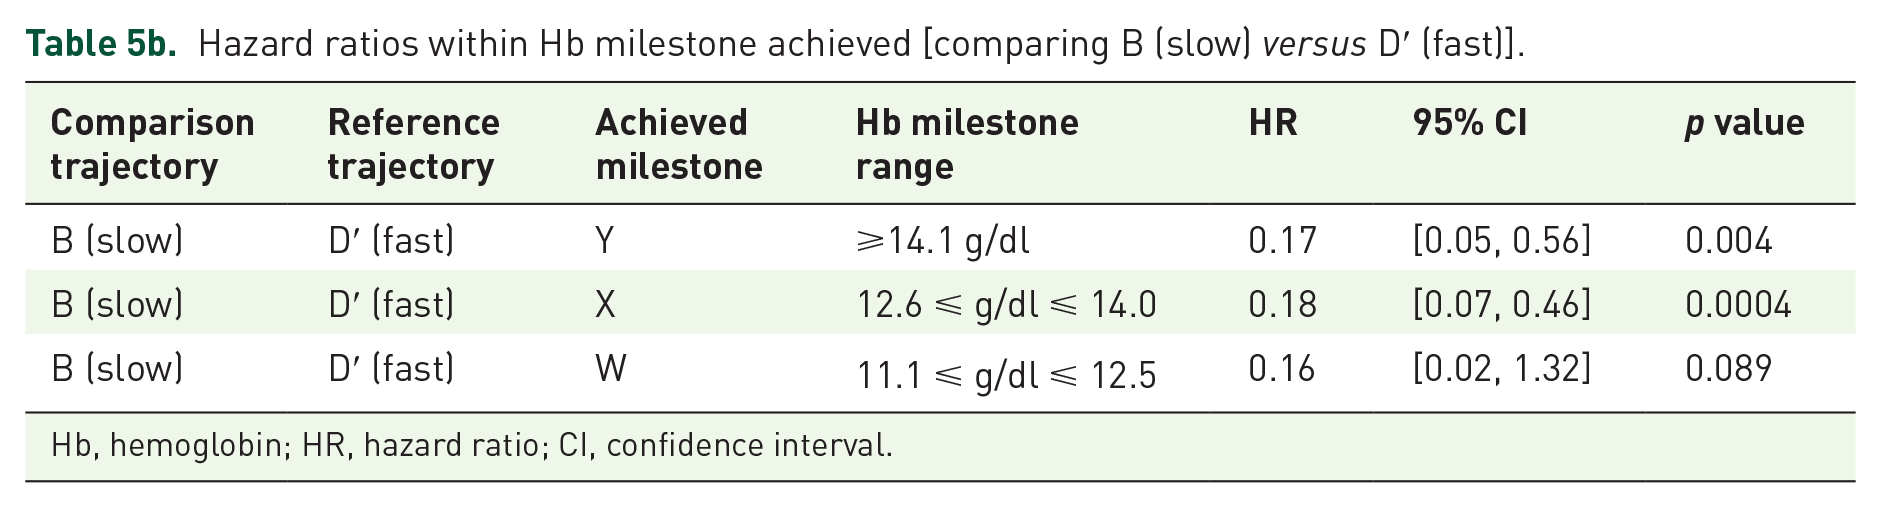
Hb, hemoglobin; HR, hazard ratio; CI, confidence interval.
Table 5a shows the main comparison detailing the degree to which RoR drives adverse complications: the ‘slow’ group B experienced statistically significantly lower risk compared to the ‘fast’ group D′ (HR = 0.20, [0.11, 0.39], p < 0.0001). The ‘slow’ group also achieved a markedly lower incidence rate with 1/3 of the risk when compared to the ‘medium’ group (HR = 0.34, [0.19, 0.62], p = 0.0004). Similarly, the ‘medium’ group had 60% of the risk of the fast group (HR = 0.60, [0.42, 0.85], p = 0.005).
Table 5b further details how RoR drives adverse complications, by comparing groups B and D′ within each Hb milestone achieved. The ‘slow’ RoR group had markedly lower IRs at each individual milestone and demonstrated statistically significant 79 within-milestone HRs of 17% and 18% that of the ‘fast’ RoR even in the two highest milestones. This demonstrates that, regardless of the Hb level achieved, the RoR determines outcome.
The overall trends for the composite endpoint remained consistent for each individual endpoint, with the ‘slow’ group having a lower risk than the ‘fast’ group for MI (HR = 0.21, [0.07, 0.63], p = 0.006), stroke (HR = 0.18, [0.08, 0.39], p < 0.0001) and heart failure (HR = 0.35, [0.25, 0.48], p < 0.0001).
For the sensitivity analyses, the HR for B′ versus D′ (HR = 0.47, [0.30, 0.74], p = 0.001) lies between the original B versus D′ and C′ versus D′ hazard ratios. Subgroup analyses showed similar trends by gender and by diabetic status, with IRs for diabetics 2–3 times that of the corresponding IRs of non-diabetics. More than 50% of the records lacked data on race, which was not included in the original modeling. Upon refitting the model, race finished the stepwise fit with p = 0.33, the group B versus D′ comparison remained significant (p = 0.0005), and all other trends remained the same, but with a loss of significance due to the power reduction. Excluding the dialysis (4%) population and analyzing only non-dialysis patients showed results nearly identical to those seen in Tables 5a and 5b.
Discussion
Using a large dataset on 9220 CKD patients with anemia receiving ESA therapy, this study compared different Hb RoR as to their association with CV events, and found that an Hb RoR of 0.125 g/dl/month is a threshold trajectory above which incidence rates of CV events rise steeply. This relationship does not appear to be linear; rather, there is an interceding plateau whereupon reaching the 5.0 g/dl/month threshold results in another marked increase in risk, raising the possibility of a second critical increase in viscosity. These data also suggest that raising the Hb in CKD patients is not in itself associated with a predictable effect on CV outcomes; an overall pattern strikingly similar to that seen in a previous RoR review. 80
These results raise the possibility that RoR, particularly the 0.125 g/dl/month threshold, rather than the target Hb per se, should be a primary consideration in the treatment of CKD anemia. Along the entire pathway, crossing all milestones, the ‘medium’ RoR group had more than a 1/3 reduction in risk compared to the ‘fast’ RoR group. Further, the ‘slow’ RoR group reduced the risk by another 2/3, resulting in an overall 80% reduction in risk between the ‘fast’ and ‘slow’ groups. A single a posteriori analysis showed that these same trends (data not shown) are observed for subjects starting from specific Hb levels (<10 g/dl, 10.1–11.0 g/dl, 11.1–12.5 g/dl). Furthermore, the ‘slow’ RoR group had markedly lower IRs within each milestone achieved, with HRs <1/5 that of the ‘fast’ RoR patients. This reduction in risk for the ‘slow’ RoR group held true even for those achieving ‘normal’ Hb levels (>12.5 g/dl).
Responses to ESA dosing are highly variable, and subsequent doses depend upon clinical condition and patient (hypo) responsiveness.23,61 Studies have related ESA responsiveness to clinical factors,62–66 with others relating dose to clinical factors necessitating the dose.23,67–70 Both RCT and epidemiology study designs each have yielded conflicting dose-outcome results. The large RCTs13–15,20 all concluded that risk increased with higher Hb targets, with a dose-outcome relationship being seen in one secondary analysis 21 while not in another. 61 Similarly, epidemiologic studies, with varying levels of nuance, have suggested that dose is both related24–26 and unrelated71–73 to adverse outcomes. These conflicting data have focused the dose-outcome debate toward the direct effect of dose escalation versus its role as a prognostic marker; that is, to whether the risks are associated specifically with dose escalation 45 or are associated with the ability to respond. 67
Studies have demonstrated the non-erythropoietin-stimulating, off-target effects of EPO/ESA such as the increased production of hyper-reactive platelets,81–84 induction of hypertension,38,85 thrombosis, 22 and elevation of inflammatory biomarkers. 86 These off-target effects, and the conflicting data regarding the dose-outcome relationship, point toward ‘dose requirement’ or ‘the inability to respond’ as being markers of poor clinical status and prognosis, and suggest that using high-dose ESA, 70 rather than the higher targets themselves, 87 increases the risk when attempting to achieve the higher, biologically beneficial Hb ranges.
This study evaluated the CV benefit:risk of anemia correction using a fundamentally different approach in an attempt to reconcile the conflicting results surrounding the ‘partial versus complete correction’, ‘dose-outcome’ and ‘dose escalation–prognostic marker’ debates: (1) this analysis specifically focused on a ‘fast versus slow’ comparison of rising trajectories rather than a ‘high versus low’ assessment of Hb target ranges, (2) the trajectory of interest (‘slow’ group B) was estimated by juxtaposing data from physiologic studies of renal function decline with epidemiologic studies of CKD, and (3) a simplified model was created by using the ‘oscillations’ variable as a substitute for the overall clinical condition including dose and dosing algorithms.60,88 Thus, ESA dose exposure and dose escalations were not considered as a priori variables in the model; indeed, an a posteriori review revealed that the accuracy of dosing data would not suffice for a sensitivity analysis. This approach may very well limit the interpretability of this study, however, a dose effect is unlikely to have influenced these results, because the slow RoR patients (group B) are more likely to be less responsive, even hyporesponsive, compared with patients in the rapid RoR group (D′), and thus would be considered less healthy and would also more likely be dose escalated all of which would tend to bias the results toward poorer outcomes in the slow RoR group B. Additional limitations include the possibility of residual confounding and the possibility of misclassification of outcomes, although the latter is doubtful given the endpoints used.89–93 Since most of the patients (~96%) were nondialysis CKD patients, generalizing these results to the dialysis population needs to be done cautiously. Likewise, specific Hb levels for treatment initiation, as well as dosing algorithms cannot, and should not be inferred from these results, as these were not specifically evaluated, and aside from limiting dose escalations, these results offer no implications for the management of off-target effects. Specific recommendations for establishing and maintaining a slow RoR would likely be derived from randomized, interventional study designs which may also possibly address the issues of residual confounding commonly impacting observational studies.
Hb variability is generally evaluated over a 3-to-6 month period using all available Hb measurements taken during this time frame. 60 Incorporating this threshold trajectory of 0.125 g/dl/month into the clinical management of anemia of CKD will require the use of these repeated measurements, as the current laboratory measurement techniques are insufficient to assess this trajectory with such precision. However, with repeated monthly measures over a 3-to-6 month period (0.125 × 3 = 0.375), it is quite possible to distinguish it from a rate of 0.150 g/dl/month (0.150 × 3 = 0.450) while still utilizing individual Hb measurements to guide dosing adjustments in order to navigate toward a target trajectory of 0.125 g/dl/month.
The various designs and analytical approaches applied to both RCT and observational data can yield (seemingly) irreconcilable results creating difficulties when interpreting the body of evidence. This can be particularly true when evaluating clinical trials alongside observational studies. Importantly, mimicking previously applied analytical techniques shows that the findings from previous RCT and epidemiologic studies can be replicated in this cohort: (1) the epidemiologic studies2,3,8,10 showed a benefit of achieving higher Hb targets (also seen in Table 6a), (2) the large RCTs13–15,20 showed a risk with treating to higher Hb targets (also seen in Table 6b), and (3) the FDA’s finding that RoRs > 0.5 g/dl/week (>2.0 g/dl/month) were associated with higher incidence rates (also seen in Table 4).
Incidence rates and hazard ratios by Hb milestone achieved.
Table 6a.
Incidence rates for all ESA patients by Hb milestone achieved (without regard to rate of rise).
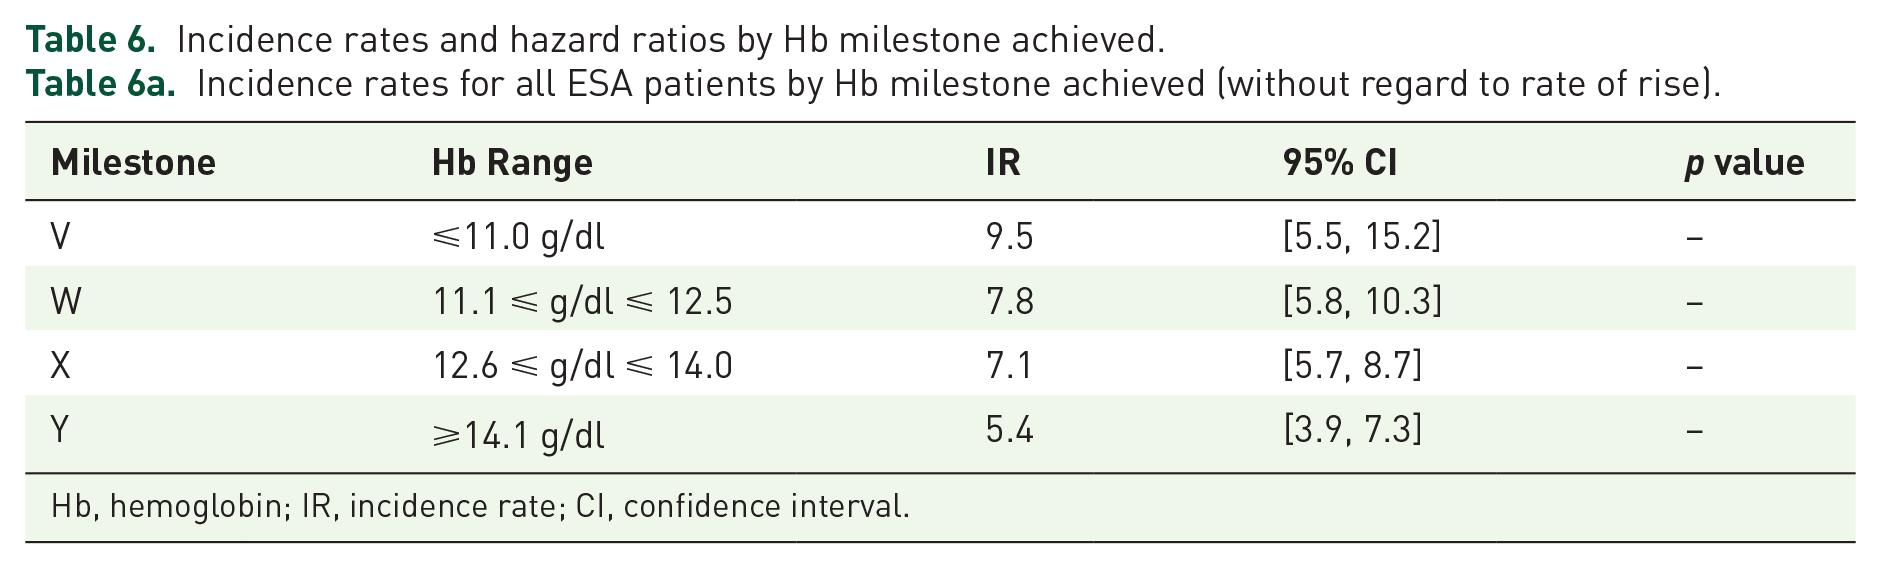
Hb, hemoglobin; IR, incidence rate; CI, confidence interval.
Hazard ratios comparing milestone achieved by following D′ (fast) trajectory.
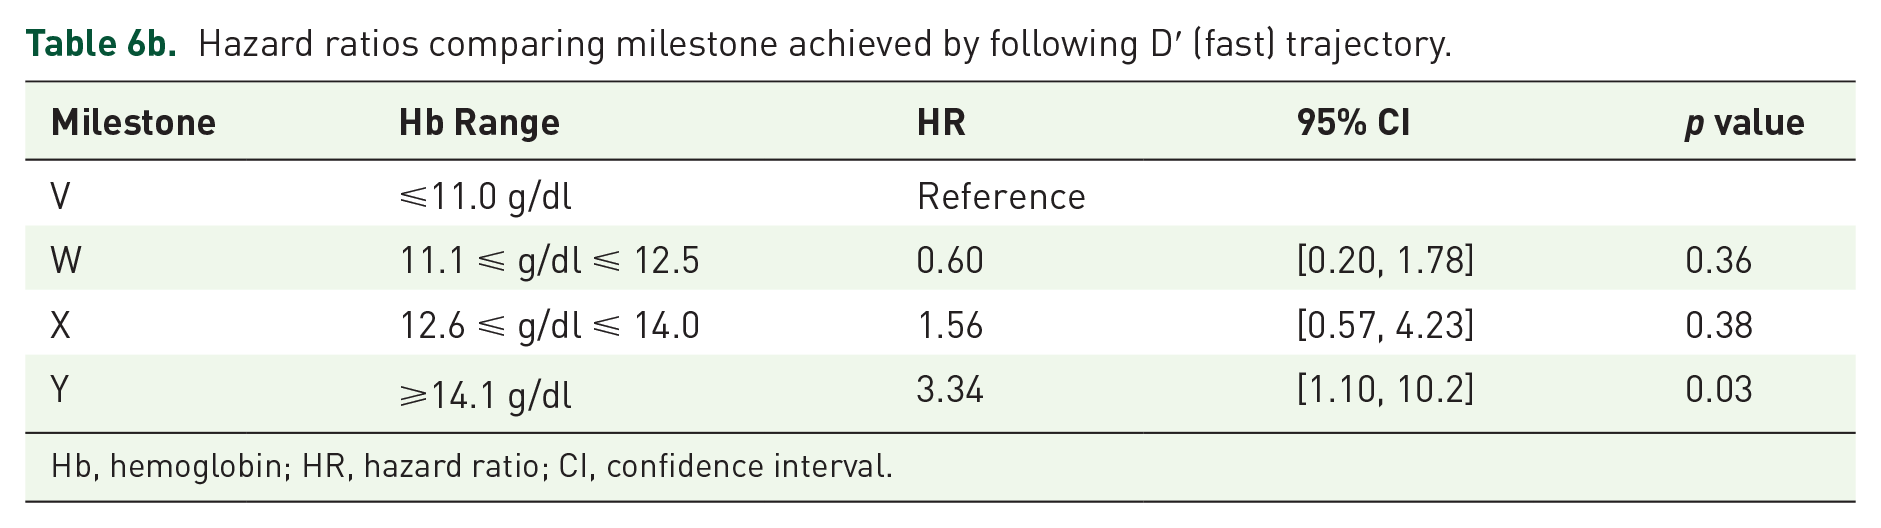
Hb, hemoglobin; HR, hazard ratio; CI, confidence interval.
In summary, these data are consistent with the FDA’s assertion in the labels for ESAs that a rapid Hb RoR may have harmful effects, and suggest that these effects may likely be due to changes in WBV. Debate continues as to the safety of Hb reconstitution to levels > 12 g/dl even with low doses. Lower doses may improve outcomes because of: (1) a lower RoR, (2) a reduction in off-target effects and (3) more constant erythropoietic stimulation; 66 the lower doses are more likely to propel patients along a slower trajectory and less likely to result in hyper-reactive platelet production, hypertension, inflammation, and thrombosis, while continuous erythropoietin exposure maintains RBC lifespan. These data raise the possibility that normalizing Hb may not in itself be harmful. By following a slow trajectory, maintaining continuous erythropoietin stimulation65,66 and reconsidering the definition of hyporesponsiveness, 60 it may be possible to safely reconstitute Hb/Hct while minimizing the risk of CV events and the unintended effects associated with ESA dose escalation and interruption.
Footnotes
Acknowledgements
SAS programming: Sudhakar Manne; content review: Thibaut Sanglier, Chris L. Pashos, Jennifer Lin; editorial review: Joyce Riffer, Manel Valdes-Cruz.
Funding
This research was supported by Takeda Pharmaceuticals International through licensing of data, licensing of analytical software and current or previous employment of various authors.
Conflict of interest statement
During the development of this study, GF has been employed by Epividian, Inc. and Takeda Pharmaceuticals International, AH has been employed by Sanofi Pharmaceuticals, Ionis Pharmaceuticals and Takeda Pharmaceuticals International, CV has been employed by Takeda Pharmaceuticals International, AS has been employed by Brigham and Women’s Hospital, PY has been employed by Takeda Pharmaceuticals International, LW has been employed by Wise Pharmacovigilance and Risk Management and Takeda Pharmaceuticals International. AS has served as a consultant for Sandoz, HIS Dialysis, Rockwell, Amgen, Roche, FibroGen, Keryx and Takeda and has received grant support from Johnson & Johnson, Concert, Genentech and Genzyme. AS and GF have executed a confidentiality agreement with Takeda for this study, and none of the authors have either requested or received compensation, outside of previous employment, for his or her contribution to this study.