
Abstract
Background:
The lower bound of the 95% confidence interval of measures of disproportionality (Lower95CI) is widely used in signal detection. Masking is a statistical issue by which true signals of disproportionate reporting are hidden by the presence of other medicines. The primary objective of our study is to develop and validate a mathematical framework for assessing the masking effect of Lower95CI.
Methods:
We have developed our new algorithm based on the masking ratio (MR) developed for the measures of disproportionality. A MR for the Lower95CI (MRCI) is proposed. A simulation study to validate this algorithm was also conducted.
Results:
We have established the existence of a very close mathematical relation between MR and MRCI. For a given drug–event pair, the same product will be responsible for the highest masking effect with the measure of disproportionality and its Lower95CI. The extent of masking is likely to be very similar across the two methods. An important proportion of identical drug–event associations affected by the presence of an important masking effect is revealed by the unmasking exercise, whether the proportional reporting ratio (PRR) or its confidence interval are used.
Conclusion:
The detection of the masking effect of Lower95CI can be automated. The real benefits of this unmasking in terms of new true-positive signals (rate of true-positive/false-positive) or time gained by the revealing of signals using this method have not been fully assessed. These benefits should be demonstrated in the context of prospective studies.
Keywords
Introduction
The quantitative methods based on disproportionality analysis (DA) [the relative reporting ratio (RRR), proportional reporting ratio (PRR) and reporting odds ratio (ROR)] are widely used in signal detection. In particular, the lower bound of the confidence intervals of these measures of disproportionality is popular in signal detection activities as it makes a signal of disproportionate reporting (SDR) less likely when the statistics are based on a small number of reports – that is, it is one approach to mitigate the false-positive burden in DA.1–3 Recent studies have highlighted the importance of the database for the performance of the methods used to perform the signal detection. 4
The masking (or cloaking or competition bias effect) of the quantitative methods of signal detection is a collateral effect of the data-mining algorithms which are based on DA, which was first described by Evans in his seminal study published in 2001.5–13 The masking is an effect by which an SDR5,14 for a given drug–event pair identified by quantitative methods might be suppressed because of the presence of another product in the same spontaneous reporting system database characterized by disproportionate reporting for the event of interest. To our knowledge, only two studies have estimated the extent and magnitude of the masking associated with the use of a disproportionality measure on two spontaneous reporting system databases, both using a mathematical algorithm.7,8
The public health impact of the masking is currently unknown, but some studies conducted on large databases have shown that rarely reported events, often of public health importance, were mostly affected by the masking. 7 In addition, an increasing number of studies tend to show that removing masking products can reveal signals of potential public health importance.7,8,10 For that reason, recent PROTECT-IMI good signal detection practices have recommended the use of an unmasking algorithm if the masking effect is a concern or is substantial. 4 IMI-PROTECT was a multinational research consortium composed of experts from academia, industry and health care. Its goal was the development of innovative tools to enhance the early detection and assessment of adverse drug reactions (ADRs). Its recommendations concerning masking were not prescriptive, being more of the nature of points for organizations to consider if contemplating implementation of masking/unmasking exercises on a global level or at the level of individual drug–event pairs.
The masking effect was originally associated with the (point pseudo-estimates of the) measures of disproportionality based on DA, such as the RRR, PRR and ROR, but not with their confidence intervals.6,15 Recent attempts have been made to develop an algorithm for the identification and quantification of the masking effect associated with the use of confidence intervals of measures of disproportionality. 11 These empirical studies have suggested the existence of a link between the masking effects associated with the measures of disproportionality and their respective confidence interval without producing any formal algorithm to quantify this effect in spontaneous system reporting databases. The recent approaches used to assess the impact and effect of masking associated with the use of the lower bound of the 95% confidence interval (Lower95CI) of the ROR on spontaneous reporting system databases mostly rely on empirical knowledge. 12
We have recently proposed an algorithm aimed at identifying the direction and magnitude of the masking effect associated with these measures. 9 This algorithm is based on the use of a simple intuitive metric called the masking ratio (MR). The MR provides a direct way to assess the direction (there is a masking effect if MR > 1, a revealing effect if MR < 1) and the magnitude of the masking effect (the value of the disproportionality will be multiplied by the value of the MR if the masking product for which it has been computed is removed from the analysis). However, there is currently no equivalent algorithm for the lower bound of the 95% confidence interval (Lower95CI).
We have developed a new mathematical algorithm based on the framework developed for the measures of disproportionality – the MR, which has been extended to the masking associated with the Lower95CI. We are proposing a variable called the MR for the lower bound of the 95% confidence interval (MRCI). This variable can be computed for all measures of disproportionality (Lower95CI for either RRR, PRR or ROR). We have explored the relation between the masking mechanisms associated with the measures of disproportionality and their respective confidence intervals. We discuss the consequences of this relation as well as the practical computational aspects associated with the implementation of this algorithm.
Materials and methods
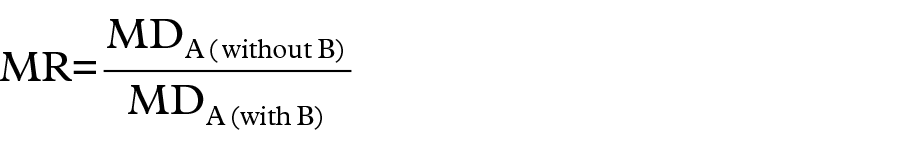
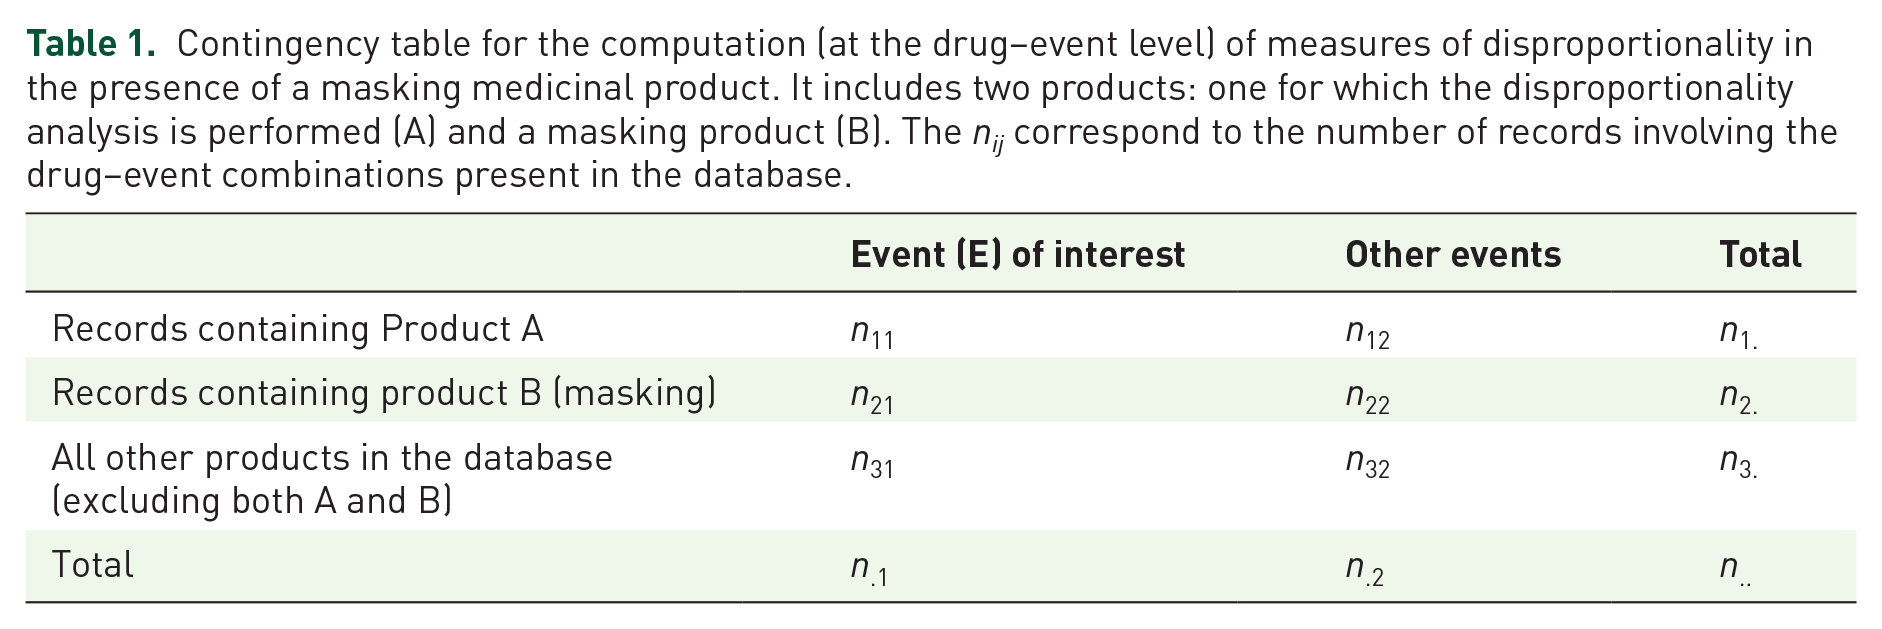
Considering a product (A) for which a DA is conducted, and a given masking product (B) and an event (E) of interest, we have previously defined the MR is defined as the ratio of the measures of disproportionality for product A, before (RRRA, PRRA or RORA) and after (RRRA(withoutB), PRRA(withoutB) or RORA(withoutB)) the deletion of product B (Table 1): 9
Contingency table for the computation (at the drug–event level) of measures of disproportionality in the presence of a masking medicinal product. It includes two products: one for which the disproportionality analysis is performed (A) and a masking product (B). The nij correspond to the number of records involving the drug–event combinations present in the database.
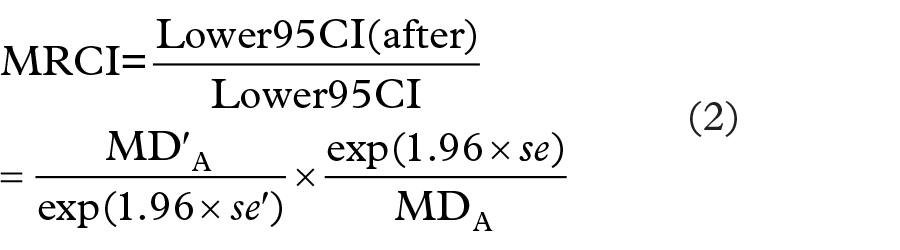
We have used the same rationale to devise a ratio that returns the exact value of the masking associated with a masking product B when the lower bound of the 95% confidence interval is used as a quantitative measure of signal detection to compute SDRs for product A. The MRCI is a confidence interval-based disproportionality metric calculated from a revised contingency table that isolates the masking product (Table 1). We simply divide the value of the lower bound of the 95% confidence interval before and after the removal of masking product B (Table 1) to obtain the exact value of the MR associated with the use of the confidence interval. We therefore define the MRCI for the Lower95CI for any of the measures of disproportionality (RRR, PRR or ROR) as follows:
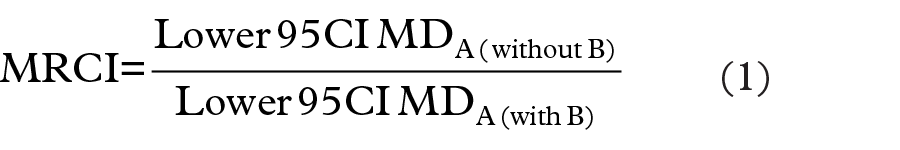
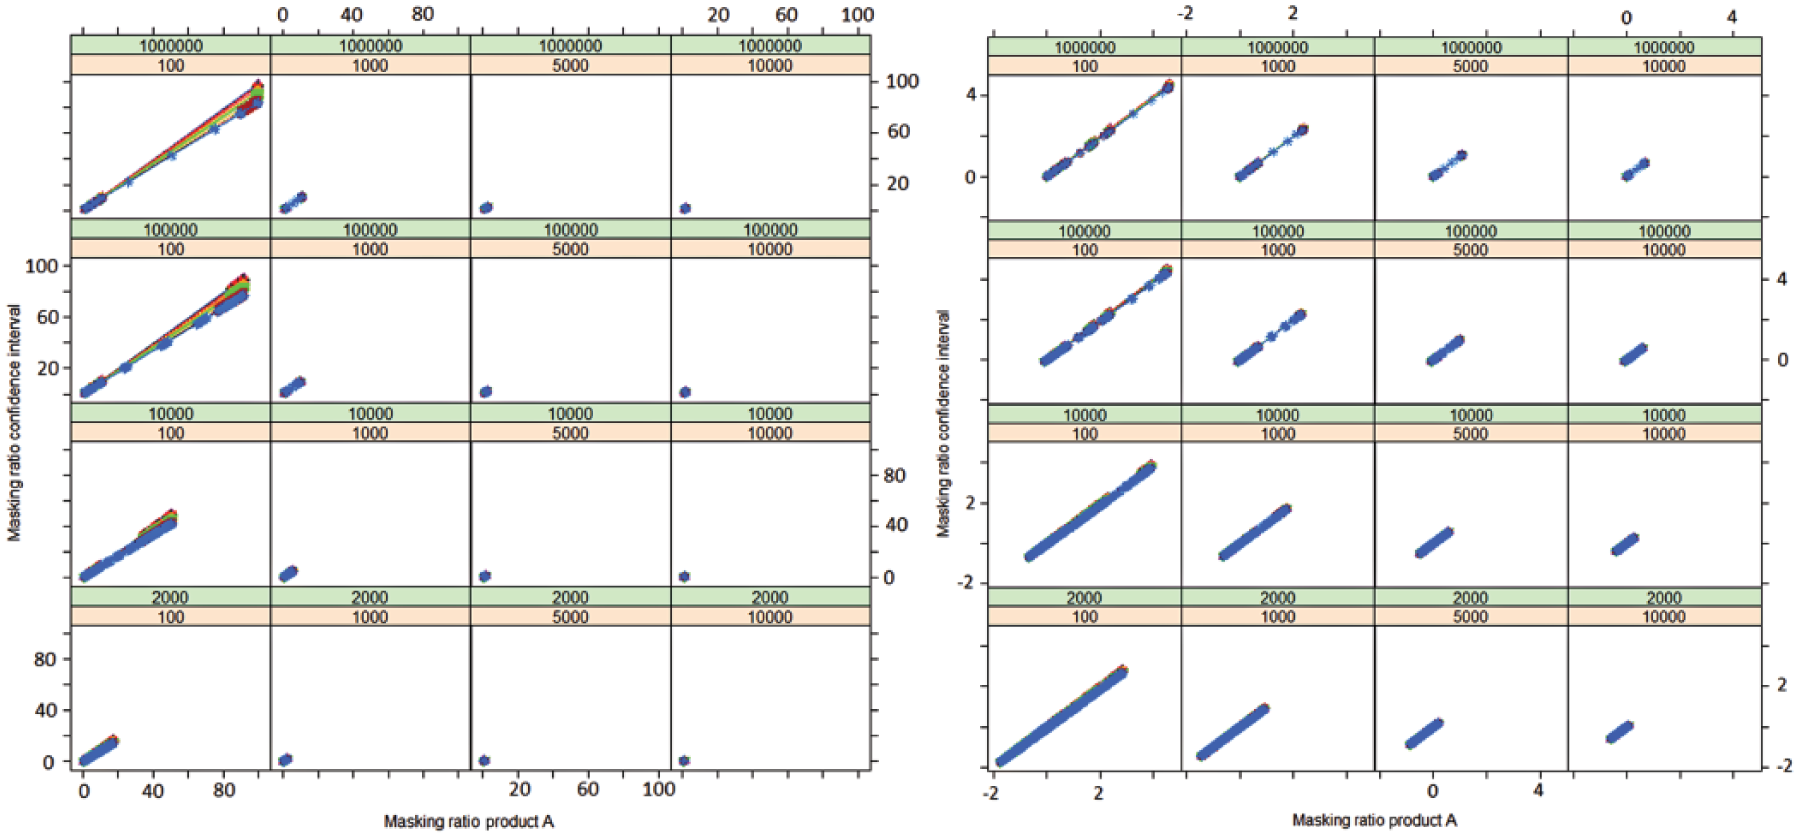
A masking effect is present when MRCI is >1. The direction and magnitude of the masking is given directly by the value of MRCI. The computation can be performed at the drug–event level (Table 1) or at the report level (Table 2).5,9 We have tested and validated our algorithm using a simulation of over 2,000,000 contingency tables and applied the different scenarios of allocation of the reports containing both the product of interest (A) and the masking product (B). The range of values selected for the different cells of the contingency table and the percentage of reports in common between the product of interest, product A, and the masking product, B, are displayed in Table 3. The number of simulated reports supposed to contain both products A and B were allocated to product A. We have used the PRR for our analyses of disproportionality.8,9,16 The exact MR for the PRR was used to perform all the computations of the MR for the lower confidence limit (Table 4). For each combination of the simulated values, we have calculated the initial PRR for the product A (PRRA) and the unmasked PRRA(WithoutProductB) (after removal of the masking product B), the confidence interval for the PRR before (Lower95CI PRRA) and after (Lower95CI PRRA[after]) the removal of the masking product as well as the corresponding MRs (MR for the PRRA), observed MRCI (Equation 1) and calculated MRCI (Equation 3).
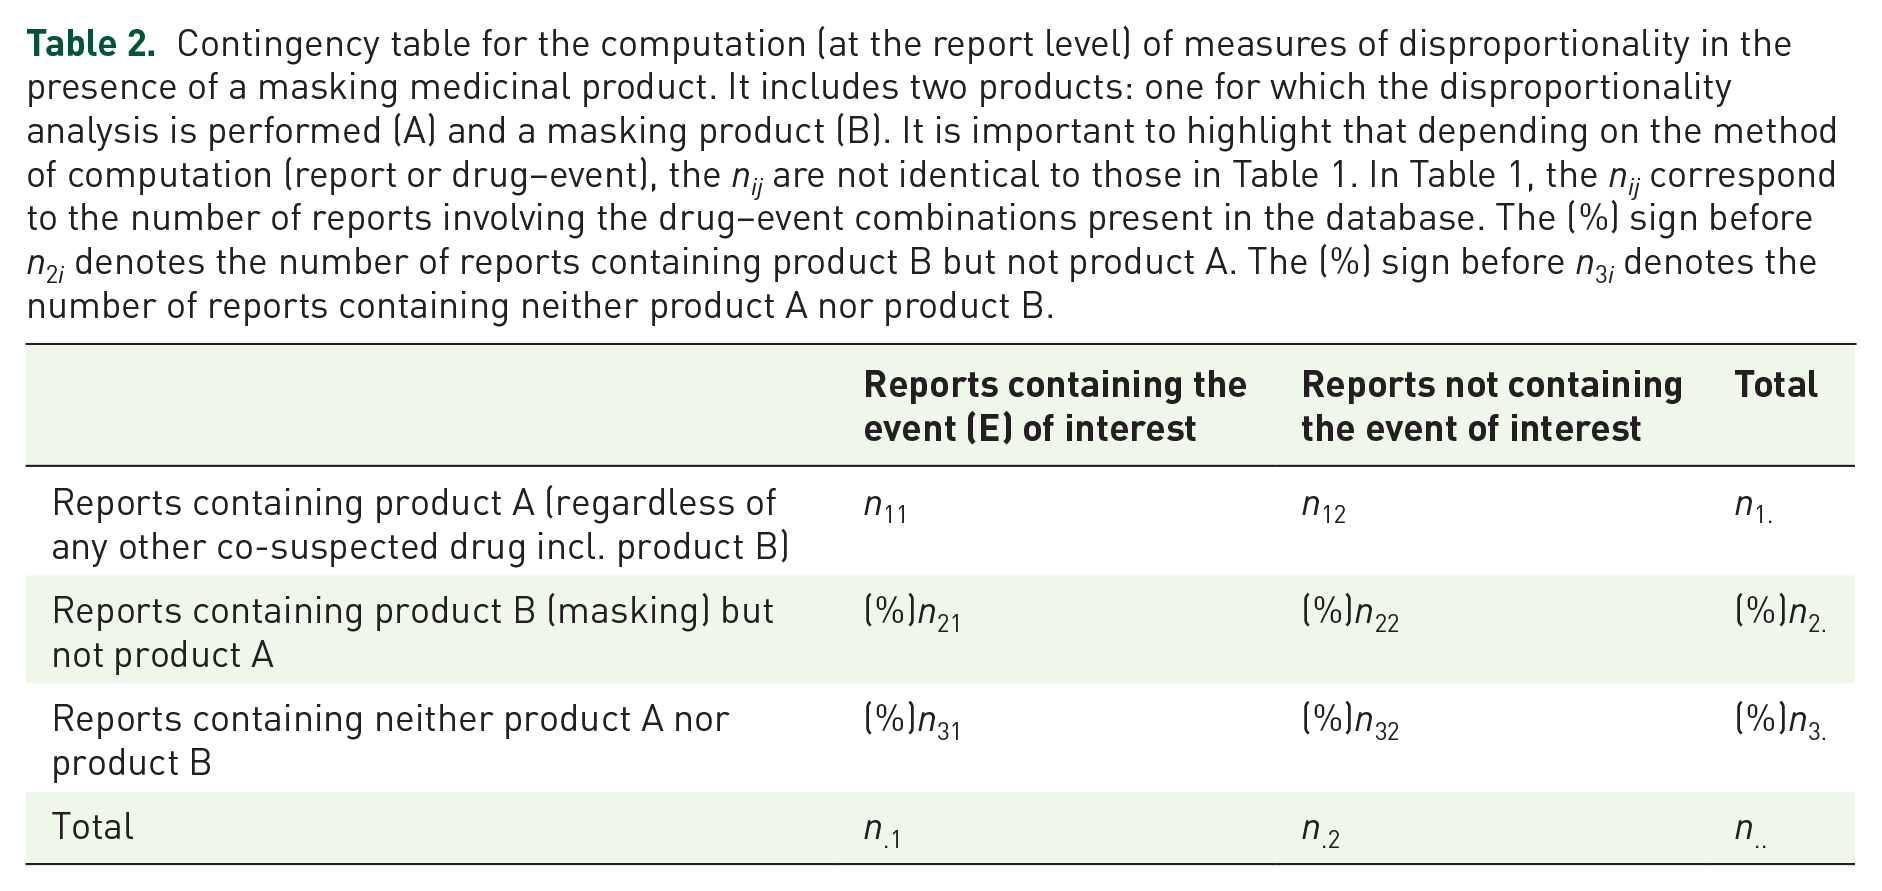
Contingency table for the computation (at the report level) of measures of disproportionality in the presence of a masking medicinal product. It includes two products: one for which the disproportionality analysis is performed (A) and a masking product (B). It is important to highlight that depending on the method of computation (report or drug–event), the nij are not identical to those in Table 1. In Table 1, the nij correspond to the number of reports involving the drug–event combinations present in the database. The (%) sign before n2i denotes the number of reports containing product B but not product A. The (%) sign before n3i denotes the number of reports containing neither product A nor product B.
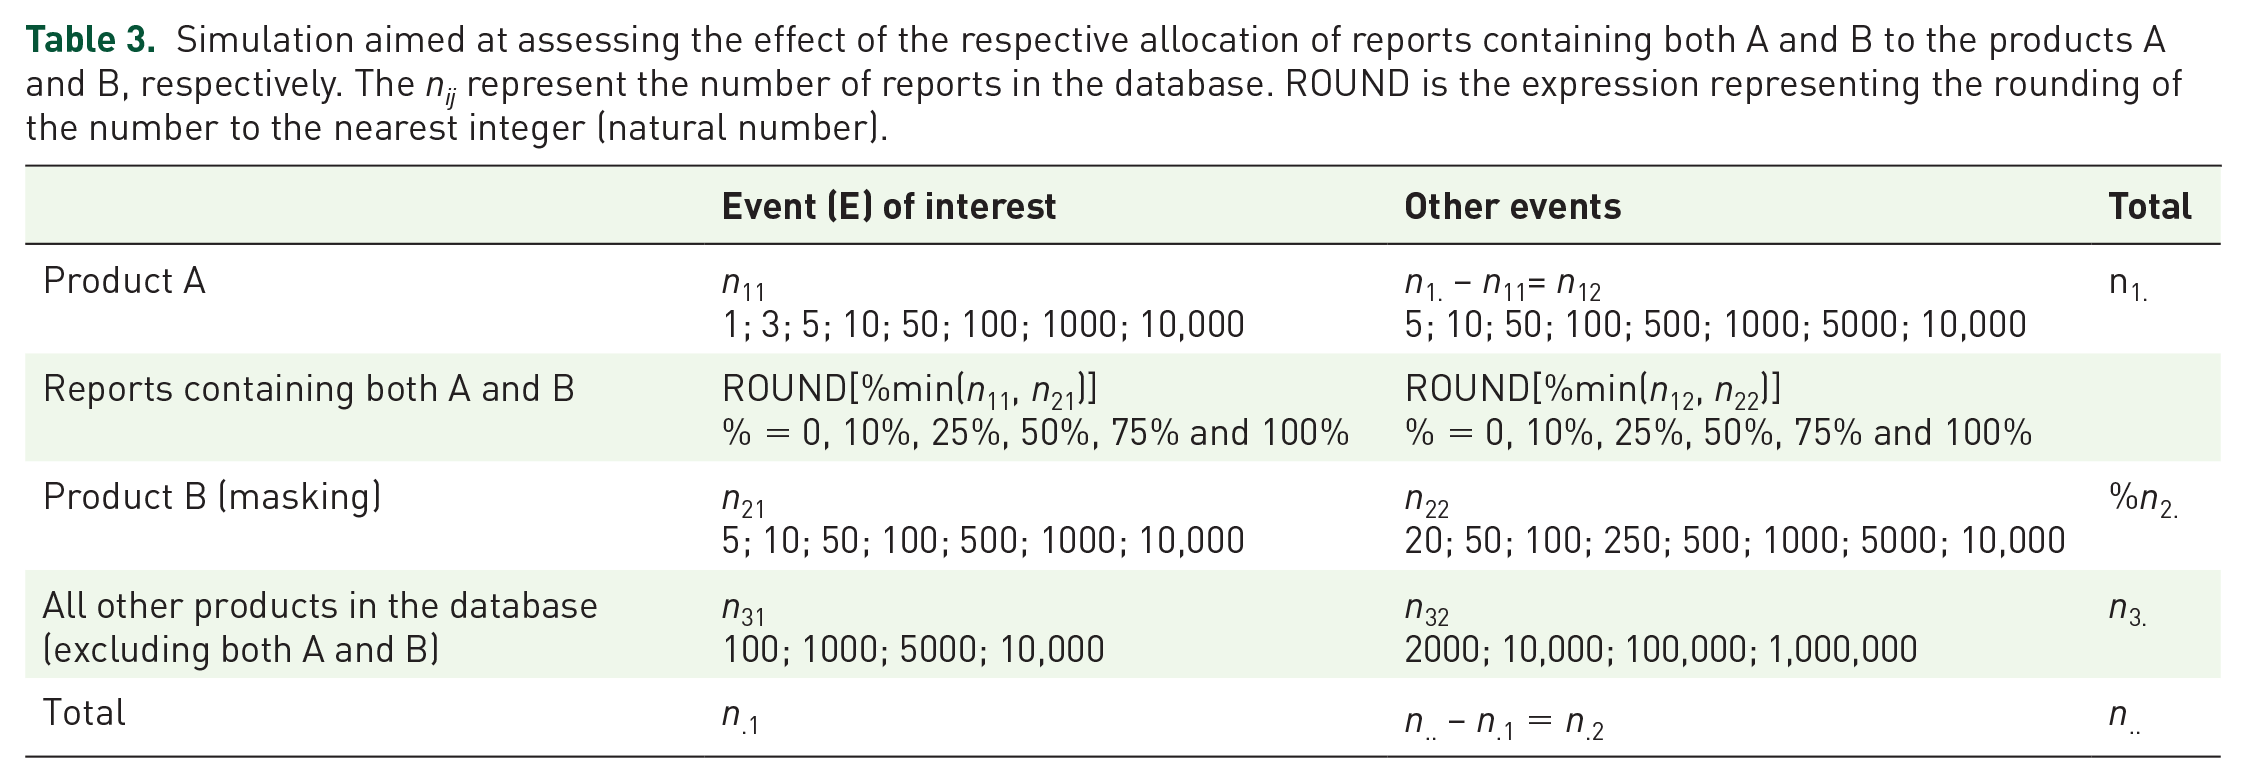
Simulation aimed at assessing the effect of the respective allocation of reports containing both A and B to the products A and B, respectively. The nij represent the number of reports in the database. ROUND is the expression representing the rounding of the number to the nearest integer (natural number).
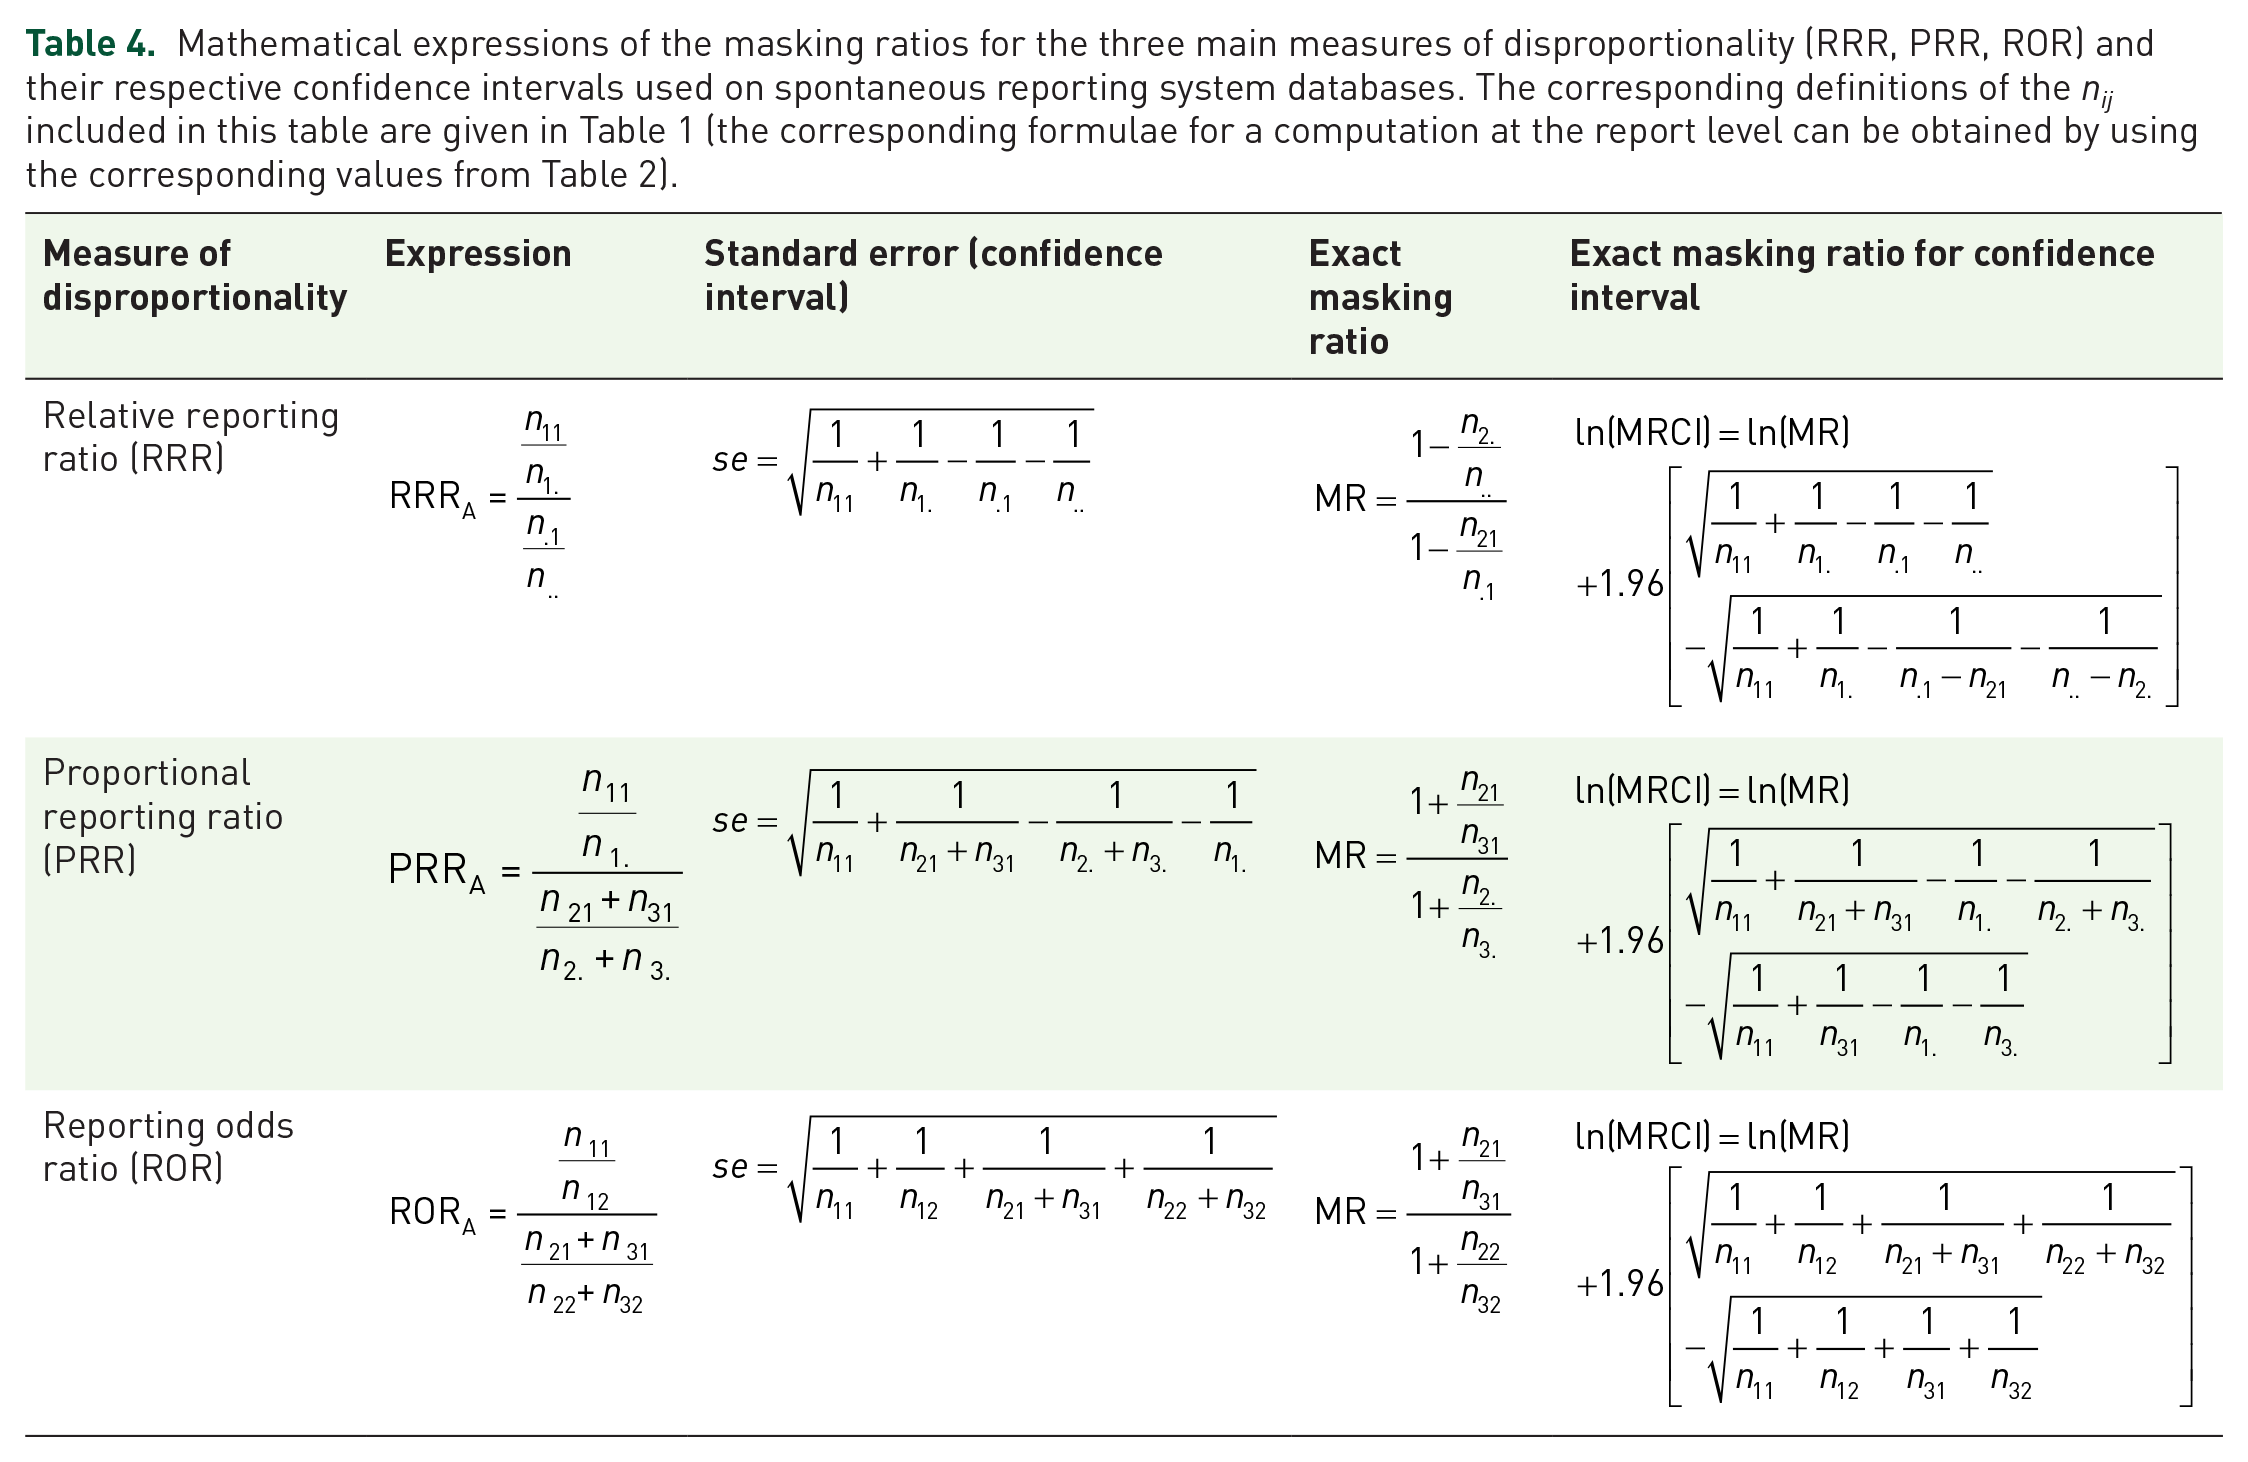
Mathematical expressions of the masking ratios for the three main measures of disproportionality (RRR, PRR, ROR) and their respective confidence intervals used on spontaneous reporting system databases. The corresponding definitions of the nij included in this table are given in Table 1 (the corresponding formulae for a computation at the report level can be obtained by using the corresponding values from Table 2).
We have used two sets of criteria to define SDRs, depending on whether we used the PRR or its lower interval limit: a number of three reports or above combined with either a threshold (>) of 2 for the PRR or 1 for Lower95CI. 14 A masking effect was defined by a value of MR or MRCI >1 affecting a record not originally involved in an SDR.
Results
Mathematical algorithm
Substituting in the formula of the 95% confidence interval of the measures of disproportionality for product A given by:3,17,18
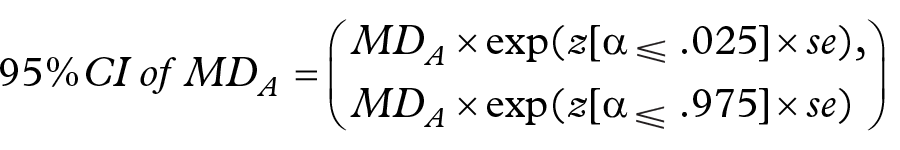
in our Equation 1, we obtain Equation 2:
where MD denotes the measure of disproportionality used in the analysis for product A before removal (MD) or after removal (MD′) of masking product B and se is the standard error (MD can either be the RRR, PRR or ROR). Taking the logarithm of Equation 2 gives:
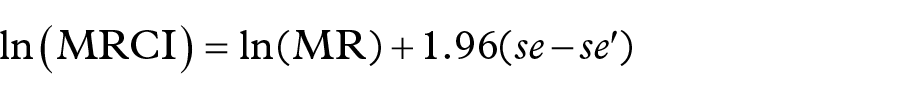
where se and se′ denote the standard errors of the confidence interval before (se) or after (se′) the removal of masking product B.
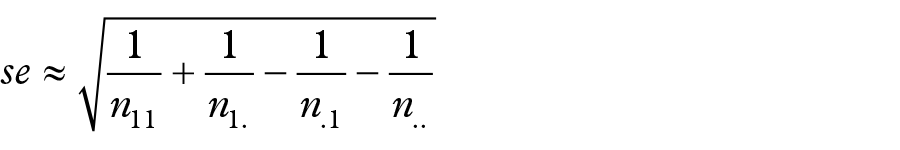
The asymptotic standard error of the logarithm of the relative reporting ratio (RRRA) is given by:3,14,17
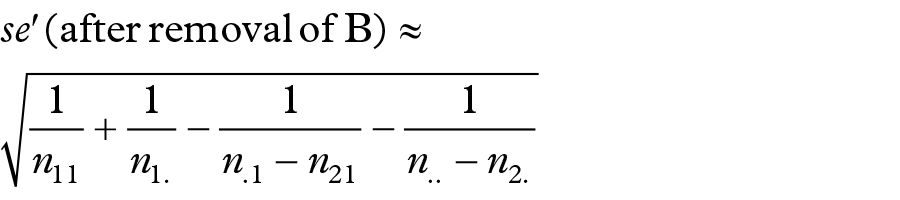
and the value of the approximate standard error of the logarithm of the RRRA(withoutB), after removal of masking product B (Table 1), is equal to:
The exact MRCI of the lower bound of the 95% confidence interval for the RRRA given masking product B is therefore equal to:
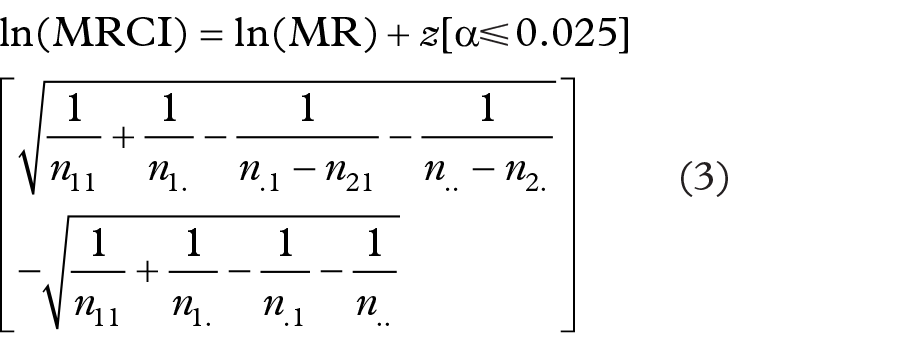
where
Noting that n.. is generally very large in spontaneous reporting databases, therefore
with
The study of the masking function associated with the use of the Lower95CI of the RRR provides some insight into the masking mechanisms associated with the use of the measures of disproportionality and their respective confidence intervals. The results are presented for the RRR; however, they remain valid for the other measures of disproportionality (it can easily be seen from the formulae in Table 4 and checked computationally that the values of the elements under the two square roots of the standard errors are similar, returning almost identical results across the different measures of disproportionality). If our assumptions concerning n.. and n2. are met, Equation 4 shows that MRCI varies from MR, when n21 is equal to zero (no masking effect), to infinity as n21 tends to n.1.
Assuming that n.., n1., n.1 are large (e.g. >100), an approximation of MRCI (for the RRR) can be obtained from Equation 4:
that is,
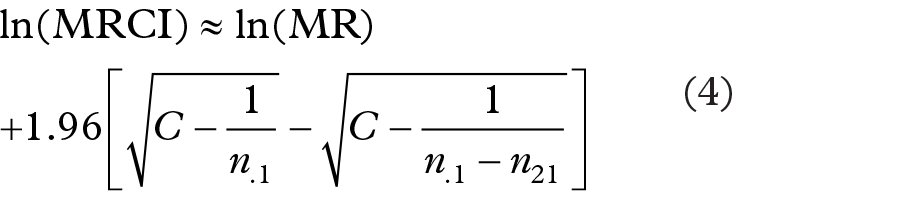
This approximation of the MRCI shows that the percentage of reports (x) containing the masking product (n21) among the reports for the reaction of interest (n.1) dramatically influences the magnitude of the masking associated with the confidence interval. However, the number and the percentage of reports involving the product for which the DA is conducted (n11) also play an important role in the shape of the resulting masking function of MRCI (Figure 1).
Shape of the masking function depending on the respective number and proportion of reports involving the product A of interest (n11) among all the products for the reaction of interest (n.1). The plot was computed for values of n11 of 5 reports and values of n.1 of 10 reports (i.e. n11 representing 50% of the total number of reports for the reaction of interest). x = n21/n.1 (from 0 to 0.5), y = n.2/n.. (from 0 to 0.95) and z is the value of MRCI.
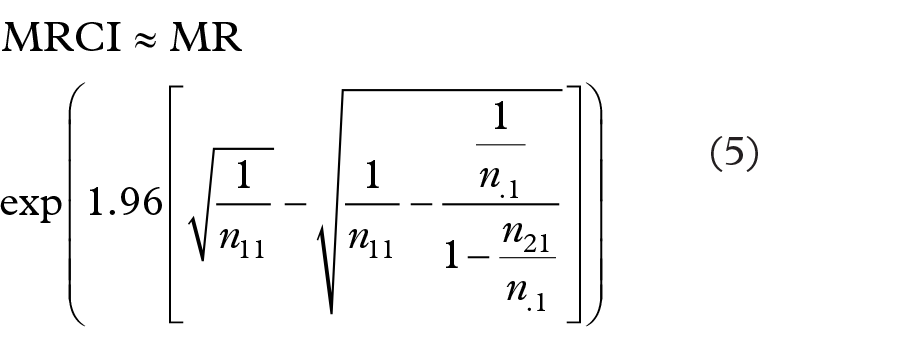
Unlike for the masking function associated with the RRR, which is hyperbolic regardless of the value of the ratio n21/n.1, the masking function (Equation 5) associated with the Lower95CI can take different shapes depending on the total number of reports for the reaction of interest (n.1) and the number of reports of that event involving the products of interest (A) (n11) among the total number of reports containing the reaction of interest (n.1) (Figures 1 and 2). When the percentage of reports involving product A in the total number of reports for the reaction of interest is <10% (i.e. when the contribution of the expression in the exponential part of the function becomes negligible), the masking function is hyperbolic, which provides two interesting features: first, the masking has a ‘buffering zone’ (for values of x approximately included between 0.1 and 0.7) in which the masking does not increase importantly as x increases (Figure 3). Second, and more importantly, the magnitude of the masking effect can be estimated with a simple hyperbolic function from the value of the ratio x = n21/n.1. Unfortunately, under other circumstances these two convenient properties are lost with the masking effect associated with the use of Lower95CI. This implies that simple rules proposed in previous studies that can be used to approximate the MR only provide a satisfactory estimate of the MRCI when the multiplication factor is close to 1. The multiplication factor only remains close to 1 when the number of reports involving the reaction of interest (n.1) is important (e.g. >100) and as long as the proportion of reports involving the product of interest (n11) remains low compared to n.1 (e.g. <10% of the reports for the reaction of interest) (Table 5). This important finding implies that the properties of the approximate MR that we describe above can only be extended to the MRCI when these two conditions are met.
Shape of the masking function (value of MRCI) depending on the respective number and proportion of reports involving the product A of interest (n11) among all the products for the reaction of interest (n.1). The plot was computed for values of n11 of 5 reports and values of n.1 of 50 reports [i.e. n11 representing 10% of the total number of reports for the event (E) of interest]. x = n21/n.1 (from 0 to 0.95) and y = n.2/n.. (from 0 to 0.95) and z is the value of MRCI. The graph shows that under these circumstances the masking function is hyperbolic.
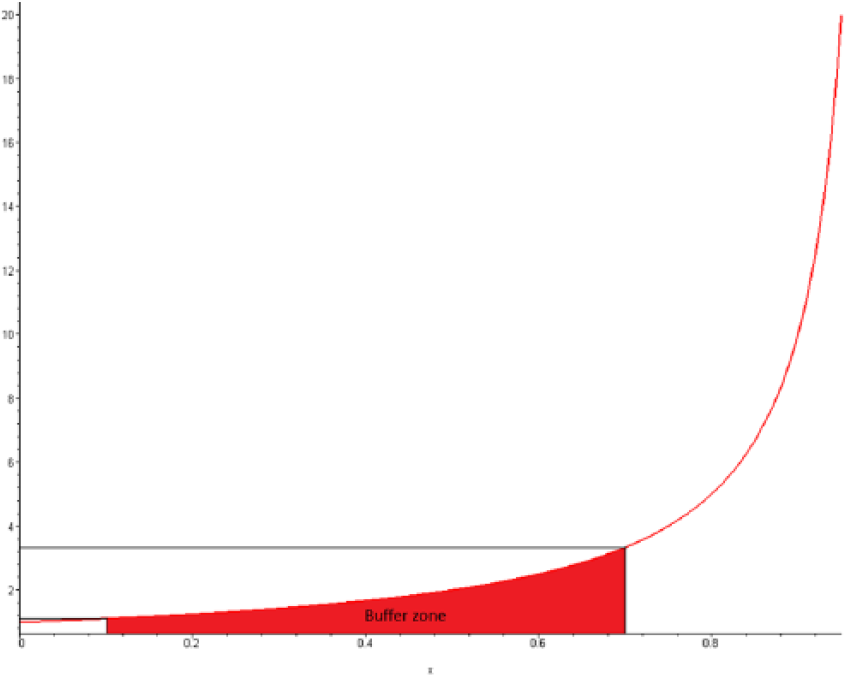
The graph is a cross-sectional view of the value of the masking ratio (y) as a function of the proportion of reports containing the masking product B (but not the product of interest A) among the total number of reports containing the event (E) of interest (n.1). The graph shows the buffering zone of a hyperbolic masking function. This zone is included between proportions of reports from 0.1 to 0.7. The value of MRCI increases dramatically when the proportion %n21/n.1 is above this value.
Computation of the masking ratio for the PRR and masking ratio for its confidence interval under the scenario that n2. and n3. are large (>100 reports) with n2./n3. = 0.005 and n1. = 100. The percentages represent the proportion of reports including the masking product B among the total number of reports involving the reaction of interest (n21/n.1). The table shows that the masking ratio (for the confidence interval) cannot be easily estimated since the multiplication factor differs from one when the number of reports for the reaction of interest (n.1) is <100 and x is high (above 50%). The cells in red highlight the computations for which MF < 0.95. N/A denotes that the computation is not applicable.
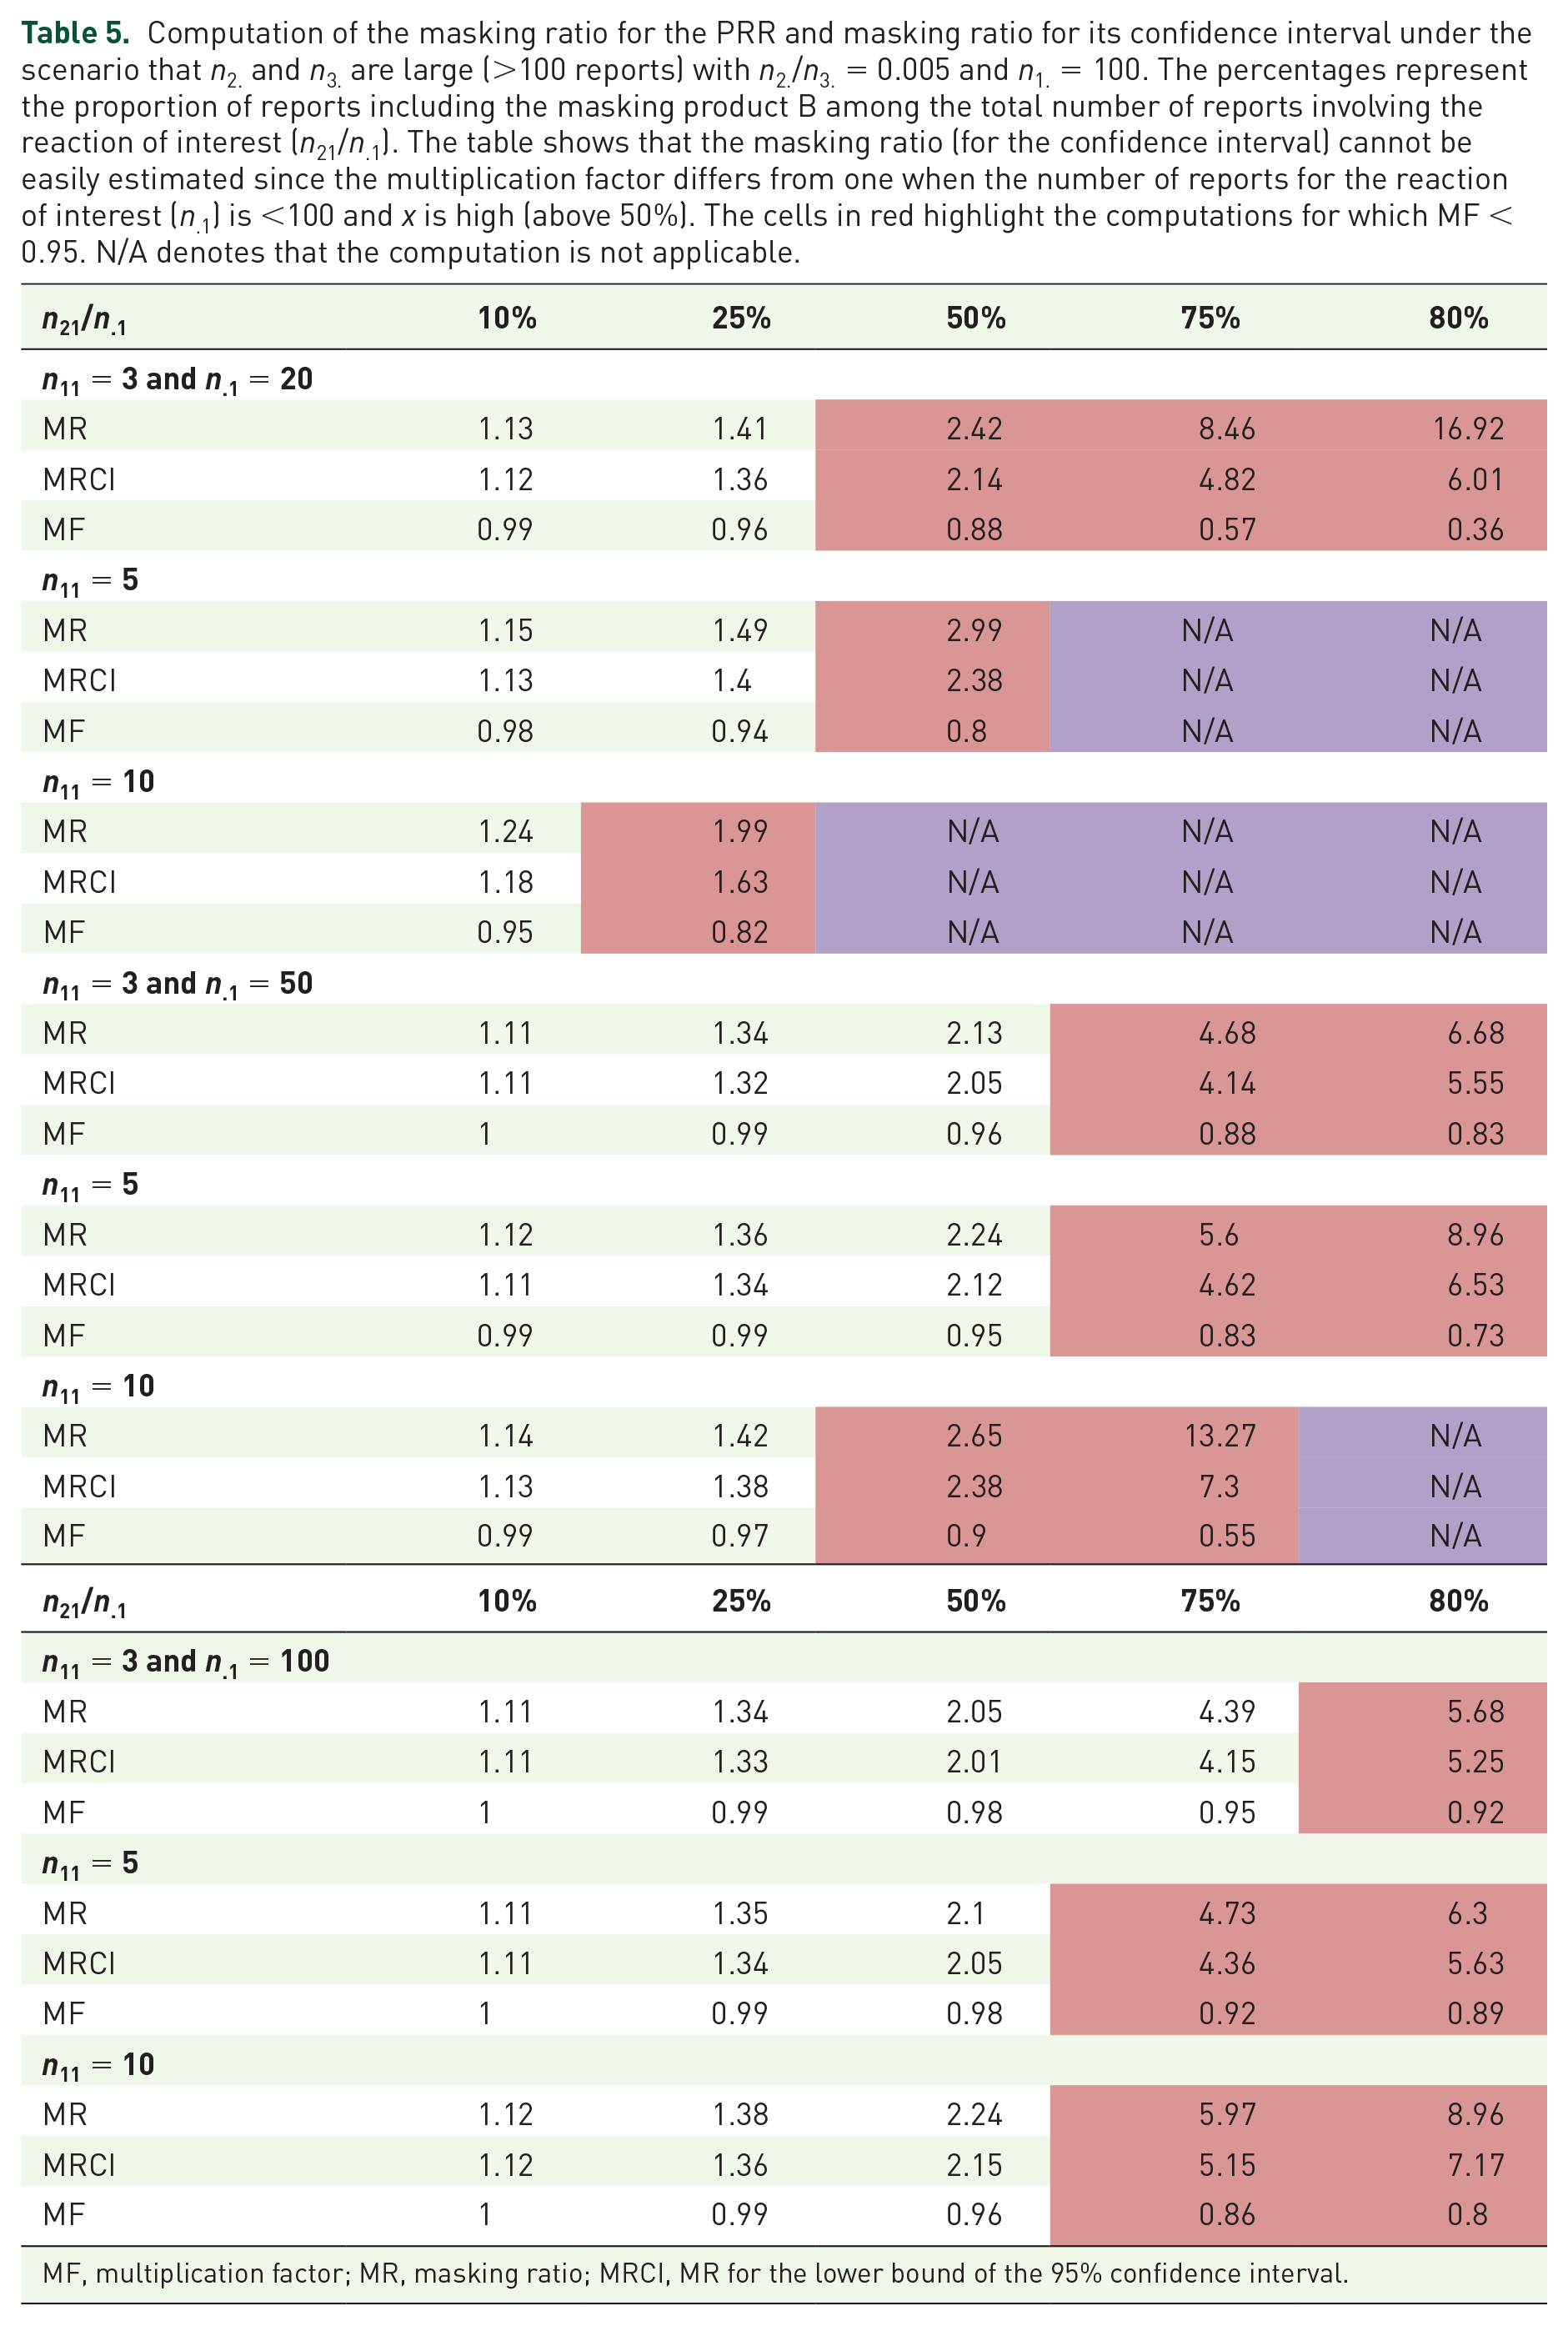
MF, multiplication factor; MR, masking ratio; MRCI, MR for the lower bound of the 95% confidence interval.
Equation 3 shows that the computation of the MRCI (like the exact MR) is also dramatically influenced by the method of computation (at the report or drug–event level). 9 The MRCI is drug–event specific for the RRR when the computation is performed at the drug–event level. Unfortunately, in the other situations (for the PRR and ROR and when the computation is performed at the report level for the RRR), the MRCI remains strictly specific for both product A, the masking product B and the event (E) of interest. This implies that, like for the exact MR, an important number of computations will have to be performed to detect a possible masking effect associated with the use of the Lower95CI of the measures of disproportionality (the number of computations is a quadratic function of the number of drug–event pairs included in the database).8,9 We could not find any way to bring down the number of computations associated with MRCI via a simplification of its computation.
Simulation
Our simulation originally yielded 905,091 SDRs with the PRR and 1,038,067 with its Lower95CI based on approximately two million simulated contingency tables. The removal of the masking resulted in a gain of 77,036 SDRs with the PRR (an additional 8.5% SDRs) and 68,900 SDRs with the Lower95CI (an additional 6.6% SDRs). The removal of any effect (masking or revealing effect) resulted in a net gain of approximately 5% new SDRs for both methods (Figures 4 and 5). We emphasize that under normal circumstances, the number of SDRs to be reviewed would be much lower. However, the percentages of additional SDRs unravelled by the unmasking are very similar to the number that we observed previously in real databases. 8 Our simulation validated our mathematical algorithm as the MRCI exactly predicted the direction and the magnitude of the masking observed for the confidence interval of the PRRA since the observed MRCI (Equation 1) and calculated MRCI (Equation 3) provided identical results.
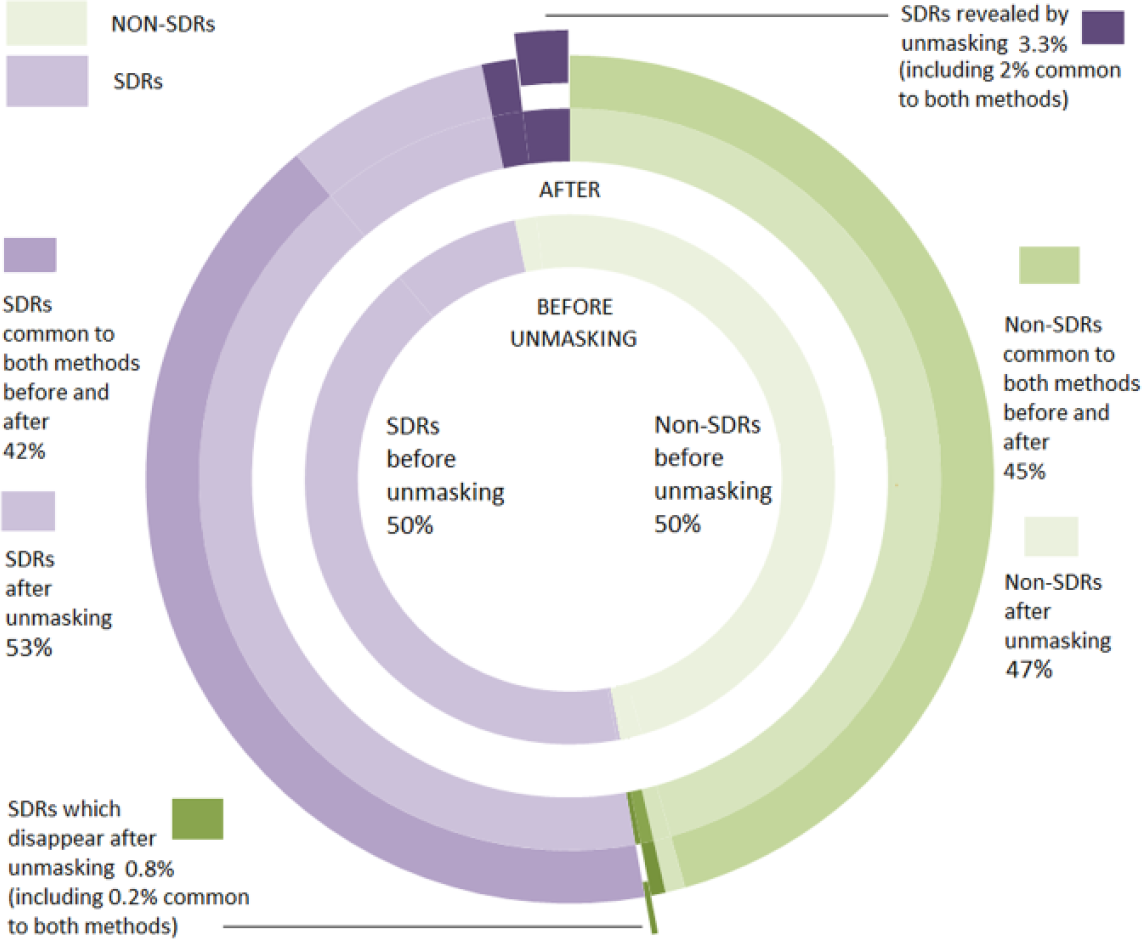
Number of signals of disproportionate reporting (SDRs) identified in the simulation after removal of the masking effect for the PRR. The figure also breaks down the number of SDRs (in purple) and non-SDRs (in green) that have been highlighted by each and both of the methods used in the study. The sectors in light colours indicate the percentage of records (non-SDRs in light green, SDRs in light purple) highlighted before and after removal of the masking. The sectors in dark colours indicate the percentage of new records highlighted after removal of the masking. Finally, the sectors that have been exploded from the pie chart correspond to the SDRs that have disappeared (exploded sector in green) and the new SDRs that have appeared (exploded sector in purple) common to both methods after removal of the masking effect.
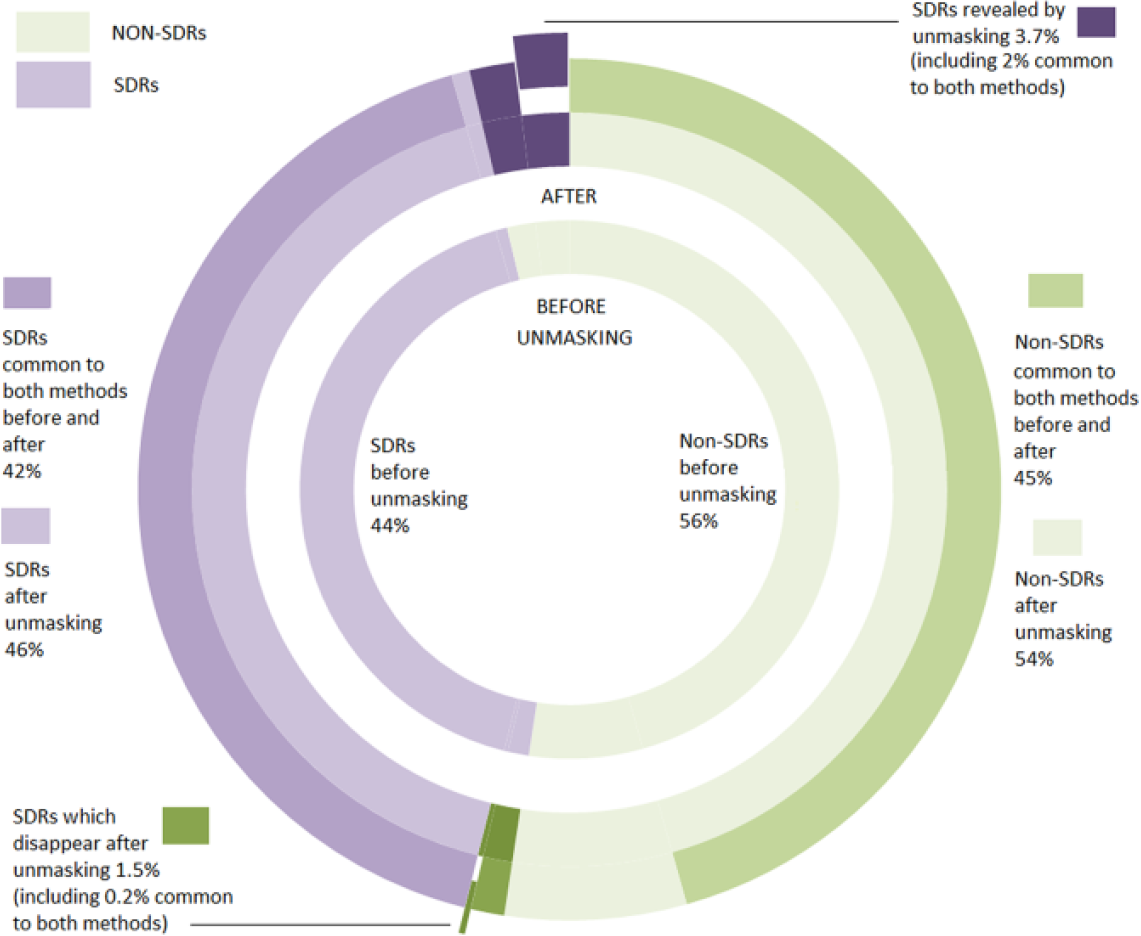
Number of signals of disproportionate reporting (SDRs) identified in the simulation after removal of the masking effect for the Lower95CI. The figure also breaks down the number of SDRs (in purple) and non-SDRs (in green) which have been highlighted by each and both of the methods used in the study. The sectors in light colours indicate the percentage of records (non-SDRs in light green, SDRs in light purple) highlighted before and after removal of the masking. The sectors in dark colours indicate the percentage of new records highlighted after removal of the masking. Finally, the sectors that have been exploded from the pie chart correspond to the SDRs that have disappeared (exploded sector in green) and the new SDRs that have appeared (exploded sector in purple) common to both methods after removal of the masking effect.
A very close correlation between the masking effect associated with the PRR and the masking effect associated with its confidence interval established in our mathematical framework has been observed in our simulation (Figure 6). In particular, our simulation confirms that the masking product inducing the highest masking effect on a given drug–event pair for the PRR will also be the product inducing the highest masking effect for the confidence interval (Figures 6 and 7).
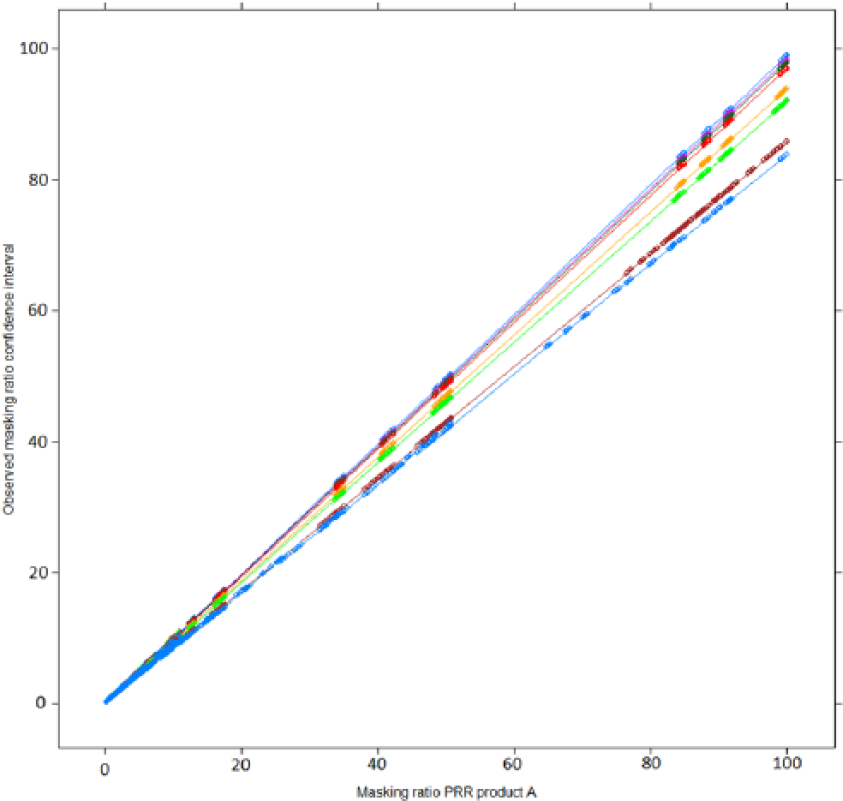
Relation between the masking ratio of the measure of disproportionality (PRR) and its confidence interval (lower bound of its 95% confidence interval) according to the value of n11 (values of n11 from purple = 1, 3, 5, 10, 50, 100, 1000 to blue = 10,000). The masking ratio of the confidence interval is influenced by the number of reports of the product (A) (n11) on which the disproportionality analysis is conducted (different colour lines). For an identical masking effect observed with the PRR, the masking ratio associated with the corresponding lower bound of the 95% confidence interval will decrease as the number of reports containing product A increases.
Relation (correlation) between the masking effect associated with the use of the masking ratio and its confidence interval. The plots are displayed according to the value of n31 (orange), n32 (green) and n11 (values of n11 from purple = 1, 3, 5, 10, 50, 100, 1000 to blue = 10,000). The axes of the plot on the right-hand side are on a logarithmic scale. These plots show that for a given drug–event pair, the product inducing the highest masking effect with the PRR will also induce the highest effect on the corresponding lower bound of the 95% confidence interval.
Among the records that were not associated with an SDR using the PRR (1,159,293), 62.9% of these (728,735) were affected by a masking effect (MR strictly > 1) and 367,828 (31.7%) were involved in a masking effect greater than 1.1, suggesting that most of the masking effect is of a moderate magnitude. Very similar figures were found using the Lower95CI. From the original records not originally highlighted as an SDR (1,026,317), 64.8% of these (665,473) were affected by a masking effect (MRCI > 1) but only 32.9% of these (337,628) were affected by a moderate masking effect (MR > 1.1). The presence of a higher masking (defined by an arbitrary threshold of 1.5 for the MR) involved 21.6% of the (simulated) records not originally involved in an SDR for the PRR (250,778) and 22.6% of the records for the Lower95CI (232,022). Overall, the extent of important masking affecting the original non-SDRs remained low (Figure 8). The simulation showed that the proportion of new SDRs revealed by the unmasking and common to both methods increased with the value of the respective MRs. The number of new SDRs revealed after the removal of the masking effect common to both methods was 42,054 new SDRs (i.e. 55% of the new SDRs for the PRR and 61% of the new SDRs for the Lower95CI). This proportion increased with the value of the MR to reach, respectively, 68% and 81% in the presence of important masking (value above 3 for both ratios) (Figure 9). These results show that the removal of masking of high magnitude tends to reveal identical SDRs across the two methods.
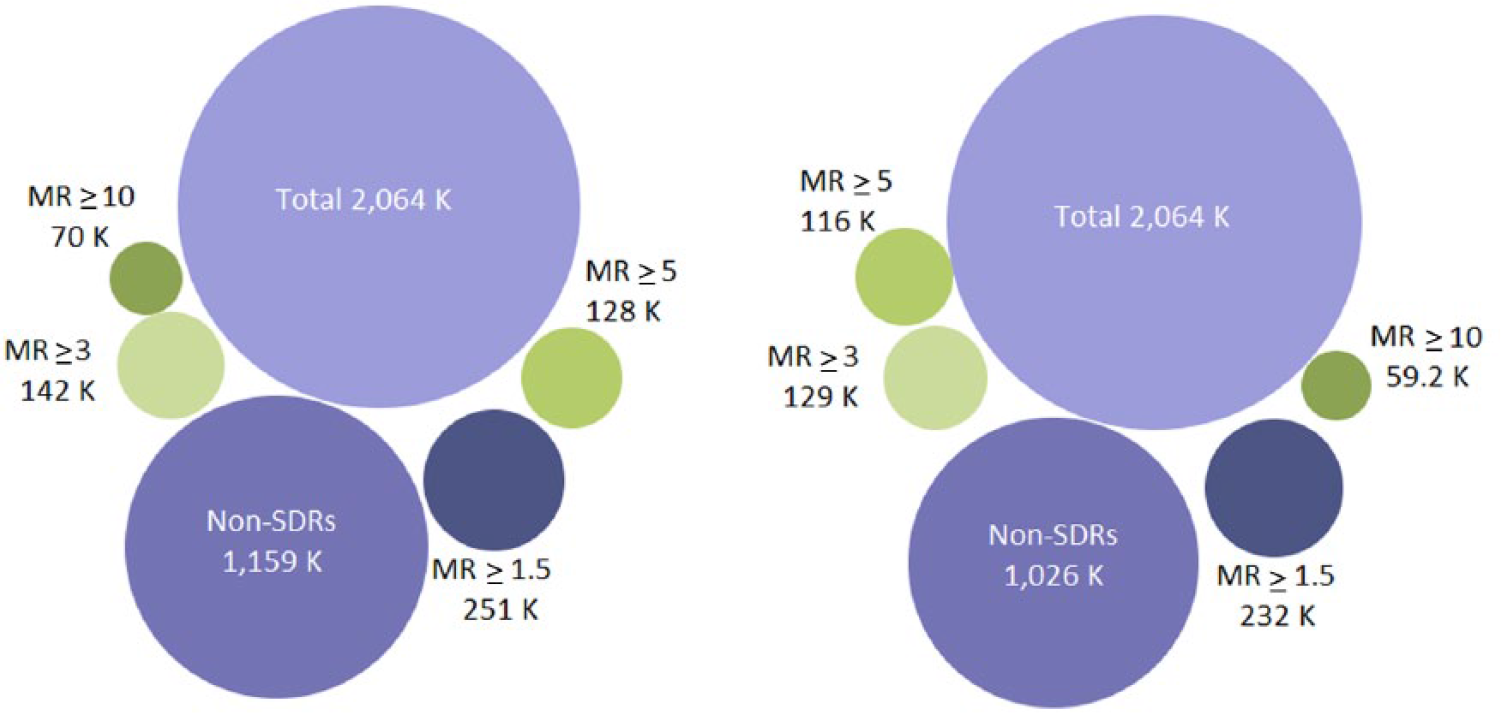
Extent of the masking effect associated with the use of the PRR (left-hand side) and with the Lower95CI (right-hand side) in the simulation performed in the study. The presence of important masking (defined as a masking ratio >3) was low and very similar across the two methods (data visualization available at the following URL: www-958.ibm.com/software/data/cognos/manyeyes/visualizations/new/bubble-chart/number-of-records/1).
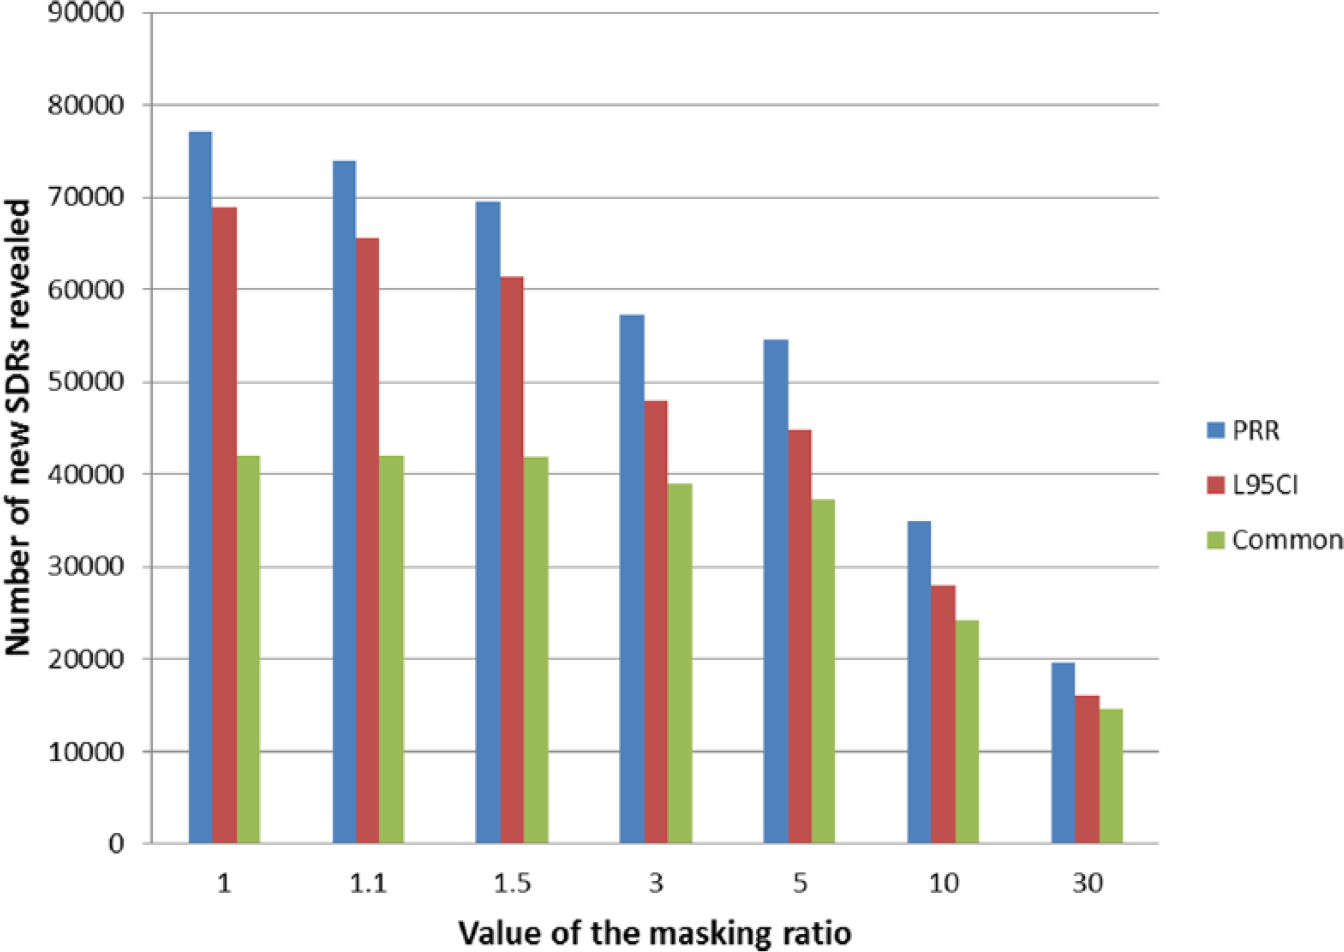
Number of new SDRs revealed according to the value of the respective masking ratios (MR and MRCI) before the removal of the masking effect. The proportion of new SDRs unmasked common to both methods increases with the magnitude of the masking effect originally affecting the record.
Discussion
Previous attempts have been made to propose an algorithm to assess and quantify the masking effect associated with the use of measures of disproportionality and their corresponding confidence intervals. 6 The MR for the confidence interval is a variable that provides a direct quantification of the direction (masking or promoting effect) and magnitude of the masking effect associated with the use of Lower95CI. We have established the existence of a direct association between the masking effect with the use of measures of disproportionality and their respective confidence intervals (Lower95CI). In particular for a given drug–event pair, in the presence of a masking effect (MRCI > 1.1), the product responsible for the highest masking effect with the MD will also be the product inducing the highest masking effect when the corresponding Lower95CI is used. However, considering the differences observed between the MR and MRCI and in the absence of comparison between the MRCI with approximations of MR, we recommend using our exact algorithm (and not our proposed approximation of the MR) to estimate the magnitude of the masking associated with the Lower95CI.
Our simulation suggests that the extent of masking on a given database is likely to be very similar across the two methods and also with other measures of disproportionality for which we have developed an algorithm (ROR, RRR). In addition, we have established that an important proportion of identical drug–event associations affected by the presence of an important masking effect will be revealed by the unmasking exercise, whether the PRR or its Lower95CI is used. We have also observed some masking effects of very high magnitude (MR or MRCI ⩾ 3) that was due to the conduct of a simulated analysis, which covers extreme situations unlikely to be encountered in practice. The results of our simulation can be extrapolated to any database containing more than 2000 reports.
Simulations have been previously used to understand masking mechanisms, but only covered a limited number of situations.10–12,15 In our previous studies, the results observed in our simulations perfectly predicted the results observed on two large spontaneous databases.8,9 It also allowed us to study the influence of different parameters on the masking effect in a controlled setting. It therefore provides an excellent working environment to test the algorithm on situations mimicking databases of radically different sizes, which is difficult to perform in real life. On the other hand, we believe that the contingency tables generated by our simulation cannot realistically simulate the presence and distribution of true effects or false-positives across the drug–event pairs; we did not assess the usefulness (gained or lost performance and more importantly its public health impact) on the detection of true effects of any unmasking exercise in such a controlled setting. This assessment should be conducted on real spontaneous reporting databases (of different settings and different sizes). 9
We have previously observed on two large spontaneous reporting system databases that the extent of masking associated with the PRR was low and mostly, but not only, affected events which were rarely reported (i.e. for which fewer than 100 reports were present in the databases). We have also observed that masking affected events involved in stimulated or over-reporting. 7 We have also demonstrated a major potential public health value of this exercise since one SDR revealed by our unmasking exercise later proved to be involved in a risk that led to the revocation of the marketing authorizations for fusafungine sprays in the EU (our DA was conducted 5 years before the regulatory action). This signal was revealed despite a moderate masking effect (MR = 1.04).8,19
The use of Lower95CI is associated with some practical issues. First, no straightforward simplification can be used to detect and assess the magnitude of the masking affecting the reactions that are rarely reported, that is those that have fewer than 100 reports. In the absence of a simplified algorithm, we recommend the use of the exact MRCI. Second, like for the MR, we also show that the unmasking algorithm is dramatically affected by the method of computation – at the drug–event or report level – and is associated with an important amount of computations (the number of which is a quadratic function of the number of drug–event combinations present in the database). Unfortunately, unlike for the MR, we did not find any way to simplify our algorithm to bring down the number of computations. Considering that the mathematical expression of the MRCI is more complicated than that of the MR, simplifications require assumptions that can have an unpredictable effect on the MRCI.
The potential real-world public health benefits of removing the masking effect associated with the quantitative methods based on DA have been demonstrated in specific datasets but may be further investigated to establish whether they are robust and generalizable to other datasets. As we demonstrated before, this beneficial effect is highly situation-dependent and is influenced by the size of the database, type of products included in the database, extent of simulated reporting, importance of reactions associated with a high probability of an association with a drug aetiology, etc. One key issue for the future will be to prospectively assess the public health benefits of removing a masking effect in a database and identifying the situations in which the removal might be beneficial (either in terms of number of true effects identified or in terms of time gained by the unmasking). Two studies have shown that unmasking can reduce the time necessary to detect signals of important public health relevance in specific datasets.7,8 Some previous retrospective studies have already reported a benefit by identifying true effects unravelled by the unmasking and by demonstrating that signals might be detected earlier.7,11,12,15,20 However, with our study, we provide strong evidence that the public health impact of the unmasking exercise that we have demonstrated with the measures of disproportionality will also probably be observed with the MRCI.
Revealing true effects is only one side of the coin. This study and previous studies conducted with the PRR suggest that the unmasking is likely to inflate the rate of false-positives identified by the quantitative methods (even more if the algorithm is run iteratively).6,9 The rate of true-/false-positive SDRs revealed by the unmasking has not been systematically studied or quantified particularly in a prospective way to minimize any hindsight bias. Such evaluation poses some practical and methodological challenges. In particular, it would be necessary to adjudicate the SDRs in a blinded way (without knowing whether the SDRs were present initially or after removal of the masking) to avoid any assessment bias. 21 In addition, considering that SRS databases can have significantly different features in terms of size, type of products covered and reports received and accepted, and subsequently entered (e.g. FAERS, VAERS, EudraVigilance, VigiBase, etc.),13,22 such evaluation would also have to be repeated on different types of databases. The limited number of studies aimed at assessing the impact of the masking effect of disproportionality analyses have shown that reports including important events for pharmacovigilance 23 can be affected by a masking effect.7,8,10–12,15 In that respect, our algorithm can be run on any database provided that appropriate contingency tables are used for the DA and strict allocation rules of the reports containing both product A and masking product B are applied.
Finally, we highlight an important caveat of our results. Our unmasking algorithm can potentially be run ad libitum to fulfil pre-specified expectations. We suggest that any unmasking should primarily be directed by the number of true-positives or rate of true-positive/false-positive findings confirmed by a clinical evaluation6,14,20 unravelled by the removal of the masking product(s) inducing the masking of highest magnitude. No threshold to define the presence of consequential masking can be recommended at this stage.
Conclusion
We highlight a direct relation between the masking observed with the PRR and for its confidence interval. The detection and quantification of the masking effect of measures of disproportionality and their confidence intervals can be automated. At the moment, the real benefits of this unmasking in terms of new true-positive signals (rate of true-positive/false-positive) or time gained in revealing of signals using this method are not yet definitively established. These benefits should be demonstrated in the context of prospective studies aimed at assessing the performances of signal detection in real conditions. The implementation of this algorithm will require some additional resources (computational and human), in particular on large spontaneous reporting system databases in which masking is difficult to identify empirically.
Footnotes
Acknowledgements
Valuable comments on this work were received from Jim Slattery.
Funding
Conflict of interest statement
JMD has no conflicts of interest with the pharmaceutical industry. M.H. is working in Worldwide Safety and Regulatory, Pfizer Inc. None of the authors have any conflict of interests with any statistical software provider.
Disclaimer
The views expressed in this article are the personal views of the author(s) and may not be understood or quoted as being made on behalf of or reflecting the position of Pfizer Inc.
Publication statement
This article has been neither submitted elsewhere, nor published elsewhere other than in abstract form.
The mathematical algorithm used in our study together with the simulation used to conduct our study are fully described and therefore can be independently replicated. Should anybody want to obtain the simulation data used to perform our analysis, these data can be obtained directly via the corresponding author.