
Abstract
Background:
The aim of this study was to investigate whether database restriction can improve oncology drug pharmacovigilance signal detection performance.
Methods:
We used spontaneous adverse event (AE) reports in the United States (US) Food and Drug Administration (FDA) Adverse Event Reporting System (FAERS) database. Positive control (PC) drug medical concept (DMC) pairs were selected from safety information not included in the product’s first label but subsequently added as label changes. These medical concepts (MCs) were mapped to the Medical Dictionary for Regulatory Activities (MedDRA) preferred terms (PTs) used in FAERS to code AEs. Negative controls (NC) were MCs with circumscribed PTs not included in the corresponding US package insert (USPI). We calculated shrinkage-adjusted observed-to-expected (O/E) reporting frequencies for the aforementioned drug–PT pairs. We also formulated an adjudication framework to calculate performance at the MC level. Performance metrics [sensitivity, specificity, positive and negative predictive value (PPV, NPV), signal/noise (S/N), F and Matthews correlation coefficient (MCC)] were calculated for each analysis and compared.
Results:
The PC reference set consisted of 11 drugs, 487 PTs, 27 MCs, 37 drug–MC combinations and 638 drug–event combinations (DECs). The NC reference set consisted of 11 drugs, 9 PTs, 5 MCs, 40 drug–MC combinations and 67 DECs. Most drug–event pairs were not highlighted by either analysis. A small percentage of signals of disproportionate reporting were lost, more noise than signal, with no gains. Specificity and PPV improved whereas sensitivity, NPV, F and MCC decreased, but all changes were small relative to the decrease in sensitivity. The overall S/N improved.
Conclusion:
This oncology drug restricted analysis improved the S/N ratio, removing proportionately more noise than signal, but with significant credible signal loss. Without broader experience and a calculus of costs and utilities of correct versus incorrect classifications in oncology pharmacovigilance such restricted analyses should be optional rather than a default analysis.
Introduction
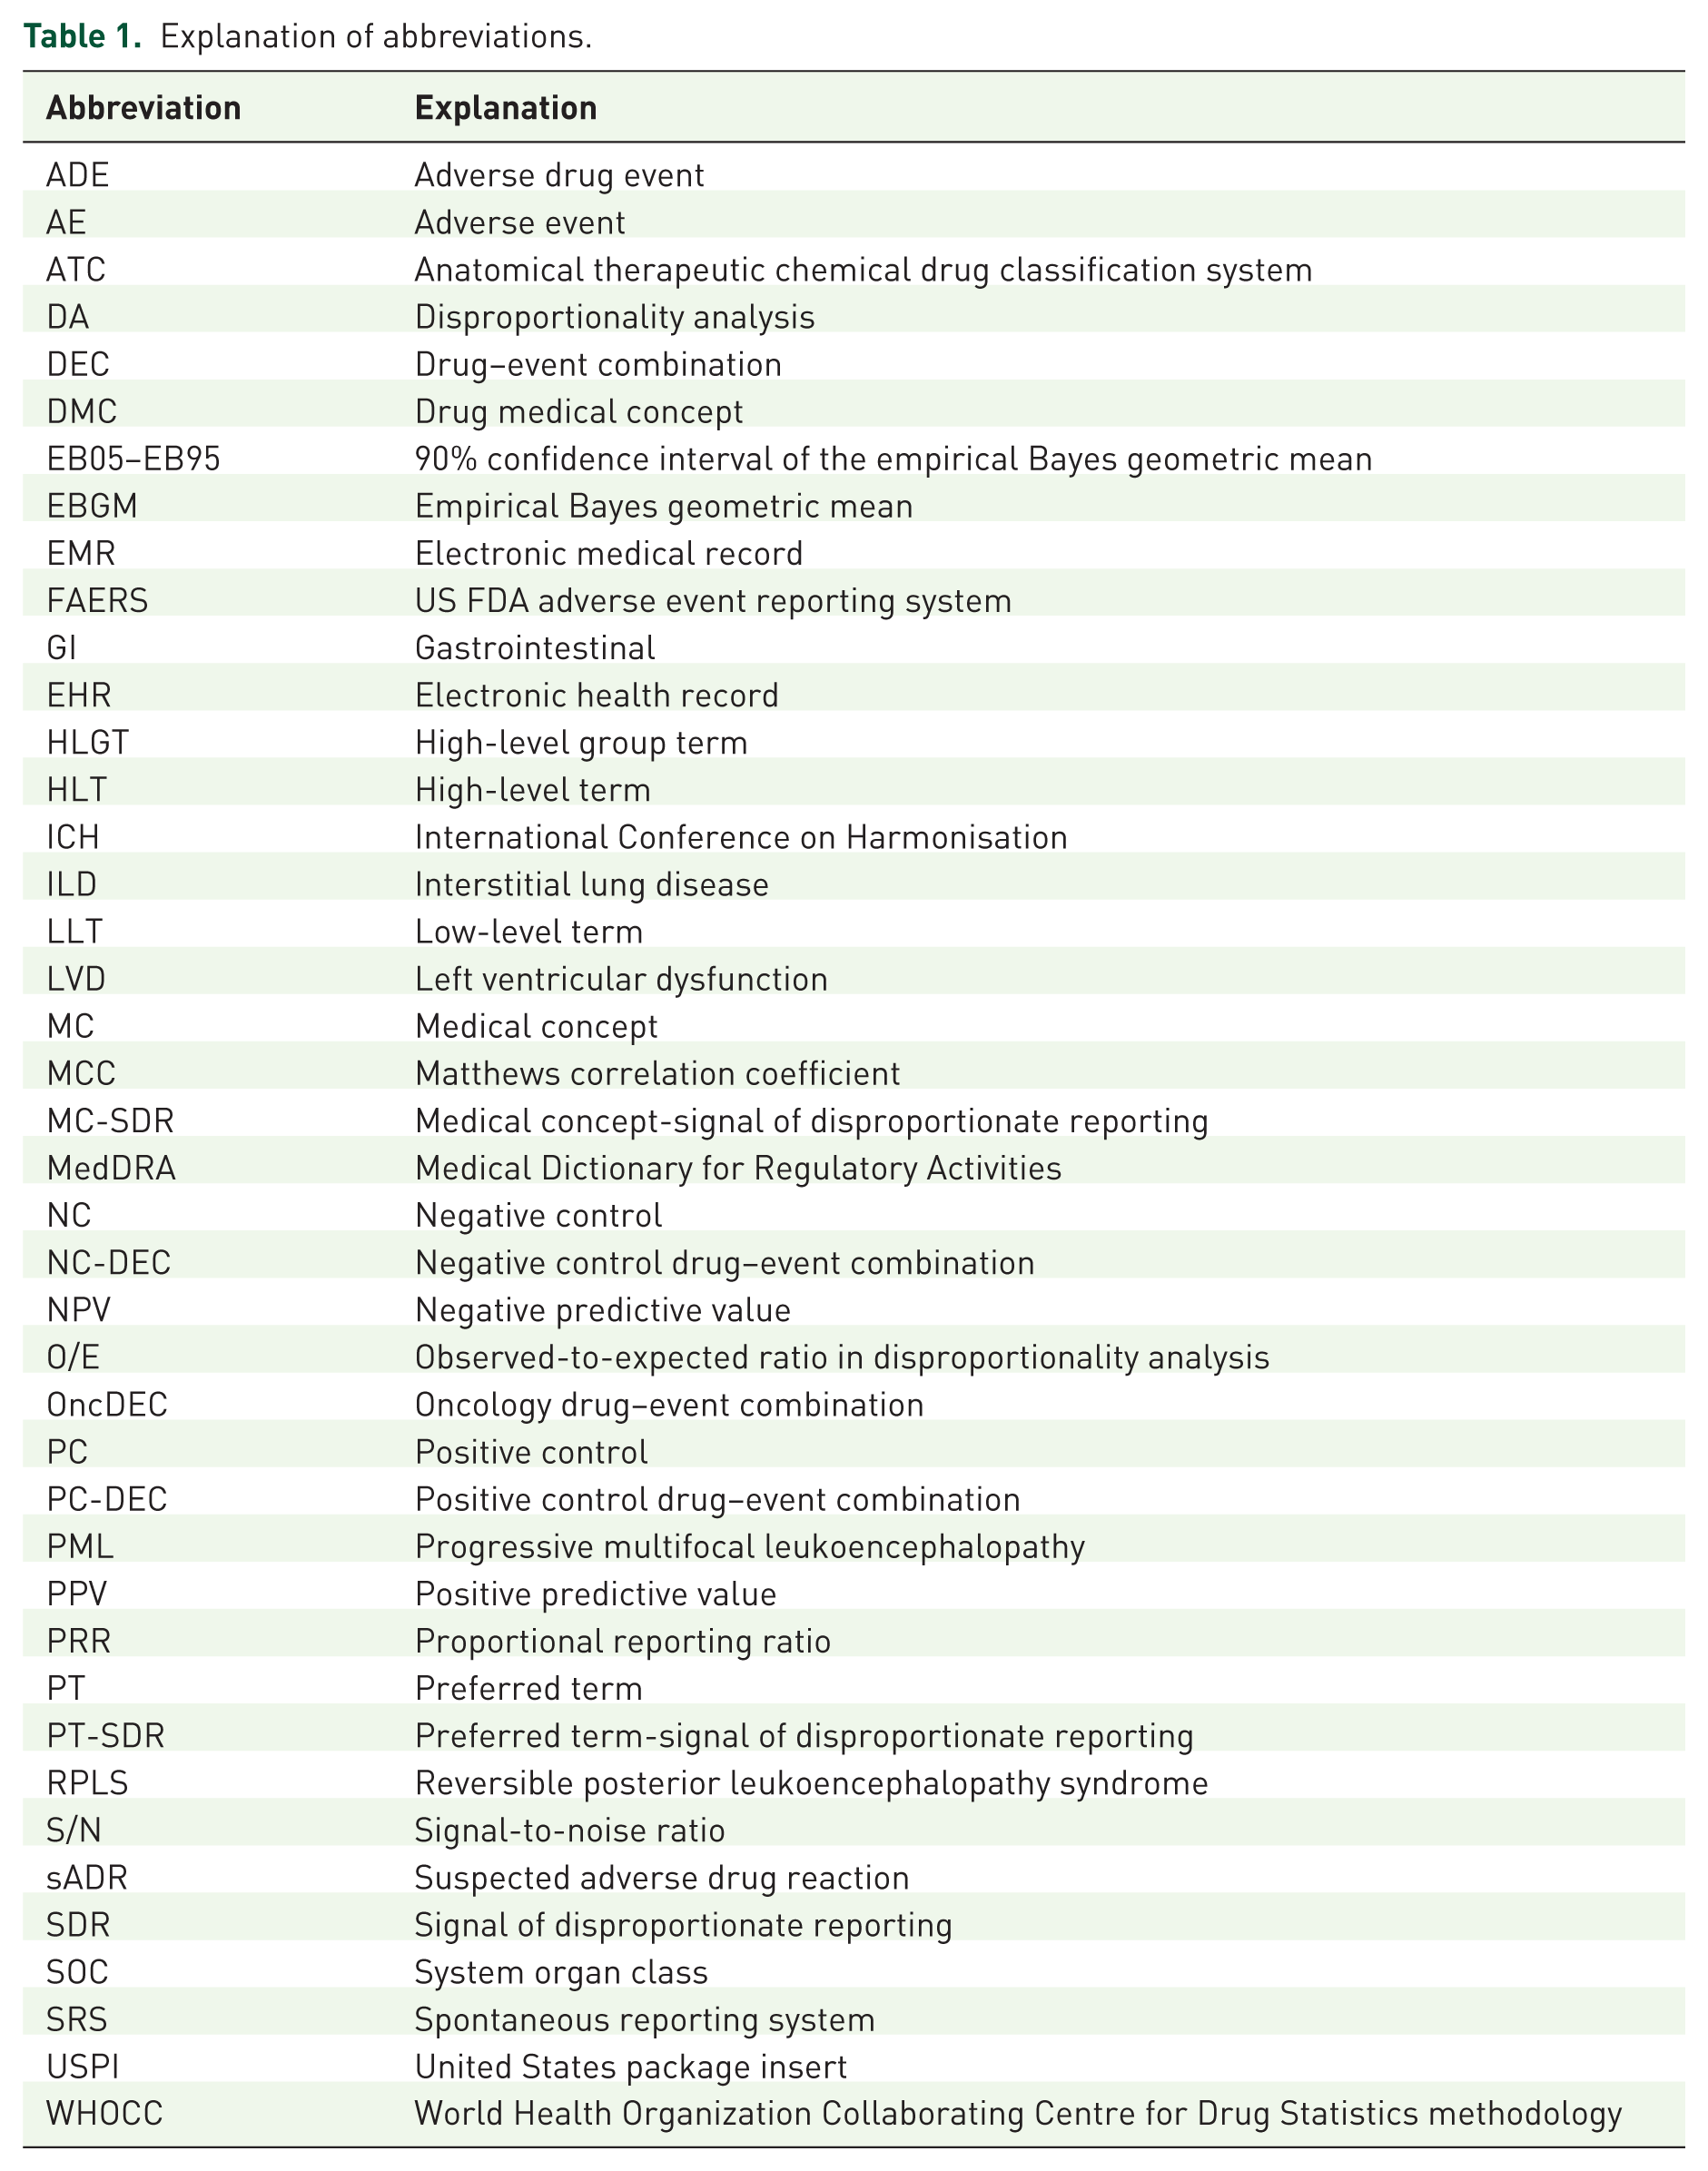
The pioneering of Bayesian methods in pharmacovigilance by the World Health Organization (WHO) Uppsala Monitoring Centre ushered in a decade of intensive research and application of disproportionality analysis (DA) to support signal detection in pharmacovigilance (see Table 1 for an explanation of all acronyms used in this article). 1 Although the reality did not match the hype, they have become established elements of the pharmacovigilance tool kit. 2 With the large body of work achieved and the recognition of the substantial limitations of spontaneous reporting system (SRS) data, attention seismically shifted to applying quantitative methodologies to electronic health records/medical records (EHRs/EMRs). 3
Explanation of abbreviations.
Recently, however, there has been renewed interest in refining these and other approaches in SRS data. One research avenue is the effect of database composition on the results of DA. The general composition of the database will determine what stands out quantitatively from this background. 4 For example a relatively small number of reports of infusion reactions with a given drug may stand out quantitatively in a database composed mostly of orally-administered drugs. The default approach in routine pharmacovigilance has used the entire database to calculate expected (E) and thus observed-to-expected (O/E) reporting ratios. DA in pharmacovigilance entails making analytical choices, such as database background. Typically, these analytical choices would be expected to result in changes in the signal/noise (S/N) ratio, sometimes favorably and sometimes unfavorably. Certainly, restricting the database to specific subsets that more fully reflect the background diseases would be expected to reduce noise but this may be associated with an unacceptable loss of signals.
Pharmacovigilance signal detection of oncology side effects is not straightforward. Frequent use of polydrug treatment regimens makes it difficult to disentangle the side effects of individual drugs versus drug–drug interactions versus innocent bystander effects.5,6 Significant and complex patient histories result in high potential for confounding and effect modification (i.e. drug–disease interactions). The unique benefit–risk consideration for oncology patients may result in a higher threshold for recognizing and reporting adverse drug events (ADEs). New drugs involving novel or first-in-class mechanisms may present difficulties to anticipate and rationalize adverse effects.
The objective of the current study is to explore the effect of an oncology drug restriction (i.e. analyzing the subset of the database consisting only of oncology drugs) on the performance of a data mining analysis using a defined reference set of oncology drug–event pairs.
Methodology
The fundamental components of our methodology are: United States (US) Food and Drug Administration (FDA) Adverse Event Reporting System (FAERS) data, a reference set of positive and negative control drug–event pairs, a mapping of the true positive/negative medical concepts (MCs) to the Medical Dictionary for Regulatory Activities (MedDRA) terminology, and statistical analyses.7,8
Data
The US FDA maintains the FAERS database which contains information related to postmarketing medication errors and safety surveillance reports as well as individually reported adverse events (AEs) submitted by health care providers and consumers themselves, which may include patients, family members, or lawyers. We used an extract of FAERS consisting of reported AEs from 1 January, 1969, through 31 December, 2013. These analyses focused exclusively on spontaneously reported AEs (excluding AE reports from clinical trials). The FAERS data were cleaned to mitigate duplicate reporting and redundant drug nomenclature by Oracle Health Sciences, Redwood City, CA, USA.
AEs in FAERS are coded using MedDRA, which is a clinically validated international medical terminology dictionary (and thesaurus) used by regulatory authorities in the pharmaceutical industry during the regulatory process, from premarketing to postmarketing activities, and for data entry, retrieval, evaluation, and presentation. MedDRA is the AE classification dictionary endorsed by the International Conference on Harmonisation of Technical Requirements for Registration of Pharmaceuticals for Human Use (ICH). The MedDRA dictionary is organized by System Organ Class (SOC), divided into high-level group terms (HLGTs), high-level terms (HLTs), preferred terms (PTs) and finally into lowest level terms (LLTs). Analyses were performed at the PT level, which is typically used in real-world pharmacovigilance.
Drugs in FAERS are coded using the Anatomical Therapeutic Chemical (ATC) Classification system. The ATC Classification system is used for the classification of active ingredients of drugs according to the organ or system on which they act and their therapeutic, pharmacological and chemical properties. It is managed by the WHO Collaborating Centre (WHOCC) for Drug Statistics methodology and was first published in 1976 9 The ATC coding system was used in this analysis to identify relevant oncology drugs. Analyses were conducted using both unrestricted data and a restricted subset of FAERS. The unrestricted data consisted of all spontaneous reports for all drugs and the restricted subset included all spontaneous reports limited to suspect drugs from ATC level 2 antineoplastic agents therapeutic subgroup.
Reference sets for testing signal detection performance
Seruga and colleagues published a comparison of targeted oncology drug–event pairs as reflected in the drug labels immediately after first approval and subsequent label updates. 5 Based on findings from Seruga and colleagues, we identified as positive controls (PCs) those drugs and MCs that were not included in the product’s first label but were subsequently added. These suspected adverse drug reactions (sADRs) were selected because by definition they represent recognized safety signals leading to a postapproval label change. Thus, they are associations of interest in pharmacovigilance. Negative controls (NCs) were defined as MCs with relatively circumscribed mappings (<4 PTs) that were not included in the US package insert (USPI) for the oncology drugs of interest. We supplemented these reference sets with one older nontargeted therapy, which has previously been used in a published oncology signal detection exercise. 10 This older nontargeted therapy was chosen on the basis of supportive evidence 10 and having a relatively circumscribed representation in MedDRA. We believe that the addition of this older nontargeted therapy provides a marginal increase in the generalizability of our findings.
MCs were defined by identifying related MedDRA PTs. Our mapping was based on real-world pharmacovigilance signal management practices. The granular nature of this vocabulary requires the accommodation of multiple related PTs mapping to a given MC. 11 We excluded PTs that designate neonatal events or PTs that specify a nondrug etiology except for certain infections potentially related to drug-induced immunosuppression (e.g. reactivation of viral hepatitis).
Statistical methodology
The statistical data mining methodology used is a form of DA known as the Multi-item Gamma-Poisson Shrinker (MGPS), an empirical Bayesian method.12,13 Disproportionality analyses create 2 × 2 contingency tables (Table S1 of the online supplementary information) for each drug–event combination (DEC), and based on these tables returns an O/E ratio of reporting frequencies, proportions or odds, along with an associated range of credible O/E values. The expected frequency, proportion or odds is based on an independence model (i.e. the frequency, proportion or odds expected if the drugs and events are randomly distributed in the database). The more the observed exceeds chance expectation the more noteworthy, all else being equal. We used an O/E metric known as the empirical Bayes geometric mean (EBGM), with an associated 90% credibility interval (EB05–EB95). The analysis employed stratification by age, sex and year of report to mitigate confounding by these basic covariates. For purposes of this discussion, an EB05 > 2 is referred to as a statistic or signal of disproportionate reporting (SDR) as distinct from a signal of suspected causality; herein for expediency we refer to an SDR as a ‘signal’. 14
SDR adjudication and designation
Our analysis is based on two levels of SDRs: A drug–PT-SDR and a drug medical concept SDR (DMC-SDR). Since multiple PTs map to a given MC, a MC-SDR is defined as an MC for which at least one mapped PT for that MC is associated with an SDR. When all PTs comprising a MC are associated with an SDR, we term it a ‘full MC-SDR’, and when some of the PTs are associated with an SDR, we consider it a ‘partial MC-SDR’.
A major focus of our analysis was cross-threshold shifts because such shifts correspond to gained/lost or strengthened/weakened signals. A cross-threshold shift refers to an O/E that shifts upward or downward across the SDR-defining threshold (i.e. EB05 ⩾ 2). There are four categories of DECs with respect to the presence or absence of SDRs in the unrestricted versus the restricted analysis: SDR(+) in both analysis, SDR(–) in both analysis, and SDRs shifting from SDR(–) to SDR(+) or vice versa, as a result of the database restriction.
As a result of database restriction, going from a no MC-SDR to a partial or full MC-SDR is a ‘gained signal’. Conversely, a MC-SDR shifting from a full/partial MC-SDR to no MC-SDR represents a ‘lost signal’. An increase in the number of PT-SDRs within a MC is a strengthened MC-SDR. Conversely a partial MC-SDR that loses some but not all of its PT-SDRs due to database restriction is considered a ‘weakened signal’. A given DEC may also remain in the same category after restriction. Figure 1 provides a graphical explanation of these concepts. Table 2 also illustrates the possible changes in MC-SDR designation as affected by database restriction for purposes of tabulation.
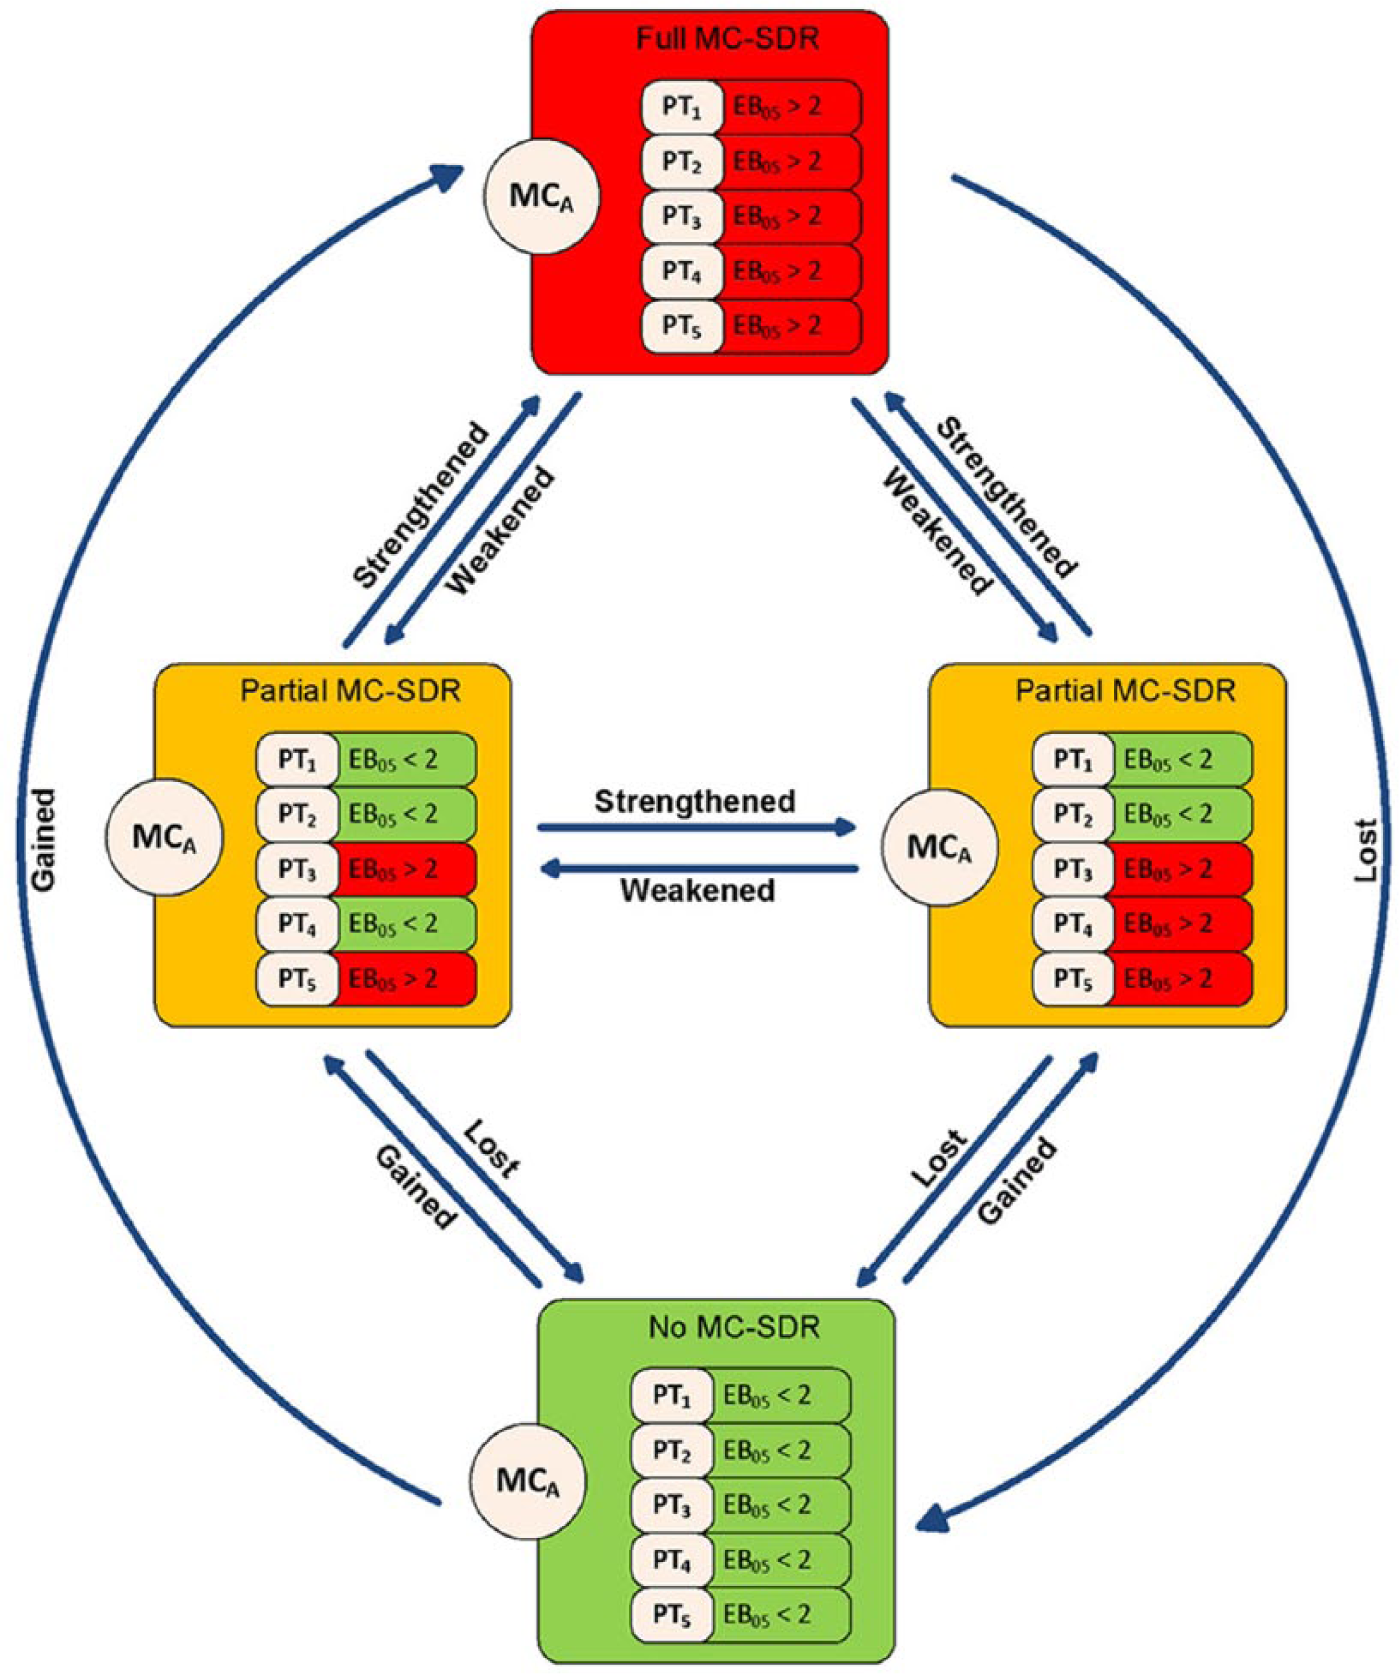
MC-SDR and shifts: in this fictitious and oversimplified example the MC is comprised of 5 AE codes (PT1–PT5) listed in each box. In a given unrestricted DA each drug will fall into one of the four boxes. In the full MC-SDR all the PTs are associated with an SDR (EB05 > 2, shown in red). In the partial MC-SDR, only some PTs (shown in red) are associated with an SDR. If no PTs are associated with an SDR (i.e. all AE codes with EB05 < 2, shown in green) there is no SDR either at the MC or the individual PT level. After database restriction the drug may remain in the same box in restricted analysis, or shift to one of the other boxes. We tabulate all these shifts/nonshifts to assess the impact of database restriction at the MC level.
Impact of oncology database restriction on MC-SDRs, SDR designation shift.
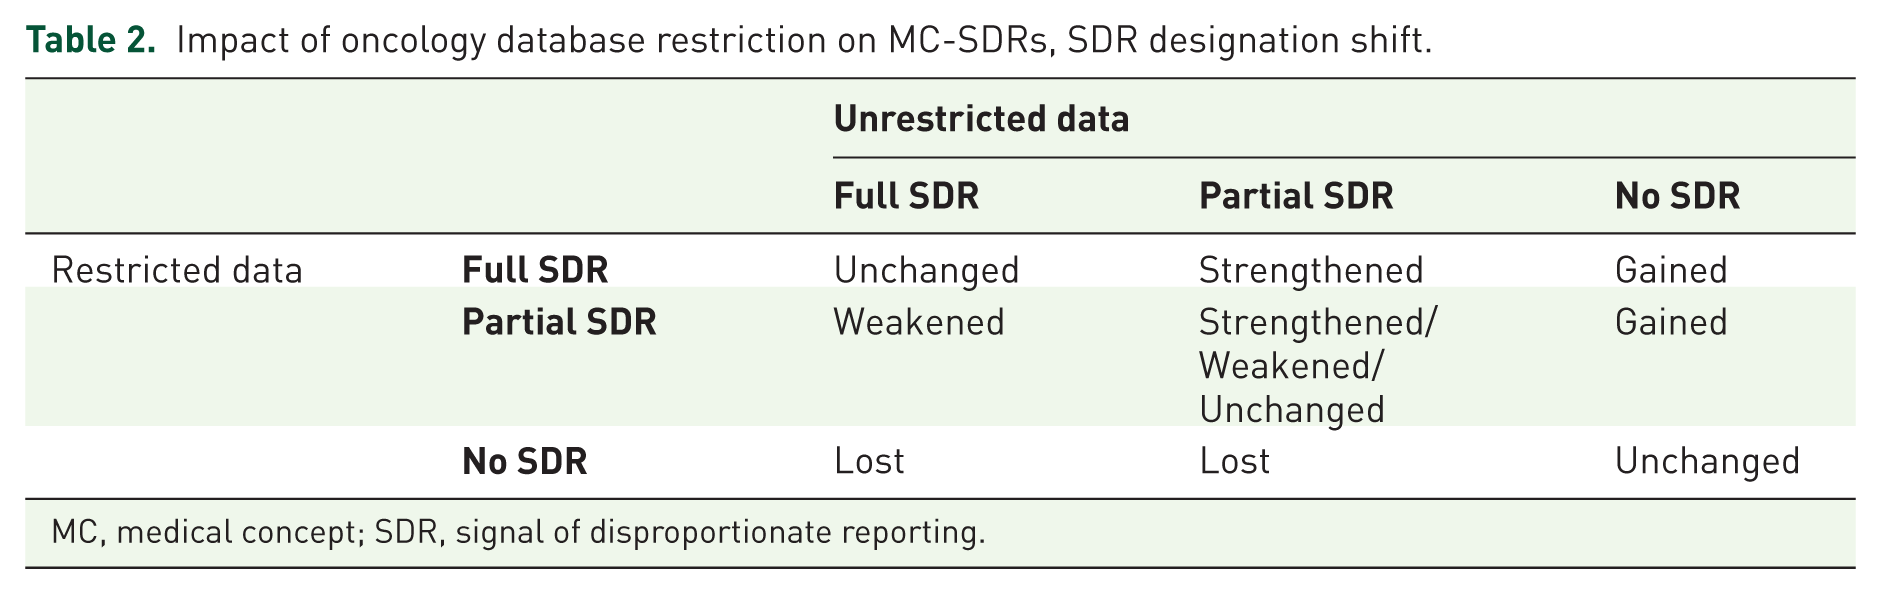
MC, medical concept; SDR, signal of disproportionate reporting.
The rationale to study and tabulate partial and complete shifting is that they each have consequences. A complete shift of an MC can mean a lost/gained signal and a partial shift can mean a weakened/strengthened signal. Note that there is an asymmetry in the practical impact of gained versus lost and strengthened versus weakened signals, according to whether the association is a positive or negative control. For PCs, gained or strengthened signals are desirable, while lost or weakened signals are undesirable. For NCs, lost or weakened signals are desirable while gained or strengthened signals are undesirable (Table 2).
Outcome
We analyzed the number of DECs and DMCs that shifted in either direction across the SDR-defining threshold, the number of PTs or MC-SDRs gained, lost, strengthened and weakened. In order to assess the potential value of database restriction, we also calculated the following performance metrics: sensitivity, specificity, positive and negative predictive value (PPV or NPV), F, and Matthews correlation coefficient (MCC). We also calculated a simple signal-to-noise ratio (S/N) as follows: S/N = #SDRsPC /#SDRsNC. Because of the imbalance of our reference set (#PCs > #NCs), we only used it to provide another perspective of the comparison of restricted with unrestricted data sets.
Results
Overall, the FAERS data set included in this analysis consisted of 5578 drugs, 16,168 events, and 155,672 oncology drug–event (PTs) combinations (OncDECs).
Impact of restriction for overall OncDECs
Figure 2 displays the behavior of all OncDECs as well as the PC-DECs and NC-DECs with respect to cross-threshold shifts. In the unrestricted data set, only 7.3% (5.4% + 1.9%) of overall OncDECs had an SDR. Most OncDECs did not undergo cross-threshold shifts. Specifically, 143,970 (92.5%) OncDECs were SDR(–) in both the restricted and unrestricted datasets and 2935 (1.9%) were SDR(+) in both datasets. For OncDECs that underwent cross-threshold shifts, 8445 (5.4% of all OncDECs) were SDR(+) in the unrestricted data set and SDR(–) in the restricted data set (i.e. corresponding EB05 shifted from >2 to ⩽2). Far fewer, 322 (0.2% of all) OncDECs went in the opposite direction [SDR(–) to SDR(+)] as a result of database restriction.
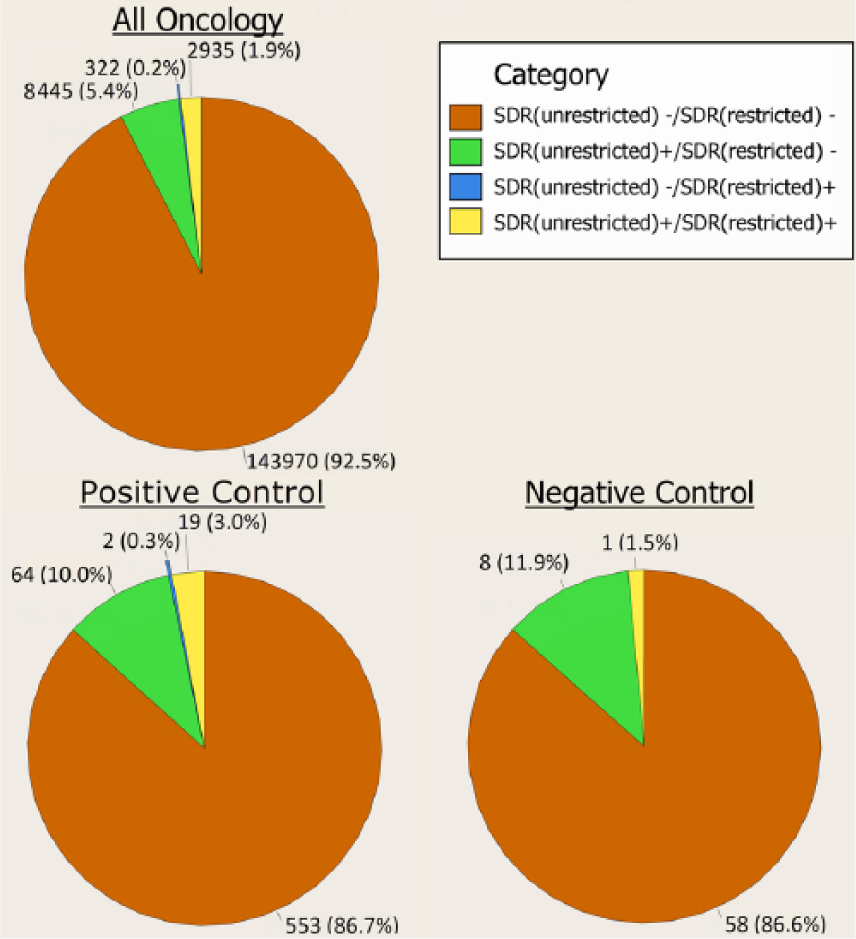
Pie chart of cross-threshold shifts at PT level.
Impact of restriction for positive and negative controls
The PC reference set consisted of 11 drugs, 487 PTs, 27 MCs, 37 DMC combinations and 638 DECs. The NC reference set consisted of 11 drugs, 9 PTs, 5 MCs, 40 DMC combinations, and 67 DECs (Table S2 in the online supplementary information). There was a wide range of reporting frequencies by drug, ranging from 3 DECs for gemcitabine to 194 DECs for imatinib in the PCs (Table S3 in the online supplementary information). This should not be considered reflective of the relative reporting of these drugs in general. The majority of reference drugs are all biologics with overlapping safety profiles while gemcitabine is an older drug unassociated with AEs reported with biologics. No obvious relationship was observed between the number of DECs and year of US approval (Table S3 in the online supplementary information).
Reported frequencies of DECs by drug, and MC by drug, for both the positive and negative controls are shown in Tables S4 and S5 in the online supplementary information, respectively. Less-specific MCs covering a broad anatomic or pathophysiological domain were associated with an increased number of PTs mapping to that concept. For example, the three PC MCs containing the most PTs and, therefore, more DECs were hemorrhage (22.9%), arterial thromboembolic events (12.1%), and cardiac arrhythmias (10.3%).
PT-SDRs
The majority (572 or 89.7%) of PC-DECs did not shift across the SDR-defining threshold (Figure 2). Specifically, 553 (86.7%) of PC-DECs were SDR(–) for both the restricted and unrestricted datasets (slightly less than OncDECs overall) and 19 (3.0%) were SDR(+) in both data sets (slightly higher than OncDECs overall). A total of 64 (10.0%) PC-DECs had SDRs that underwent a cross-threshold downshift as a result of the database restriction. Only 2 (0.3%) PC-DECs upshifted across the threshold as a result of restriction.
For NC-DECs, 58 (86.6%) were SDR(–) in both analyses, less than the percentage for OncDECs overall but comparable with the percentage for PCs. NC-DECs that were SDR(+) in both analyses made up 1 (1.5%) of the NC-DECs, less than the percentage for PCs and to a lesser degree, OncDECs overall. There were eight (11.9%) NC-DECs that had SDRs that underwent a cross-threshold downshift as a result of the database restriction. No NC-DEC upshifts across the threshold were observed.
It is interesting to consider the ‘mechanism’ of the EB05 shifts at the PT level. EB05 shifts may occur by one of two non-mutually-exclusive mechanisms. Shifts in EB05 may occur because the overall EB05-EBGM-EB95 interval shifts position or due to changes in the width of the interval. To investigate this, we examined shifts in EB05 and the interval widths resulting from the restriction. Figure 3 displays a scatterplot of the corresponding metric deltas. It is evident that the restriction generally resulted in decreased interval width suggesting that downward shifts of EB05 are usually driven by shifts in the position of the interval not changes in interval width. However, the general narrowing of the interval width with the database restriction may also explain some upward EB05 shifts.
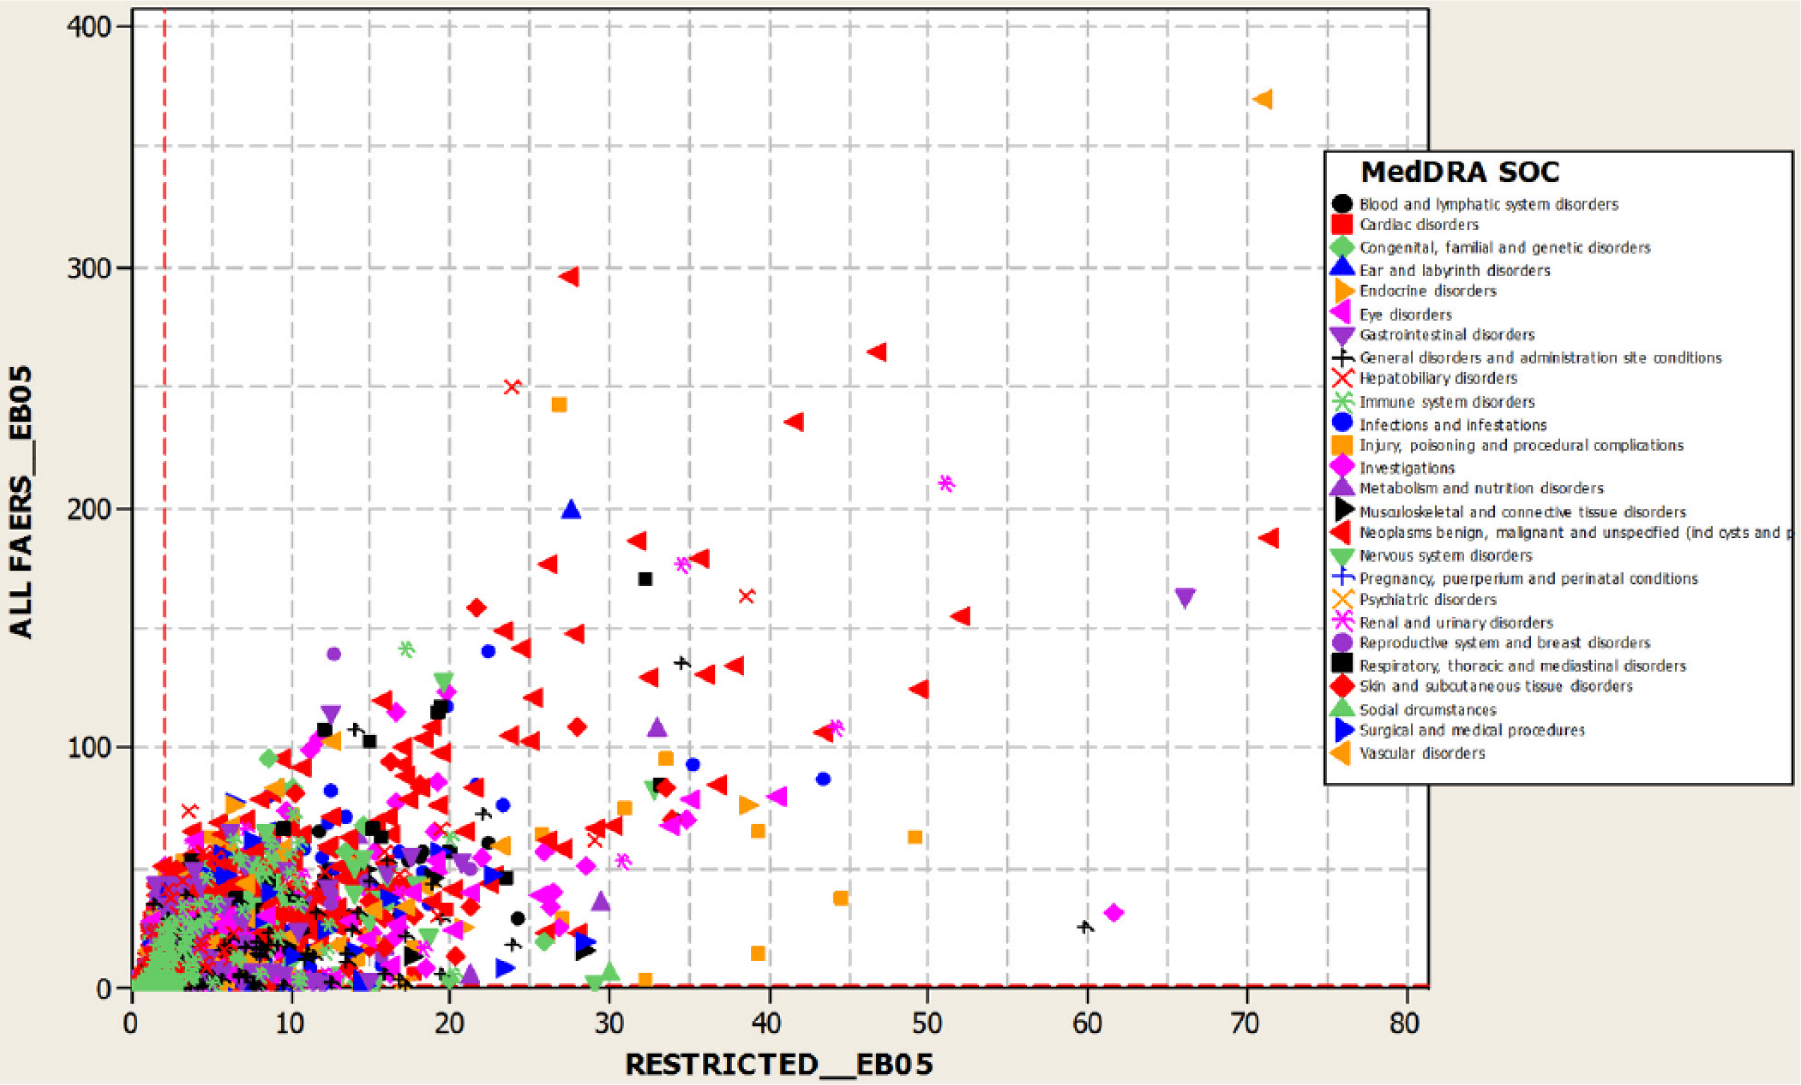
Scatterplot of EB05-EB95 interval width unrestricted by restricted.
MC-SDRs
There were 25 (67.5%) MC-SDRs (7 full and 18 partial) for the PCs in the unrestricted analysis. Oncology database restriction resulted in the loss/weakening of 21 (84%) MC-SDRs [14 lost (5 full and 9 partial) and 7 weakened (1 Full and 6 partial)]. No MC-SDR gain was observed as a result of restriction (Table 3).
Positive/negative controls adjudication scheme for impact of oncology database restriction on MC-SDRs.
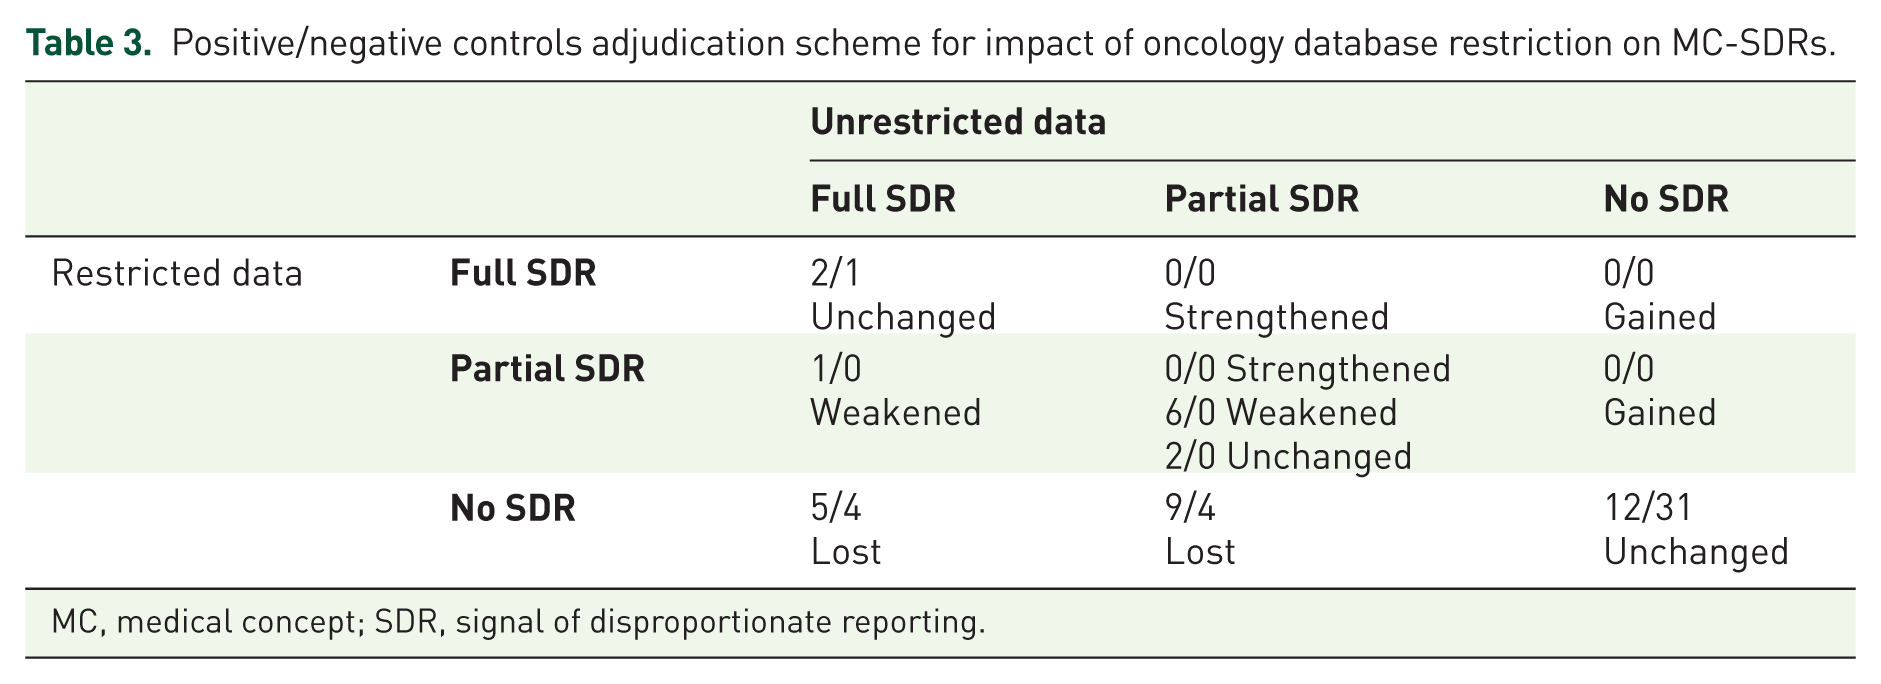
MC, medical concept; SDR, signal of disproportionate reporting.
There were 9 (22.5%) MC-SDRs (5 full and 4 partial) for the NCs in the unrestricted analysis. Oncology database restriction resulted in a loss of 8 (88.9%) MC-SDRs (4 full and 4 partial) without any gain of MC-SDRs. No MC-SDR weakening or strengthening was observed as a result of restriction (Table 3).
Both positive and negative controls displayed similar responses to the database restriction. Oncology database restrictions tended to have the opposite effect on DECs that involved typical/classical oncology events (for which restriction tended to lower the EB05) versus non-oncology-specific events or events more strongly associated with non-oncology drugs (for which the restriction tended to increase the EB05, consistent with theoretical expectations). This is displayed in Figure 4 which shows the median of the EB05restricted/EB05unrestricted by MC for positive and negative controls, respectively. Generally, the largest median ratios >1 were observed for cerebrovascular accidents, myocardial infarction/ischemia, and QT prolongation/torsade de points events which may occur with oncology drugs but are not classical chemotherapy-associated sADR. Conversely, the lowest median ratios were observed for classic oncological events such as exacerbation neutropenia, hypomagnesemia, interstitial lung disease/pulmonary toxicity, infections, infusion reaction, progressive multifocal leukoencephalopathy (PML), reversible posterior leukoencephalopathy syndrome (RPLS), and tumor lysis syndrome.
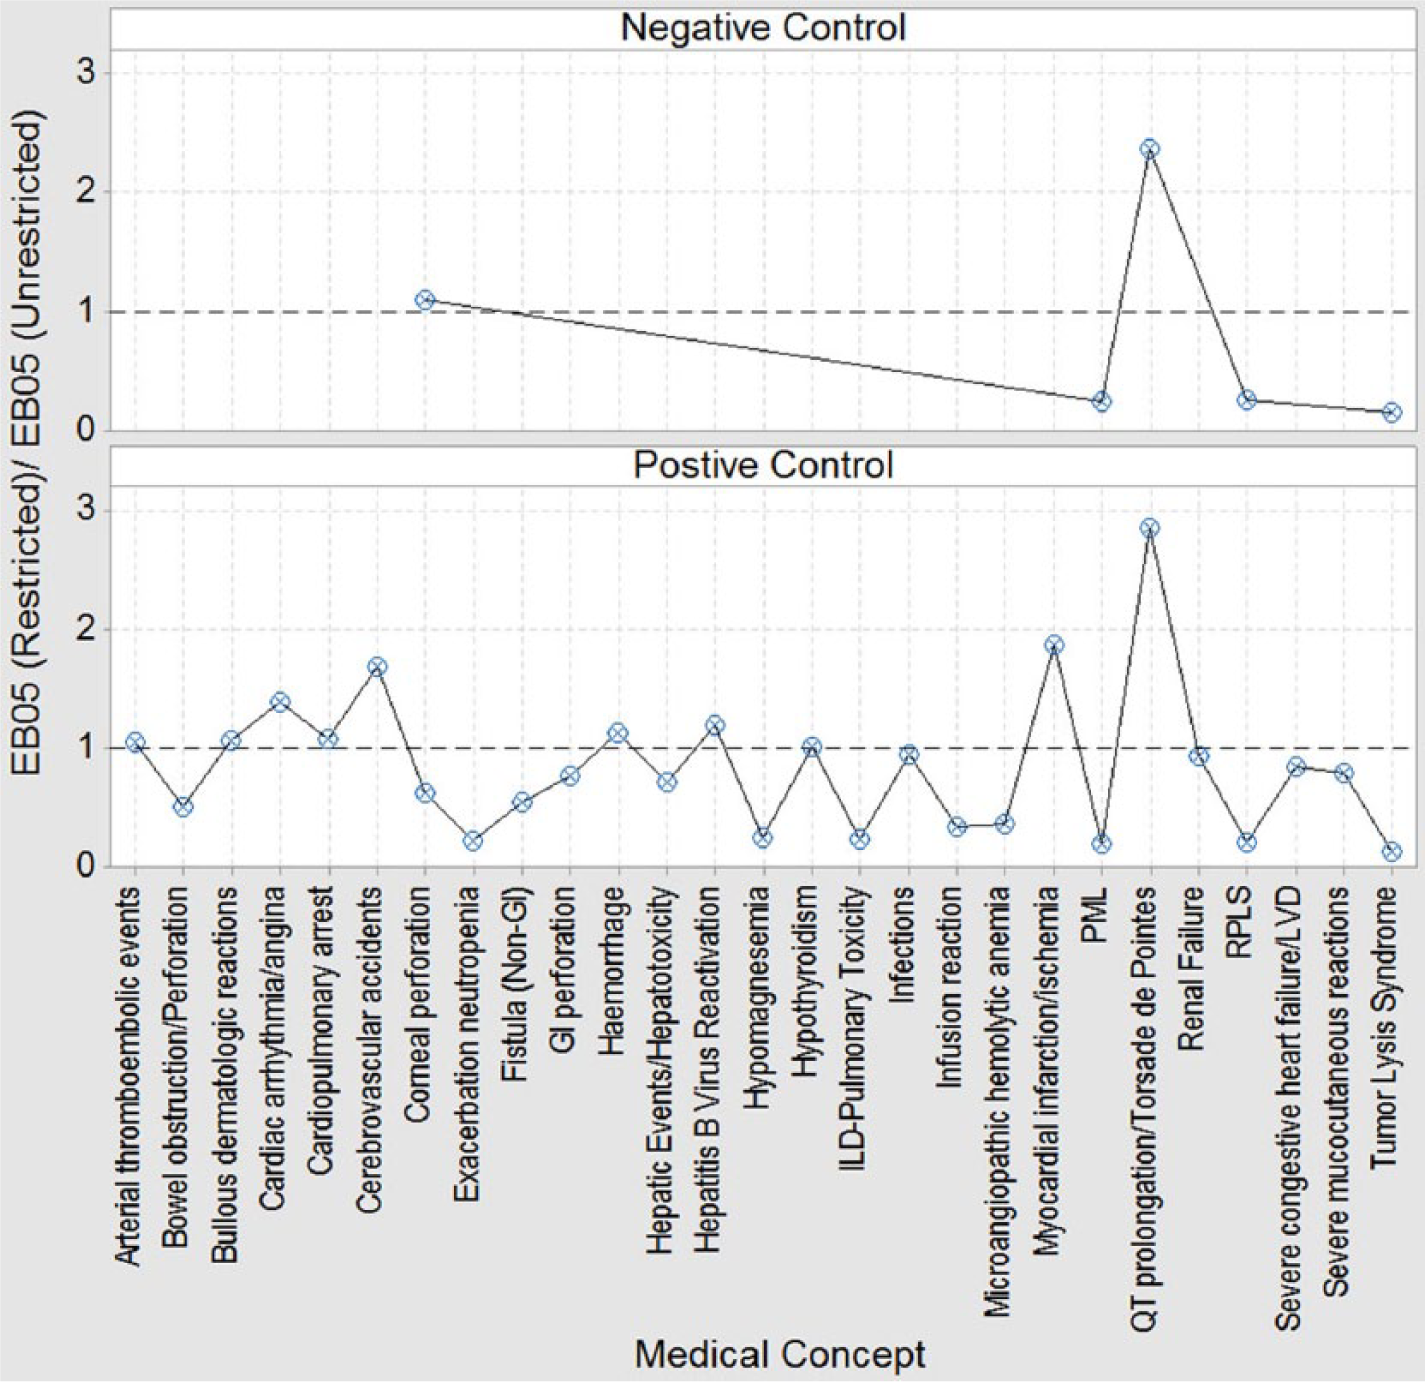
Positive/negative controls: plot of MCs and median EB05 proportions.
Classification performance metrics
The estimated overall sensitivities at the PT and MC levels were not comparable. The sensitivity for PCs at the PT level was 13.2% for the unrestricted analysis versus 3.1% for the restricted analysis (Table 4). At the MC level, the sensitivity for the unrestricted analysis decreased from 67.6% to 29.7% for the restricted analysis (Table 4). Specificity and PPV improved whereas NPV, F and MCC decreased but all changes were small relative to the decrease in sensitivity. For both the PT and MC levels, the S/N was higher for the restricted than the unrestricted analysis using the default EB05 > 2 (84/9 versus 20/1 and 25/9 versus 11/1, respectively).
Summary performance metrics.
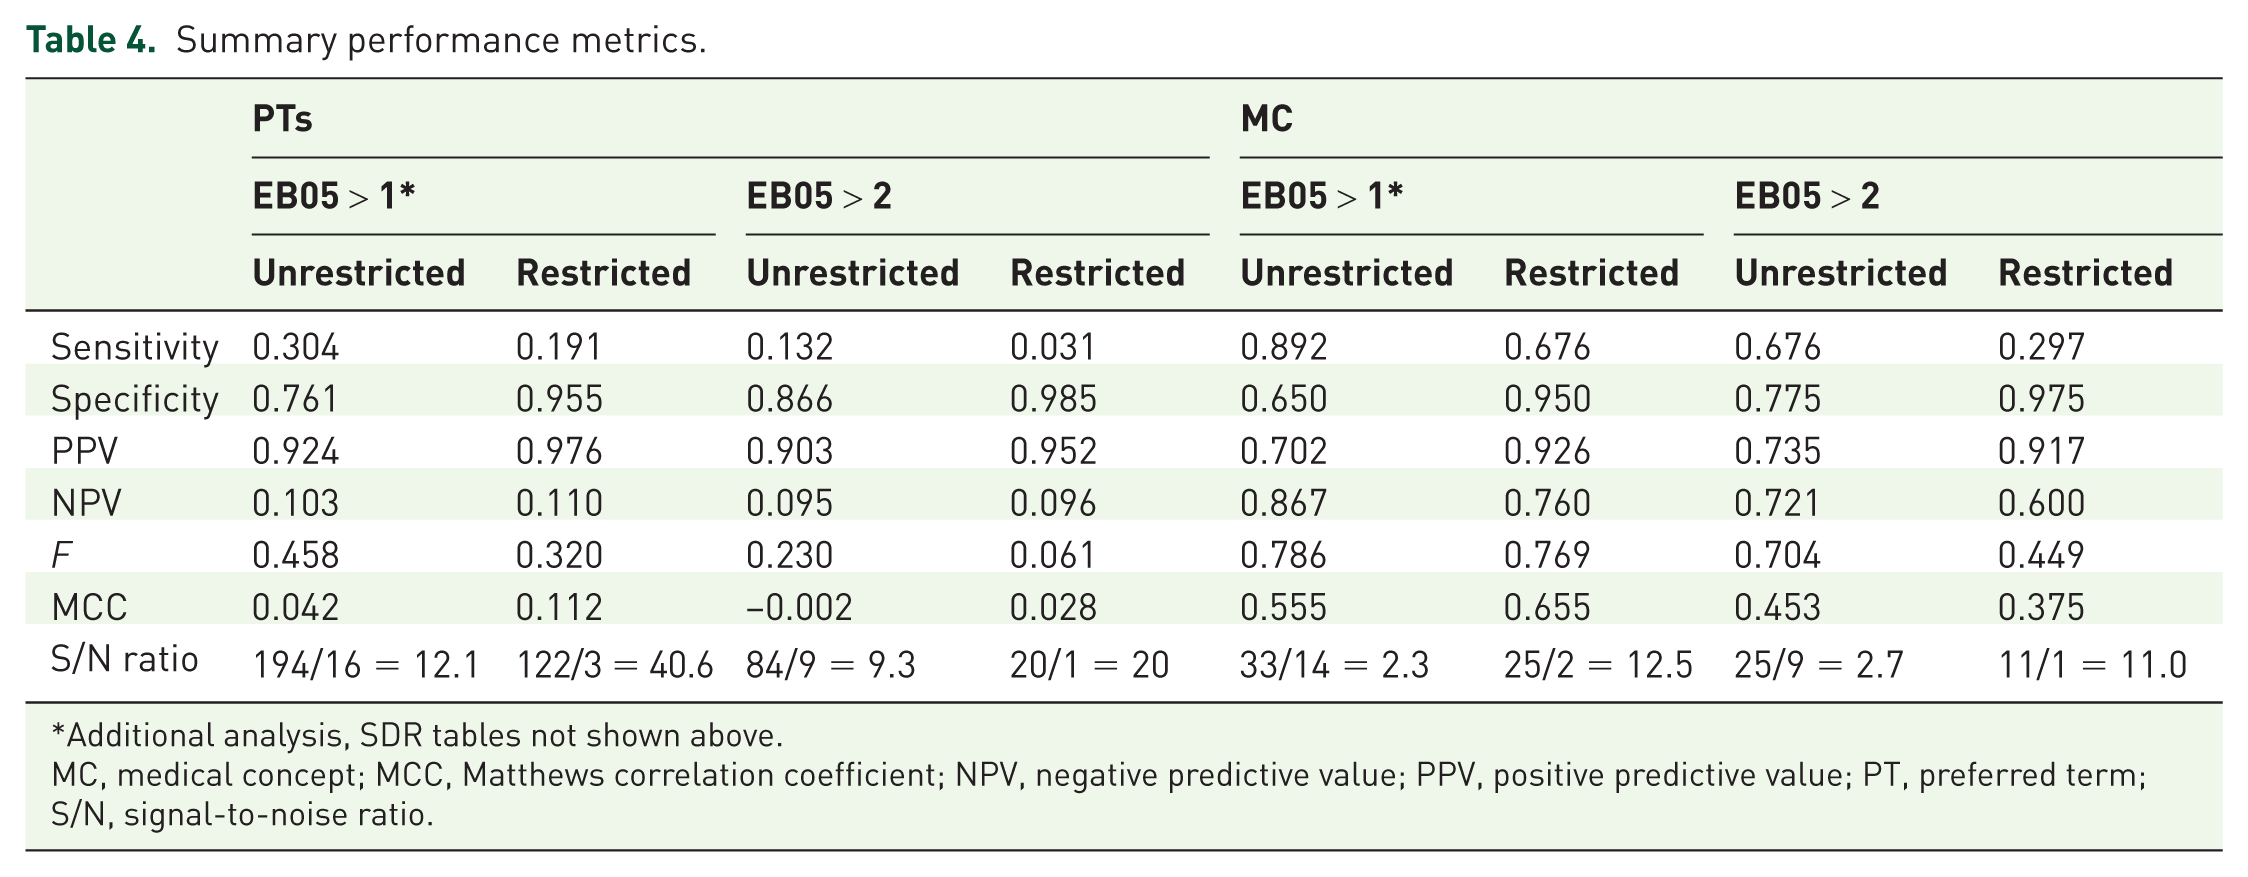
Additional analysis, SDR tables not shown above.
MC, medical concept; MCC, Matthews correlation coefficient; NPV, negative predictive value; PPV, positive predictive value; PT, preferred term; S/N, signal-to-noise ratio.
Discussion
This analysis was undertaken to estimate the impact and value of database restriction on previously identified and published sADRs for oncology products that resulted in a label update. 5 The database restriction consisted of limiting the background data to only antineoplastic agents. The published sADRs comprising our reference test set were assessed as to their SDR status. We chose to base the analysis on sADRs known to have already resulted in a label change and attempted to assess the effect of background restriction on signal detection performance against the benchmark of this relative truth.
The restriction resulted in the loss of a substantial number of SDRs corresponding to both signal and noise, with little or no SDRs gained. Restriction was slightly more likely to remove noise than to remove the signal (89% versus 84%). Expressed differently, 89% of SDRs with false positive DECs were lost versus 84% of SDRs with true positive DECs. The lost noise probably represents underlying diseases or treatment indications being coded as sADRs, a frequent occurrence in SRS data. Restricting the database, to oncology drugs would be expected to remove some of these disease confounded events. However, because the analysis involves compositional (e.g. proportions in a closed set) data, O/E ratios for individual DECs are not truly independent, so there were DECs whose O/E ratio increased as others decreased in response to the restriction, but this was not of sufficient magnitude to result in gained SDRs. Upward shifts tended to involve events that were not events classically associated with oncology drugs, such as QT/torsades de pointes and corneal perforation. This comports with theoretical expectations since the restriction results in a smaller database significantly enriched in prototypical oncology drug-related events, which tends to increase their expected counts and consequently lowering O/E ratios. The opposite holds for other types of events.
The restriction was associated with improvement in some performance metrics and degradation in others. Specifically, the S/N ratio improved substantially whereas, specificity and PPV also improved although sometimes by small amounts that may be interpreted as no change. Sensitivity, NPV, and F, declined. Qualitatively this was true for both the analysis at the PT and MC levels and with both the default EB05 > 2 and supplementary EB05 > 1 analysis, except for the MCC which improved modestly at the PT level but declined at the MC level. In general, performance was higher, and performance gradients (i.e. differences in performance metrics between restricted and unrestricted analyses) lower, when the unit of analysis was the MC versus the PT. Our findings of an improved S/N ratio resulting from an oncology database restriction is consistent with a previous study examining the impact of different database restrictions with DA using proportional reporting ratios (PRRs). 15
Although data mining exercises are often performed and reported at the PT level, we submit that our results support the notion that analysis at the MC level, while more complicated to implement and entailing additional subjective judgments related to event mapping, are more meaningful from the perspective of mapping to real-world pharmacovigilance scenarios as opposed to data mining exercises performed in a vacuum. This is because initial signal evaluation would normally accommodate multiple conceptually related PTs in a case definition. To the best of our knowledge, the MC framework, as implemented in our analysis, which accommodates gained versus lost, as well as strengthened versus weakened signals, is a novel approach to assessing comparative performance that provides important additional insights. For example, the usual performance metrics involve binary classification and do not accommodate the phenomena of signal strengthening/weakening, which can have impacts on signal triage or prioritization. To the best of our knowledge, the closest conceptual framework applied to spontaneous reports involves constructing a pharmacovigilance number-needed-to-detect metric. 16
From the binary classification perspective, of the four analyses (EB05 > 1 versus EB05 > 2, unrestricted versus restricted) the EB05 > 1 with oncology restriction had overall the best performance, ranking 1st or 2nd on all calculated performance metrics.
All considered, whether or not the restricted data set is more desirable from the perspective of oncology signal detection is situation dependent. It would depend on the calculus of costs and utilities associated with detected versus missed credible and spurious signals. It would also depend on how the strengthening and weakening of signals affected their triage, which is more difficult to quantify.
In conclusion, background restriction would be expected to decrease the sensitivity while increasing the specificity of observed events or SDRs. Analyses based on an unrestricted database should be the preferred approach for exploratory signal detection due to higher sensitivity. Conducting further analyses based on a restricted database may enable the researcher to further refine and assess SDRs detected during exploratory signal detection due to higher specificity. These trade-off choices between sensitivity and specificity are primarily driven by the interest of the individual researcher. Analyses on restricted databases should be conducted judiciously following unrestricted database analyses.
We acknowledge limitations in our analysis. First and foremost are the substantial and well recognized limitations of the data. The FAERS database primarily includes spontaneous AE reports of varying quality. The US FDA does not require that a causal relationship between a product and event be proven, and reports do not always contain enough detail to properly evaluate an event. Details that would aid in the assessment of causality, such as data on drug dose or the timing and duration of exposure relative to the event is frequently missing. There is known under-reporting and over-reporting in the FAERS database, which could introduce bias if the level of reporting is influenced by the type of AE. The database may include entries with incorrect AE coding or classification and has limited information regarding the nature and severity of the event.
Our preliminary analysis is based on a convenience sample of drugs and so our results may not be representative of the clinical and quantitative phenotypes encountered in real-world oncology pharmacovigilance. In addition, we did not have full knowledge of the exact assessment made by the companies to add sADRs to their label in the Seruga et al. publications.5,6 However, we assumed that the additions were justified and therefore, represented the relative truth for our analysis. A natural extension of our research will be to apply our analytic framework to a more diverse set of oncology DECs.
Our study is cross-sectional in nature. There are two important dimensions of comparative signal detection performance; whether or not credible signals are accurately distinguished from noise, and the timeliness of signal detection. 17 We did not assess time-to-detection in this analysis.
While the reference DECs used in our study are fairly recent, they may still be considered established and it should be noted that the performance of signal detection algorithms may vary between established versus newly emerging safety issues. 17
Our reference set is substantially imbalanced with more PCs than NCs. This can affect calculated performance metrics but we mitigated this concern using various performance metrics, some more or less sensitive to class imbalance. Nonetheless, additional summary performance metrics, such as receiver operating characteristic or precision-recall curves, may add additional insights.
Our conceptual framework for assessing performance at the MC level is based on DA used for binary classification (i.e. signal present versus absent). Certain changes that could occur due to database restriction are not accommodated by a binary classification framework. For example, an MC-SDR might retain the same number of PT-SDRs, but if the magnitude of one or more PT-SDRs within the MC-SDR increases or decreases, the corresponding signal could be considered to be strengthened or weakened respectively.
We used one form of DA out of several available. Our selected variant of DA known as MGPS has been viewed as placing a premium on specificity over sensitivity. It is noteworthy that the sensitivity of the algorithm, as commonly implemented, was low. While undoubtedly an elegant option to mitigate the false positive burden of DA applied to large, sparse SRS databases in the process of mitigating noise, MGPS ‘might obfuscate a real signal by reducing it to a nonconspicuous level.’ 3 This may have had an impact for DECs that had low O or E frequencies.
The background restriction on antineoplastic agents implemented in this analysis is not the only way restriction can be defined. Restriction on other parameters (e.g. class of drug or specific indications) is possible and therefore, the findings in this paper illustrate the effect and value of database restriction, but have limited generalizability to other modes of database restriction, or to drugs beyond antineoplastic agents.
Footnotes
Funding
The author(s) received no financial support for the research, authorship, and/or publication of this article.
Conflict of interest statement
MH and EH are employees of Pfizer Inc., NY, USA and own stock or stock options for Pfizer Inc.
JW, AS, and DR are employees of Bristol-Myers Squibb, NJ, USA and own stock or stock options for Bristol-Myers Squibb.