
Abstract
Objective:
High concentrations of antituberculosis (anti-TB) drugs can be associated with many adverse drug reactions (ADRs). The objective of this study was to examine the plasma concentrations of rifampicin (RMP) and isoniazid (INH) in patients with and without ADRs.
Methods:
Concentration monitoring data of patients treated with anti-TB drugs were retrospectively analyzed from 2009 to 2011. RMP and INH plasma concentrations were measured 2 and 3 h after drug administration respectively using high-performance liquid chromatography.
Results:
A total of 54 out of 120 patients have experienced ADRs to anti-TB drugs. The median concentrations [interquartile range (IQR)] obtained in patients with and without ADRs were 6.7 mg/l (3.7–9.9) and 5.6 mg/l (2.9–8.6) (p = 0.56) for RMP and 4.3 mg/l (2.3–5.3) and 3.1 mg/l (1.7–4.8) (p = 0.04) for INH, respectively. Related median doses (IQR) were 8.7 mg/kg (8.0–10.0) and 8.6 mg/kg (6.5–9.9) (p = 0.42) for RMP and 4.8 mg/kg (4.3–5.0) and 4.0 mg/kg (2.8–5) (p < 0.01) for INH, respectively. Concentrations above the expected range in patients with and without ADRs were not reached for RMP, but were 76% and 65% for INH, respectively. Correlation between concentrations and doses has not been established for RMP or INH. In addition, high INH concentrations showed no association with sex, age, liver injury or renal or diabetes.
Conclusions:
High INH concentrations were common in patients with and without ADRs whereas RMP concentrations were low or within the normal range in most patients. Further studies are required to assess the association between high INH concentrations and the occurrence of ADRs.
Introduction
Worldwide, tuberculosis (TB) is a major public health problem. In 2014, the World Health Organization estimated around 9.6 million people developed TB and 1.5 million died from the disease [World Health Organization, 2015]. In Morocco, between 27,000 and 28,000 new cases are reported annually with an incidence of 83 cases per 100,000 population. The global TB burden is still strongly associated with precarious living conditions, emergence of drug-resistant TB and HIV coinfection.
Standard therapeutic regimens including rifampicin (RMP), isoniazid (INH), pyrazinamide (PZA), ethambutol (EMB) and streptomycin (SM) are effective and generally well tolerated. However, some adverse drug reactions (ADRs) may compromise the effectiveness of the treatment and induce severe complications that increase morbidity and mortality [Forget and Menzies, 2006; Aouam et al. 2007; Perriot et al. 2011; Gülbay et al. 2006]. High plasma concentrations of anti-TB drugs have been associated with many ADRs induced by anti-TB therapy [Satyaraddi et al. 2014; Eichelbaum et al. 1992; Evans, 1989; Peloquin, 2002; Woo et al. 1995; Ben Fredj et al. 2016]. High plasma concentrations can be derived from inappropriate doses of the drug, interindividual pharmacokinetic variability and comorbidities including liver and kidney damage [Evans, 1989; Peloquin, 2002; Woo et al. 1995; McIlleron et al. 2006; Yew, 1998, 2001]. In some instances, high plasma concentrations can be reduced by dose adjustment.
Therapeutic drug monitoring (TDM) is the process of measuring blood concentration of the drug to adjust the dose regimens required to obtain an optimal effectiveness with minimal ADRs or toxicity [Li et al. 2004]. TDM of anti-TB drugs is not commonly used in the optimization of TB treatment. However, monitoring the anti-TB drug concentrations can provide considerable information for the clinician to enhance drug efficacy and minimize occurrence of ADRs.
In this study, we considered RMP and INH plasma concentrations performed routinely in patients treated with anti-TB therapy. The concentration of RMP measured 2 h after an oral administration (C2 RMP) was used as the estimated peak RMP concentration. Therapeutic range is commonly estimated at 8–24 mg/l [Peloquin, 2002]. The concentration of INH was measured at 3 h post-dose (C3 INH). Previously published data reported that C3 INH level should range from 1 to 2 mg/l to be efficacious and to reduce the neurotoxic adverse events [Vivien et al. 1973; Compagnon et al. 2004]. Data collected throughout 3 years were analyzed to examine the C2 RMP and C3 INH levels in patients with and without ADRs to anti-TB drugs, and also to identify the potential risk factors for plasma concentrations above the therapeutic range.
Methods
Patients
We conducted a retrospective study among patients in whom C2 RMP and C3 INH levels were performed between January 2009 and December 2011 in the laboratory of Toxicology and Pharmacology of Moroccan Poison Control and Pharmacovigilance Center, Rabat, Morocco. An authorization was obtained for research purposes from the center’s health authority. The study was conducted on individuals from inpatient and outpatient facilities in the city of Rabat. The reasons for RMP and INH measurement were routine drug assessment, comorbidity associations and ADRs. Data used were retrieved from the TDM database of the laboratory, and included patient demographics, TB sites, treatment regimens, comorbidities, ADRs experienced, blood sampling modalities and results of C2 RMP and C3 INH levels.
All patients, aged 18 years and older, treated for pulmonary or extrapulmonary TB by the first-line anti-TB drugs and who had a C2 RMP or C3 INH level were included in the study. Measurements performed at least 1 week after therapy were considered. Patients with ADRs suspected to be unrelated to anti-TB drugs were excluded from the study. The ADRs were evaluated retrospectively for causality assessment using the WHO– Uppsala Monitoring Centre (UMC) method (see http://who-umc.org/Graphics/24734.pdf). Causality terms include certain, probable, possible, unlikely, conditional/unclassified or unassessable/unclassifiable.
Blood sampling and assay methods
The measurement of RMP and INH plasma levels was performed under usual conditions of their use. Patients were given their daily prescribed dose of TB medication in the morning while fasting and then were restricted from eating or drinking for 2 h after taking the medication. Venous blood samples were collected 2 and 3 h after medication administration in order to estimate the C2 RMP and C3 INH levels, respectively. After that, blood samples were centrifuged at 3000 rpm for a period of 15 min and plasma was stored at −20°C. The average durations of storage prior analysis were 2.5 ± 2.0 days (range of 0–7 days) for RMP and 2.7 ± 2.2 days (range of 0–7 days) for INH. Both RMP and INH are stable at −20°C during that time [Lacroix et al. 1984; Le Guellec et al. 1997].
Drug concentrations were measured using high-performance liquid chromatography (HPLC). The C2 level of RMP was quantified as follows: 400 µl of plasma sample was deproteinized with 400 µl of acetonitrile containing flunitrazepam as internal standard. The mixture was vortex mixed for 20 s and then centrifuged for 10 min at 3000 rpm. The supernatant was half diluted with water and 50 µl were injected into the chromatograph. An Agilent 1100 series HPLC (Agilent technologies, Santa Clara, CA, USA) equipped with a model G1311A pumping system, a model G1313A autosampler and a model G1315B diode array detector was used. Analysis was performed using Res Elut C18 column (250 × 4.6 mm, Varian, Harbor city, USA). The mobile phase was a mixture of ammonium acetate buffer (0.01 M, pH 6), and acetonitrile (60/40: v/v) with a flow rate of 1 ml/min. the detection was carried out at 334 nm. No interference was found with endogenous substances, or with co-administered drugs, primarily INH, PZA, EMB and SM. The linearity was over the range of 0.3–12 mg/l (r = 0.9999). Intra-day precision was 3.7–7.0%. Inter-day precision was 3.4–6.7%. The detection limit was 0.1 mg/l. The C3 level of INH was measured in the plasma using the HPLC method described previously by Aït Moussa and colleagues [Aït Moussa et al. 2002b]. In brief, 500 µl of plasma sample were deproteinized with 250 µl of 10% trichloroacetic acid solution containing nicotinamide as internal standard. The mixture was vortex mixed and centrifuged. The supernatant was half diluted with ammonium acetate buffer (0.5 M, pH 8.2) and 50 µl were injected into a µ Bondapak C18 column (300 × 3.9 mm, Waters, Laboratory Instruments Network, Villers-les-Nancy, France). The mobile phase was a mixture of ammonium acetate buffer (0.05 M, pH 6), and acetonitrile (99/1: v/v) with a flow rate of 1.2 ml/min. the detection was carried out at 275 nm. The technique was evaluated using a factorial design of validation. The linearity range was 0.5–8 mg/l. The intra-day precision was 3.32% for the measurement and 3.54% for the sample processing. The inter-day precision was 7.96%. The detection limit was 0.2 mg/l.
Statistical analysis
Patients were classified according to whether or not they had an ADR at the time of the concentration measurement. Comparison between the two groups of patients, with and without ADRs, was performed by the chi-squared test or Fisher’s exact test for qualitative variables and the Student’s t-test for quantitative variables. Bivariate logistic regression analysis was used to determine the factors potentially affecting the occurrence of ADRs. Simple linear regression was used to examine the correlation between drug concentrations and the doses. Relative risk (RR) and confidence intervals (CIs) were calculated to determine the risk factors for plasma levels above the expected range. Data were interpreted using 95% CIs. A p < 0.05 was considered significant. Data entry and analysis were performed using Microsoft Excel 2007 (Microsoft, Redmond, WA, USA) and SPSS version 20 (SPSS Inc., Chicago, IL, USA).
Results
During the study period, C2 RMP and C3 INH levels were analyzed in 167 patients treated with the first-line anti-TB drugs. Among them 47 were excluded from the study for different reasons: 10 were <18 years, 8 had an ADR probably related to other drugs and 29 had samples taken at the wrong time or after treatment had been discontinued. Thus, a total of 120 patients were included in the study, 54 (45%) of whom had experienced ADRs at the time of the plasma assays. A summary of patients’ characteristics is shown in Table 1.
Characteristics of patients treated with first-line tuberculosis therapy.
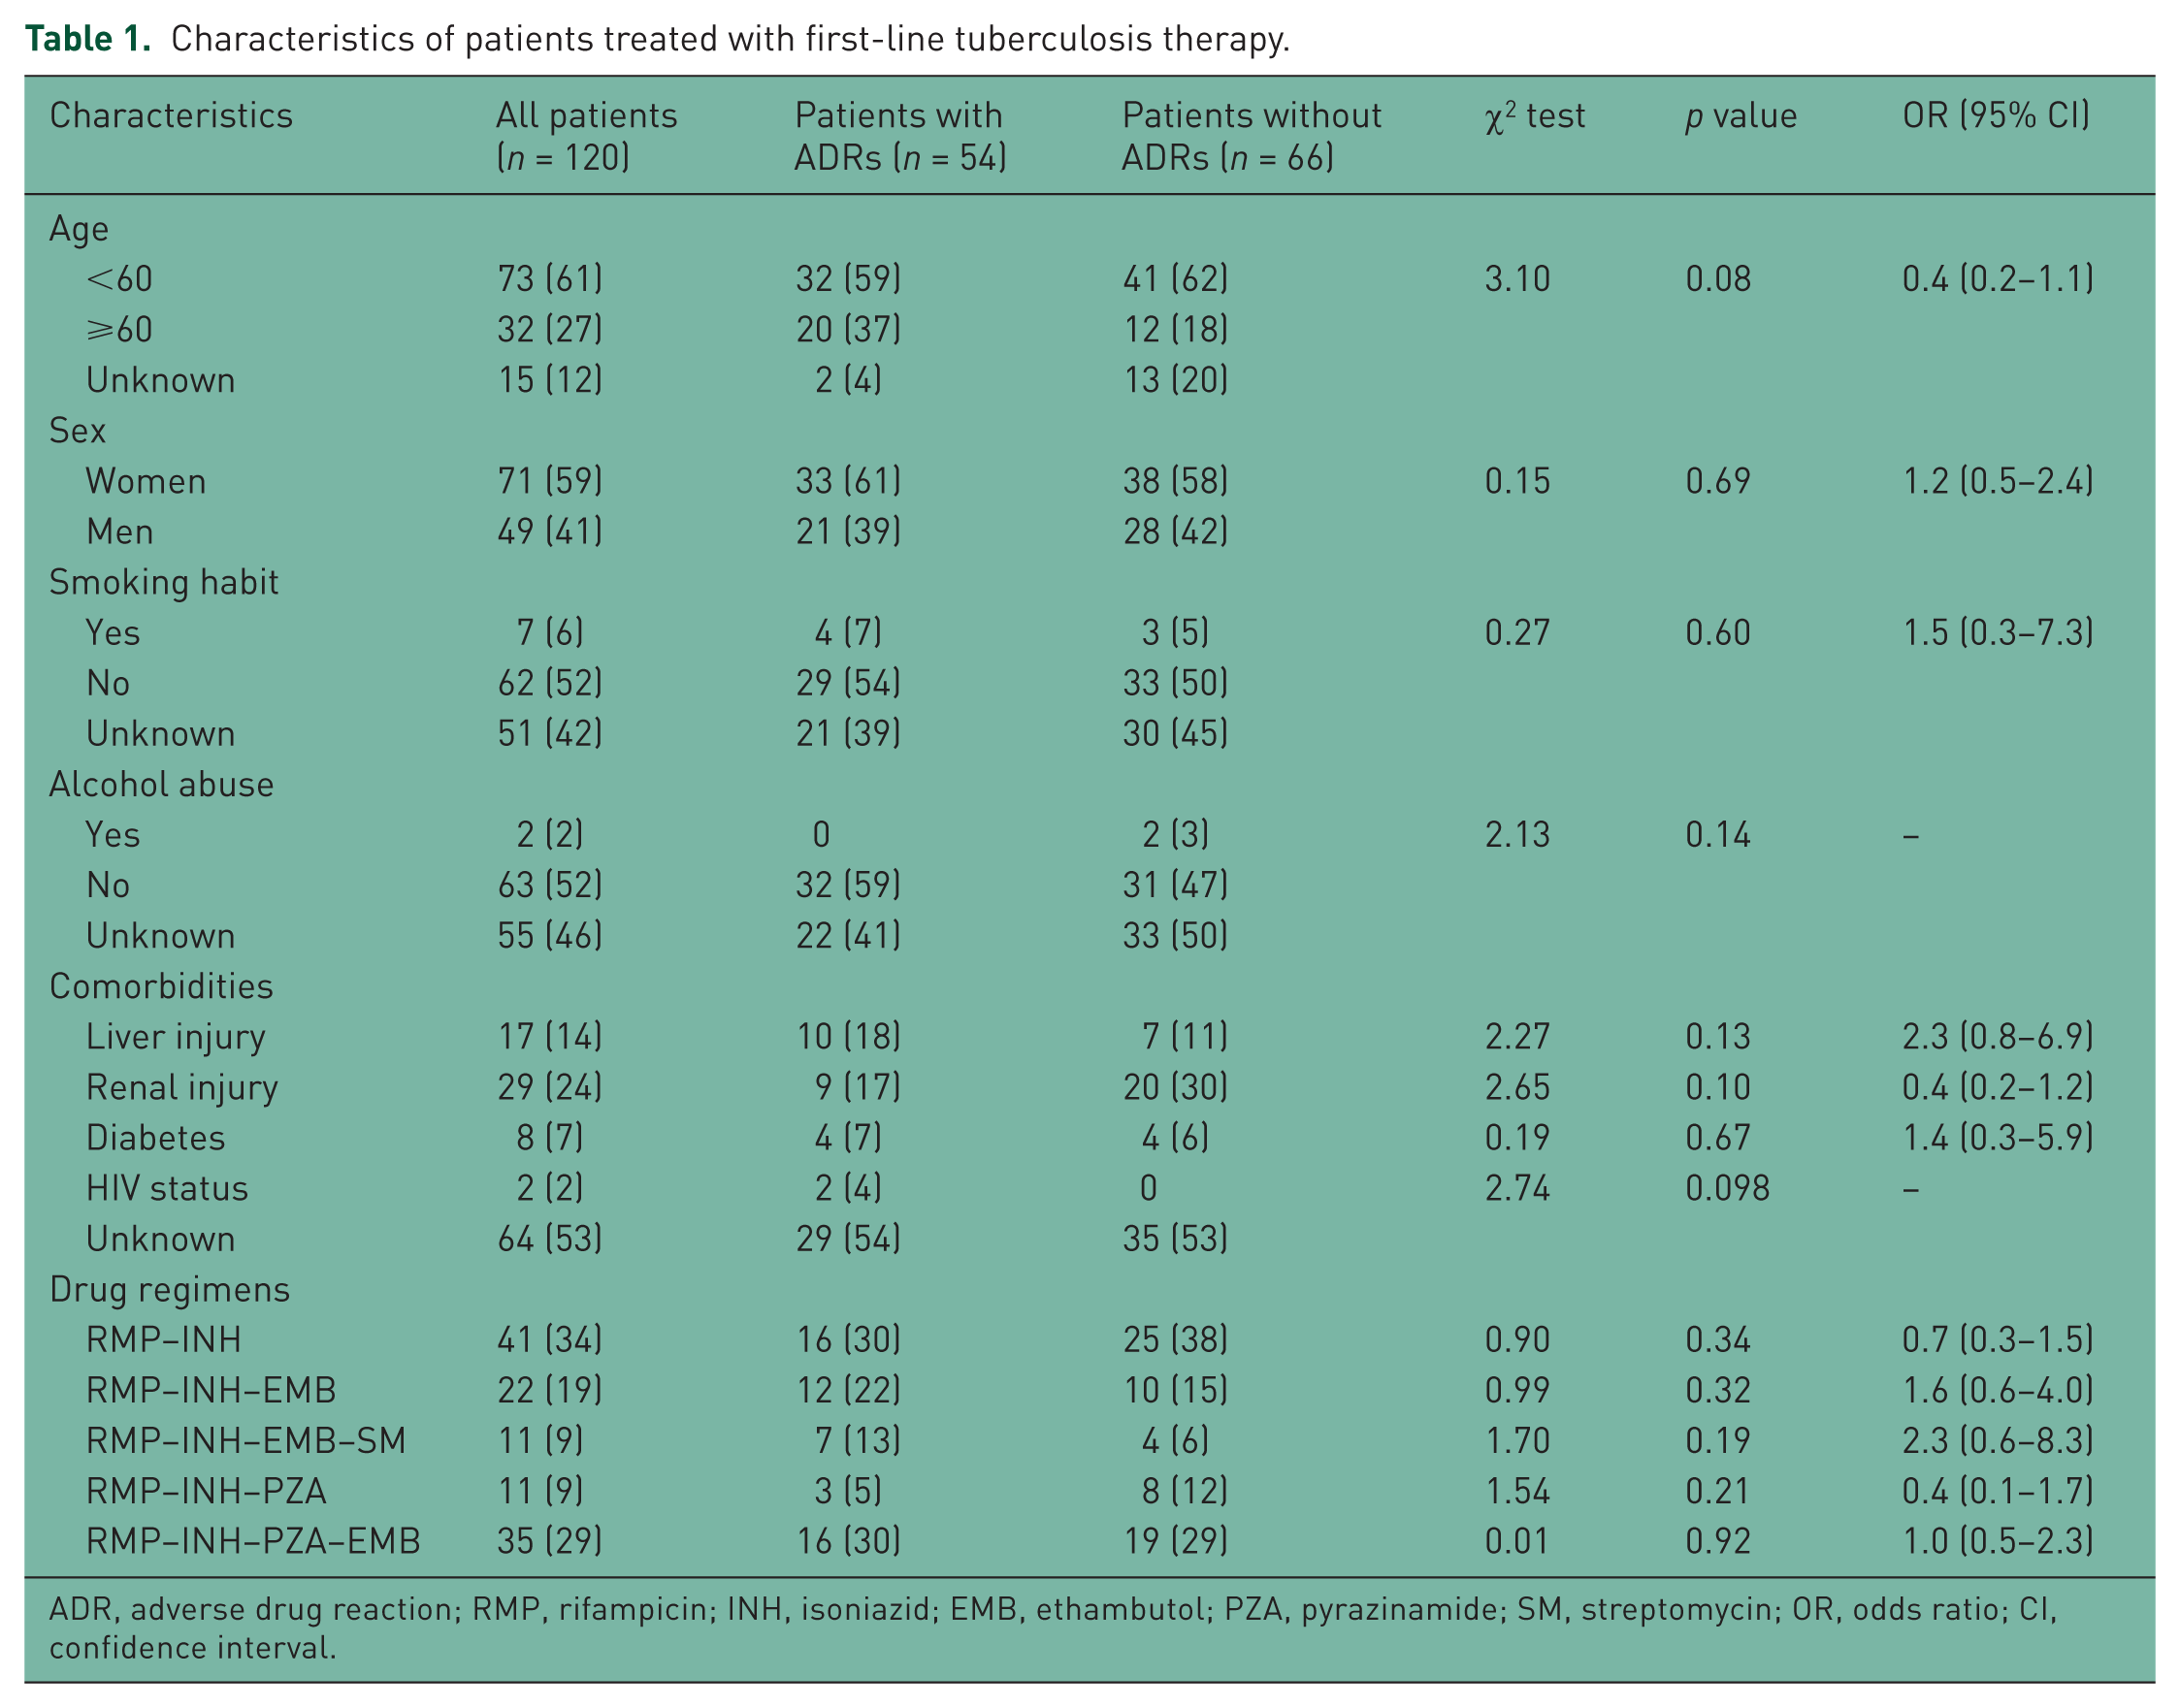
ADR, adverse drug reaction; RMP, rifampicin; INH, isoniazid; EMB, ethambutol; PZA, pyrazinamide; SM, streptomycin; OR, odds ratio; CI, confidence interval.
The median ages [interquartile range (IQR)] of patients with and without ADRs were 46.5 (28.5–68) years and 46 (32–56.5) years, respectively (t = 0.56; p = 0.57). The majority were women, nonsmoking and nonalcoholic. A total of 47% had comorbidities including liver or renal injury, diabetes or HIV infection. A total of 66% were treated with more than two anti-TB drugs at the time of the assay. There was no significant difference in demographics, comorbidities or anti-TB regimens between patients with and without ADRs (p > 0.05). None of the studied factors were found to be associated with occurrence of ADR in bivariate analysis. Among all patients, 18% had pulmonary TB and 34% had extrapulmonary TB. In 48% of patients, the disease sites were not recorded.
ADRs reported involved 61 reactions from 54 patients. Six patients experienced at least two reactions. According to system-organ classification, the liver and biliary system disorders were the most frequent (68.8%) and were mainly dominated with increased hepatic enzyme (55.3%). Other less-frequent ADRs included skin and appendages disorders (13.1%), central and peripheral nervous system disorders (9.8%), body as a whole-general disorders (3.3%), gastrointestinal system disorders (3.3%) and musculoskeletal system disorders (1.7%). Causality relationship between the ADRs reported and the suspected drug regimens revealed that 59 (96.7%) ADRs were possible and 2 (3.3%) were probable.
A total of 63 C2 RMP levels and 120 C3 INH levels were measured from 120 patients. No measured concentrations were below the limit of assay quantification for both drugs. Results obtained are summarized in Table 2.
Plasma concentrations of rifampicin and isoniazid in patients with and without ADRs.
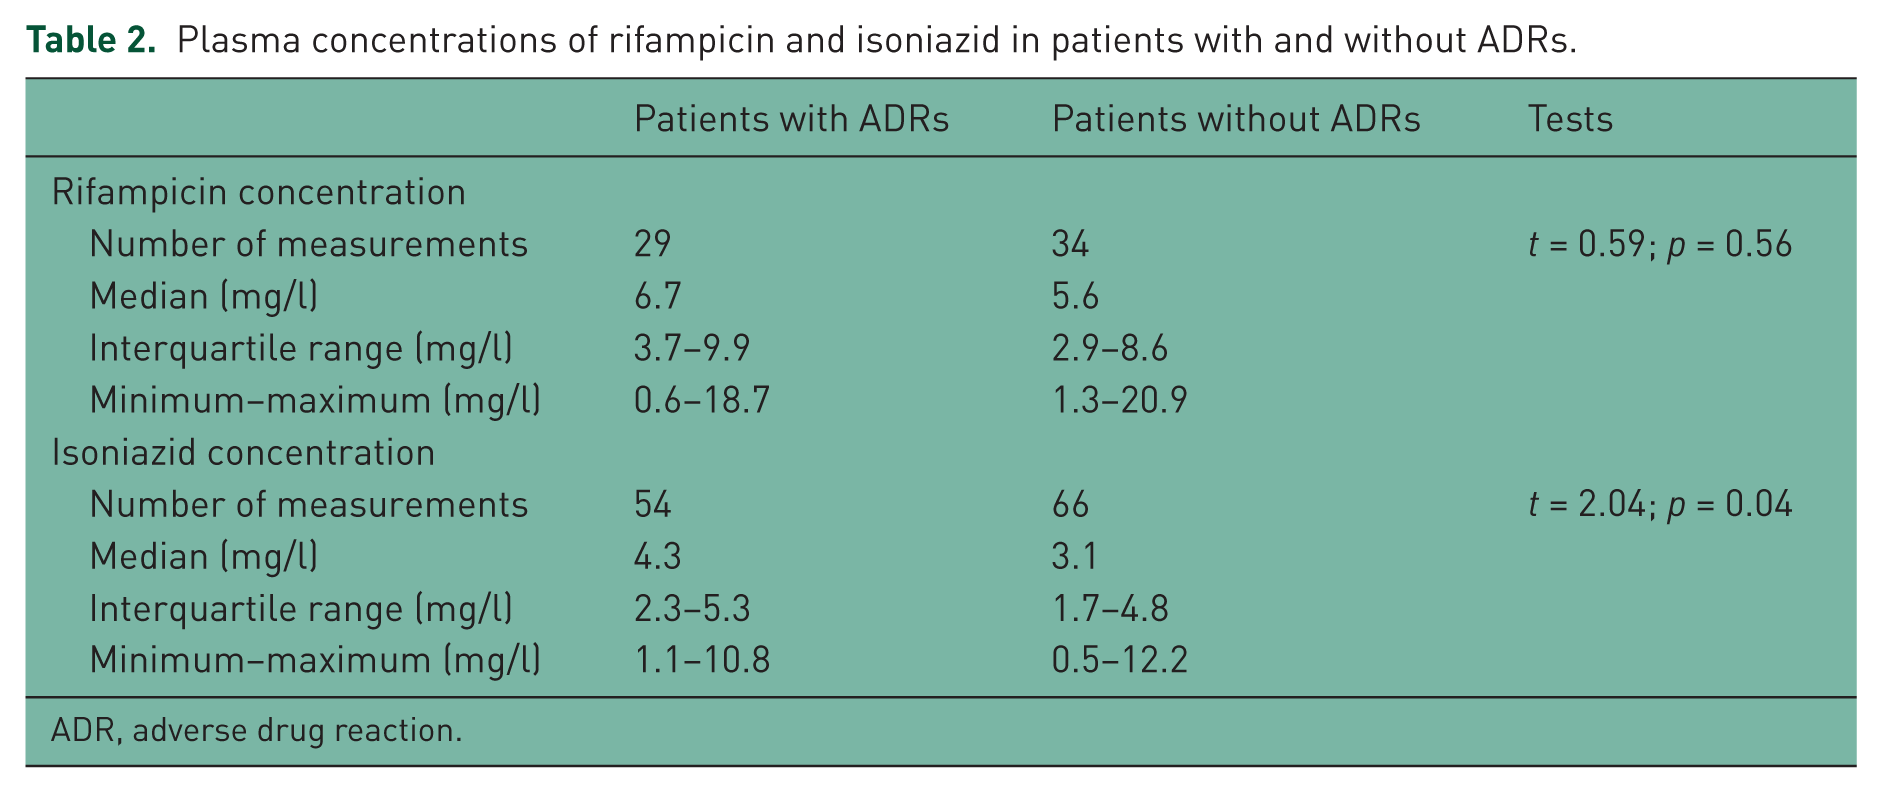
ADR, adverse drug reaction.
C2 RMP levels involved 29 measurements from patients with ADRs and 34 measurements from patients without ADRs, with medians (IQR) of 6.7 mg/l (3.7–9.9) and 5.6 mg/l (2.9–8.6), respectively (Table 2). The medians were not statistically different (t = 0.59; p = 0.56). Considerable variability in the C2 RMP levels is shown in Figure 1. The C2 RMP levels below the therapeutic range were common both in patients with ADRs (55%) and in patients without ADRs (74%); while no patients with or without ADRs had higher than expected plasma levels. The C2 RMP levels within the therapeutic range were 45% in patients with ADRs and 26% in patients without ADRs. The median doses to body weight of RMP (IQR) in patients with and without ADRs were 8.7 mg/kg (8.0–10.0) and 8.6 mg/kg (6.5–9.9), respectively. The difference was not statistically significant (t = 0.80; p = 0.42). The relationship between C2 RMP levels and the doses reported to body weight showed no correlation both in patients with ADRs (r = 0.33) and in patients without ADRs (r = −0.42).
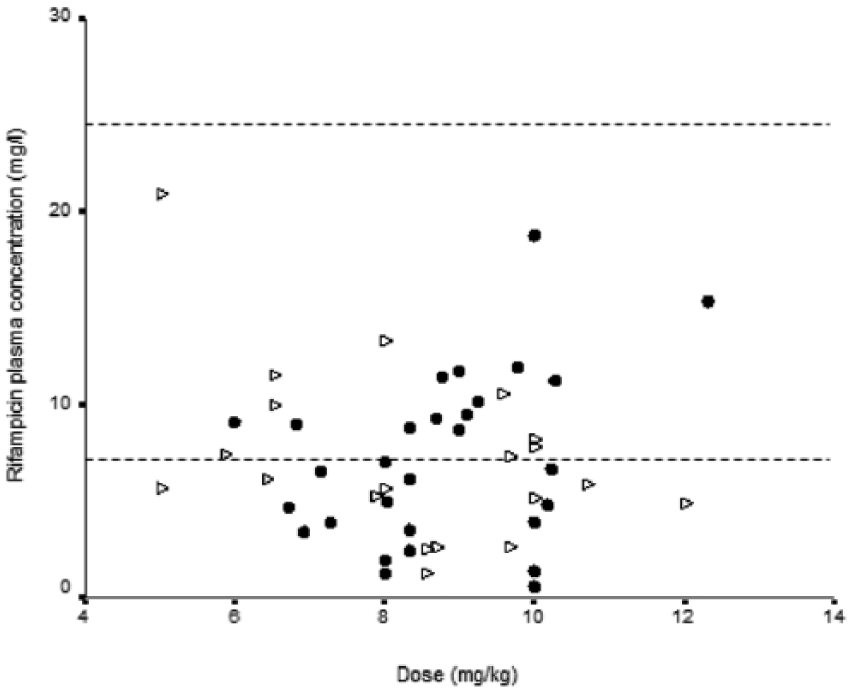
Rifampicin plasma concentrations versus doses in patients with and without adverse drug reactions (ADRs): •, patients with ADRs; ∆, patients without ADRs. Thin lines represent the therapeutic range of rifampicin 2 h after drug administration.
C3 INH levels involved 54 measurements from patients with ADRs and 66 measurements from patients without ADRs, with medians (IQR) of 4.3 mg/l (2.3–5.3) and 3.1 mg/l (1.7–4.8), respectively. The medians were statistically different (t = 2.04; p = 0.04). Wide variability in the C3 INH levels was observed (Figure 2), with only 24% of the concentration within the therapeutic range in patients with ADRs and 27% in patients without ADRs. The C3 INH levels above the therapeutic range were 76% in patients with ADRs against 65% in patients without ADRs. Otherwise, none of the patient with ADRs had a low C3 INH level. The median doses to body weight of INH (IQR) were 4.8 mg/kg (4.3–5.0) in patients with ADRs and 4.0 mg/kg (2.8–5.0) in patients without ADRs. The difference was statistically significant (t = 3.34; p < 0.01). The relationship between C3 INH levels and the doses reported to body weight showed no correlation between the two parameters both in patients with ADRs (r = 0.22) and in patients without ADRs (r = 0.06).
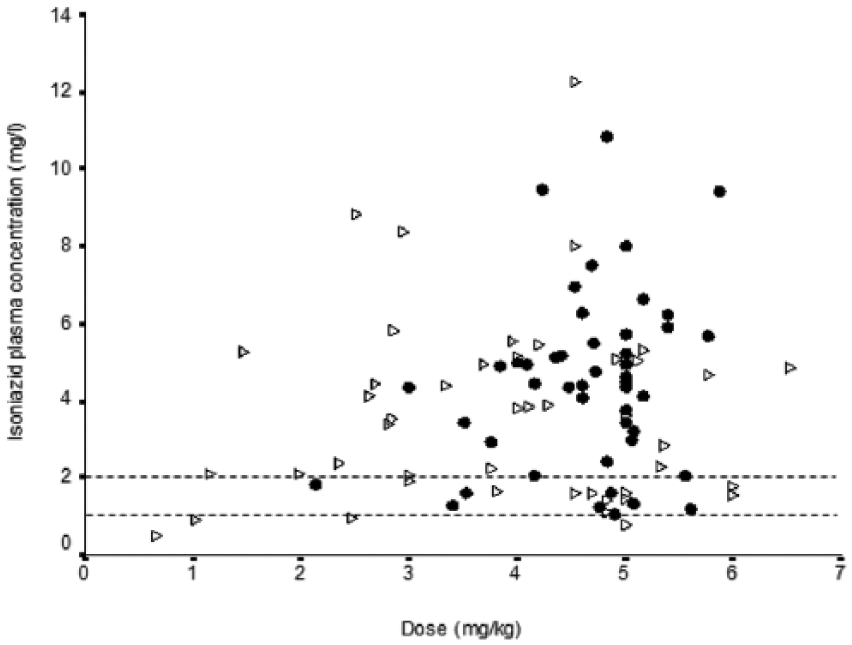
Isoniazid plasma concentrations versus doses in patients with and without adverse drug reactions (ADRs): •, patients with ADRs; ∆, patients without ADRs. Thin lines represent therapeutic range of isoniazid 3 h after drug administration.
The analysis of risk factors for concentrations above the therapeutic range showed that high C3 INH levels were found to be not associated with female sex (RR 1.0; 95% CI 0.8–1.4) or male (RR 0.9; 95% CI 0.6–1.5), age over 60 years (RR 1.2; 95% CI 0.7–2.3), liver injury (RR 0.7; 95% CI 0.2–1.9), renal injury (RR 0.6; 95% CI 0.3–1.2) or diabetes (RR 0.7; 95% CI 0.2–3.4; Table 3). The analysis was not performed for RMP as no patients showed a concentration above the therapeutic range.
Risk factors for INH plasma concentrations above the expected range.
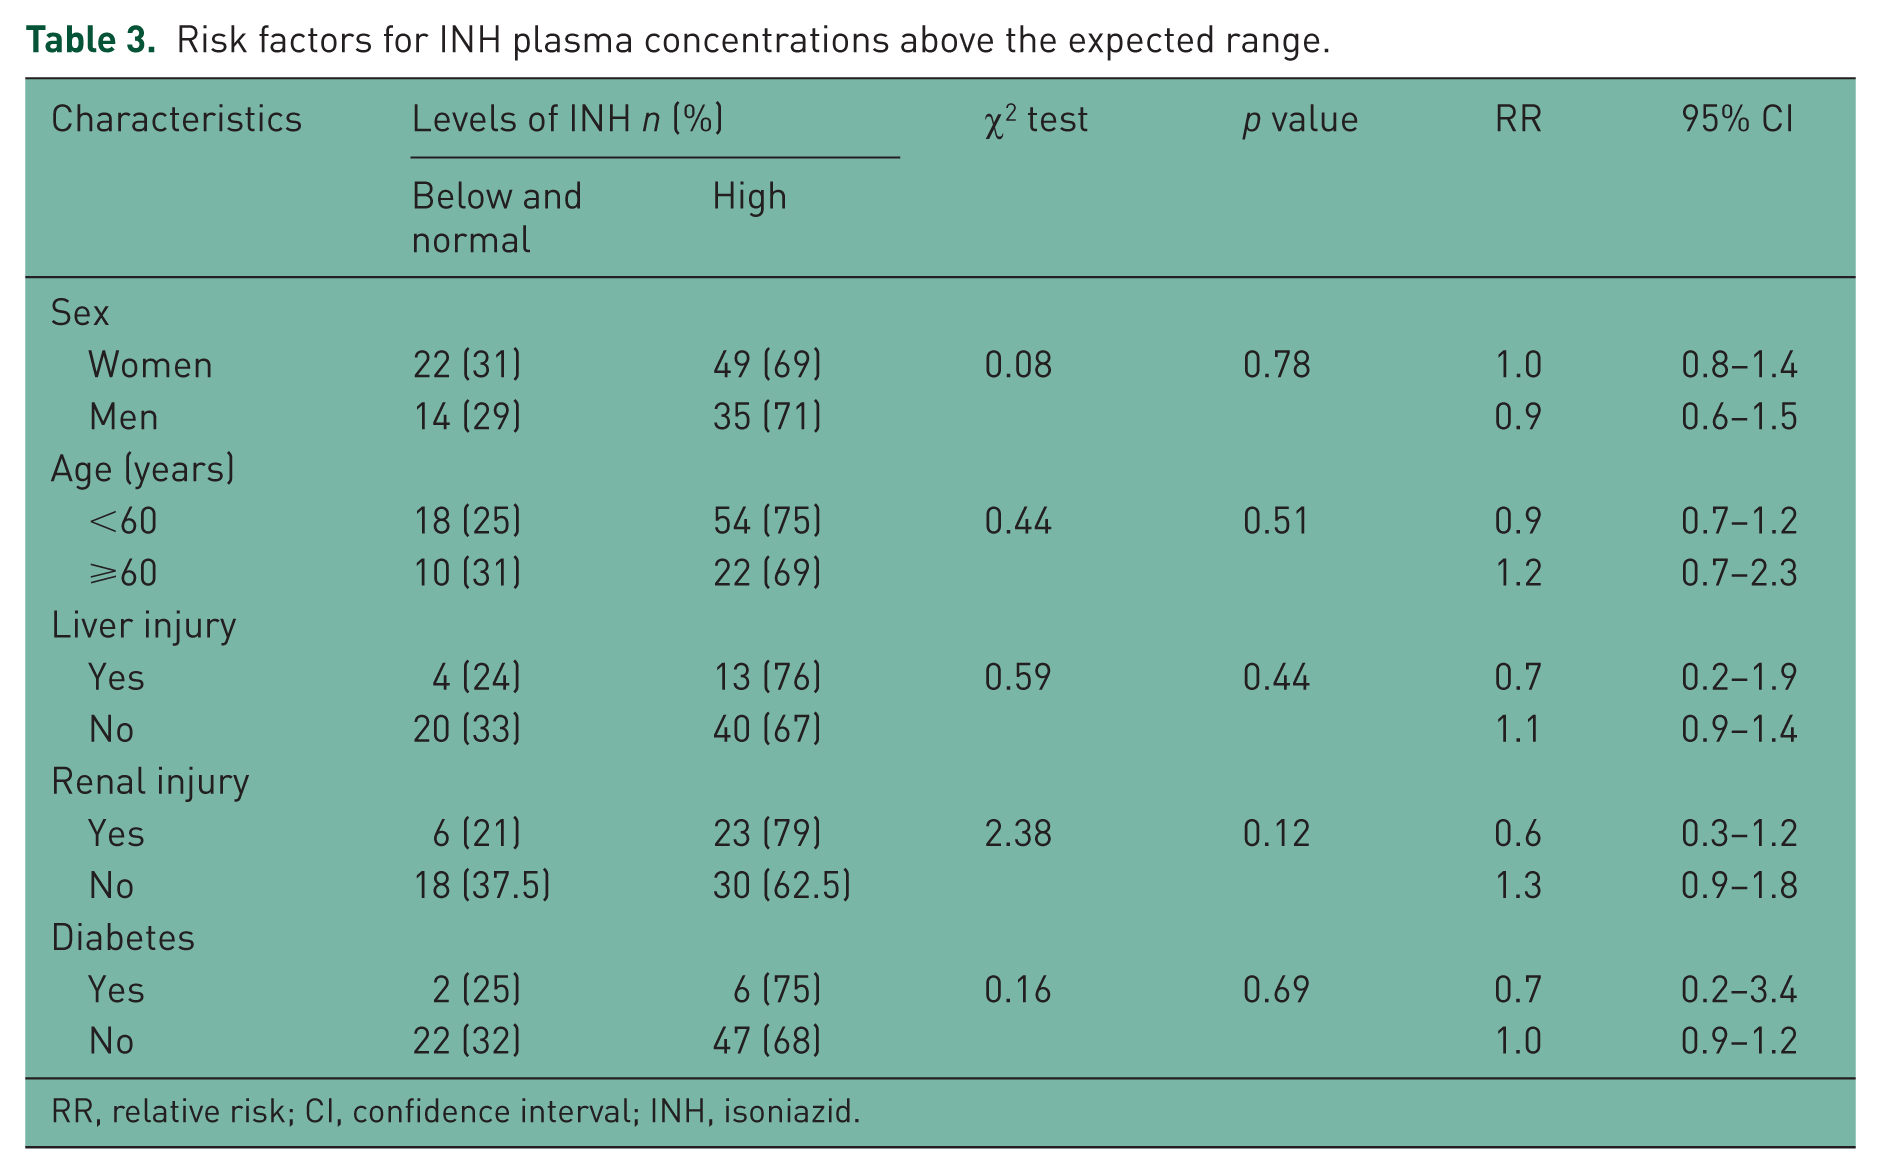
RR, relative risk; CI, confidence interval; INH, isoniazid.
Discussion
In the present study, 45% of patients had ADRs to anti-TB drugs. The most frequently recorded ADRs have involved liver and biliary system disorders (68.8%) with increased hepatic enzyme as the most predominant symptoms (55.3%). Patients with and without ADRs showed no significant difference in demographics or clinical characteristics. In contrast, many studies in the literature reported that an increased risk of ADRs to anti-TB drugs can be associated with several independent factors including female sex, age over 60 years, hepatic comorbidity, smoking and alcoholism [Yee et al. 2003; Vilariça et al. 2010; Schaberg et al. 1996; Chhetri et al. 2008; Soussi Tanani et al. 2014; Farazi et al. 2014].
Our results showed no statistically significant difference in the C2 RMP levels between the two groups of patients. Furthermore, none of the patients with or without ADRs had observed a C2 RMP level above the expected range of 8–24 mg/l. These findings show that there is no association of the reported ADRs and high concentrations of RMP. However, the idiosyncratic mechanisms of most ADRs induced by RMP do not exclude its involvement in the observed ADRs [Peloquin, 2002].
Nevertheless, we observed that the majority of C2 RMP levels were below the therapeutic range (55% in patients with ADRs and 74% in patients without ADRs) which is in accordance with several studies [McIlleron et al. 2006; Fahimi et al. 2013; Van Tongeren et al. 2012]. The pharmacokinetics of RMP is variable and low RMP concentrations may be associated with several factors. RMP induces its own metabolism and drug concentrations stabilize around the first few weeks of therapy [Chirehwa et al. 2016]. The auto-inducing effect may result in low RMP concentrations and this can explain in part the results obtained in our patients. Otherwise, RMP has variable absorption [Burman et al. 2001], and malabsorption or delayed absorption must be considered to explain the low concentration of RMP. Malabsorption or delayed absorption can be assessed by performing 2 and 6 h post-dose measurements of RMP [Peloquin, 2002]. The comparison of two concentrations can provide more information about the limited absorption. As we did not perform a 6 h post-dose concentration assessment for our patients, we cannot conclude that malabsorption or delayed absorption can be a predictive factor for low C2 RMP level.
With regard to INH, C3 INH levels were significantly higher in patients experiencing ADRs than those who did not. Nevertheless, the C3 INH levels above the expected range were common in patients both with and without ADRs. These findings may suggest that the ADRs reported could be associated either with high C3 INH levels or with idiosyncratic reactions, especially as the outcome of the patients after dose adjustment has not been recorded to assess the C3 INH–ADR relationship.
C3 INH levels were higher than the expected range of 1–2 mg/l in most patients. This is in accordance with the study of Bakayoko and colleagues which demonstrates high C3 INH levels in 41.9% of fast acetylators and 94.1% of slow acetylators [Bakayoko et al. 2015]. Several factors have been reported to influence the high INH concentration. In our study, the median doses of INH were significantly higher in patients with ADRs. However, there was no correlation between C3 INH levels and the doses reported to body weight in both groups of patients. This may indicate that the high concentration seems to be not predictable on the basis of the dose. Hence, the adjustment of the INH dose should be estimated individually. This result is in agreement with the literature, in which a large variability of INH plasma concentrations has been associated with patient’s acetylator status [Evans, 1989].
Previously published data showed high prevalence of the slow acetylator phenotype (62%) [Aït Moussa et al. 2002a], and of the genotypes encoding slow acetylation in Moroccan TB patients [Guaoua et al. 2014]. Slow acetylators may be more prone to accumulate the drug and this would be a predictor of high C3 INH levels. By determining acetylator status, most patients with high C3 INH levels could be expected to be slow acetylators.
High C3 INH levels were not significantly associated with sex, age over 60 years, liver or renal injury, which is in contrast with several studies. The study of McIlleron and colleagues showed that female gender and old age were associated with higher levels of INH [McIlleron et al. 2006]. Holdiness and colleagues reported that patients with liver disease had higher serum concentrations and a significantly longer serum elimination half-life than normal subjects [Holdiness, 1984]. They also reported that patients with renal disease were found to have a significantly longer serum elimination half-life [Holdiness, 1984].
There were several limitations to the present study. Our study design did not allow examination of the relationship between C3 INH levels and clinical outcome of the patient after dose adjustment to confirm the association of the ADRs observed and high C3 INH levels. For all patients, acetylator status was not determined to correlate with high C3 INH levels. RMP and INH were administered with concurrent anti-TB drugs. However, the concentrations of co-administered drugs PZA, EMB and SM were not measured to correlate with the ADRs observed.
Another limitation to this study is that retrospective evaluation of the ADRs for the causality assessment showed that the majority of ADRs were possible, because of missing or incomplete information.
Conclusion
In summary, our study showed that high C3 INH levels were common in patients with and without ADRs whereas C2 RMP levels were low or within normal in most patients. As C3 INH levels were significantly higher in patients with ADRs, their association to the ADRs reported is not excluded. Further studies are required to examine the relationship between high C3 INH levels and the occurrence of ADRs, and to determine the benefit of monitoring the INH concentrations in the optimization of TB treatment.
Although there was no association between C2 RMP levels and the ADRs reported, monitoring the RMP concentrations is still a useful tool to examine the limited absorption and to adjust the RMP dosage. Hence, further studies are necessary to identify the causes of low C2 RMP levels.
Footnotes
Acknowledgements
The authors thank the technical staff of the laboratory of Toxicology and Pharmacology of Moroccan Poison Control and Pharmacovigilance Center for their Cooperation.
Funding
The author(s) received no financial support for the research, authorship, and/or publication of this article.
Conflict of interest statement
The author(s) declared no potential conflicts of interest with respect to the research, authorship, and/or publication of this article.