
Abstract
Background:
Genome-wide polygenic risk scores (PRS) have shown high specificity and sensitivity in predicting type 2 diabetes (T2D) risk in Europeans. However, the PRS-driven information and its clinical significance in non-Europeans are underrepresented. We examined the predictive efficacy and transferability of PRS models using variant information derived from genome-wide studies of Asian Indians (AIs) (PRSAI) and Europeans (PRSEU) using 13,974 AI individuals.
Methods:
Weighted PRS models were constructed and analyzed on 4602 individuals from the Asian Indian Diabetes Heart Study/Sikh Diabetes Study (AIDHS/SDS) as discovery/training and test/validation datasets. The results were further replicated in 9372 South Asian individuals from UK Biobank (UKBB). We also assessed the performance of each PRS model by combining data of the clinical risk score (CRS).
Results:
Both genetic models (PRSAI and PRSEU) successfully predicted the T2D risk. However, the PRSAI revealed 13.2% odds ratio (OR) 1.80 [95% confidence interval (CI) 1.63–1.97; p = 1.6 × 10−152] and 12.2% OR 1.38 (95% CI 1.30–1.46; p = 7.1 × 10−237) superior performance in AIDHS/SDS and UKBB validation sets, respectively. Comparing individuals of extreme PRS (ninth decile) with the average PRS (fifth decile), PRSAI showed about two-fold OR 20.73 (95% CI 10.27–41.83; p = 2.7 × 10⁻¹⁷) and 1.4-fold OR 3.19 (95% CI 2.51–4.06; p = 4.8 × 10⁻²¹) higher predictability to identify subgroups with higher genetic risk than the PRSEU. Combining PRS and CRS improved the area under the curve from 0.74 to 0.79 in PRSAI and 0.72 to 0.75 in PRSEU.
Conclusion:
Our data suggest the need for extending genetic and clinical studies in varied ethnic groups to exploit the full clinical potential of PRS as a risk prediction tool in diverse study populations.
Introduction
Type 2 diabetes (T2D) is a complex chronic disease that challenges public health globally due to its continued increased prevalence. The International Diabetes Federation estimated that the global prevalence of 463 million people with diabetes in 2019 will increase to 700 million by 2045; ~90% of the total will comprise T2D cases. 1 The region of South Asia (consisting of people from India, Pakistan, Bangladesh, Nepal, Bhutan, and Sri Lanka) is the epicenter of the growing epidemic of T2D due to rapid urbanization, immense population growth, and aging.2,3 Studies performed on immigrant Indians outside India have shown that T2D and coronary artery disease incidence is three to six times higher in immigrant Asian Indians (AIs) than Euro-Caucasians. The onset of T2D is roughly a decade earlier [even at a lower body mass index (BMI)] in AIs than in Europeans.4–7 While environmental factors play an essential role in T2D susceptibility, T2D has a strong genetic component, as has been established by many studies of different designs. 8 The heritability estimates of T2D range from 40% to 70%, out of which at least 10–20% is explained by common variants identified in extensive genome-wide association studies (GWAS).9–11 However, the genetics of T2D is poorly characterized in people of AI descent. Thus far, only a handful of T2D GWAS has been published on South AIs, who comprise more than a quarter of the world population.12–14 Most of the genetic studies on South Asians have been performed on immigrants, such as Indians living in the UK or on Pakistani populations. These studies do not putatively reflect the underlying genetic architecture of phenotypic traits and their interactions with other clinical and lifestyle factors of native AIs.
There has been a growing interest in using a cumulative genetic score of T2D-associated variants combined into a polygenic risk score (PRS) to identify individuals with a high genetic risk for the clinical prediction of future occurrence, early prognosis, intervention, and prevention of T2D.15,16 The PRS is known to predict the risk for cancer, 17 T2D,18–20 cardiovascular diseases,21,22 and traits like height 23 and obesity.24–26 A recent study demonstrated that European-derived PRS effectively predicted T2D incidence in an indigenous population from the Southwestern USA. Their adult cohort had an area under the curve (AUC) of 0.728, and the hazard ratio (HR) was 1.27 per SD. 27 A similar study was performed on FinnGen biobank data to determine the role of PRS in predicting susceptibility to five common diseases including T2D. 28 However, these studies have predominantly focused on populations of European origin, with little information on the transferability of genetic risk loci identified in Europeans onto populations of AI ancestries.29,30 Both genetic and environmental factors contribute to causing T2D. The predictive value of multiple nongenetic factors in relation to PRS has not been thoroughly examined. Recent studies by He et al. have suggested a polyexposure score (PXS) that combines multiple correlated nongenetic exposures and lifestyle factors and compared against PRS to elucidate which score had better efficacy in predicting T2D. Their results highlighted the addition of PGS and PXS to clinical risk score (CRS) improved T2D classification accuracy.31,32 In this study, we constructed an ancestry-specific PRS (PRSAI) for T2D using candidate variants derived from our Asian Indian Diabetic Heart Study/Sikh Diabetes Study (AIDHS/SDS).13,33–36 We also built a PRS (PRSEU) using summary statistics from GWAS meta-analyses from seven European cohorts. 37 We compared the predictive efficacy and transferability between PRS derived from AIDHS/SDS and Europeans using validation datasets-1 and 2, including data from South Asians from the UK Biobank (UKBB). We also evaluated the performance of genetic scores by integrating CRS in the risk assessment models.
Materials and methods
Study subjects
All study participants of AIDHS/SDS were from the Northern part of India and were recruited from 2003 to 2009.13,36,38,39 Study protocol and consent documents were reviewed and approved by the University of Oklahoma Health Sciences Center’s Institutional Review Board (IRB #: 2911). Clinical characteristics and demographic details of the studied subjects are presented in Table 1. The Sikh population is a relatively homogenous endogamous community from India. Sikhs are mostly non-smokers with the current study population having only 1.4% of smokers, and ~50% of them are vegetarian. However, they have a high prevalence of T2D and cardiovascular diseases with familial aggregation. 40 The diagnosis of T2D was confirmed by scrutinizing medical records for symptoms, use of medications, and measuring fasting glucose levels following the guidelines of the American Diabetes Association 41 as described previously. 39 The selection of controls was based on a fasting glucose <100.8 mg/dl or a 2-h glucose <141 mg/dl as described previously. 13 Details of other demographic characteristics, including anthropometric measurements, physical activity, smoking, alcohol consumption, and diet, are described elsewhere.38,42 Briefly, BMI was calculated as weight (kg)/height (meter)2, and waist-to-hip ratio (WHR) was calculated as the ratio of waist circumference to hip circumference. Blood pressure (BP) was measured twice after a 5-min seated rest period with the participant’s feet flat on the floor. All blood samples were obtained at the baseline visit. 38 Subjects with type 1 diabetes, or those with a family member with type 1 diabetes, or rare forms of T2D subtypes (maturity-onset diabetes of the young 43 ) or secondary diabetes (from, e.g. hemochromatosis or pancreatitis) were excluded from the study based on clinical reports, as previously described. 13
Clinical characteristics of the AIDHS/SDS and UKBB South Asians.

Values are in mean ± SD.
Random glucose levels in the UK Biobank population.
AIDHS/SDS, Asian Indian Diabetic Heart Study/Sikh Diabetes Study; BMI, body mass index; FBG, fasting blood glucose; UKBB, UK Biobank.
Genotyping, imputation, and quality controls
Genomic DNA was extracted from buffy coats using QIAamp blood kits (Qiagen, Chatsworth, CA, USA) or by the salting-out procedure. 44 Samples were genotyped using the Illumina 660W Quad BeadChip (Illumina Inc., San Diego, CA, USA), Illumina Global Screening Arrays (GSA), and GSA with multi-disease content (GSA+) arrays as described previously.13,35,43 Also, samples with genotyping call rate <95%, cryptic relatedness, and population outliers were removed, and single nucleotide polymorphisms (SNPs) with genotyping call rate <90%, departures from Hardy–Weinberg equilibrium (HWE) (p < 10−7) or minor allele frequency (MAF) <5% were excluded before association testing. To increase genome coverage, data was imputed using Minimac4 45 with 1000G Phase3 v5 multiethnic reference panel in NCBI Build 37 (hg19) and coordinates as described.35,36 Quality control for the imputed SNPs included removing variants with an imputation certainty ‘info score’ R2 < 0.8, and SNPs significantly deviated from HWE (p < 1 × 10⁻⁶) before further analysis.
UKBB study participants (validation dataset-2)
To validate the results of PRSAI, we used data from UKBB for South Asian ancestry (n = 9372), including Indians, Pakistani, Bangladeshi, and any other Asian background from the UKBB following the approval of the current research project (application # 78635). 46 T2D was characterized based on doctor-diagnosed disease phenotype and glycated hemoglobin levels (HbA1c). For genetic analysis, we used imputed data released by the UKBB specific for South Asian subjects. We excluded outliers for heterozygosity or genotype missing rates (0.2 > missing rate) as well as ambiguous SNPs (MAF > 0.44). Participants with inconsistent reports and genotypic inferred sex inconsistencies or withdrawn consent were removed, as explained previously. 46
Statistical analysis
The genome-wide PRS analysis was performed by using discovery and validation datasets. The discovery/training set included 1616 individuals (843 cases/773 controls) genotyped using Illumina 660 Quad chip arrays. The validation dataset-1 was comprised of 2986 (1731 cases/1255 controls) individuals who were genotyped using Illumina’s GSA+ and GSA arrays. Both discovery and validation dataset-1 comprised individuals from AIDHS/SDS. 13 The additional validation dataset-2 included 9372 South Asians (1943 T2D cases and 7429 controls) from UKBB. To adjust for residual population stratification, age, sex, BMI, and five principal components (PCs) were included as covariates. As the existing HapMap2 or HapMap3 and 1000 Genomes data do not include Sikhs, the PCs used for this correction were estimated using our Sikh population sample and not the HapMap populations. 13 The PC information for the UKBB dataset was obtained from the data provided by the UKBB. Associations of directly genotyped and imputed SNPs with T2D were tested using logistic regression and an additive genetic model.
The selection criteria of SNPs from 46,985,978 (common and rare) for constructing Sikh-specific PRSAI were based on: (1) SNPs from South Asian T2D GWASs12,13,47,48; (2) SNPs with independent association signals with p < 10−2; (3) including SNPs with MAF > 0.01 and MAF
To construct European PRS (PRSEU), we used the summary statistics data from O’Connor et al.,
51
which comprised datasets from seven European cohorts (n = 312,646) containing 33,122,978 variants, and available for both additive and recessive models. We used the additive model for our analysis. The selection criteria of SNPs for constructing European PRSEU were based on: (1) SNPs with independent association signals with p < 10−2; (2) including SNPs with MAF > 0.01 and MAF
The CRS was calculated following the modified version of the Joint British Society (JBS) risk score in both AIDHS/SDS and UKBB. 52 The modified JBS risk factors include age (<30 = 0, ⩾30–50 = 1, ⩾51–70 = 2, >70 = 3); gender (female = 1, male = 2); BMI (⩽23 = 0, 23–27.5 = 1, >27.5 = 2); smoking habits (yes = 1, no = 0); hypertension {hypertensive = 1 [systolic BP (SYSBP) ⩾ 110 mmHg and diastolic BP (DBP) ⩾ 90 mmHg], non-hypertensive = 0}; an independent assessment of SYSBP (<89 mmHg = 0, 90–130 mmHg = 1, >130 mmHg = 2); family history of diabetes (yes = 1, no = 0); and any other metabolic disorders such as arthritis or kidney disease (yes = 1, no = 0). Note that we use a lower BMI cut-off for defining obesity in AIs based on the ethnicity-specific guidelines proposed by the World Health Organization (WHO). 53
The prediction efficiency of PRS models was assessed by generating the receiver operative characteristic curve (ROC), which is a plot of the true positive rate (sensitivity) against the false positive rate (1-specificity). It calculates the corresponding AUC, which ranges from 0.5 as a total lack of discrimination to a maximum of 1.0 (perfect discrimination). 54 All analyses were performed using PLINK 2.0, 55 SVS version 8.9.1 (Golden Helix, Bozeman, MT, USA), and SPSS software version 27 (IBM, Ney York City, USA).
Results
The clinical characteristics of the study participants are presented in Table 1. As expected, individuals with T2D had significantly higher BMI, waist circumference, WHR, and fasting blood glucose than controls in both the discovery and the validation datasets (Table 1).
In comparison to the European-derived PRS, the ancestry-derived PRSAI revealed a stronger association of T2D reflected by the higher ORs in validation dataset-1 OR 1.80 (95% CI 1.63–1.97; p = 1.6 × 10−152) compared to the PRSEU 1.59 (95% CI 1.42–1.77; p = 2.4 × 10⁻²⁷). A similar trend was observed in validation dataset-2, showing slightly higher ORs of PRSAI 1.38 (95% CI 1.30–1.46; p = 7.1 × 10−237) compared to the PRSEU 1.23 (95% CI 1.15–1.31; p = 7.5 × 10−36). Interestingly, the risk for T2D associated with CRS alone showed the ORs of 1.77 (95% CI 1.64–1.90; p = 1.9 × 10−254) in validation dataset-1 and 1.55 (95% CI 1.47–1.63; p = 7.2 × 10−320) in validation dataset-2. Combining validation datasets 1 and 2, the CRS was the strongest predictor of T2D risk 1.56 (95% CI 1.48–1.64; p = 6.7 × 10⁻²⁹), followed by PRSAI 1.44 (95% CI 1.37–1.52; p = 3.2 × 10⁻²³). The lowest predictive outcome was observed in the PRSEU 1.28 (1.21–1.35; p = 1.4 × 10⁻¹¹; Table 2, Figure 1).
Association of PRS with type 2 diabetes.

Model adjusted for age, gender, BMI.
Meta-analysis ORs and p-values are marked in bold.
AIDHS/SDS, Asian Indian Diabetic Heart Study/Sikh Diabetes Study; BMI, body mass index; CI, confidence interval; CRS, clinical risk score; OR, odds ratio; PRSAI, Asian Indian ancestry-derived PRS; PRSEU, European-derived PRS; UKBB, UK Biobank.

Forest plot showing effect sizes and confidence interval for type 2 diabetes risk using Asian Indian (PRSAI), European (PRSEU), and combined with CRS trained on Discovery set and tested on validation dataset-1 (AIDHS/SDS) and validation dataset-2 (South Asians from UKBB).
We further assessed the joint effect of PRS models integrating with the CRS. There was a significant improvement in the performance of PRS models showing an increase in ORs of 1.80 (95% CI 1.63–1.97; p = 1.6 × 10−152) to 1.90 (95% CI 1.84–1.95; p = 7.0 × 10−285) in PRSAI and 1.59 (95% CI 1.42–1.77; p = 2.4 × 10⁻²⁷) to 1.89 (95% CI 1.82–1.96; p = 2.4 × 10−280) in PRSEU in validation dataset-1. A similar strong trend was observed in the increase in ORs from 1.38 (95% CI 1.30–1.46; p = 7.1 × 10−237) to 1.47 (95% CI 1.45–1.50; p = 4.8 × 10−315) in PRSAI and 1.23 (95% CI 1.15–1.31; p = 7.5 × 10−36) to 1.45 (95% CI 1.43–1.48; p = 3.0 × 10−303) in PRSEU for the joint effects of PRS + CRS models (Table 3, Figure 1).
Association of combined PRS and CRS with type 2 diabetes.

Model adjusted for age, gender, BMI.
AIDHS/SDS, Asian Indian Diabetic Heart Study/Sikh Diabetes Study; BMI, body mass index; CI, confidence interval; CRS, clinical risk score; OR, odds ratio; PRS, polygenic risk scores; PRSAI, Asian Indian ancestry-derived PRS; PRSEU, European-derived PRS; UKBB, UK Biobank.
Next, we compared individuals from the extreme PRS with the average PRS, and divided the PRS scores in deciles. Comparing participants at the ninth decile versus the middle fifth decile revealed an OR of 20.73 (95% CI 10.27–41.83; p = 2.7 × 10⁻¹⁷) for the PRSAI and 11.29 (95% CI 6.00–21.24; p = 6.0 × 10⁻¹⁴) for the PRSEU. Similar results were observed for the UKBB, which showed a higher OR of 3.19 (95% CI 2.51–4.06; p = 4.8 × 10⁻²¹) for the PRSAI while the OR was 2.31 (95% CI 2.07–2.56; p = 1.2 × 10⁻¹⁹) for PRSEU (Table 4). Comparing participants at the first decile versus the middle fifth decile revealed an OR of 162.76 (95% CI 62.51–423.79; p = 1.8 × 10⁻³⁵) for the PRSAI and 17.38 (95% CI 10.75–28.09; p = 2.4 × 10⁻³¹) for the PRSEU. Similar results were observed for the UKBB, which showed a higher OR of 4.08 (95% CI 2.82–5.92; p = 1.2 × 10⁻¹³) for the PRSAI while the OR was 2.78 (95% CI 2.08–3.72; p = 6.7 × 10⁻¹²) for PRSEU (Table 5). Next, by analyzing the individuals in the lower three deciles versus the upper three deciles, we identified 446 and 195 genes and several SNPs in the unnamed gene regions uniquely present in PRSAI and PRSEU, respectively, and their MAF differed significantly between the decile extremes (Supplemental Table 5).
Effect sizes and CIs for type 2 diabetes risk comparing PRS (fifth versus ninth) deciles in validation datasets 1 and 2.

The individuals with extreme PRS in the ninth decile were compared with those in the fifth (middle) decile to determine the risk for PRSAI and PRSEU.
AIDHS/SDS, Asian Indian Diabetic Heart Study/Sikh Diabetes Study; CI, confidence interval; PRSAI, Asian Indian ancestry-derived PRS; PRSEU, European-derived PRS; UKBB, UK Biobank.
Effect sizes and CIs for type 2 diabetes risk comparing PRS (first versus fifth) deciles in validation datasets 1 and 2.

The individuals with extreme PRS in the first decile were compared with those in the fifth (middle) decile to determine the risk for PRSAI and PRSEU.
AIDHS/SDS, Asian Indian Diabetic Heart Study/Sikh Diabetes Study; CI, confidence interval; OR, odds ratio; PRS, polygenic risk scores; PRSAI, Asian Indian ancestry-derived PRS; PRSEU, European-derived PRS; UKBB, UK Biobank.
Lastly, we performed a sensitivity analysis to test the discriminative accuracy of the PRS models using ROC curve analysis. For the validation dataset-1, the AUC was 0.74 (95% CI 0.69–0.80; p = 2.1 × 10⁻¹¹) for the PRSAI compared to an AUC of 0.72 (95% CI 0.67–0.78; p = 9.2 × 10⁻¹⁰) for the PRSEU. For the validation dataset-2, the AUC was 0.71 (95% CI 0.69–0.73; p = 2.6 × 10−70) for the PRSAI compared to an AUC of 0.69 (95% CI 0.68–0.72; p = 1.7 × 10−62) for the PRSEU (Figure 2). Combining PRS and CRS improved the AUC from 0.74 (95% CI 0.69–0.80; p = 2.1 × 10⁻¹¹) to 0.79 (95% CI 0.75–0.83; p = 5.4 × 10⁻¹⁵) in PRSAI, and 0.72 (95% CI 0.67–0.78; p = 9.2 × 10⁻¹⁰) to 0.75 (95% CI 0.70–0.80; p = 1.3 × 10⁻¹¹) in PRSEU in validation dataset-1. In validation dataset-2 combining PRS and CRS improved the AUC from 0.71 (95% CI 0.69–0.73; p = 2.6 × 10−70) to 0.73 (95% CI 0.71–0.75; p = 6.5 × 10−85) in PRSAI and 0.69 (95% CI 0.68–0.72; p = 1.7 × 10−62) to 0.71 (95% CI 0.69–0.74; p = 2.3 × 10−74) in PRSEU. The AUC was 0.83 (95% CI 0.82–0.85; p = 6.4 × 10−206) and 0.80 (95% CI 0.79–0.81; p = 2.8 × 10−235) for CRS in validation dataset-1 and -2, respectively (Figure 2).
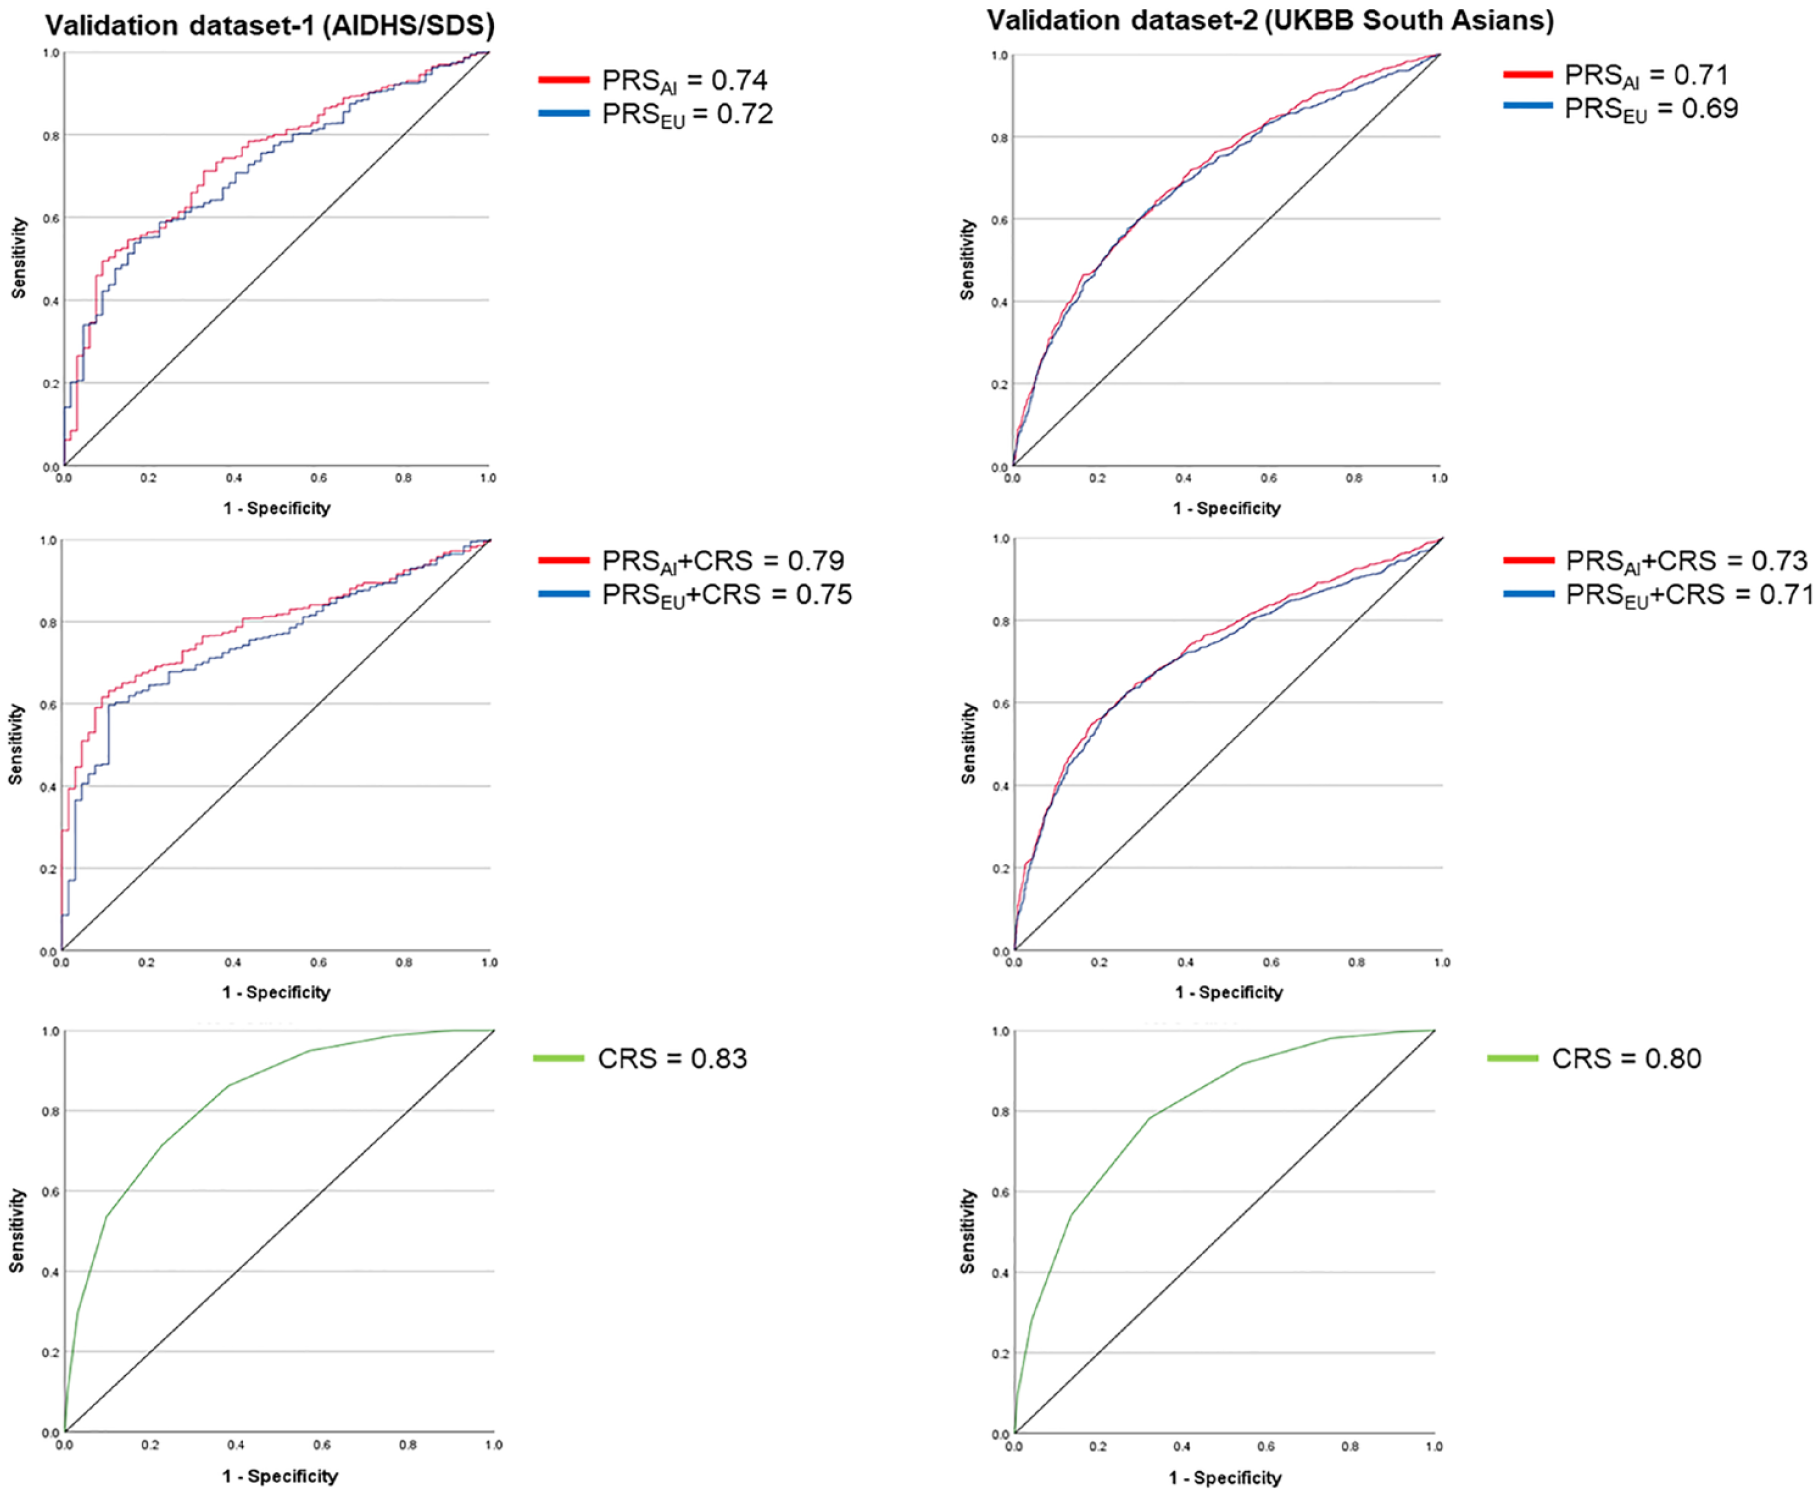
ROC curve showing AUC for type 2 diabetes in PRSAI and PRSEU with and without CRS.
Discussion
Recent genome-wide studies of complex traits have an overwhelming abundance of European-focused information. The underrepresentation of data on other ethnic groups challenges the generalizability of genetic findings across population groups. Even the PRS derived from well-powered European GWAS have shown poor-risk prediction in non-Europeans, suggesting the need for expanding the genetic evaluations globally to improve the clinical utility of PRS. 56 In this study, we compared the predictive efficacy and transferability of the PRS models derived from South Asian GWAS meta-analysis studies and using GWAS results of European T2D consortia studies.
Both ancestry-specific and European derived PRS predicted T2D risk in AIDHS/SDS and South AIs from UKBB. However, the PRSAI was a better predictor of T2D risk than the European-derived PRS (Table 2 and Figure 1). The overall performance of our PRSAI model was 13.2% and 12.2% superior in validation dataset-1 and 2, respectively. Interestingly, our CRS model showed a strong and independent association with T2D, revealing ORs of 1.77 (95% CI 1.64–1.90) and 1.55 (95% CI 1.47–1.63) in both validation dataset-1 (AIDHS/SDS) and dataset-2 (UKBB). The integration of CRS in the PRS improved the performance of both genetic models. The predictive power of PRSAI after including CRS was improved 5.6% in validation dataset-1 and 6.5% in validation dataset-2. At the same time, the performance of the PRSEU was increased by 18.9% and 17.9% in validation dataset-1 and -2, respectively. Notably, both AI and European models performed equally well, showing the similar ORs of 1.90 (95% CI 1.84–1.95) in PRSAI and 1.89 (95% CI 1.82–1.96) in PRSEU for the validation dataset-1 and ORs of 1.47 (95% CI 1.45–1.50) in PRSAI and 1.45 (95% CI 1.43–1.48) in PRSEU for the validation dataset-2 after integrating CRS in the models. In the combined meta-analysis of validation sets 1 and 2, the PRSAI was 3.3% more efficient than the PRSEU, showing respective ORs of 1.55 versus 1.50 (Figure 1). Similarly, combining PRS and CRS improved the AUC from 0.74 to 0.79 in PRSAI and 0.72 to 0.75 in PRSEU in validation dataset-1 and 0.71 to 0.73 in PRSAI and 0.69 to 0.71 in PRSEU in validation dataset-2. Combining clinical risk factors in the PRS has been shown to enhance the prediction of incident T2D in British South Asians. 57 It is also possible that using the lower BMI cut-offs (based on the WHO guidelines) might have improved the sensitivity of our CRS model, and consequently, its integration into genetic risk assessment enhanced the performance of both PRS models.
Upon comparing individuals in the top PRS distribution, the individuals with the ninth decile had more than 20-fold higher T2D risk predictability than those in the middle (fifth decile). At the same time, the difference was 11-fold higher in PRSEU in the validation dataset-1, showing nearly two times higher predictability to identify individuals who would be genetically predisposed to having a higher risk for T2D over the European-derived PRS. Similarly, in the UKBB, the PRSAI showed a 1.4 times higher likelihood of detecting high-risk individuals in the ninth decile over the PRSEU. Comparing extreme scores between the first decile versus fifth deciles, our models captured high-risk individuals with 7.85-fold in the validation dataset-1 and 1.28-fold in UKBB compared to fifth versus ninth decile, using PRSAI model. While these differences were 1.54- and 1.22-fold higher using validation dataset 1 and UKBB, respectively, using the PRSEU model (Tables 4 and 5). These results further suggest the sensitivity and effectiveness of the PRS models even at the lower extremes. These analyses further helped us identify 446 genes uniquely found in PRSAI, which could be involved in the T2D development in South Asians (Supplemental Table 5).
Our study has several advantages and limitations. First, our robust genetic analyses include high-quality data from a single sub-population originating from North India with well-characterized clinical phenotypes is a significant strength.13,49 Second, the PRSAI provided a better prediction over the PRSEU derived from European GWAS. This was further confirmed by comparing the individuals with the extremes of genetic scores versus the median scores. Our PRSAI model will have 2 times and 1.4 times higher likelihood of capturing high-risk individuals in validation cohorts 1 and 2, respectively, than the European-derived model. However, both models performed equally well after integrating CRS in the genetic scores. Third, this is the first study using the PRS approach in a Punjabi population from North India. Limitations include a relatively smaller size of the discovery/training dataset of AIDHS/SDS. The size of validation set-1 is nearly two times, and validation set-2 is six times the size of the discovery set.
The discovery set comprises a homogeneous Punjabi Sikh population, the majority being the Khatri ethnic group recruited in only a small geographical region of Punjab. The validation set-1 (n = 2986) was relatively heterogeneous and contained mixed Punjabi communities from north India. The second validation set (n = 9372) comprised highly heterogeneous samples of South Asian communities, including Indian, Pakistani, Bangladeshi, and any other Asian background. The number of T2D cases in the discovery and validation dataset-1 were 52% and 58%, respectively, whereas validation set-2 had only 21% T2D cases. These differences must have resulted in a wide gap in the PRS range in the discovery versus the validation datasets. Because of these differences, the ORs were wider when we analyzed the T2D risk by extreme deciles (Tables 4 and 5). Despite these differences, our PRS models captured individuals at increased risk for T2D in both ancestry-specific and European-derived PRS and suggest the strength of our models. Additionally, the ancestry-derived PRS has relatively higher transportability than the European-derived PRS even in the heterogenous population from UKBB.
Conclusion
The PRSAI has provided a relatively better T2D risk prediction outcome and higher transportability than the PRSEU. However, both models performed equally well after integrating ethnicity-defined CRS in the genetic scores. The clinical application of genetic and clinical risk prediction models is still underdeveloped because there is a lack of diversity in the clinical trials and genome-wide studies that remain predominantly an over-representation of European-ancestry study populations. Our results support the implications of diversity in genomic studies to improve the knowledge and utility of clinical and genomics tools for identifying and treating individuals at higher risk for developing T2D.
Supplemental Material
sj-pdf-1-tae-10.1177_20420188231220120 – Supplemental material for Assessing the prediction of type 2 diabetes risk using polygenic and clinical risk scores in South Asian study populations
Supplemental material, sj-pdf-1-tae-10.1177_20420188231220120 for Assessing the prediction of type 2 diabetes risk using polygenic and clinical risk scores in South Asian study populations by Madhusmita Rout, Gurpreet S. Wander, Sarju Ralhan, Jai Rup Singh, Christopher E. Aston, Piers R. Blackett, Steven Chernausek and Dharambir K. Sanghera in Therapeutic Advances in Endocrinology and Metabolism
Footnotes
Acknowledgements
The authors thank all the participants of AIDHS/SDS and are grateful for their contribution to this study. Technical support and genotype data generation by Adam Adler from the Oklahoma Medical Research Foundation are duly acknowledged.
Correction (October 2024):
Since the original online publication, the section “Statistical analysis” has been updated.
Declarations
Supplemental material
Supplemental material for this article is available online.
References
Supplementary Material
Please find the following supplemental material available below.
For Open Access articles published under a Creative Commons License, all supplemental material carries the same license as the article it is associated with.
For non-Open Access articles published, all supplemental material carries a non-exclusive license, and permission requests for re-use of supplemental material or any part of supplemental material shall be sent directly to the copyright owner as specified in the copyright notice associated with the article.