
Abstract
Background:
Cardiac autonomic neuropathy (CAN) is a diabetes-related complication with increasing prevalence and remains challenging to detect in clinical settings. Machine learning (ML) approaches have the potential to predict CAN using clinical data. In this study, we aimed to develop and evaluate the performance of an ML model to predict early CAN occurrence in patients with diabetes.
Methods:
We used the diabetes complications screening research initiative data set containing 200 CAN-related tests on more than 2000 participants with type 2 diabetes in Australia. Data were collected on peripheral nerve functions, Ewing’s tests, blood biochemistry, demographics, and medical history. The ML model was validated using 10-fold cross-validation, of which 90% were used in training the model and the remaining 10% was used in evaluating the performance of the model. Predictive accuracy was assessed by area under the receiver operating curve, and sensitivity, specificity, positive predictive value, and negative predictive value.
Results:
Of the 237 patients included, 105 were diagnosed with an early stage of CAN while the remaining 132 were healthy. The ML model showed outstanding performance for CAN prediction with receiver operating characteristic curve of 0.962 [95% confidence interval (CI) = 0.939–0.984], 87.34% accuracy, and 87.12% sensitivity. There was a significant and positive association between the ML model and CAN occurrence (p < 0.001).
Conclusion:
Our ML model has the potential to detect CAN at an early stage using Ewing’s tests. This model might be useful for healthcare providers for predicting the occurrence of CAN in patients with diabetes, monitoring the progression, and providing timely intervention.
Keywords
Introduction
Diabetes is one of the significant burden of diseases globally with growing prevalence and leads to increased morbidity and mortality.1,2 The International Diabetes Federation estimated that by 2040, one in every 10 people in the world would have diabetes. 3 Patients with diabetes often present with several co-morbidities, including cardiovascular diseases,4,5 stroke, kidney diseases, depression,6,7 which affect their quality of life 8 and lead to increased morbidity. Cardiac autonomic neuropathy (CAN) is one of the most severe complications of diabetes resulting from a complex interaction of blood glucose control, duration of disease, age, and blood pressure (BP).9–11 CAN affect nerve fibers in the blood vessels and the heart muscle in diabetic patients, thereby causing cardiac arrhythmias, exercise intolerance, myocardial injury, silent myocardial ischemia, stroke, and sudden cardiac deaths12,13 and substantially impact the quality of life of patients.10,14 Furthermore, CAN independently predict the progression of diabetic nephropathy and chronic kidney disease in diabetes. 15 Longitudinal studies in patients with CAN have shown 5-year mortality rates of 16–50%, with a high proportion attributed to sudden cardiac death. 16
Globally, there is an increase in the occurrence of CAN, particularly in patients with type 2 diabetes.17,18 Previous studies estimated that 20–73% of type 2 diabetes patients and about 17% of type 1 diabetes patients develop CAN.19,20 Subclinical CAN, manifested as changes in heart rate variability (HRV), may be detected within 1–2 years of diagnosis of diabetes. 16 The clinical symptoms of CAN, however, often do not appear until long after diabetes onset, thus remaining undiagnosed until the disease progresses to an advanced stage. 21 The early detection and appropriate management of CAN are essential to prevent future complications and has been widely recommended.15,22
Despite the importance of early detection, currently, there is no specific method for predicting CAN and its progression. 19 CAN diagnosis is commonly performed in the clinics using Ewing’s test that includes the assessment of HRV, orthostatic hypotension, and 24 h of BP profiles and other variables in clinical settings. 23 There is, however, still debate about the diagnostic criteria and staging of CAN using Ewing’s test. 23 A majority of the previous research conducted in this regard has focused on using Ewing’s battery test alongside a wide range of risk factors to diagnose CAN.24–32 Although these methods have performed well, the progression of CAN remains unclear. This has a significant impact on the ability of healthcare providers to increase the awareness of patients and to intervene promptly. In this study, we aimed at addressing this gap by developing and validating a machine learning (ML) model to detect and predict the progression of CAN in diabetic patients.
Methods
Design
We conducted secondary analysis from a retrospective cohort study. We developed and evaluated the performance of an ML model for detecting and prediction of CAN progression using the following steps: develop an ML model for CAN detection and prediction of progress; investigate Ewing’s tests significance in the prediction of normal and early categories of CAN; and evaluate the proposed ML predictive model.
Participants, location, and data collection
We used the Diabetes Complications Screening Research Initiative (DiScRi) data set,26,33,34 which was collected at Charles Sturt University in Australia. 35 The DiScRi data set contains more than 200 variables conducted on more than 2000 participants with type 2 diabetes in rural New South Wales, Australia, between 2011 and 2014. Patients were recruited through a public media campaign, including newspaper advertisements, radio and local television, and advertisements in general practice and community health centers. Potential participants were requested to contact the university if they wished to undergo a health check, and an appointment was made to attend the clinic. All participants older than 40 years were eligible to participate. 33 Participants with existing cardiovascular, respiratory, and renal disease as well as depression, schizophrenia, and Parkinson’s disease were excluded. The data collection procedure involved the following steps: All participants were required to stop smoking or to consume drinks like alcohol and coffee 24 h before being tested. They were required to fast, beginning from midnight prior to the testing day. The tests were conducted from 9:00 a.m. to 12:00 p.m.
Variables and measurements
The data set contains a record of participants’ details, including demographic data such as age and sex, and history of diabetes, heart attack, palpitations, and atrial fibrillation. The data set also contained measurements of BP, body mass index (BMI), blood glucose level (BGL), cholesterol profile, and electrocardiography (ECG), and tests on peripheral nerve function, Ewing’s battery tests, HRV, and attributes of different blood biochemistry.
In the current study, we used Ewing’s tests, which include the five standard tests for CAN proposed by Ewing and Clarke. 36 The five tests are (1) lying to standing heart rate (LSHR) change expressed by 30:15 ratio. Such test indicates the ratio of longest R-R interval (ranging from 20 to 40 beats) to the shortest R-R interval (ranging from 5 to 25 beats) produced by a change in position (from a horizontal position to vertical position); (2) deep breathing heart rate (DBHR) change, which refers to the evaluation of beat-to-beat heart rate variation (R-R variation) based on deep breathing; (3) valsalva maneuver heart rate (VAHR) change measuring the response of heart rate during and after increasing the intra-abdominal and intrathoracic pressure; (4) handgrip blood pressure (HGBP) change measuring the change in diastolic BP after using a handgrip dynamometer; and (5) lying to standing BP (LSBP) change measuring the difference in the baroreflex-mediated BP after a change in the position. The results of Ewing’s test are shown in Supplementary Table S2.
Based on the Ewing’s tests, CAN has been categorized into five main classes: (1) normal (all tests normal or one borderline); (2) early CAN (one of the three heart rate tests abnormal or two borderline); (3) definite CAN (two or more of the heart rate tests abnormal); (4) severe CAN (two or more of the heart rate tests abnormal plus one or both of the BP tests abnormal or both borderline); and (5) atypical CAN (any other combination of tests with abnormal results). 26 Because there were only a few patients with a severe, definitive, and atypical CAN in this study, we excluded them from the analysis and only included 237 patients with normal and early CAN.
Ethics
Written informed consent was obtained from all participants before data collection. The protocol for the DiScRi study was approved by the Ethics in Human Research Committee of the Charles Sturt University (ID # 03/164).
The framework of the ML predictive model
Data analysis: Figure 1 shows the high-level framework along the steps followed to construct the proposed model. We used logistic regression which is one of the most common ML algorithms to develop the model and compatibility with a wide range of tools and platforms like R-language using the following formula 37

where P denotes the probability of an outcome occurrence and z represents the linear combination function which is inclusive of independent variables. An expression z can also be given as follows

where

where P denotes the possibility of the occurrence of an outcome (CAN progress) based on the selected independent variables.

A graphical description of the proposed model.
Subsequently, the Ewing’s tests coefficients were calculated using logistic regression. The results obtained from the application of logistic regression are presented in Table 1. For the logistic regression, the dependent variable is CAN, whereas the independent variables are Ewing’s tests. Table 1 shows a significant association between Ewing’s tests and CAN (p < 0.05), and as such, have been included in the predictive model.
The results of logistic regression analysis.
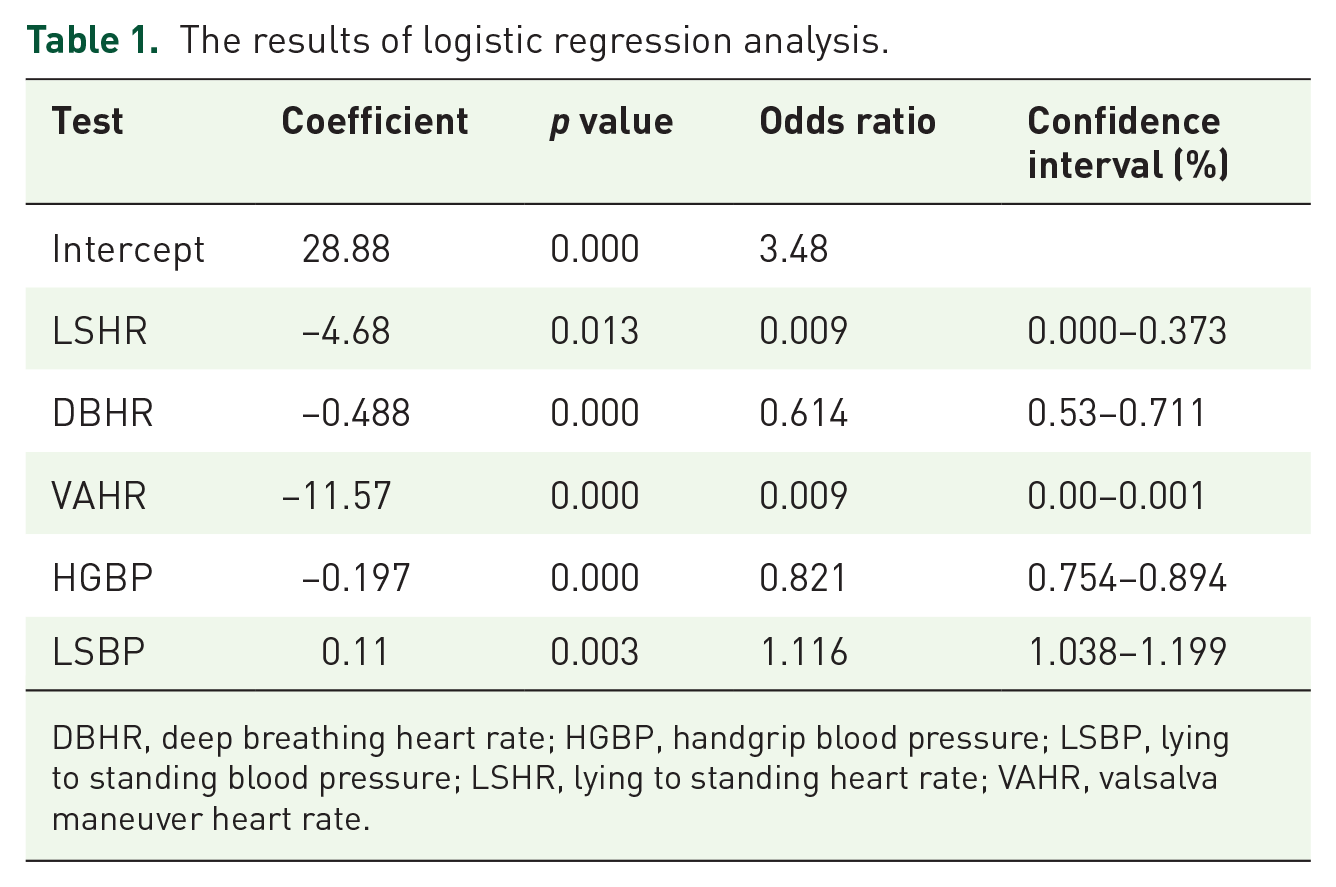
DBHR, deep breathing heart rate; HGBP, handgrip blood pressure; LSBP, lying to standing blood pressure; LSHR, lying to standing heart rate; VAHR, valsalva maneuver heart rate.
As presented in Table 1, the
Negative β coefficient values were obtained as the outcomes of T1 (LSHR), T2 (DBHR), T3 (VAHR), and T4 (HGBP) indicating that they have a negative influence on the occurrence of the disease. In other words, the influence of the tests on the occurrence of the disease is negative. In contrast, positive β coefficient values were produced by the T5 (LSBP), which is indicative of the positive effect of the tests on the occurrence of the disease. This confirms the correctness of the predictive model depending on Ewing’s rules to diagnose the condition. Based on equation (3) and the outcomes in Table 1, the predictive model was built as follows
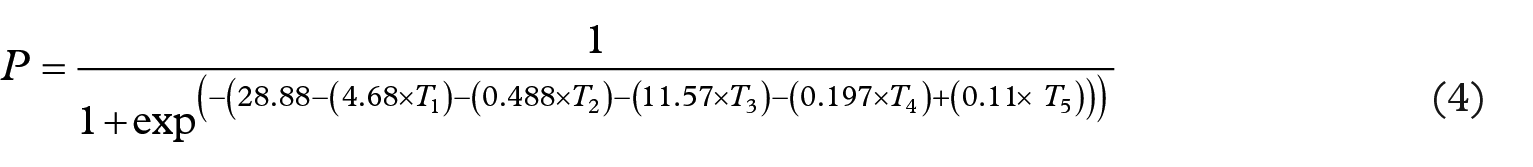
Subsequent to the construction of the predictive model of CAN, if new tests are obtained from the clinic, for example, the predictive model can be used in calculating the probability of the occurrence of CAN. The following cases are classic illustrations of the application of the predictive model in determining the probability of CAN. Assume the Ewing’s tests for patient A are LSHR = 1.06, DBHR = 16, VAHR = 1.1, HGBP = 15, and LSBP = 10; patient B are LSHR = 1.4, DBHR = 10, VAHR = 1.23, HGBP = 15, and LSBP = 8; and patient C are LSHR = 1.1, DBHR = 14, VAHR = 1.1, HGBP = 14, and LSBP = 8. Through the application of equation (4) with the tests of the three patients, the probability that diabetic patient A will develop CAN can be computed as follows

For patient B, the probability of developing CAN’s disease can be calculated as follows

The probability of patient C developing CAN’s disease can be calculated as follows

Evaluation of the predictive model
The evaluation of the efficiency of the proposed predictive model was done using sensitivity, accuracy, specificity, type I error and type II error, and confusion matrix measurements. The model was validated using 10-fold cross-validation to obtain an unbiased evaluation of generalization error. The whole data set was randomly divided into 10 subsets, of which nine (90%) were used in training the model and the remaining 10% was used in testing the performance of the model. The training and testing procedures were carried out 10 times repeatedly. All experiments were performed using SPSS version 20.0 (SPSS, Inc., Chicago, IL, USA) and R programming language on a personal computer with Intel Core i5, CPU 3.4 GB, 16 GB RAM running Windows 10 operating system.
Performance metrics
The performance of the model was evaluated using the area under the curve (AUC), which is referred to as a receiver operating characteristic (ROC) curve using the following assessment measures:
Sensitivity indicates the number of patients with CAN that are correctly predicted

Specificity indicates the number of controls that are correctly predicted

Accuracy exposes the total number of the patients and controls that are correctly predicted

Type I error (α) is the probability that patients will be diagnosed into the control group

Type II error refers to the probability that control group will be diagnosed and categorized into patients’ group

Results
A total of 237 patients with type 2 diabetes participated in this study (55% females, age range = 32–90 years), of which 105 were diagnosed with an early stage of CAN while the remaining 132 participants were found to be healthy and disease-free. Of the 132 healthy participants, the health statuses of 119 participants were correctly predicted as healthy by the predictive model, and of 105 patients, 88 were correctly predicted to be at the early stage of the disease. The confusion matrix (Table 2) shows the predictive model has achieved a predictive accuracy of 87.34%. This performance is achieved because all the included tests are significantly associated with the tested categories of CAN (p < 0.05).
The confusion matrix.

The predictive model was able to achieve a sensitivity value of 87.12%, being the number of people that were correctly identified with the positive disease. Meanwhile, the model was able to achieve specificity of 87.5%. Also, the predictive model achieved values of 12.88% and 12.5% for type I error and type II error, respectively. This is indicative of the ability of the model to efficiently predict the probability of the occurrence of CAN. This model can be exploited with a wide range of health conditions.
The ROC curves of the predictive model are presented in Figure 2, while the AUC of the predictive model is enlisted in Table 3. The predictive model achieved an ROC of 0.962% with a 95% confidence interval of 0.939–0.984. In addition, the model achieved a significant difference from 0.5, given that p value (asymptotic significance) is less than 0.05, indicating that the proposed model achieved a significant prediction better than by chance.

ROC curve of the predictive model.
The area under the curve of the predictive model.

P-value (Asymptotic Significance) is < 0.05.
Discussion
In this article, we presented an ML model to predict the probability of CAN occurrence in patients with diabetes. The results suggest that an ML method can predict the risk of developing CAN in patients with diabetes in the primary care setting. The model provided high accuracy (87.34%), sensitivity (87.12%) and specificity (87.5%) as well as very high stability (0.962%). The cardiovascular autonomic function abnormalities in CAN may develop before diabetes is manifested and remain subclinical. Our results provide evidence of the suitability of the use of the ML model to detect CAN early with minimum resources. The predictive model also provided further evidence that Ewing’s tests can significantly predict the normal and early categories of this condition. Thus, our model can be used by healthcare providers to detect and follow the progression of CAN over time and take appropriate measures.
Our findings support and extend prior studies of CAN detection using Ewing’s tests and ML models. In a previous study by Jelinek et al., 24 the neurological diagnostics of CAN was examined on the basis of five Ewing’s test attributes using decision tree classification like REPtree, J48, SimpleCart, and NBTree. In a study by Kelarev et al., 25 Ewing’s test features were combined with extra features from the clinical data to detect CAN using feature selection based on random forest and multilevel ensemble classifiers. A research conducted by Abawajy et al. 26 focused on enhancing the accuracy of the classification of CAN using blood biochemistry features alongside the results of Ewing’s tests. They achieved the enhancement of the classification accuracy through the use of the automated iterative multitier ensemble (AIME), which makes use of a variety of ensemble classifiers in each layer. The AIME achieved a high level of accuracy (99.57%) and could be used where Ewing’s tests are not available. In the current study, however, we used logistic regression which is more robust to detect CAN and its progression rather than only detecting CAN as performed by previous researchers.
Previous studies have attempted to predict CAN using different approaches. A hybrid of wrapper filter feature selection was proposed by Huda et al. 27 using ECG features and Ewing’s tests. Based on Ripple down Rules, ensemble classifiers were proposed by Kelarev et al. 28 to predict CAN using Ewing’s tests. Kelarev et al. 29 proposed ensemble classifiers based on decision tree classifiers for the monitoring of diabetic patients through using ECG features and Ewing’s tests. A different study conducted by Abawajy et al. 30 proposed a multitier ensemble classifier for the prediction of CAN, based on the QRS features of ECG and Ewing’s tests. Jelinek et al. 31 discussed an iterative multilayer attributes selection and classification model, which used Ewing’s tests and HRV for the prediction of CAN. A meta-ensemble model was proposed in another study 32 to investigate the prediction of CAN using HRV. Although these models24–32 demonstrated superior performances, they did not address the problem of predicting the probability of CAN occurrence in patients with diabetes. In addition, the models were more general, where they have been proposed to predict the categories of the disease (e.g. normal, early, severe, definitive, abnormal). In contrast, our ML model can measure the relationship between the CAN categories and Ewing’s tests by estimating probabilities using a logistic function, which is the cumulative logistic distribution and a simple novel method.
The main strength of the study is the applicability of the results to the primary care diabetes population in rural settings. This study has limitations that should be considered. First, the small sample size might not be representative of all diabetes patients. Therefore, the results should be interpreted with caution. Second, individuals in our study were diagnosed using only the Ewing’s test with normal and early categories. Third, the probabilities predicted by our model were not calibrated to true occurrence probabilities. Furthermore, we did not correlate our model with clinical findings and biochemical data. In future, we aim to compare the model with various clinical and biochemical tests in more extensive studies with a more varied population.
CAN is a serious medical complication of diabetes and an independent predictor of cardiovascular morbidity and mortality. The importance of early diagnosis of CAN is widely recognized. Diagnosis of CAN, however, is problematic due to the medical expertise required for evaluating the data from Ewing’s test even when resources for the test are available. More broadly, our proposed model points toward the application of innovative methods for the early detection of CAN. The unique feature of our model is that it is easy and simple to employ and does not require a complex code. Thus, our model can be applied as a mobile application or online tool, 38 for example, in combination with the National Heart Foundation of Australia heart age calculator which is commonly used by clinicians in general practice (https://www.heartfoundation.org.au/heart-age-calculator). These results might be useful for healthcare providers to predict the early occurrence of CAN in people with diabetes and support them in combination with digital technologies39–42 such as wearable devices, 43 smartphone apps 44 and text messages45,46 which have shown to be cost-effective.47,48
Furthermore, our study suggests several directions for future work. The ML models can be potentially applied in primary healthcare settings to early detect CAN by general practitioners and specialist nurses where there is a lack of trained healthcare specialists. Clinicians may use these models to monitor the progress of CAN using cheap and straightforward digital health tools such as web-based and mobile phone applications in their clinics. This may lead to early detection and prevention of CAN-related complications and morbidity. Furthermore, the methods used in this study offer a principled way to help inform individualized care using routine data from clinics. Before implementation in clinical practice, however, further research using large local data sets and randomized trials evaluating the effectiveness and cost-effectiveness is recommended.
Conclusion
The ML model developed in this study showed to predict early-stage CAN, which might be useful for both healthcare providers and patients for early intervention, thereby leading to the prevention of CAN-related complications.
Supplemental Material
sj-docx-1-tae-10.1177_20420188221086693 – Supplemental material for Prediction of cardiac autonomic neuropathy using a machine learning model in patients with diabetes
Supplemental material, sj-docx-1-tae-10.1177_20420188221086693 for Prediction of cardiac autonomic neuropathy using a machine learning model in patients with diabetes by Ahmad Shaker Abdalrada, Jemal Abawajy, Tahsien Al-Quraishi and Sheikh Mohammed Shariful Islam in Therapeutic Advances in Endocrinology and Metabolism
Footnotes
Acknowledgements
We are grateful to Herbert F. Jelinek from the School of Community Health, Charles Sturt University, Albury, Australia, for providing us access to the DiScRi data sets in an anonymous format.
Author contributions
Conflict of interest statement
The authors declared no potential conflicts of interest with respect to the research, authorship, and/or publication of this article.
Funding
The authors disclosed receipt of the following financial support for the research, authorship, and/or publication of this article: SMSI is supported by a Fellowship from the National Health and Medical Research Council (NHMRC) and National Heart Foundation of Australia.
Supplemental material
Supplemental material for this article is available online.
References
Supplementary Material
Please find the following supplemental material available below.
For Open Access articles published under a Creative Commons License, all supplemental material carries the same license as the article it is associated with.
For non-Open Access articles published, all supplemental material carries a non-exclusive license, and permission requests for re-use of supplemental material or any part of supplemental material shall be sent directly to the copyright owner as specified in the copyright notice associated with the article.