
Abstract
Background:
Neuroendocrine carcinomas (NECs) and mixed neuroendocrine–non-neuroendocrine neoplasm (MiNEN) in the gastrointestinal (GI) tract are both rare and malignant; however, it is unclear whether their prognosis is the same.
Methods:
In this cross-sectional study, a total of 12,878 patients with NEC or MiNEN in the GI tract were reviewed retrospectively by searching the Surveillance, Epidemiology, and End Results (SEER) program database. Next, we compared the characteristics and survival between patients with NEC or MiNEN and further analyzed the prognostic factors for the patients.
Results:
The data showed that patients with MiNEN had a worse prognosis as compared with patients with pure NEC in the small intestine (SI) and appendix, whereas there was no significant survival difference between NEC and MiNEN in the other parts of the GI system. On the whole, age ⩾55 years (p < 0.0001), male (p = 0.002), being diagnosed at TNM Stage II–IV (p < 0.0001) or not receiving surgical treatment (p < 0.0001) were the independent negative prognostic factors for NEC patients, whereas age ⩾55 years (p = 0.003), being diagnosed at TNM Stage III–IV (p < 0.001) or not receiving surgical treatment (p < 0.001) were identified as the independent negative prognostic factors for the MiNEN patients. Furthermore, when NECs or MiNENs were classified based on the primary tumor site, the results showed that the prognostic factors for NEC and MiNEN varied between the tumor sites.
Conclusion:
The prognostic differences between NECs and MiNENs in the GI tract are heterogeneous and site-related. Patients with appendiceal or SI MiNEN have a poorer prognosis than patients with pure appendiceal or SI NEC. Therefore, we should pay more attention to patients with MiNEN in the SI and appendix and monitor them more closely.
Keywords
Introduction
Neuroendocrine neoplasms (NENs) are commonly considered as rare, but the latest actual incidence rate has increased by 6.4 times from 1973 (1.09 per 100,000) to 2012 (6.98 per 100,000), as reported by the Surveillance, Epidemiology, and End Results (SEER) program. 1
The 2019 World Health Organization classification system classified NENs of the gastrointestinal (GI) tract into three categories: neuroendocrine tumors (NETs), neuroendocrine carcinomas (NECs) and neuroendocrine–non-neuroendocrine neoplasm (MiNEN). 2 NETs are defined as well-differentiated neoplasms. NECs are poorly differentiated neoplasms, and MiNENs are defined as neoplasms having both the neuroendocrine and non-neuroendocrine components, each of which accounts for at least 30% of the tumor. 2
Both NECs and MiNENs are highly aggressive and rare.3–5 However, few studies have been conducted on their prognosis, and the conclusions are ambiguous. La Rosa et al. 6 reported that patients with GI MiNENs generally had a better prognosis than patients with NECs. Both Lin et al. 7 and van der Veen A et al. 8 found that there was no statistically significant difference in prognosis between gastric MiNEN and gastric NEC patients, but La Rosa et al. 9 observed that gastric MiNEN has a better median overall survival (OS) than patients with pure NECs. As for the colon, the results are also varied.10,11 In addition, NENs are recognized as a heterogeneous family with multiple biological and clinical behaviors.12–14 Therefore, it is unclear whether the inconsistent prognostic results between NECs and MiNENs are due to the high heterogeneity of NENs or site-related clinical differences. The limited sample sizes used in these studies may be another reason.
This study retrospectively reviewed patients with pure NECs or MiNENs of the GI tract from 1975 to 2016 using nationally representative data from the SEER program. The aims of this study are to clarify whether the prognosis of NECs and MiNENs of the GI tract is similar and to explore the prognostic factors related to NECs and MiNENs, respectively.
Methods
Study design
Observational cross-sectional study.
Patients and data collection
Data were collected from the SEER program (www.seer.cancer.gov) SEER*Stat Database, including nine regions between the inception of the SEER program in 1975 until 31 December 2016, and 18 regions between the inception of the SEER program in 2000 until 31 December 2016, based on the November 2018 submission. The data used in this study were obtained from the SEER program by signing the SEER Research data Agreement form, a public open database.
Eligible patients were defined as MiNEN or NEC according to the International Classification of Diseases for Oncology, third edition (ICD-O-3) histology codes (8244/3, 8246/3) in the GI tract. Detailed information was collected for these patients, including age, sex, race, primary tumor site, ICD-O-3 histology/behavior, American Joint Committee on Cancer (AJCC) TNM Stage (seventh edition), whether or not surgical treatment was given, survival months and end status. According to the AJCC TNM staging system 7th edition, T status was determined by tumor size and extension, N status was determined by lymphatic metastasis, and M status was determined by distant metastasis. Data were then analyzed by tumor site, including the esophagus, stomach, small intestine (SI), cecum, appendix, colon, rectum, pancreas, liver, gallbladder, biliary tract (GB) and other GI sites.
Statistical analysis
Data were entered into Excel data sheets and then analyzed with SPSS Statistics software for Windows, Version 25.0 (IBM Corp., Armonk, NY, USA) or GraphPad Prism v6.0c. Clinical and pathological features were expressed as median and range, absolute value or fractions. The t-test was used to compare the age difference between the MiNEN and NEC patients, and a chi-square test was performed to analyze the differences in sex distribution and AJCC stage distribution (I–III versus IV) between the MiNEN and NEC patients. The OS was calculated from the date of initial diagnosis to the date of death or last follow-up. A survival analysis was performed by applying the Kaplan–Meier analysis and log-rank test for comparison. A propensity matching analysis was used to analyze the survival difference between MiNEN and NEC in the appendix. Propensity scores were based on age, sex, race, stage and surgery, and these two groups were matched using a greedy approach with a caliper width of 0.02 standard deviation of the logit of the propensity score. Regarding the survival and prognostic factors of the patients with NEC or MiNEN, the hazard ratio (HR) and 95% confidence interval (CI) were calculated by applying the Cox proportional hazard regression analysis. Due to the limitation in sample sizes, esophageal MiNEN, pancreatic MiNEN and hepatic MiNEN were not further analyzed using the Cox proportional hazard regression analysis. p < 0.05 was considered statistically significant.
Results
Patient characteristics
A total of 12,878 patients diagnosed with NEC or MiNEN in the GI tract were collected using the SEER registers from 1975 to 2016. The clinical characteristics of these patients are as shown in Table 1. The median age at diagnosis was 61.0 years (range: 4–98 years). Among the 12,878 patients, 6737 (52.31%) were male and 6141 (47.69%) were female. A total of 77.95% patients were White, 13.88% were Black and 7.15% represented others (American Indian/Alaskan Native and Asian/Pacific Islander).
Patient characteristics.

MiNEN, mixed neuroendocrine-non-neuroendocrine neoplasm; NEC, neuroendocrine carcinoma
Distribution and clinical characteristics of NEC and MiNEN of the GI tract
Among all the 12,878 patients, 12,160 (94.4%) were NEC patients and 718 (5.6%) were MiNEN patients (Table 2). The top four most common sites of NEC in the GI tract were pancreas, SI, rectum, and stomach, accounting for almost three-quarters of all the cases (Table 2). Among the MiNEN patients, the most common sites were appendix, cecum, colon, and rectum (Table 2). When the GI tract was divided into foregut, midgut, and hindgut, the results indicated that NEC was most likely to occur in the foregut, whereas MiNEN was most likely to occur in the midgut (Table 2).
Distribution of NEC and MiNEN of the GI tract by primary tumor site.

GI, gastrointestinal; MiNEN, mixed neuroendocrine-non-neuroendocrine neoplasm; NEC, neuroendocrine carcinoma
Overall, there was no significant difference in the mean age of diagnosis between NECs and MiNENs of the GI tract, except for the appendix [Figure 1(A)]. The mean age at diagnosis of MiNENs was significantly higher than that of NECs in the appendix (57.30 ± 0.6301 versus 41.27 ± 0.8608, p < 0.001) [Figure 1(A)]. When all NENs were divided into foregut, midgut and hindgut, the results showed that the mean age of the NECs diagnosis in the foregut was significantly lower than that of MiNENs diagnosis (60.40 ± 0.1791 versus 65.42 ± 1.654, p = 0.0041) [Figure 1(B)].

Patient characteristics among NEC and MiNEN patients. (A) Age distribution of NEC and MiNEN per primary tumor site in the GI tract. (B) Age distribution of NEC and MiNEN in the foregut, midgut and hindgut. (C) Sex distribution of NEC and MiNEN per primary tumor site in the GI tract. (D) AJCC stage (I–III versus IV) distribution of NEC and MiNEN per primary tumor site in the GI tract.
Regarding the ratio of males to females, there was no significant difference between the NEC and the MiNEN patients, except for the stomach and appendix [Figure 1(C)]. The proportion of male patients with gastric NECs was higher than that of gastric MiNENs (52.42% versus 36.59%, p = 0.047), whereas for the appendix, the proportion of male patients with NECs was lower than that of MiNEN (35.42% versus 50.13%, p < 0.0001) [Figure 1(C)]. The proportion of the patients diagnosed at AJCC Stage I–III to AJCC Stage IV between the NEC and MiNEN patients was not significantly different except in the appendix and colon [Figure 1(D)]. In the appendix, MiNEN was more likely to be diagnosed at a later stage (AJCC Stage IV) than NEC [p < 0.001; Figure 1(D)]. Conversely, in the colon, NEC was more likely to be diagnosed at a later stage than MiNEN [p = 0.027; Figure 1(D)].
No survival difference between NEC and MiNEN in gastrointestinal tract except in the SI and appendix
Figure 2 depicts the results obtained from the Kaplan–Meier analysis. The median survival time was 107 and 92 months for NEC and MiNEN patients, respectively (p = 0.4215). The Kaplan–Meier survival analysis showed that there was no significant difference in the survival time between the esophageal NEC and esophageal MiNEN (OS: 35 months versus 9 months, p = 0.1598), gastric NEC and MiNEN (OS: 52 months versus 27 months, p = 0.2528), caecal NEC and MiNEN (OS: 21 months versus 34 months, p = 0.8023), colonic NEC and MiNEN (OS: 12 months versus 31 months, p = 0.0859), rectal NEC and MiNEN (OS: 244 months versus 176 months, p = 0.9295), NEC and MiNEN in the GB (OS: 15 months versus 14 months, p = 0.5591). The median survival of SI NEC was 130 months, in contrast to that of SI MiNEN, which was 61 months (p < 0.0001). In the appendix, the prognosis of MiNEN was significantly worse than that of NEC (p < 0.0001).
When all NENs were classified into foregut, midgut and hindgut, the results demonstrated that the MiNENs had a worse prognosis than the NEC in the midgut (p = 0.0012), while there were no significant differences in the prognosis between the foregut NEC and MiNEN (p = 0.1623), as well as between the hindgut NEC and MiNEN (p = 0.9160).
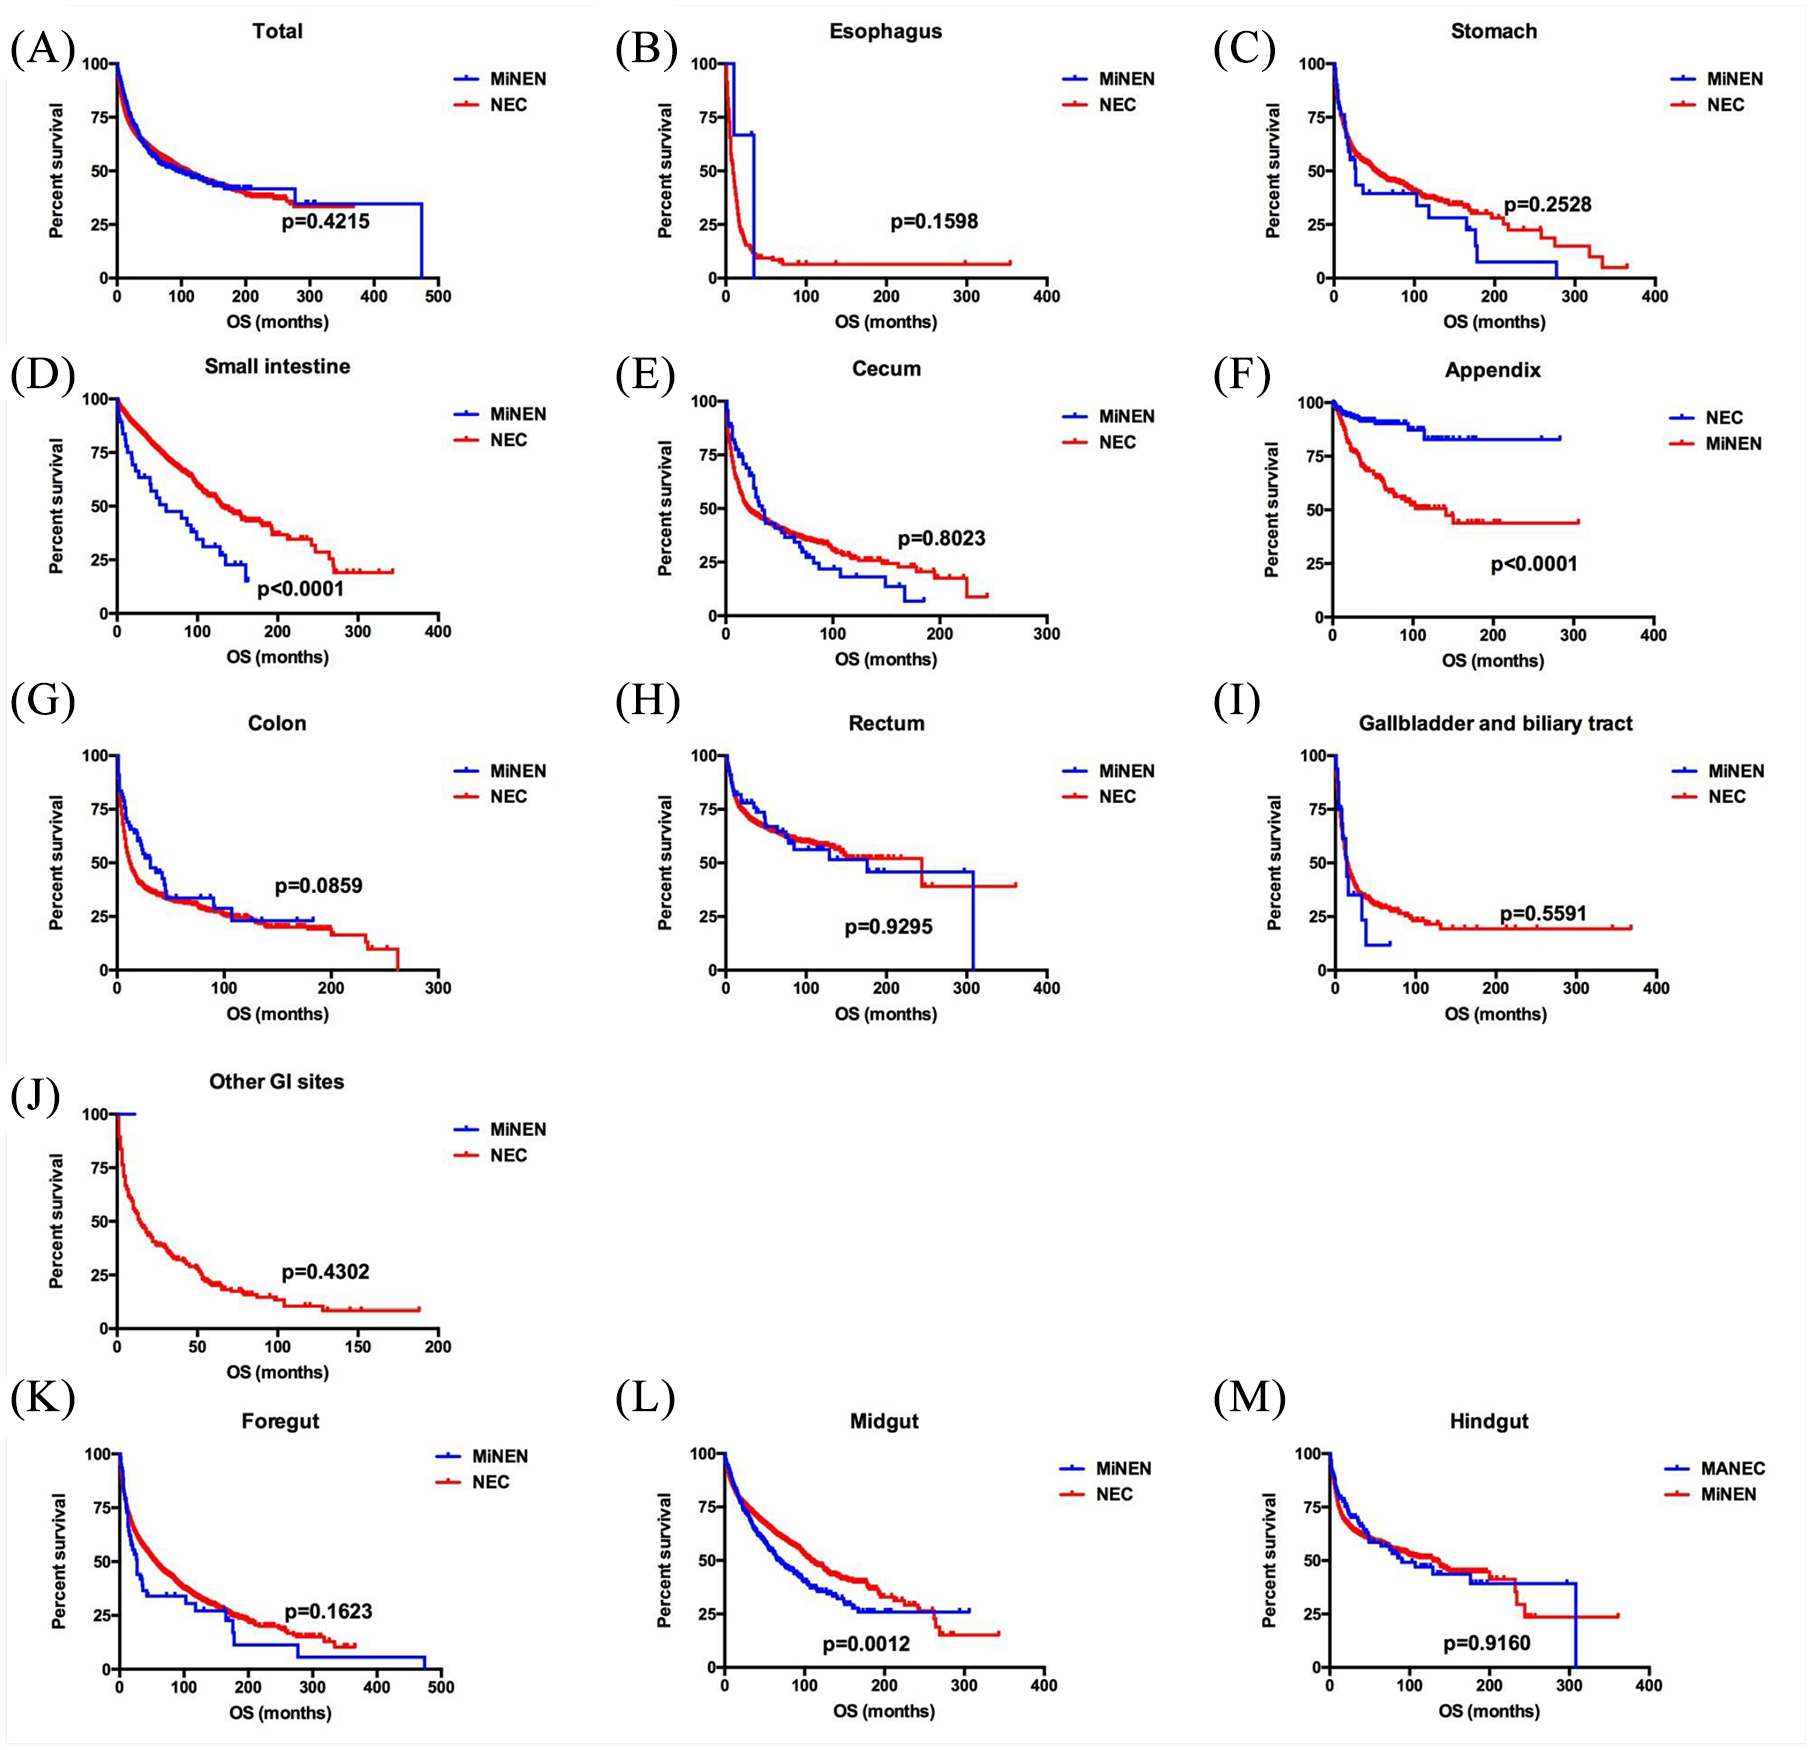
Kaplan–Meier curves for overall survival in patients with NEC and MiNEN at each site of the GI tract. (A) Total, (B) esophagus, (C) stomach, (D) small intestine, (E) cecum, (F) appendix, (G) colon, (H) rectum, (I) gallbladder and biliary tract, (J) other GI sites. Kaplan–Meier curves for overall survival in patients with NEC and MiNEN in the foregut (K), midgut (L) and hindgut (M).
Prognostic factors for pure NEC and MiNEN
Univariate and multivariate Cox regression analyses showed that age (p < 0.0001), male sex (p < 0.01), TNM stage (p < 0.0001) and not receiving surgical treatment (p < 0.0001) were negative prognostic factors for overall survival in patients with NEC in the GI tract. Age (p = 0.003), TNM stage (p < 0.0001) and not receiving surgical treatment (p < 0.001) were negative prognostic factors for overall survival in patients with MiNEN in the GI tract (Table 3).
Univariate and multivariate Cox regression analyses on prognostic baseline factors for survival in patients with NEC or MiNEN in the GI tract.

CI, confidence interval; GI, gastrointestinal; HR, hazard ratio; MiNEN, mixed neuroendocrine-non-neuroendocrine neoplasm; NEC, neuroendocrine carcinoma
Univariate and multivariate Cox regression analyses, including age, sex, race, TNM staging and whether or not surgical treatment was given, were conducted according to tumor site to evaluate the prognostic factors related to the prognosis of NEC and MiNEN further. The Cox regression analyses for the esophageal NEC indicated that both TNM Stages III and IV had a worse survival than TNM Stage I (Supplemental Material Table 1; p = 0.044 and p = 0.002). In the stomach, Cox regression analyses for NEC revealed that age ⩾ 55 years (p = 0.047), TNM Stages III and IV (p < 0.0001) and not receiving surgical treatment (p < 0.0001) were poor prognostic factors, and there were no effective prognostic factors for MiNEN (Supplemental Table 2). In SI, age ⩾ 55 years (p < 0.0001), TNM Stage IV (p = 0.002) and not receiving surgical treatment (p = 0.016) were identified as negative prognostic factors for survival in patients with NEC using multivariate Cox regression analysis, and age ⩾ 55 years (p = 0.017) was identified as a negative prognosis factor for survival in patients with MiNEN using univariate Cox regression analysis (Supplemental Table 3). In the cecum, both TNM Stage IV (p < 0.0001) and not receiving surgical treatment (p = 0.001) were identified as negative prognosis factors for NEC from the multivariate Cox regression analysis results, and only TNM Stage IV (p = 0.011) was identified as the negative prognostic factor for survival in patients with MiNEN using multivariate Cox regression analysis (Supplemental Table 4). In the appendix, both age and TNM Stage IV were identified as negative prognostic factors for survival in patients with both NEC and MiNEN based on Cox regression analyses (Supplemental Table 5). In the colon, age ⩾ 55 years (p = 0.011), TNM Stages III and IV (p = 0.015 and p < 0.0001) and not receiving surgical treatment (p = 0.001) were poor prognostic factors for NEC from the multivariate Cox regression analysis results, and only TNM Stage IV (p < 0.0001) was identified as a negative prognostic factor for MiNEN using univariate Cox regression analysis (Supplemental Table 6). In the rectum, age ⩾ 55 years (p = 0.004), race (p = 0.018), TNM stage (p < 0.0001) and not receiving surgical treatment (p < 0.001) were independent prognostic factors for NEC using multivariate Cox regression analysis, and not receiving surgical treatment (p = 0.007) was identified as a negative prognostic factor for survival in patients with MiNEN from the univariate Cox regression analysis results (Supplemental Table 7). In the pancreatic NEC, age ⩾ 55 years (p < 0.0001), TNM Stages II–IV (p < 0.001) and not receiving surgical treatment (p < 0.0001) were poor prognostic factors (Supplemental Table 8). In hepatic NEC, sex (p = 0.047) and race (p = 0.022) were identified as independent prognostic factors for survival (Supplemental Table 9).
Discussion
Both NEC and MiNEN are malignant tumors and have neuroendocrine neoplasm components; however, it remained unknown whether both have the same prognosis. Therefore, in this study, we reviewed and compared the prognostic differences between NEC and MiNEN and summarized their prognostic factors. To the best of our knowledge, this investigation is the most extensive study on the comparison of the characteristics and survival between NEC or MiNEN patients in the GI tract by tumor site.
NECs were mostly found in the colon, pancreas and SI based on a dataset of 5509 NEC patients in the GI tract, according to Dasari et al. 1 In this retrospective study, we found that the top three most common sites of NEC were the pancreas, SI and rectum, which is generally consistent with the findings of previous studies. MiNENs have been found in the esophagus, stomach, appendix, colon, rectum and biliary tract,15–24 but most reports were case reports and small case series, and few reports had long-term follow-up data in the literature. 21 We observed that the most common site of MiNEN was appendix, and the MiNENs in the esophagus, stomach, pancreas and biliary tract were rare, accounting for less than 10% of the total number of MiNENs.
So far, most of the studies on the prognostic differences between NEC and MiNEN were small sample-size studies and the conclusions were quite different. A retrospective study regarding the clinicopathologic features and prognosis of NEC and MiNEN of the esophagus included 40 patients and reported that esophageal NEC is an aggressive tumor, and patients with MiNEN have a better outcome. 25 By analyzing 51 pure NEC patients and 15 MiNEN patients, La Rosa et al. 9 observed that gastric MiNEN has a better median OS than patients with pure NECs. Conversely, a study from South Korea, by comparing the prognosis between 47 gastric NEC patients and 10 MiNEN patients, revealed that no survival difference was observed between them. 26 The results of the two studies on survival differences between colonic NECs and MiNENs are also different.10,11 In addition, two studies on appendiceal MiNEN found that MiNEN is a more aggressive clinical entity than both goblet cell carcinoid of the appendix and carcinoid tumors of the appendix.21,27 La Rosa et al. and Klöppel et al.6,28 considered that some clinical differences between NECs and MiNENs might be site-related.
In our study, we retrieved 12,878 patients from SEER and further analyzed the survival difference between NEC and MiNEN both as a whole and by the primary tumor sites. Overall, no significant difference was observed in the prognosis between NEC and MiNEN in the GI tract. When we further compared the prognosis according to the primary tumor sites, we observed different site-related results in the survival time between NEC and MiNEN. In the esophagus, stomach, cecum, colon, rectum and GB, patients with MiNEN had a similar survival time in comparison with patients with NEC. However, in the SI and appendix, we found OS for MiNEN to be significantly shorter than that of NEC. Our results suggest that the prognostic differences between NEC and MiNEN are site-related.
There are several limitations of this study. First, although data on more than 10,000 patients were collected from the SEER database in this study, the included cases may not wholly represent the characteristics of the entire NEN population because the included population were mainly White, and the number of MiNENs in some specific sites was very small. Second, the population in the SEER database is primarily Medicare/Medicaid based and, thus, may have a bias. Third, although SEER provides detailed clinical information of the NEN patients, we found that the lack of detailed treatment factors, such as chemotherapy, quality of surgery, and systemic treatment, could confound the results. Fourth, there is a possible immortal time bias due to different treatments over time.
In general, patients with GI MiNEN have a similar median OS to patients with pure NEC, while in the appendix and SI, MiNEN is a more aggressive entity than pure NEC. Therefore, there is a need to pay more attention to patients with MiNEN in the SI and appendix and monitor their management more closely.
Supplemental Material
Supplementary_Tables_R2_1 – Supplemental material for Do neuroendocrine carcinomas and mixed neuroendocrine–non-neuroendocrine neoplasm of the gastrointestinal tract have the same prognosis? A SEER database analysis of 12,878 cases
Supplemental material, Supplementary_Tables_R2_1 for Do neuroendocrine carcinomas and mixed neuroendocrine–non-neuroendocrine neoplasm of the gastrointestinal tract have the same prognosis? A SEER database analysis of 12,878 cases by Huiying Shi, Cuihua Qi, Lingjun Meng, Hailing Yao, Chen Jiang, Mengke Fan, Suya Pang, Qin Zhang and Rong Lin in Therapeutic Advances in Endocrinology and Metabolism
Footnotes
Acknowledgements
The authors wish to acknowledge all participants in this study and everybody involved in the set-up and implementation of the study.
Author contribution(s)
Availability of data
The data used and/or analyzed in this study were obtained from the SEER database, which is available on request and is a publicly available database.
Conflict of interest statement
The authors declare that there is no conflict of interest.
Funding
Supported by the National Natural Science Foundation of China (grant numbers 81770539 and 81572428), and the National key research and development program of China (grant numbers 2017YFC0110003). The funding body had no part in the design of the study and collection, analysis, and interpretation of data and in writing the manuscript.
Supplemental material
Supplemental material for this article is available online.
References
Supplementary Material
Please find the following supplemental material available below.
For Open Access articles published under a Creative Commons License, all supplemental material carries the same license as the article it is associated with.
For non-Open Access articles published, all supplemental material carries a non-exclusive license, and permission requests for re-use of supplemental material or any part of supplemental material shall be sent directly to the copyright owner as specified in the copyright notice associated with the article.