
Abstract
Background:
The aim of this study was to evaluate the diagnostic value of six urinary biomarkers for prediction of diabetic kidney disease (DKD).
Methods:
The cross-sectional study recruited 1053 hospitalized patients with type 2 diabetes mellitus (T2DM), who were categorized into the diabetes mellitus (DM) with normoalbuminuria (NA) group (n = 753) and DKD group (n = 300) according to 24-h urinary albumin excretion rate (24-h UAE). Data on the levels of six studied urinary biomarkers [transferrin (TF), immunoglobulin G (IgG), retinol-binding protein (RBP), β-galactosidase (GAL), N-acetyl-beta-glucosaminidase (NAG), and β2-microglobulin (β2MG)] were obtained. The propensity score matching (PSM) method was applied to eliminate the influences of confounding variables.
Results:
Patients with DKD had higher levels of all six urinary biomarkers. All indicators demonstrated significantly increased risk of DKD, except for GAL and β2MG. Single RBP yielded the greatest area under the curve (AUC) value of 0.920 compared with the other five markers, followed by TF (0.867) and IgG (0.867). However, GAL, NAG, and β2MG were shown to have a weak prognostic ability. The diagnostic values of the different combinations were not superior to the single RBP.
Conclusions:
RBP, TF, and IgG could be used as reliable or good predictors of DKD. The combined use of these biomarkers did not improve DKD detection.
Introduction
Diabetic kidney disease (DKD) is one of the most common chronic complications of diabetes mellitus (DM), which becomes an increasingly frequent etiology of end-stage renal disease and dialysis.1,2 Moreover, the prevalence of diabetes-related chronic kidney disease (CKD) has exceeded that of glomerulonephritis-related CKD to become the leading cause of CKD in China. 3 To date, the diagnosis of DKD is dependent on both albuminuria and estimated glomerular filtration rate (eGFR) according to the relevant guidelines.4,5 However, albuminuria does not directly reflect the extent of renal injury, and few DM patients have had progressive renal decline before albuminuria. 6 Moreover, microalbuminuria (MA) among some patients with DKD can be regressed back to normoalbuminuria (NA).7,8 Therefore, there is an urgent need to explore novel and effective biomarkers for the diagnosis of early-stage DKD.
Dozens of biomarkers are associated with DKD.9,10 However, as most have not been clinically validated, they have limited applicability in the clinical setting. However, besides albuminuria, there are no strong predictors for screening the initial stage of DKD. Furthermore, inconsistent results have been frequently reported with regard to prediction of DKD in previous researches. In addition, the impacts of confounding factors have probably not been adequately eliminated in many observational studies. Thus, we aimed to investigate the association between urinary biomarkers and DKD by comprehensively evaluating six urinary biomarkers involved in tubular injury or glomerular damage. Moreover, the propensity score matching (PSM) method was applied to reduce the influence of confounding variables.
Materials and methods
Study population
The cross-sectional study recruited 1053 patients with type 2 diabetes mellitus (T2DM) admitted in Tianjin Medical University Chu Hsien-I Memorial Hospital between January 2018 and December 2018. The diagnostic criteria and classification for DM, given by the World Health Organization (WHO) in 1999, were adopted to define the diabetic patient. 11 All patients were divided into the DM with NA (DM) group and DKD group based on 24-h urinary albumin excretion rate (24-h UAE) and eGFR (DM group: 24-h UAE < 30 mg/24 h, eGFR ⩾ 60 ml/min/1.73 m2; DKD group: 24-h UAE ⩾ 30 mg/24 h, eGFR ⩾ 60 ml/min/1.73 m2). Inclusion criteria were T2DM diagnosis, age ⩾18 years, eGFR ⩾ 60 ml/min/1.73 m2 according to the Kidney Disease: Improving Global Outcomes (KDIGO) clinical practice guideline in 2012 and the CKD-EPI (Chronic Kidney Disease Epidemiology Collaboration) formula,12,13 and we excluded patients with anemia, neoplasm, severe cardiovascular, cerebrovascular and liver diseases, chronic glomerulonephritis, known kidney diseases other than DKD, infection, autoimmune diseases, and acute diabetic complications such as ketoacidosis. Moreover, patients with poorly controlled hypertension, fever, vigorous physical activity, urinary tract infection, pregnant women, and those on their menstrual period were excluded to avert nonspecific albuminuria.
Written informed consent was obtained from all patients analyzed in this study. The study adhered to the tenets of the Declaration of Helsinki and was reviewed and approved by the Medical Ethics Committee of Tianjin Medical University Chu Hsien-I Memorial Hospital (Ethics Approval Number: DXBYYhMEC2018-16).
Definition of DKD
DKD refers to chronic kidney disease that is specific to diabetes, mainly including eGFR < 60 ml/min/1.73 m2 or albuminuria [urine albumin to creatinine ratio (ACR) ⩾ 30 mg/g, urinary albumin excretion rate (UAE) ⩾ 30 mg/24 h] present for >3 months. 14 In the present study, we chose 24-h UAE as ‘gold standard’, and all the urinary biomarkers were compared with 24-h UAE. We excluded patients with eGFR < 60 ml/min/1.73 m2, regardless of whether the 24-h UAE was positive (⩾30 mg/24 h) or not, to ensure that the DM and DKD groups are well matched in terms of eGFR.
Data collection
Demographic and clinical measurements, including sex, age, height, body weight, body mass index (BMI), diabetic duration, and blood pressure, were collected via interview and confirmed by checking the patients’ records. Medication and smoking history were carefully recorded. Direct ophthalmoscopy for the diagnosis of diabetic retinopathy was performed by an experienced ophthalmologist. All blood samples were drawn from the patients after 12-h overnight fasting. Routine tests included serum creatinine (data not shown), serum uric acid (SUA), lipid profiles [total cholesterol (TC), triglyceride (TG), high-density lipoprotein (HDL), low-density lipoprotein (LDL)] using the AU5800 automatic biochemical analyser. Haemoglobin A1c (HbA1c) was measured using the HLC-723G8 HbA1c analyser. The first midstream morning urine samples were assessed for concentrations of transferrin (TF), immunoglobulin G (IgG), β2-microglobulin (β2MG), retinol-binding protein (RBP), β-galactosidase (GAL), and N-acetyl-beta-glucosaminidase (NAG) using the Cobas8000 modular analyzer. To determine the level of 24-h UAE, we collected urine (24-h urine collection for two consecutive days), and the mean value was adopted.
All specimens were tested in the Department of Clinical Laboratory at Tianjin Medical University Chu Hsien-I Memorial Hospital. Reference range for urine biomarkers determined by the manufacturers of the kits were as follows: TF, 0.0–5.0 mg/l; IgG, 0.0–17.5 mg/l; RBP, 0.0–0.7 mg/l; GAL, 0.0–15.0 U/l; NAG, 0.3–12.0 U/l; and β2MG, 0.0–0.3 mg/l.
Statistical analysis
Data were analyzed using SPSS statistical software commercial version 22.0 (IBM, Chicago, IL, USA) and SAS version 9.4 (SAS Institute Inc., Gary, NC, USA). Estimation of the sample size was based on the factors studied in the model and the incidence of DKD.3,15 To balance the differences between the DM and DKD groups, the characteristics of the patients in the two groups were matched in a 1:1 ratio using the PSM method. A total of 17 covariates (sex, age, BMI, DM duration, SBP, DBP, HbA1c, eGFR, SUA, TC, TG, HDL, LDL, smoking, retinopathy, ACEI/ARB use, statin use) were selected for the PSM model. The calliper width was set to 0.2 of the standard deviation of the logit of propensity score. 16 The balance of covariates after matching was assessed using the standardized difference, with <10% being acceptable. 17
Given that the distributions of all continuous variables in this study were not normal, the natural logarithmic transformation was applied to normalize the data before analysis. The descriptive statistics were expressed as geometric mean [95% confidence intervals (CI)] for continuous variables and percentage for categorical variables. Differences between the groups were tested using analysis of variance (ANOVA) or logistic regression analysis. 24-h UAE was defined as a dependent variable. Univariate and multivariate logistic regressions were performed to assess the predictors. Crude and adjusted odds ratios (OR) with 95% CI were assessed for determining the relationships between urinary biomarkers and DKD. The area under the curve (AUC), sensitivity, and specificity were calculated as measures of diagnostic accuracy. Receiver operating characteristic (ROC) curve, ranging from 0.5 to 1.0, analysis was performed to assess the diagnostic values of urinary biomarkers. The cut-off value was based on the maximum value of the Youden index. All statistical tests were two-tailed, and p-value <0.05 was considered significant.
Results
Clinical characteristics of the study participants
The characteristics of the DM and DKD groups before and after PSM are shown in Table 1. In this study, 1053 patients with eGFR ⩾ 60 ml/min/1.73 m2 were recruited, including 300 patients with DKD and 753 patients with DM with NA. Before matching, 17 out of the 23 covariates, including sex, BMI, DM duration, SBP, DBP, eGFR, SUA, TG, HDL, retinopathy, ACEI/ARB use, TF, IgG, β2MG, RBP, GAL, and NAG, were significantly different between the two groups. Moreover, the level of 24-h UAE in the DKD group was significantly higher than that in the DM group (p < 0.001). The remaining factors, including age, HbA1c, TC, LDL, smoking, and statin use, were nonsignificant between the two groups. After matching, 500 cases (DKD group, n = 250) were included in the PSM model. All 17 covariates were well balanced and no differences were observed (Table 1); however, the level of each biomarker was considerably increased in the DKD group compared with the DM group.
Clinical characteristics of the study participants before and after propensity score matching.

Analysis of variance or logistic regression analysis.
Geometric mean (95% confidence interval) (all such values).
24-h UAE, 24-hour urinary albumin excretion; β2MG, β2-microglobulin; ACEI/ARB, angiotensin-converting enzyme inhibitor/angiotensin II receptor blocker; BMI, body mass index; DBP, diastolic blood pressure; DKD, diabetic kidney disease; DM, diabetes mellitus; eGFR, estimated glomerular filtration rate; GAL, β-galactosidase; HbA1c, haemoglobin A1c; HDL, high-density lipoprotein; IgG, immunoglobulin G; LDL, low-density lipoprotein; NAG, N-acetyl-beta-glucosaminidase; RBP, retinol-binding protein; SBP, systolic blood pressure; SUA, serum uric acid; TC, total cholesterol; TF, transferrin; TG, triglyceride.
Logistic regression analysis
Univariate and multivariate logistic regressions were performed for the urinary biomarkers correlated with DKD, and the data are shown in Table 2. Notably, all six biomarkers were associated with increased risks of DKD in the univariate logistic regression. The RBP showed the highest odds ratio (OR) (crude OR = 2.59, 95% CI = 2.16–3.18, p < 0.001) whether adjusted or not. The TF, IgG, GAL, and NAG were also significant predictors of DKD in multivariate logistic regression, and similar results were obtained in TF, IgG, RBP, and NAG after matching. However, there was no statistically significant difference in β2MG after adjustment. In the PSM model, the OR of all the biomarkers tended to be slightly lower compared with values before matching. Regrettably, no significant differences were observed in either GAL (p = 0.055) or β2MG (p = 0.16).
Odds ratios for increased risks of DKD in univariate and multivariate logistic regressions.

Adjusted for sex, age, BMI, smoking, retinopathy, SBP, DBP, DM duration, HbA1c, eGFR, SUA, TG, TC, HDL, LDL, ACEI/ARB use, and statin use.
β2MG, β2-microglobulin; ACEI/ARB, angiotensin-converting enzyme inhibitor/angiotensin II receptor blocker; BMI, body mass index; DBP, diastolic blood pressure; DKD, diabetic kidney disease; DM, diabetes mellitus; eGFR, estimated glomerular filtration rate; GAL, β-galactosidase; HbA1c, haemoglobin A1c; HDL, high-density lipoprotein; IgG, immunoglobulin G; LDL, low-density lipoprotein; NAG, N-acetyl-beta-glucosaminidase; RBP, retinol-binding protein; SBP, systolic blood pressure; SUA, serum uric acid; TC, total cholesterol; TF, transferrin; TG, triglyceride.
Evaluation of urinary biomarkers
The AUC, sensitivity, and specificity were assessed for the diagnostic values of each biomarker and different combinations (Table 3). All biomarkers demonstrated prognostic ability with AUC > 0.5 (Figure 1a). RBP yielded the greatest AUC among all examined biomarkers at 0.920 (0.902–0.939), followed by AUC of TF and IgG, with AUC values of 0.867 (0.838–0.896) and 0.867 (0.842–0.891), respectively. GAL, NAG, and β2MG demonstrated significant but weak prognostic values. The cut-off value for TF was 1.04 (sensitivity 72.9%, specificity 91.6%), IgG was 3.66 (sensitivity 72.9%, specificity 83.0%), RBP was 0.62 (sensitivity 81.0%, specificity 88.8%), GAL was 3.05 (sensitivity 74.3%, specificity 35.9%), NAG was 11.65 (sensitivity 53.6%, specificity 71.1%), and β2MG was 0.15 (sensitivity 49.8%, specificity 67.4%). Similar results were found in the PSM model (Table 3, Figure 1b). We further evaluated the predictive performances of different combinations. The combined markers with each other provided remarkable diagnostic values of AUC; however, none of them were better than RBP before matching. In the PSM model, the AUC derived from all six combined markers was 0.902 (0.873–0.930), which was moderately higher than those of the others.
Evaluation of urinary markers and different combinations in the diagnosis of DKD.

combination1, TF + RBP; combination2, TF + IgG; combination3, IgG + RBP; combination4, TF + IgG + RBP; combination5, RBP + GAL + NAG + β2MG; combination6, TF + IgG + RBP + GAL + NAG + β2MG.
24-h UAE, 24-hour urinary albumin excretion; β2MG, β2-microglobulin; DKD, diabetic kidney disease; GAL, β-galactosidase; IgG, immunoglobulin G; NAG, N-acetyl-beta-glucosaminidase; RBP, retinol-binding protein; TF, transferrin.
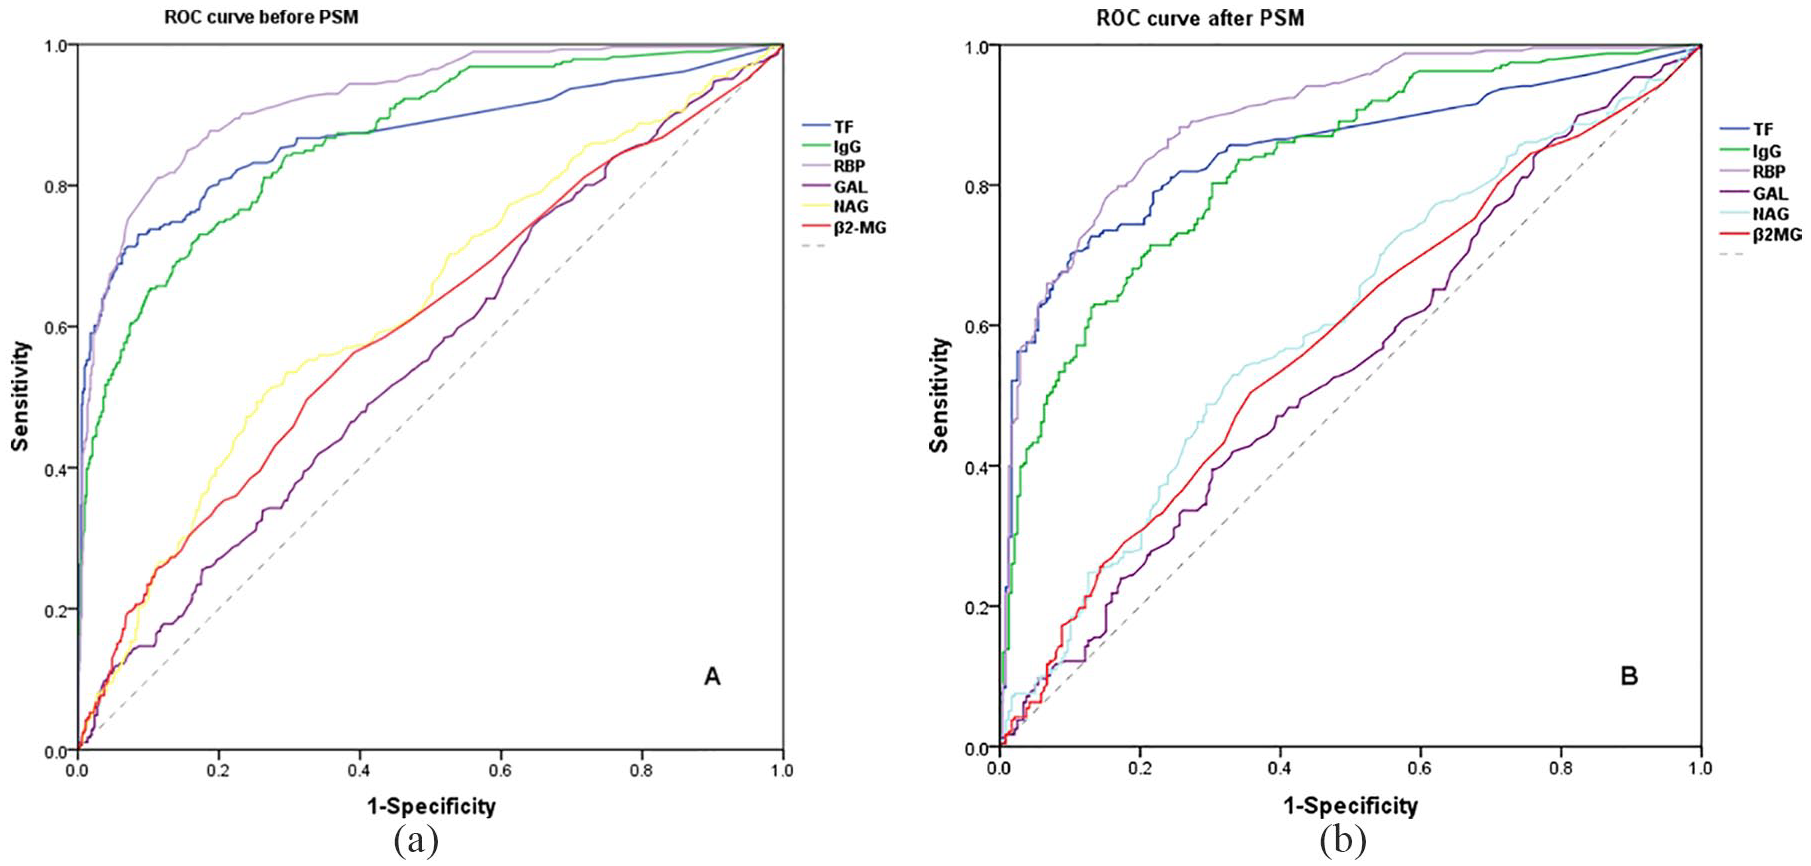
Graph ROC curves showing AUCs of different biomarkers for the diagnosis of DKD.
Finally, we compared the differences in the AUC among the biomarkers. As shown in Table 4, RBP was significantly different compared with the other five indicators. None of the combined indicators was significantly better than RBP, and they showed no difference. Both AUCs of TF and IgG were obviously greater than those of GAL, NAG, and β2MG, which showed a statistically significant difference. The results were similar in the PSM model (data not shown).
Comparison of the area under the ROC curve before PSM.

combination1, TF + RBP; combination2, TF + IgG; combination3, IgG + RBP; combination4, TF + IgG + RBP; combination5, RBP + GAL + NAG + β2MG; combination6, TF + IgG + RBP + GAL + NAG + β2MG.
24-h UAE, 24-hour urinary albumin excretion; β2MG, β2-microglobulin; DKD, diabetic kidney disease; GAL, β-galactosidase; IgG, immunoglobulin G; NAG, N-acetyl-beta-glucosaminidase; RBP, retinol-binding protein; TF, transferrin.
Discussion
In the current study, we systematically assessed six urinary biomarkers for diagnosing DKD using the PSM method. Our findings identified higher levels of urinary biomarkers (TF, IgG, RBP, GAL, NAG, and β2MG) in patients with DKD. All indicators demonstrated significantly increased risk of DKD except for GAL and β2MG. The results showed that single RBP yielded the best predictive value compared with the other five markers, followed by TF and IgG. However, GAL, NAG, and β2MG may not be the ideal biomarkers. Moreover, the diagnostic values of different combinations were not superior to the single RBP.
TF and IgG are involved in glomerular damage. TF is considered to be less easily repelled by glomerular filtration barrier than albumin, because TF is less anionic than albumin in spite of their similar molecular weights.18,19 Unlike TF, IgG is preserved by the glomerular filtration barrier because of its large molecular weight. 20 In previous studies, both increased urinary TF and IgG have been found in normoalbuminuric patients with T2DM,19,21 suggesting their potential for use as markers in predicting early-stage DKD. A 5-year follow-up cohort study proved that increased urinary excretions of TF and IgG can predict MA in patients with T2DM. 22 Recently, intensive cross-sectional studies demonstrated that they were significantly positively correlated with increased risk of DKD.23–25 The results of our project were consistent with those of previous investigations. Moreover, the prognostic abilities of TF and IgG evaluated in this study were concordant with previous reports. As noted here, they both provided good and equal diagnostic values for DKD, as they did in the PSM model. Consistent with previous studies, TF and IgG were found to be useful predictors of DKD in our study. However, the cut-off value, sensitivity, and specificity of TF and IgG were all found to be variable between this study and previous studies.23–25 The difference may be caused by sample size, patient selection, detection methods, and so on. Additionally, some researchers reported that TF was correlated with primary glomerulonephritis and hypertension with nondiabetic populations,26,27 limiting its use as a specific marker of DKD. Thus, the impact of these factors should be carefully considered when using TF as a marker.
The other four markers, RBP, GAL, NAG, and β2MG, have been widely used as markers of tubular injury. Our previous work demonstrated that urinary RBP was elevated in subclinical diabetic nephropathy. 28 Moreover, a higher level of urinary RBP has been shown in patients with DM than in healthy controls.29,30 Hong and colleagues reported that urinary RBP excretion was higher in DM patients with complications than in those without, and revealed that it was associated with increased risk of microvascular complications of DM.31,32 Obviously, all of the abovementioned researches implied that RBP could be used as a suitable predictor of DKD. In contrast, several studies reported that RBP correlated positively with albuminuria in DM.25,33,34 An ancillary cohort study further confirmed that urinary RBP was independently associated with the risk of DM patients with macroalbuminuria. 35 Of note, we also found that urinary RBP markedly improved the risk of DKD, and showed better diagnostic value than the other indicators. These findings indicated that RBP could be a reliable biomarker for screening patients with DKD. However, the RBP-to-creatinine ratio demonstrated a good diagnostic value for patients with macroalbuminuria but weak performance in MA patients. 25 Unfortunately, the abovementioned cohort study did not provide evidence of RBP with NA and MA in DM patients. 35 In the future, more clinical trials will be needed to validate the predictive value of RBP.
As lysosomal enzymes, both urinary GAL and NAG secreted in the proximal tubule cell have been extensively studied. Unfortunately, these findings were controversial in terms of the mixed conclusions drawn. In the current study, although the level of urinary GAL was significantly higher compared with the DKD group, it had a weak diagnostic accuracy, and only a mild OR value was observed. The same trend was observed in NAG. A previous study showed that the level of enzymatic activity of GAL was higher in DKD patients than in healthy controls. 36 However, no significant correlation has been found between the examined enzyme activity of GAL and the level of albuminuria with T1DM in a prospective study. 37 Besides, GAL did not show a significant impact on albuminuria when adjusted by PSM method in our study. NAG, as a sensitive marker of MA, is found in patients with T2DM, 38 and the regression of MA in T1DM was associated with the lower NAG level at baseline in a cross-sectional study. 39 In the Diabetes Control and Complications Trial, urinary NAG excretion independently increased the risk of albuminuria in patients with T1DM. 40 Conversely, it showed no correlation with the development of MA in T1DM with an interval of 5 years follow up. 41 A similar negative result was observed in an Indian population. 42 Furthermore, Zhang and colleagues indicated that NAG failed to be a diagnostic marker to predict early-stage DKD. 23 In summary, neither urinary GAL nor NAG could be used as good predictors of DKD based on the current understanding, and more high-quality data should be provided to clarify the relationships between DKD and these two markers.
Being a low-molecular-weight protein, the filtration and reabsorption processes of β2MG are similar to those of RBP. Urinary β2MG was also significantly elevated in patients with DKD,43,44 consistent with our study. In the current study, the β2MG displayed a weak diagnostic ability and nonsignificantly increased risk of DKD, whereas it has been proven to reliably differentiate DKD from biopsy-proven non-DKDs. 45 Moreover, previous studies have demonstrated that it was strongly negatively correlated with eGFR, and might be used as a marker for predicting renal function decline or end-stage renal disease.46–48 It is possible that β2MG is more sensitive to renal function decline than albuminuria.
To further investigate whether the combined indicators significantly improved the accuracy of DKD, we compared all AUCs derived from each marker and any combination. Unexpectedly, although the combined diagnostic values were elevated, they were not significantly better than RBP, even when adjusted by the PSM method. Additionally, to rule out the influences of confounding factors, we performed ROC analysis of accommodating covariates according to a previously reported method, 49 and the results were very similar to those before adjustment (data not shown).
This study has several limitations. First, it was a cross-sectional study performed at a single center and did not prove causality. Second, the present study was unable to distinguish relationships between the six markers and early-stage DKD, because the DKD group had not been subdivided into subgroups, and there was a lack of healthy controls. Third, patient selection bias might exist. Fourth, despite adjustment by statistical methods, the results may remain subject to confounding factors that are considered to be associated with DKD.
Conclusion
Based on the robust control of confounding factors, the current study suggested that RBP, TF, and IgG could be used as reliable or good predictors of DKD. However, GAL, NAG, and β2MG were shown to have a weak prognostic ability. Furthermore, the combined use of these biomarkers did not improve the detection of DKD. Thus, a further prospective study is warranted to validate the predictive value. This observational study contributed to more evidence regarding the diagnostic accuracy of urinary biomarkers.
Footnotes
Acknowledgements
The authors are grateful to all staff nurses and doctors in the Department of Nephrology and Department of Clinical Laboratory at Tianjin Medical University Chu Hsien-I Memorial Hospital for their support. The authors would also like to acknowledge the research team.
Authors’ note
YQ and SZ contributed equally to this work. YQ, HZ, and BC designed and conceived the experiments. YQ, SZ, XS, JW, MZ, XC, and ZG performed the experiments. SZ and HZ analyzed the data. YQ and SZ wrote the main manuscript text. JY and BC revised the paper. All authors approved the final version manuscript.
Funding
The author(s) disclosed receipt of the following financial support for the research, authorship, and publication of this article: This work is funded by the National Key R&D Program of China (Nos. 2018YFC1314000), National Natural Science Foundation of China (No. 81603461 and 81774043), Tianjin Science and Technology Plan Project (No. 17ZXMFSY00140), Tianjin Health Commission Key Research Program (No. 16KG167),and Natural Science Foundation of Tianjin City (No. 17JCZDJC34700).
Conflict of interest statement
The authors declare that there is no conflict of interest.