
Abstract
Electrical stimulation holds promise for enhancing bone healing; however, it has not yet seen widespread clinical adoption. A significant obstacle is the limited understanding of the biological mechanisms involved and the electric field parameters required to trigger them. It has been observed that the intracellular calcium ion concentration increases upon electrical stimulation, possibly via the activation of voltage-gated calcium channels. In this work, we introduced a digital twin framework to rationally choose stimulation parameters. We aimed to induce a transmembrane potential sufficient to activate the voltage-gated calcium channels. We focused on kilohertz-frequency stimulation, which offers advantages for clinical translation, and applied electrical stimuli using a well-established direct-contact stimulation chamber. By combining this with live-cell calcium imaging, we observed the immediate stimulation effect. We found that a stimulation at
Introduction
Improving the bone healing process is of high clinical relevance, for example, for non-union fractures or critical-size defects. 1 Initiated by Yasuda in the early 1950s, electrical stimulation has been considered a biophysical therapy for bone injuries. However, electrical stimulation has not yet become a standard clinical treatment option for bone regeneration because of insufficient evidence of its effectiveness. 2 It has been hypothesised that conflicting observations are linked to the unknown local electric field and insufficient technical documentation of in vivo experiments. 3 Nonetheless, many studies have reported a positive effect of electric fields on cells in cell culture experiments. 4
A major limitation of most in vitro studies is the absence of a clearly defined electrical stimulation-related objective. Such a goal could be, for instance, a target electric field strength at the site of injury 5 or an induced transmembrane potential (iTMP) deemed sufficient to activate voltage-gated membrane channels. However, clear activation thresholds have not yet been established. As a result, Verma et al., for example, focused on maximising the electric field strength at the injury site, comparing it to field strengths commonly used in neuromodulation, given the limited knowledge of target field strengths for bone healing. 6
Calcium ions (
The membrane channels, which regulate the inflow of
To establish the iTMP that needs to be induced by electrical stimulation to sufficiently depolarise the cells, it is important to know the resting membrane potential. It has been reported to be
Optimising the electrical stimulation parameters with respect to the iTMP is not straightforward. An analytical expression can be used to estimate the iTMP for a spherical cell in a spatially homogeneous electric field (as, e.g. generated by a parallel-plate capacitor). 26 These assumptions generally do not hold true for in vitro electrical stimulation with adherent cells. 27 Instead, numerical methods must be used to obtain a reliable estimate of the extracellular field 28 and compute the iTMP based on realistic cell geometries. 29 The numerical models can account for mild electrochemical reactions but must be continuously calibrated by impedance measurements.30,31 This approach can be considered a digital twin because a validated model is updated by monitoring data to yield reliable predictions of the electric field, thereby enabling direct control of the electrical stimulation experiment. However, the digital twin workflow is not applicable in the presence of strong, irreversible electrochemical reactions, which can occur during DC stimulation. 28
In recent years, various stimulation devices have been proposed. A stimulation chamber originally designed to promote osteogenic differentiation
32
has become a popular choice for electrical stimulation in 6-well plates due to its simple and reproducible fabrication.28,31,33–35 It supports stimulation with both DC and alternating current (AC) signals. There is no consensus on an optimal frequency for bone healing via electrical stimulation. Reported frequencies range from a few Hz to
Therefore, we have investigated the underlying biological mechanisms by examining the immediate effect of solely electrical stimulation on osteoblast-like MG-63 cells in this work. We focused on the well-accepted hypothesis that immediate calcium events are triggered by the electrical stimulation when the iTMP is sufficiently large. We have employed MG-63 osteoblasts due to their well-characterised calcium responses and reproducible resting membrane potentials. This stability allowed us to define induced transmembrane potentials (
We have integrated the aforementioned stimulation chamber with live-cell imaging of intracellular
Materials and methods
Cell culture
Osteoblast-like cells, MG-63 (CRL1427™, ATCC), were cultured under standard cell culture conditions at
Staining and live-cell imaging
After cell adhesion, the intracellular
After incubation, the cells were washed with phosphate-buffered saline and covered with
The samples were directly put under the live-cell imaging incubator hood at
During the image acquisition of unstimulated controls, the electrodes were still in contact with the cell culture media. Electrical stimulation, hydrogen peroxide (
For the simulation of the iTMP at a cellular scale, 3D images of the cells were required. To obtain these images, MG-63 cells were stained with the red fluorescent cell linker PKH26 (Sigma-Aldrich, Merck KGaA) following the manufacturer’s protocol. Afterwards, the cells were seeded into six-well glass-bottom plates (Cellvis, Mountain View, USA) and incubated for two hours. Following adhesion, the cells were stained with Hoechst H33342
pH and hydrogen peroxide measurement
pH was measured before and after electrical stimulation using a MicroFET pH Probe (Sentron Europe BV). For this, 100µL of medium was collected from three distinct spots (cathode, centre, anode) immediately after 5 min DC stimulation.
Electrical stimulation
Direct contact electrical stimulation was applied through a stimulation chamber consisting of six L-shaped platinum electrode pairs, which can be inserted into a six-well plate.31,32 The entire setup is seen in Figure 1. The electrodes are submerged in the cell culture media with the horizontal part just above the bottom of a well. Each electrode pair was connected to a circuit board to connect and stimulate each well individually. A function generator (
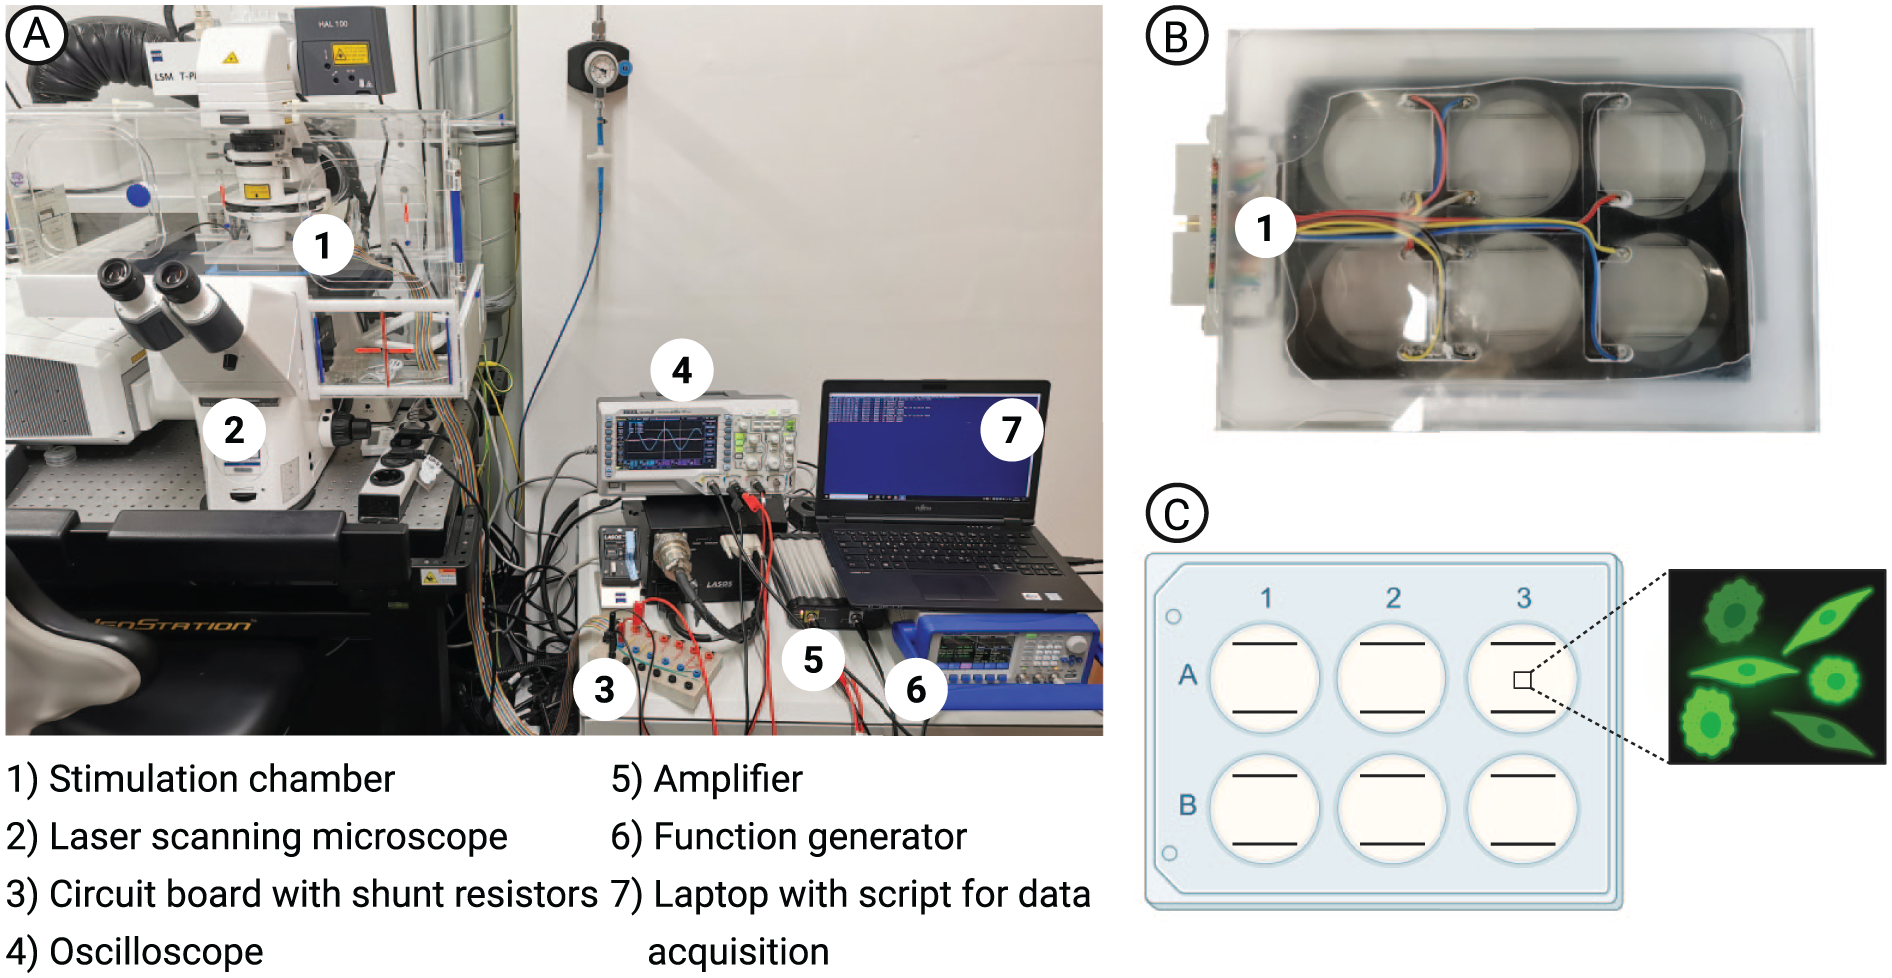
Overview of the electrical stimulation setup. (A) Stimulation set up under the microscope. (B) Stimulation chamber (top view) with two L-shaped platinum wires in each well (diameter: 1 mm, distance: 26 mm, horizontal length: 22 mm, vertical length:
Data analysis of calcium levels
To ensure standardised analysis of the fluorescence signals from individual cells over time, the pre-trained deep learning segmentation algorithm Cellpose (v.3.1.1.1) with cyto3 model 39 was utilised. The segmentations were then manually reviewed and adjusted as necessary to separate touching cells or to merge fragmented regions of the same cell into a single object (see Figure 2). Manual corrections were performed using Napari (v.0.5.6). 40 Subsequently, cell segmentation masks were linked across time points using u-segment3D (v.0.1.1). 41 In this way, 2D masks belonging to the same cell had the same index at all time points.

Data processing steps. Workflow for automated segmentation and cell tracking mask for fluorescence analysis. The video was segmented frame-by-frame using the Cellpose3 model. Manual correction was occasionally required due to unclear boundaries between touching cells and irregular cell shapes. Quantitative evaluation of the Cellpose3 model using manually corrected masks as ground truth yielded an accuracy of
The fluorescence intensity data obtained from this semi-automated image analysis pipeline were then processed using R (v.4.4.1) 42 and RStudio (2024.04.2, Posit Software). In the R script, the fluorescence intensities of each recording were normalised first. Debleaching was not necessary. Next, the maximum peak of a Gaussian kernel density estimate of the intensity values over time was calculated for each individual cell to serve as the threshold for peak detection. The detected peaks were then analysed to determine their widths and intensities. The R script is available in our data repository. Figure 2 shows an example of this data analysis.
Accelerating and improving segmentation in calcium imaging with deep learning
To support future automation and reduce the need for manual corrections, we trained a dedicated segmentation model using the InstanSeg framework,
43
with manually corrected masks serving as the ground truth. A total of
Statistical analysis
The output from the single-cell calcium analysis script was imported into a separate R script. Data from all experiments were combined into a single table, with each entry annotated according to the respective experimental conditions. The output from the single-cell calcium analysis script was imported into a dedicated R script for further evaluation. For each oscillating cell, we analysed calcium signal characteristics – including number, intensity, duration, and frequency of the peaks – by comparing the same cell during the initial unstimulated period (first three minutes) with the equivalent time interval during subsequent control or stimulation phase. This cell-wise comparison allowed us to precisely evaluate potential effects of electrical stimulation on occasionally occurring spontaneous oscillations. Statistical analyses were performed using the Kruskal-Wallis test for non-normally distributed samples, followed by Dunn’s test for multiple comparisons, with p-values adjusted for multiple testing using the Bonferroni method. The same tests were used to analyse the chemical stimulations.
Construction of the image-based digital twin
To monitor and control the electrical stimulation, we further advanced the methodology proposed in our earlier research. 28 The digital twin construction process involved the following preparatory steps prior to simulation:
Electrochemical characterisation of the stimulation setup using electrochemical impedance spectroscopy (EIS).
Extraction of equivalent circuit parameters by fitting the impedance data with ImpedanceFitter. 44 Some parameters are related to the electrochemical interface, while others can be directly attributed to the electrode geometry and conductivity of the cell culture medium.
Validation of the macroscopic numerical model of the chamber by comparing the numerically estimated medium resistance with the resistance values obtained from EIS measurements.
Acquisition of fluorescent confocal images of the cells in the chamber.
Generation of a finite element mesh from the 3D images.
During the electrical stimulation, the following steps were carried out:
Recording the applied current and voltage.
Comparison of measured and predicted current from the impedance model using the parameters obtained before stimulation for quality control.
Calculation of the voltage drop across the culture medium, which is used as a boundary condition for the macroscale numerical model.
Extraction of the electric potentials on the boundaries of the microscope field of view, which is used as a boundary condition in the cell-scale model.
Calculation of the electric field distribution and the iTMP in the cell-scale model.
Adjustment of the applied voltage or current to reach a desired iTMP or local electric field.
Electrochemical impedance spectroscopy
We conducted EIS without cells, as previous work demonstrated no detectable difference between the impedance spectrum with or without cells.
28
All six wells were filled with
The conductivity of the cell culture medium FluoroBrite DMEM at 37°C was determined by measuring the impedance with the BDS1309 sample cell and the NEISYS potentiostat (Novocontrol, Montabaur, Germany). The impedance spectra were fitted to an equivalent circuit model comprising a constant-phase element in series with a resistor and analysed using the open-source package ImpedanceFitter. 44 The conductivity was computed from the fitted resistance using the known cell constant of the BDS1309 measurement chamber.
Electric field simulation
The electro-quasistatic field equation

was solved, where
Equation (1) was solved using the finite element method (FEM) with second-order curved elements in the open-source software NGSolve. 46
We adopted the macro-scale model of the stimulation chamber described by Zimmermann et al. and its associated uncertainty quantification to account for the impact of input parameter uncertainties on the numerical results. In this model, the geometry consists of a single domain (the medium), therefore, solving Laplace’s equation is sufficient. The only modification was the use of
At the micro-scale, two modelling approaches were considered. The single-shell model includes only the cell and its membrane, whereas the double-shell model comprises cytoplasm, cell membrane, nuclear envelope, and nucleoplasm. As the cell membrane (thickness:
The dielectric properties used in the model are summarised in Supplemental Table S3. Values for the membrane, cytoplasm, nuclear envelope, nucleoplasm, and extracellular medium were taken from the literature. 48 The conductivity of the extracellular medium σ = 1.892 S/m was derived from impedance spectroscopy measurements at 37°C.
To ensure mesh convergence, we applied adaptive mesh refinement to the base cellular geometry using the Zienkiewicz-Zhu error estimator.
49
The refinement process was performed until the relative difference in the magnitude and phase of the impedance fell below
The iTMP was evaluated as

where
As equation (1) is a linear partial differential equation, the iTMP, electric field, and current scale linearly with the applied voltage difference

where
To validate the macroscopic model, the resistance

and compared with experimental measurements.
28
Here,
The numerical computations were performed using a workstation equipped with Intel Xeon CPUs (24 cores total) and
Mesh creation from 3D fluorescent images
The simulation of the iTMP at a cellular scale was achieved using 3D images of the cells. We designed an automated process for image segmentation and mesh generation to enable fine-grained numerical simulations of cells (Figure 3(A)). First, the pre-trained deep learning segmentation algorithm Cellpose (cyto model) 50 was used to segment each slice of the z-stack images individually. Next, 3D consensus cell segmentations were generated from the 2D segmented stacks using u-segment3D. 41 Cellpose segmented the weak intensity signals which did not belong to the cells. This resulted in oversized segmentations. To correct these, an additional 3D Otsu-foreground mask was applied. Further post-processing steps were required to enable mesh generation. This included removing border-touching cells and converting background pixels from intensity zero to intensity one, thereby treating the background as a single object. The cell regions were then relabelled using consecutive integer values starting from two. Padding the image with layers of zero intensity created an artificial background that framed the cells and ensured correct meshing of the bounding box by the CGAL algorithm. 51 We used CGAL to generate a surface mesh from a 3D labelled image, where each voxel was assigned a label corresponding to the object it represented (e.g. cell or nucleus). This resulted in a multi-domain geometry, with each subdomain representing an individual cell. Finally, a finite volume mesh was generated from the CGAL surface mesh using Netgen (v.6.2.2406). 52

Automated process for image segmentation and mesh generation. (A) Workflow for generating the mesh shown in Panel (C). The z-stack images were segmented slice-by-slice using Cellpose.
50
The segmented slices were reconstructed into a 3D image and then combined with an Otsu-based
53
foreground mask. Post-processing involved cleaning the 3D volume by removing edge-touching cells and padding, which was then used for mesh generation. (B) Comparison of mesh generation using CGAL (v.6.0.1)
51
with and without polyline features. Enabling polylines improves boundary precision. (C) From left to right: 3D view of the original image, the Cellpose segmentation, its combination with the Otsu-foreground mask, and the final mesh. (D) Illustration of the importance of using Otsu-foreground masks, especially in the uppermost slices of the z-stack. The enhanced-brightness image was used solely for visualisation purposes to illustrate how Cellpose performs predictions and was not utilised for segmentation. The length of the scale bar is
Nuclei were optionally incorporated into the geometric model by merging 3D cell and nuclear label images, based on two criteria: (1) a nucleus was considered valid only if its voxels were fully enclosed within a single cell, and (2) cells were retained only if they contained at least one valid nucleus. Each cell and its corresponding nucleus were then assigned identical labels to facilitate the assignment of material properties. See the example in Figure 3, where no cells were removed.
Results
Establishing the digital twin of the stimulation chamber
The digital twin of the stimulation chamber at the macroscale was established in two steps. First, the conductivity of the cell culture medium was measured, and it was verified whether the macroscale model correctly predicted the resistance of the cell culture medium. Second, it was assessed whether the equivalent circuit could accurately predict the measured current.
The EIS spectra of the medium were obtained in a separate measurement chamber for liquid samples, and the conductivity was calculated from the fitted resistance to be
Next, we included the electrochemical interface impedance by considering the parametric equivalent circuit model calibrated by EIS. Furthermore, we added the shunt resistor, which was not present in the EIS measurements, to this model. We evaluated this parametric model at
The established digital twin enabled us to reliably estimate the voltage drop across the medium (excluding the electrochemical interface layer) at 1 kHz and 100 kHz (Supplemental Table S5 and Figure 4). The mean and standard deviation of the predicted voltage drop were computed from repeated measurements at each measurement condition to define boundary conditions for the macroscale numerical simulations (see Supplemental Table S5 and Supplemental Figure S3). The electric field strength in the centre of the well is approximately

Electrical stimulation during calcium imaging using alternating current. (A) Input voltage measurements and calculated voltage drop across the medium during stimulation with

Results of macroscale and microscale numerical simulations at
The successfully established digital twin is only valid for AC stimulations. DC stimulation can cause strong electrochemical reactions, which lead to a time-dependent change in the current response. Therefore, we measured the current amplitude over a time of five minutes while maintaining a constant voltage (Supplemental Table S6 and Supplemental Figure S2(B)). When applying 3 V and 5V, a significant decrease in current was observed after one minute, indicating electrochemical reactions at the electrode-electrolyte interface. After one minute, the current level reached a steady state, but the steady-state current varied considerably between different wells. This indicates that the underlying electrochemical reactions cannot be reliably described by the equivalent circuit model used for the DC case, and that a different modelling approach would be required to establish a digital twin. To estimate the voltage drop across the medium, we assumed that the medium resistance remains constant under DC stimulation and applied Ohm’s law. For each voltage condition (at 3V and 5V), the voltage drop across the medium was calculated at the beginning of the experiment and after the current had reached steady state. As in the AC case, the mean and standard deviation of the calculated voltage drops were determined from repeated measurements (see Supplemental Table S6). These values were used as boundary conditions in subsequent macroscopic numerical simulations (see Supplemental Table S6). The electric field in the centre of the well depended nonlinearly on the applied DC voltage. At
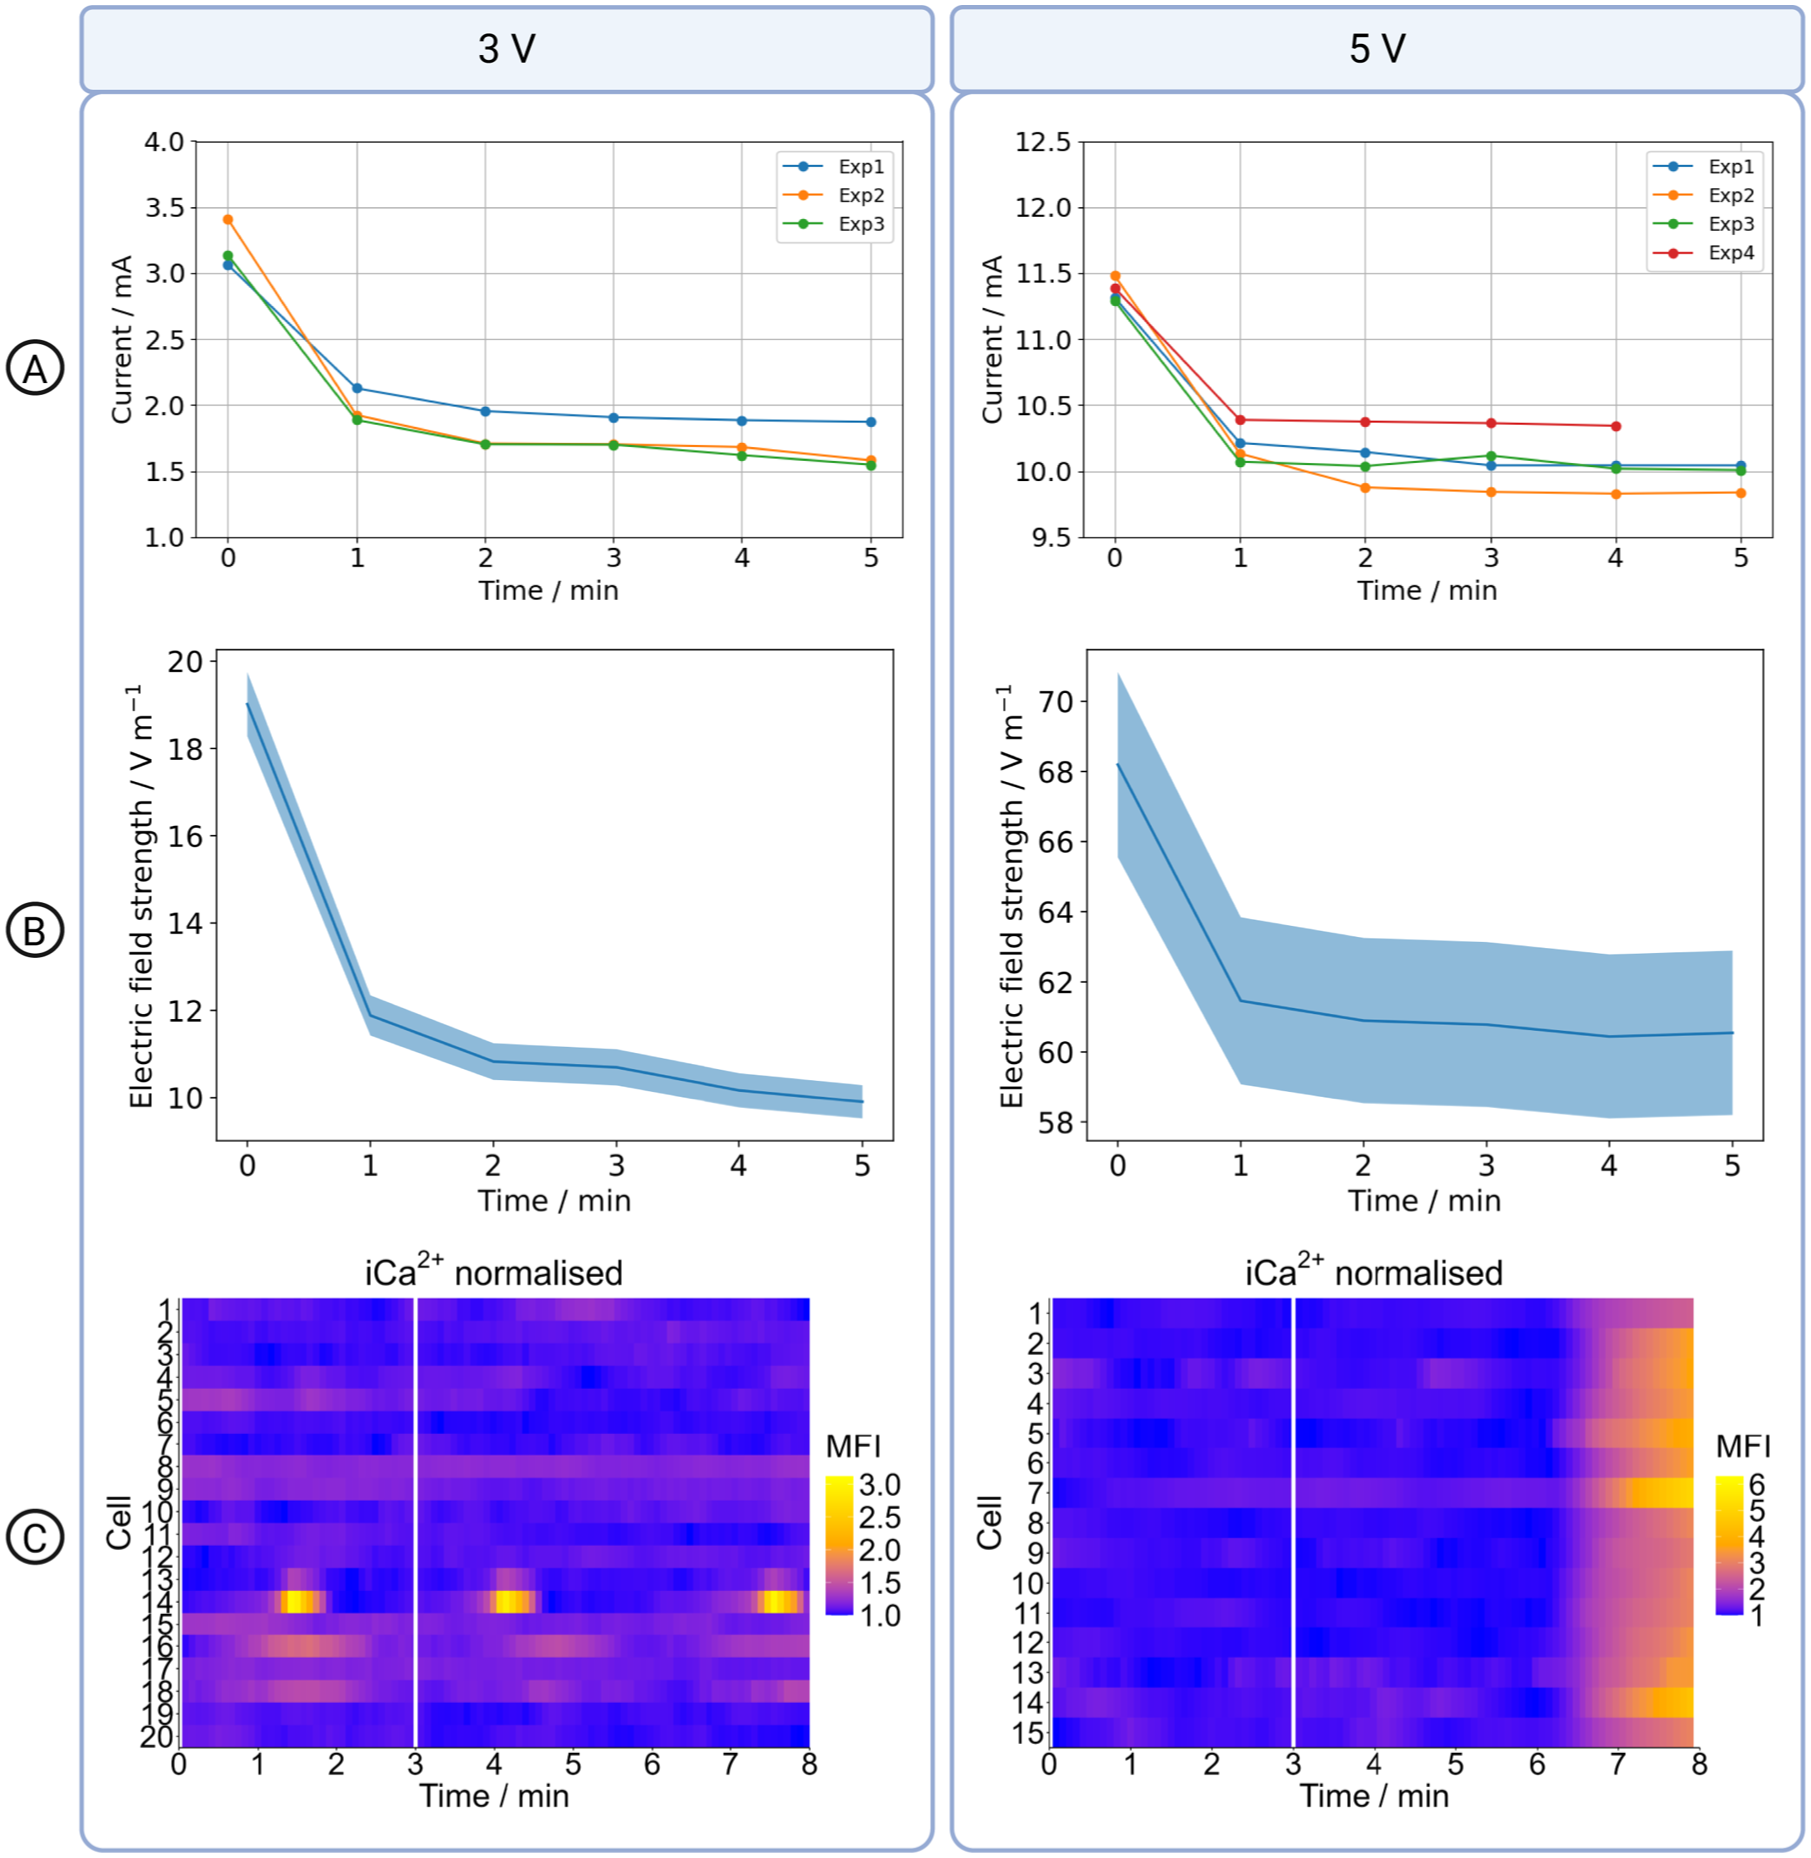
Electrical stimulation during calcium imaging using DC. (A) Current in the medium during stimulation experiments with 3V and 5V, respectively. (B) Simulated electric field strength in the medium. The mean is shown as a solid line. The shaded area represents the prediction interval. (C) Intracellular
Estimating the induced transmembrane potential
The electric field in the cell culture medium is reliably computed in the macroscale numerical model. To connect this model to the cellular scale, we pursued a multiscale approach. We assumed that the cells perturb the electric field only locally. Because the cells are seeded sparsely on the bottom of the well, we assumed that the electric potential at the outer edges of the microscope’s field of view is independent of the presence of the cells. Accordingly, we extracted the solution of the macroscale numerical model on these surfaces and imposed it as a Dirichlet boundary condition in the cell-scale model based on the dimensions of the imaged z-stack.
Three z-stacks of MG-63 cells located at the centre of the well were segmented. These z-stacks were acquired prior to the stimulation experiments. Each 3D-image has a width of
We evaluated the simulations with and without modelling the cell nucleus under DC stimulation, as well as under AC stimulation at
Based on the baseline simulations, both models, that is, with and without nuclei, produced virtually identical iTMP and impedances across all conditions. Nonetheless, we always included the nucleus, as it provides a more detailed understanding of the electric field distribution within individual cells. For example, under a
In any case, the extracellular field reaches significantly higher values, up to
Using an applied voltage of
Comparison of voltage drop and iTMP.

Intracellular
oscillations without electrical stimulation
We tested the normal calcium dynamics in the absence of electrical stimulation but in the presence of the electrodes. The MG-63 osteoblasts were stained with a calcium-sensitive dye and imaged for eight minutes. Using the manually corrected masks as ground truth, we evaluated cell-tracking segmentation and found that the Cellpose3 model achieved an accuracy of
Intracellular
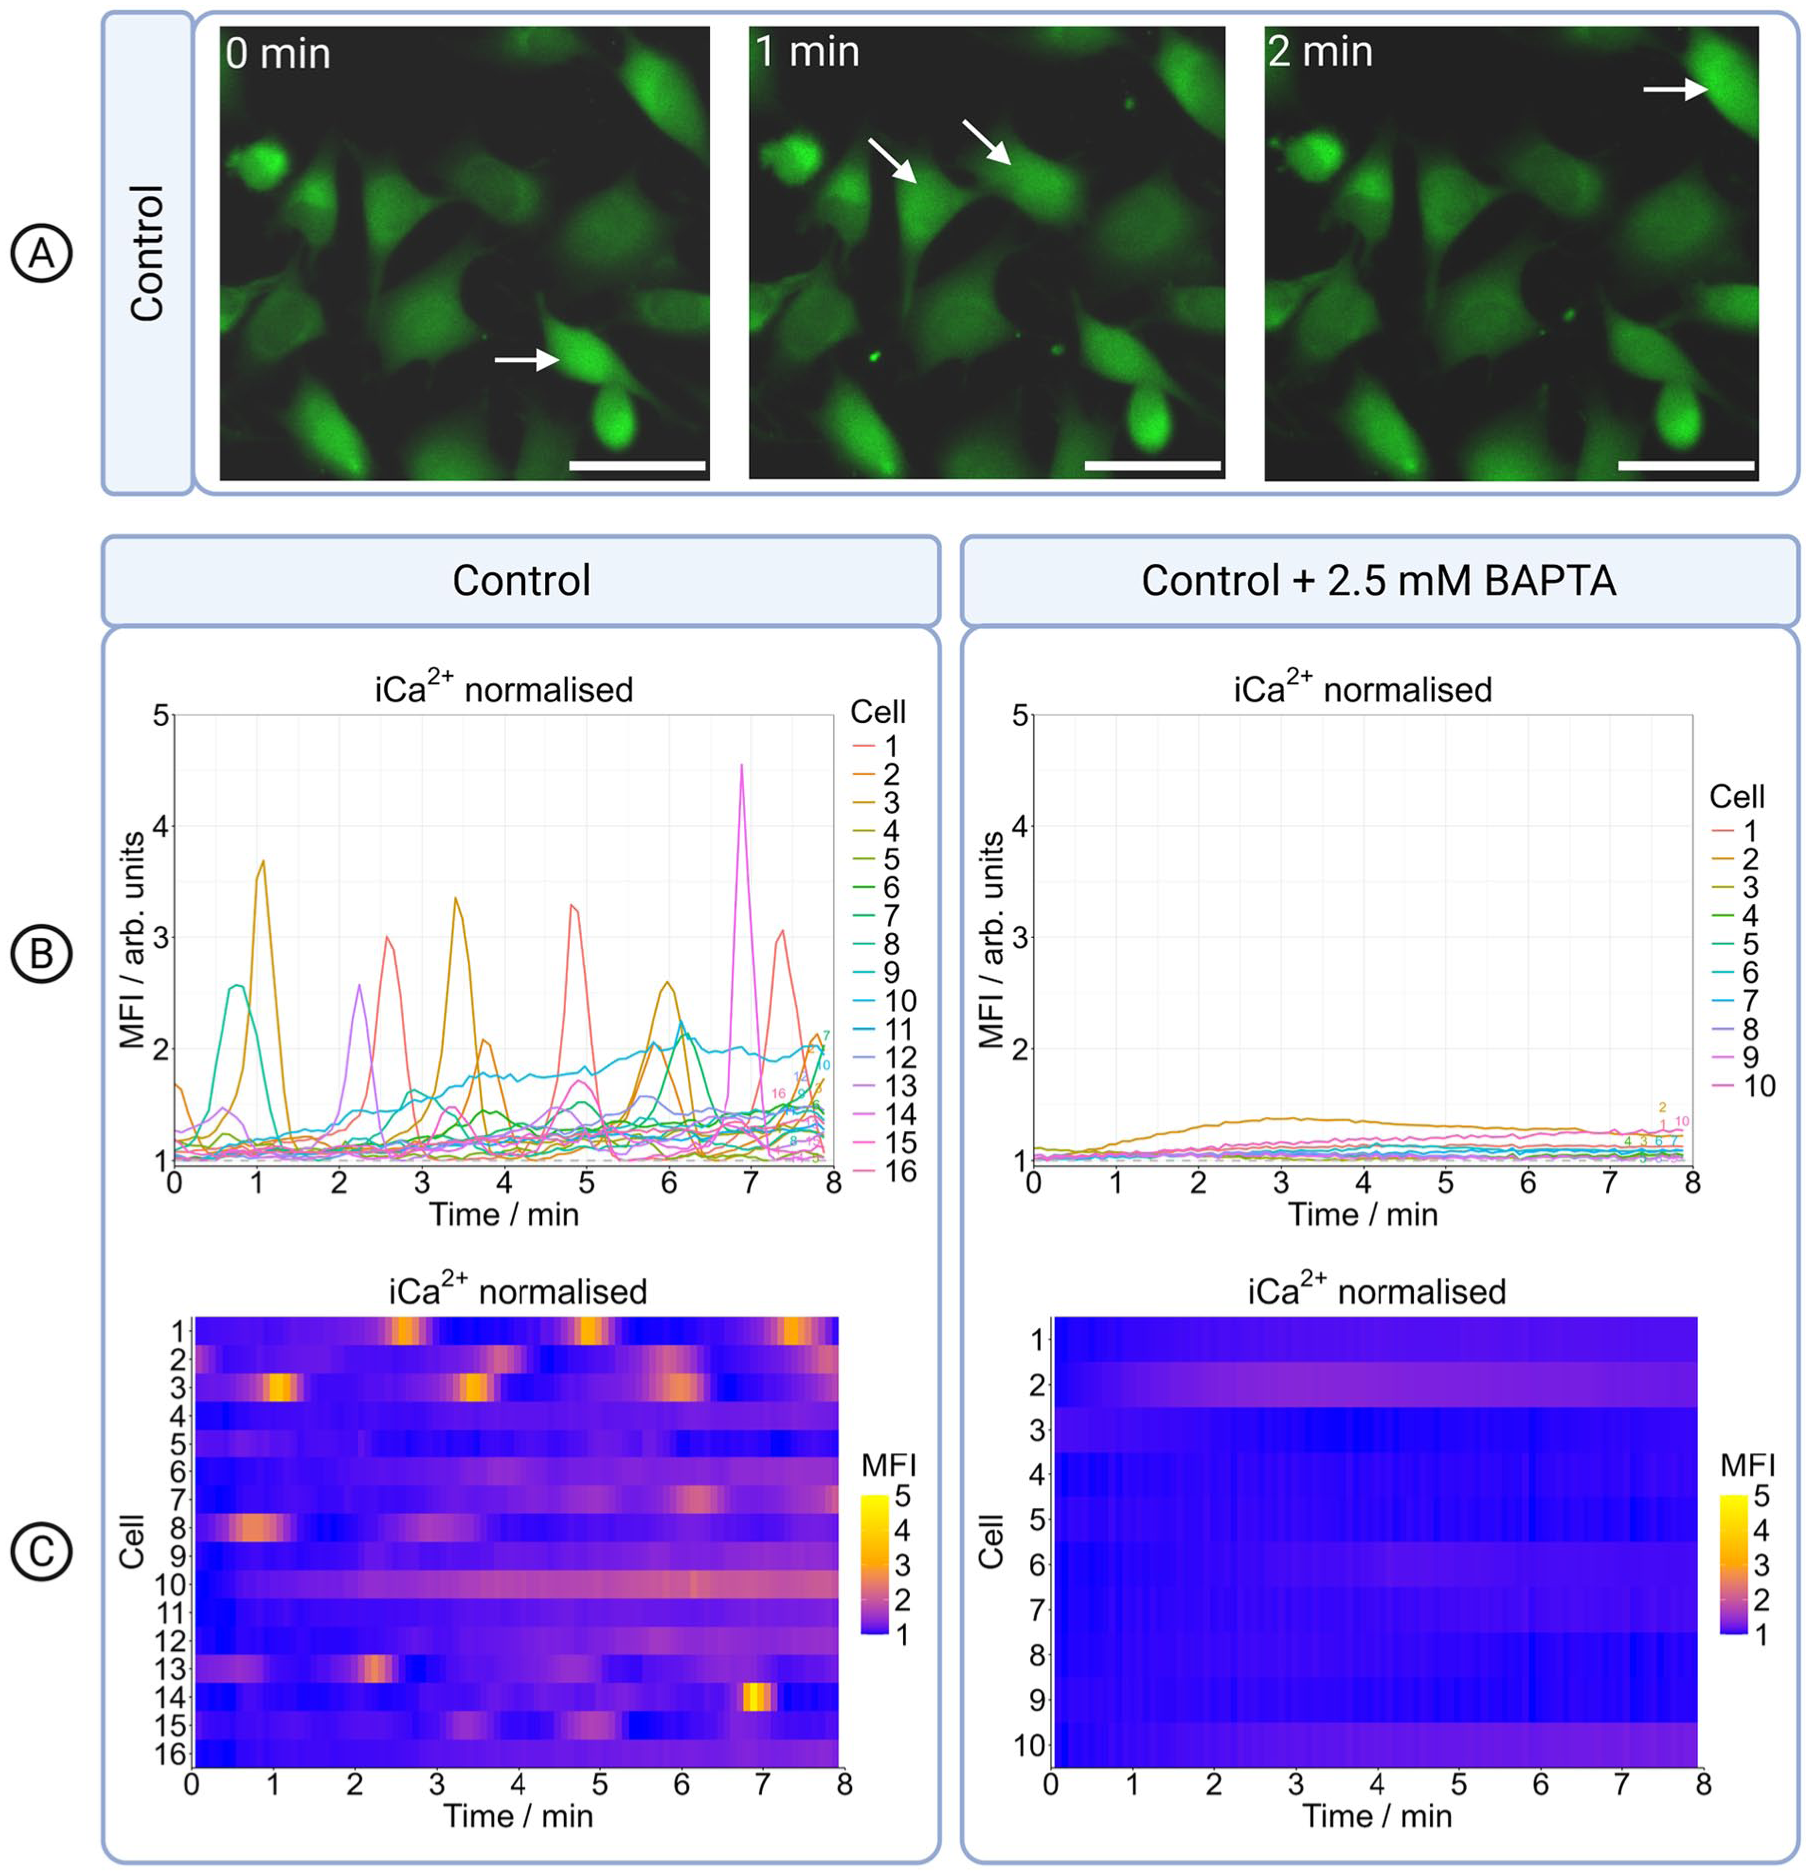
Intracellular calcium ion oscillations in control cells. (A) Time series of live-cell imaging showing intracellular
Analysis of intracellular

Median with interquartile range in
To examine the origin of the intracellular
Intracellular
levels during AC electrical stimulation
We applied sinusoidal waves with an amplitude of
We did not detect a significant effect of the stimulation on the intracellular
Influence of DC electrical stimulation on intracellular
levels
We could not observe an effect of AC stimulation with sinusoidal waves in the kilohertz range on intracellular
The applied voltage of 5V resulted in an initial iTMP of

Time series of live-cell imaging showing intracellular
Discussion
Electrical stimulation has been considered for bone regeneration for more than 60 years.
3
Despite these research efforts, electrical stimulation has not yet found widespread application in the clinical treatment of bone fractures and non-unions. Two reasons have contributed to this situation: (1) the underlying biological mechanisms of interaction remain poorly understood; and (2) limited documentation of electrical stimulation experiments has hampered retrospective analyses. As a result, various stimulation approaches have been successfully tested in vitro and small animal models in vivo, but a reliable translation to clinical stimulation devices remains elusive.3,6 Knowing the exact mechanism of interaction and required stimulation parameters to trigger this mechanism would pave the way for rationally designed stimulation protocols. Currently, two approaches are being pursued separately to reveal the exact effect of electrical stimulation. (1) Numerical models are used to estimate the electric field cells are exposed to,6,28,34 and more detailed models allow estimation of single-cell stimulation target values such as the iTMP.29,56 (2) Wet-lab experiments have employed channel blockers
57
and live-cell imaging8,10,54 to assess the effects of electrical stimulation on intracellular
Digital twin framework
It has been shown that estimates of the stimulating electric field in the literature are often drastically overestimated due to inappropriate or inaccurate model assumptions.27,28,58 Furthermore, the electrochemical interface of the electrode must be taken into account, making an experimental calibration of the numerical method essential.28,30 The combination of experimental and numerical methods is commonly referred to as the digital twin approach and has provided reliable estimates of the actual field strength experienced by the cells. In this work, we extended this approach by integrating a model of the effect of electrical stimulation at the cellular scale. The macroscale model determined the boundary conditions for a selected sub-volume containing cells. We defined this sub-volume as the field of view of a 3D fluorescent image of cells with stained membranes and nuclei.
The digital twin should react adaptively to input data. Thus, we aimed to automate the creation of the numerical model from fluorescent microscopy images. The first step is instance segmentation to identify individual cells and nuclei. The pre-trained deep learning segmentation model Cellpose, combined with advanced classical image processing techniques, enabled automated and accurate segmentation. Retraining the deep learning model was not required for our dataset. However, since deep learning segmentation models have been shown to generalise well on fluorescence microscopy data, 39 we expect our approach to be readily translatable to images of other cell types. This automated workflow enables fast model generation and is compatible with live-cell imaging experiments. Generating a numerical model from the 3D image and computing the corresponding electric field required approximately ten minutes on a workstation for our specific dataset. Thus, future studies may go beyond retrospective analysis and build as well as calibrate the multiscale digital twin during the stimulation session. This would pave the way for real-time control of electrical stimulation and adaptive adjustment of stimulation parameters based on live-cell imaging data. To substantially reduce computational load and minimise manual post-processing effort in the segmentation of calcium imaging data, we explored the novel deep learning InstanSeg model. 43 On our dataset, InstanSeg demonstrated a significantly faster inference time, approximately 0.2 seconds per slice, compared to 3.4 seconds for Cellpose3. This speed advantage could enable the application of our workflow on highly motile cells. For the slowly migrating bone cells studied here, this benefit is not critical, but it becomes relevant when stimulating other, more motile cell types.
Combined cytoplasmic and nuclear imaging enables the construction of more complex models. However, we did not observe significant differences in iTMP and impedance between the configurations studied. This suggests that modelling the cell without the nucleus is sufficient to estimate these observables. Nevertheless, the model including the nucleus provides more detailed insights into the electric field distribution within individual cells and may become relevant for other stimulation parameters or more complex cell geometries. Creating a multi-domain mesh enables the assignment of distinct material properties, for example, to individual cells and/or nuclei (see Supplemental Figure S8). This allows the numerical model to incorporate mixed cell populations or data from live/dead assays. 59 Similarly, the digital twin approach is not limited to the osteoblast-like cells investigated in this study.
While the cell culture model and intracellular
Furthermore, microelectrode arrays could be used to measure the local voltage distribution in the presence of cells, which would allow direct comparison with the numerical models. 30 Importantly, the microelectrodes must be compatible with live-cell fluorescence imaging. An indirect validation might be achieved by detecting electrically induced calcium events, synchronised in multiple cells.
Endogenous
oscillations
To separate the effect of electrical stimulation on calcium levels in MG-63 osteoblasts, we first investigated intracellular
We added the calcium chelator BAPTA to elucidate the role of extracellular
MG-63 osteoblastic cells, just like primary osteoblasts, possess gap junctions
67
and are therefore capable of transmitting not only ions such as
Electrical stimulation experiments
We investigated the effect of electrical stimulation on intracellular
To evaluate whether cells can elicit a response, we applied a 5V DC ‘high-intensity’ condition. This extreme stimulation was intended to investigate whether intracellular calcium mobilisation can occur in principle, while acknowledging that such a condition may partially compromise cell viability and does not necessarily reflect physiologically intended responses. DC stimulation with 5V led to an increase in intracellular
Our findings highlight the importance of a comprehensive electrochemical characterisation of electrical stimulation experiments, with particular attention to faradic by-products. In our case, the increase in intracellular
Workflow for adaptive electrical stimulation in cell cultures
We aimed to streamline the calcium imaging analysis pipeline and ensure it can be readily applied to other experimental settings. All image segmentation, intensity measurements, peak visualisation, and statistical analyses were performed using open-source software and are freely accessible. This approach ensures transparency, reproducibility, and broad usability for future studies involving calcium imaging data. We found that InstanSeg, as a segmentation network, performs significantly faster than other deep learning networks. Training it on segmentation masks from our dataset yielded high accuracy. Thanks to its speed and precision, InstanSeg may enable real-time analysis, thereby helping to close the digital twin loop – for example, by adapting electrical stimulation in response to detected calcium events. We propose a three-phase workflow for developing and implementing a digital twin model for cell culture systems (Supplemental Figure S9). Phase one involves data acquisition and characterisation of the stimulation setup and cell culture conditions using EIS and voltage/current measurements to assess electrode properties. 3D imaging and morphology analysis of cellular and tissue architecture are integrated into the digital twin. Phase two focuses on parameter extraction, model calibration, and optimisation of the digital twin model. Phase 3 envisions real-time operation and closed-loop control, integrating live-cell imaging and analysis (e.g. calcium dynamics, morphology, cell tracking, and viability assessment) alongside live electrical monitoring of current responses, impedance changes, and boundary conditions. These feedback signals are used to dynamically adapt the digital twin and control stimulation parameters.
Conclusion
We demonstrated a digital twin approach that integrated live-cell imaging, electrical recordings, and numerical models. This approach enabled a rational and systematic analysis and control of the applied electric field and of the resulting induced transmembrane potential in MG-63 osteoblasts.
In summary, our results demonstrate that cellular responses to electrical stimulation strongly depend on the underlying electrochemical environment. DC stimulation above a specific threshold triggered electrochemical reactions such as electrolysis, leading to a pH shift that modulated intracellular calcium levels. AC stimulation, which presumingly changed the transmembrane potentials, had no effect on intracellular calcium. This indicates that mere electrical activation with the tested stimulation parameters is insufficient to trigger calcium signalling. In contrast, chemical stimulation by faradic by-products generated during DC stimulation did lead to a pronounced calcium response. Understanding these distinct mechanisms is crucial for the meaningful interpretation of electrostimulation experiments and for designing more targeted and physiologically relevant stimulation strategies. It may also help explain the limited translation of in vitro findings to clinical applications.
Our open-source workflow provides a basis for determining optimal stimulation parameters in a systematic and reproducible manner (see Supplemental Figure S9). It offers the potential to adapt stimulation protocols in real time based on feedback from live-cell imaging.
Supplemental Material
sj-pdf-1-tej-10.1177_20417314251414697 – Supplemental material for Evaluating the electrical stimulation of bone cells based on an induced transmembrane potential model and intracellular calcium levels
Supplemental material, sj-pdf-1-tej-10.1177_20417314251414697 for Evaluating the electrical stimulation of bone cells based on an induced transmembrane potential model and intracellular calcium levels by Meike Bielfeldt, Lam Vien Che, Kai Budde-Sagert, Nils Arbeiter, Susanne Staehlke, Sascha Spors, Ursula van Rienen, Henrike Rebl and Julius Zimmermann in Journal of Tissue Engineering
Footnotes
Acknowledgements
ORCID iDs
Author contributions
M.B.: Conceptualisation, Data curation, Formal analysis, Investigation, Methodology, Visualisation, Writing – original draft; L.V.C.: Data curation, Formal analysis, Investigation, Methodology, Software, Validation, Visualisation, Writing – original draft, Writing – review & editing; K.B.-S.: Data curation, Formal analysis, Methodology, Software, Validation, Visualisation, Writing – original draft, Writing – review & editing; N.A.: Data curation, Formal analysis, Methodology, Validation, Writing – original draft; S.St.: Investigation, Methodology, Writing – original draft; S.Sp.: Funding acquisition, Resources, Supervision, Writing – review & editing; U.v.R.: Funding acquisition, Resources, Supervision, Writing – review & editing; H.R.: Funding acquisition, Investigation, Resources, Supervision, Writing – review & editing; J.Z.: Conceptualisation, Methodology, Software, Supervision, Validation, Writing – original draft.
Funding
The authors disclosed receipt of the following financial support for the research, authorship, and/or publication of this article: This work is funded by the Deutsche Forschungsgemeinschaft (DFG, German Research Foundation) – SFB 1270/2 – 299150580.
Declaration of conflicting interests
The authors declared no potential conflicts of interest with respect to the research, authorship, and/or publication of this article.
Data availability statement
Supplemental material
Supplemental material for this article is available online.
References
Supplementary Material
Please find the following supplemental material available below.
For Open Access articles published under a Creative Commons License, all supplemental material carries the same license as the article it is associated with.
For non-Open Access articles published, all supplemental material carries a non-exclusive license, and permission requests for re-use of supplemental material or any part of supplemental material shall be sent directly to the copyright owner as specified in the copyright notice associated with the article.