
Abstract
By integrating 3D-inkjet bioprinting technology, differentiated human cells can be assembled into artificial lung tissue structure to achieve a rapid, efficient, and reproducible disease model construction process. Here, we developed a novel 3D-inkjet bioprinting-based method to construct artificial lung tissue structure (ALTs) for acute lung injury (ALI) disease modeling, research and application. It can also be used to study the role of relevant cells in the disease by adjusting the cell type and adapted to study the bio-functions of immune cells during the cell-cell interactions. Firstly, a series of process optimizations were done to mass-produce the alginate hydrogel microspheres (Alg) with a particle size of 262.63 ± 5 μm using a 3D bioprinter, then the type I collagen and polydopamine were deposited in turns to construct a cell adhesion layer on the surfaces of Alg (P-Alg) and the particle size was increased to 328.41 ± 3.81 μm. This platform exhibites good stability, timescale-dependent behavior, and long-term cell adhesion. Subsequently, several human cells including endothelial, epithelial, fibroblast, and even immune cells such as macrophages were adhered to P-Alg through rotational culture, leading to cell contractions and aggregation, subsequently formed ALTs or ALTs with macrophages (ALTs@M) with human alveolar-like structure. Finally, we successfully constructed an ALI model with lung barrier damage on ALTs using lipopolysaccharide stimulation in vitro, and comparison of secreted inflammatory factors between ALTs and ALTs@M. Results demonstrated that ALTs@M was more effective than ALTs in stimulating the inflammatory microenvironment of the lungs, providing a novel in vitro model for cellular interactions and human macrophage research. Altogether, this artificial lung tissue structure construction strategy using 3D-inkjet bioprinting technology allowed the flexible development of artificial lung tissue structures as potential disease models for preclinical studies.
Keywords
Introduction
Challenges such as an aging population and air pollution have led to year-on-year increases in the morbidity and mortality of respiratory diseases such as asthma, pneumonia, lung injury, and lung cancer. 1 Traditional methods for evaluating the efficacy of drug candidates generally rely on 2D cell and animal models. However, 2D cell models are unable to simulate the in vivo environment of humans and the animal models differ greatly in physiology from humans, limiting their reliability in predicting clinical outcomes. 2 For example, one significant obstacle in developing treatments for acute lung injury (ALI) is the lack of predictive in vitro models, as 2D cellular and animal models do not faithfully replicate drug-organism interactions in human. 3 Therefore, a main objective in drug development is to construct reliable in vitro disease models for drug assessment.4,5 For example, the alveolar architecture, particularly its grape-like structure, is crucial for efficient gas exchange and lung function. 6 This structure, with highly branched airways and thin, elastic walls, enables effective gas exchange. 7 Replicating this microstructure is essential for disease modeling, particularly in conditions like ALI, where damage to the alveolar structure or air-blood barrier impacts lung function and disease progression. 8
The emergence of cutting-edge technologies has greatly contributed to the development of disease modeling and applications, such as organoid and 3D bioprinting technologies.9–11 3D bioprinting technology involves the programmed deposition of prefabricated bioink in a spatially and temporally controlled manner based on predefined CAD software patterns. This technique facilitates the construction of integral 3D structures, providing scaffold support for interactions between endogenous cell-cell and cell-extracellular matrix interactions.12–14 3D bioprinting technology primarily includes extrusion 3D printing, photocuring 3D printing, and inkjet printing. Extrusion 3D printing is widely used for cell encapsulation due to its ability to print high-viscosity bioinks, but its relatively low resolution and limited precision pose challenges for fine-scale tissue engineering. 15 In contrast, photocuring 3D printing offers high resolution, enabling the fabrication of intricate structures. Nevertheless, its reliance on potentially toxic photo-initiators and the difficulty in developing biocompatible materials restrict its use in tissue engineering. 16 Inkjet printing provides high resolution and accuracy, making it an ideal choice for creating detailed structures such as honeycomb patterns, although it requires bioinks with low viscosity. 17 Thus, artificial lung tissue developed with the innovative application of 3D-inkjet bioprinting technology may allows for more accurate disease modeling.18–20 An effective design approach is to simplify the target organ into a single-cell-containing module based on its structural characteristics, then achieve the orderly organization of these modules within a limited 3D space using tissue engineering techniques.21–23 Lee et al. 24 prepared a three-layer airway model through 3D bio-printing, which has a physiologically relevant microstructure and is used to study the infection dynamics of SARS-CoV-2. The model showed clear intercellular junction and mucus secretion, and effectively expressed angiotensin converting enzyme 2 and transmembrane serine protease 2. Kang et al. 25 used on-demand inkjet printing to create a high-resolution, three-layered alveolar barrier model with a thickness of approximately 10 μm. Compared to 2D cultures and non-structured 3D models, this structured 3D model more accurately replicated lung tissue structure, morphology and function of lung. Combined with 3D-inkjet bioprinting, this approach enabled more standardized and engineered organoid preparation processes, improved reproducibility, and fabrication throughput.26–28
The inflammatory response and lung tissue injury underlie the pathogenesis of lung diseases, especially in ALI. During the development of ALI, neutrophils and macrophages accumulate in the lungs, responding to and amplifying the inflammatory cascade, which can lead to extensive pulmonary inflammatory cell infiltration, pulmonary edema, and protein exudation. 29 Mouse models are commonly used for studying lung disease and immune microenvironments, although significant anatomical and physiological differences exist between mice and humans. Therefore, developing more advanced in vitro models containing immune cells help truly revealing the mechanisms of the lung defense system and studying the pathogenesis of lung diseases such as ALI.30–33 For example, Schafer et al. 33 constructed a vascularized immunocompetent human neuroimmune organoid model containing human microglia. Organoid-resident human microglia exhibited human-specific transcriptomic features that closely resemble their counterparts in vivo, and can respond to local injury and systemic inflammatory signals. Zhang et al. 34 constructed a bionic human disease model on a human alveolar microarray, that can reproduce SARS-CoV-2 induced lung injury and immune responses at the organ level in vitro. The results suggested that viral infection leads to increased immune cell recruitment, endothelial detachment, and inflammatory cytokine release, and that immune cells play a critical role in alveolar barrier damage and increased inflammation. Utilizing these cutting-edge methods can effectively study the diversity, development, niche, and function of human immune cells, facilitate exploration of immune cell interactions within the human disease microenvironment, and propose new therapeutic approaches for related diseases.
In this work, we selected 3D-inkjet bioprinting for its high resolution, cell viability, and scalability, making it ideal for modeling lung tissue, simulating cellular interactions in pulmonary disease, and developing in vitro models for ALI and immune cell involvement. Therefore, inspired by the anatomical structure of human alveolus, we innovatively manufactured the artificial lung tissue structure (ALTs) by using 3D-inkjet bioprinting technology (Scheme 1). Firstly, we rapidly mass-produced alginate hydrogel (Alg) microspheres with uniform particle size after the extensive process optimization to obtain optimal printing parameters, which were surface-modified with type I collagen and dopamine hydrochloride to create a cell adhesion layer (P-Alg). Subsequently, we cultured the human endothelial cells, epithelial cells, and fibroblasts with P-Alg to construct ALTs and introduced macrophages in ALTs (ALTs@M) through the rotational cultivation method, and constructed an ALI model with pulmonary barrier damage after LPS stimulation in vitro. Finally, we found that the secreted inflammatory factors of ALTs@M were significantly higher than ALTs after LPS induction. The ALTs@M may more effectively mimic the lung microenvironment than ALTs and serve as a human macrophage research model. In summary, the ALTs that we prepared using 3D bioprinting and tissue engineering techniques, exhibited modular characteristics and could be adapted to construct various 3D alveolar models with different cell types, providing a promising platform for disease modeling and drug development.

Schematic illustration of artificial lung tissue structure (ALTs) preparation using 3D bioprinting for acute lung injury (ALI) modeling in vitro.
Materials and methods
Materials
Details of reagents, antibodies, and cells used in the experiment were shown in Supplemental Table S1.
Design of ink-jet printing array diagram
The dot matrix printout of hydrogel microspheres was designed by BioCAD software connected to a 3D bioprinter (RegenHU SA, Z.l. du Vivier 22, CH-1690 Villaz-St-Pierre, Switzerland). The printed arrays were arranged laterally in a circle of 30 mm diameter in a dot matrix with a pitch of 0.5 mm.
Print condition
The morphology and size of Alg microspheres are mainly affected by the following factors: opening time and closing time of the print head (MICROVALVE CF300 ID = 0.15/S-01 JETTINGMVJ-D015S01), nozzte diameter, stroke of the inkjet printing end time of 3D bio-printer, air pressure, needle length, printing distance of Alg droplet, and CaCl2 solution plane. And we systematically optimized these printing parameters to obtain the optimal combination of printing parameters.
Batch preparation, enrichment, and purification of hydrogel microspheres
We prepared 0.5 wt% Alginate (Alg) solution as 200 mg sodium alginate powder was dissolved in 40 mL deionized water, vortexed, and left standing overnight. And 0.5 M CaCl2 solution as 20 mg CaCl2 powder was dissolved in 40 mL deionized water. Alg hydrogel microspheres were prepared by ionic crosslinking between Alg and CaCl2 solution. Firstly, we closed the air inlet pipe and sucked a certain amount of 0.5 wt% Alg solution into the printing tube. Subsequently, we added 40 mL CaCl2 solution into a 100 mm × 20 mm petri dish and placed it directly under the print head. And then opened the air inlet pipe and started printing according to the preset program. At last, the print head should be cleaned with pure water for three times before printing.
The printed Alg microspheres were suctioned from the petri dish and then enriched using a 15 mL centrifuge tube. After the Alg microspheres naturally settled for 10 min, the volume of Alg microspheres in each centrifuge tube was fixed at 2.5 mL and then the supernatant was removed. The Alg microspheres were washed three times with distilled water and subsequently stored at 4°C.
Type I collagen functionalized Alg microspheres (I-Alg) and determination of collagen deposition in amount in I-Alg microspheres
Due to the lack of cell adhesion properties on the surface of Alg microspheres, we used the type I collagen to modified Alg microspheres with the method of Wilkinson et al. 35 In brief, 1 mL type I collagen was aspirated and added to a centrifuge tube containing 2.5 mL of Alg microspheres (type I collagen: Alg microspheres = 1: 2.5 v/v). The mixture was vigorously vortexed for 2 min, and then the mixture was settled naturally at 4°C for 7 days.
To optimize the incubation time of Alg microspheres and type I mouse tail collagen, 100 μL of Alg microspheres and 40 μL of type I collagen were mixed in a microcentrifuge tube and vortexed vigorously for 2 min, then stored at 4°C. One sample was removed each day for seven consecutive days and free type I collagen was aspirated. According to the manufacturer’s instructions, the concentrations of type I collagen were measured using a hydroxyproline (HYP, Solarbio) content assay kit.
Dopamine hydrochloride functionalized I-Alg (P-Alg) microspheres
The surface of I-Alg microspheres was functionalized with dopamine inspired by the adhesive properties of mussels to various wet surfaces.36,37 Firstly, 0.1 g of dopamine hydrochloride powder was dissolved in 50 mL of Tris buffer at pH 8.5 to form a dopamine solution. Subsequently, I-Alg was placed in ice and quickly removed excess type I collagen. And then the dopamine solution was uniformly mixed with I-Alg microspheres for 2 h. After that, the excess dopamine was removed and the microspheres were washed three times with 50 mM Tris-buffer and pure water, respectively. Finally, the P-Alg microspheres were dispersed in the cell culture medium. All of the above operations were conducted in a sterile environment.
Furthermore, to establish the relationship between the volume and quantity of P-Alg microspheres, precise amounts of 1, 4, 6, 8, and 10 μL of P-Alg microspheres were aspirated into a 96-well plate and counted under an inverted fluorescence microscope (Leica Microsystems CMS GmbH Ernst Leitz-Str.17-37, Leica, Germany).
Characterization
The chemical bonds or functional groups changes of microspheres were examined using Fourier transform infrared spectroscopy (FT-IR, Varian 640, Thermo Fisher, USA). The morphological structure and element distribution of Alg microspheres and P-Alg microspheres (pre-treated by freeze-drying method, in Figure 2), and the morphological structure of Alg microspheres, ALTs, and ALTs@M (pre-treated by gradient dehydration, in Figure 5) were observed using scanning electron microscope (SEM, Phenom Pharos G2, Netherlands).
Cell culture
The human bronchial epithelial cells (BEAS-2B), human umbilical vein endothelial cells (HUVEC), human embryonic lung fibroblasts (MRC5), and human monocytes (THP-1) were cultured separately using high sugar Dulbecco’s Modified Eagle’s Medium (DMEM, Gibco), Minimal Essential Medium (MEM, Gibco), and Roswell Park Memorial Institute 1640 (RPMI 1640, Gibco) medium, supplemented with 10% heat inactivated fetal bovine serum, penicillin, and streptomycin in humectant conditions containing 5% CO2 and 95% air at 37°C.
Rotary culture
Rotational cultivation is a crucial step to ensure the uniform adhesion of cells (BEAS-2B, HUVEC, and MRC5 were at the cell number rate of 25: 25: 50) to the surface of P-Alg microspheres. The mixer provided rotational power at a constant speed (30 rpm/min) for 1.5–2 h rotary culture. The P-Alg microspheres and cells were subjected to rotational cultivation using a mixer, and then transferred to the U-shaped plate. The culture medium for the mixture of P-Alg microspheres and cells was replaced daily, and optical imaging was performed regularly.
Preparation of ALTs and ALTs@M
P-Alg microspheres with adherent cells formed ALTs and ALTs@M by self-assembly in a 96-well U-shaped plate. Initially, about 150 of P-Alg microspheres were mixed with 2 × 10⁵ mixed cells with BEAS-2B, HUVEC, and MRC5 were at the cell number rate of 25: 25: 50, or with BEAS-2B, HUVEC, MRC5, and THP-1 were at the cell number rate of 25: 25: 40: 10. The mixture were introduced into the 1.5 mL EP tube continue rotated on the mixer for 1.5 h. Upon completion, the EP tube was settled for 5 min, removed the excess solution, and transferred the 300 μL medium per well with cells and P-Alg microspheres mixture into a 96-well U-shaped plate.
The effect cells and formation mechanism of ALTs
We explored the effector cells contributed to the ALTs contraction by the way of co-cultured cells with P-Alg microspheres. A consistent quantity of P-Alg microspheres were employed for rotational co-culture with individual cell types of BEAS-2B, HUVEC, and MRC5 cells, respectively, and with two cell types of BEAS-2B and HUVEC cells. Meanwhile, we used the MRC5 cells co-cultured with P-Alg microspheres for 5 days, and then treated with non-muscle myosin II inhibitor, blebbistatin (5 and 25 μM) to detected the formation mechanism of ALTs. 38 We observed the ALTs using an inverted fluorescence microscope and the area changes of ALTs were quantified using ImageJ software.
The live/dead staining of ALTs
The proliferation and viability of cells in ALTs at different culture times of 3, 7, and 19 days were determined by live-dead staining kit, respectively. ALTs were washed three times with warm PBS buffer and the live-dead reagent solution (2.5 μL live-dead dye and 250 μL medium) was added and incubated at room temperature for 15 min. After that, the ALTs were washed with warm PBS and obtained by a confocal laser scanning microscope (Leica Microsystems CMS GmbH Ernst Leitz-Str.17–37. Leica, Germany).
Establishment of ALI model with barrier damage based on ALTs and immunofluorescence staining
ALTs@M were prepared as described before After 48h culture, the different concentrations of LPS (6.25, 12.5, 25, 50, and 100 μg/mL) were incubated with ALTs for 48 h. Subsequently, the ALTs were fixed using 4% paraformaldehyde for 30 min, followed treated with 0.2% Triton-X 100 to bore on the cell membranes for 5 min and blocking non-specific antigens with 2% bovine serum albumin (BSA) for 1.5 h. Subsequently, the primary antibodies of CD-31 (1: 500) and Pan-CK (1: 500) were added and incubated with ALTs overnight at 4°C, followed by the addition of 200 μL of secondary antibody working solution and incubated for 1.5 h. Subsequently, the secondary antibodies were removed and DAPI was used labeled the nucleus. Finally, the fluorescence images were observed and obtained using CLSM and the quantification was conducted using ImageJ software.
Immunofluorescence staining of ALTs@M slides
The ALTs and ALTs@M were fixed with 4% paraformaldehyde for 30 min, then gradient dehydration, transparent, paraffin embedded, and sliced. For single antibody labeling, the slides were dewaxing and rehydration, and then incubated with antibodies as mentioned above for immunofluorescence staining.”
For multiple antibody labeling, we used the Opal 3-plex manual detection kit (NEL810001KT, AKOYA Biosciences) to simultaneously mark THP-1, MRC5, and BAES-2B cells in ALTs@M. According to the manufacturer’s instructions, the ALTs@M slides were first processed by slide preparation and epitope retrieval. After that, the ALTs@M slides were repeated processed by the steps of blocking, primary antibody incubation, introduction of HRP, signal amplification, and antibody stripping via microwave treatment, followed by blocking and repeat the subsequent steps until the THP-1 (CD14, 1: 200), MRC5 (Vimentin, 1: 200), and BAES-2B (Pan-CK, 1: 250) were labeled. Subsequently, the CD31 were labeled using the CD31 polyclonal antibody (1: 200), the steps were as described in the part of “Establishment of ALI model with barrier damage based on ALTs and immunofluorescence staining.” Finally, DAPI was used labeled the nucleus and slides sealed using neutral resin. The ALTs@M slices were observed by an automated quantitative pathology imaging system (Vectra 3, PerkinElmer, Waltham, MA, United States).
Quantification and statistical analysis
All data were expressed as mean ± SD, and the differences between the two groups were analyzed for significance (p < 0.05) by t-test or by one-way analysis of variance when more than two groups were compared. All analyses were performed using GraphPad (GraphPad Prism 10, San Diego, CA, United States).
Results
Preparation and optimization of 3D bio-printed hydrogel microspheres
Efficient preparation of Alg microspheres requires a well-designed inkjet printing array. Here, we used BioCAD software integrated with a 3D bioprinter to scientifically design the inkjet printing array. A schematic illustration shows the vertical printing of a 0.5 wt% Alg solution onto the lid of a 100 mm × 20 mm culture dish, with consistent droplet spacing and a regular lattice arrangement (Supplemental Figure S1A). Additionally, the particle size distribution of Alg droplets was statistically analyzed, with an average size of 138.42 ± 0.44 μm (Supplemental Figure S1B).
Subsequently, we optimized the preparation conditions for the printing of Alg microspheres. Considering factors such as instrument safety and the influence of Ca2+ concentrations on subsequent experiments, we established printing parameters as follows. We set up five concentration gradients for Alg (0.25, 0.5, 1, 1.5, and 2 wt%) and CaCl2 (0.5, 1, 2.5, 5, and 7.5 wt%), along with three gas pressure gradients (0.03, 0.05, and 0.07 MPa; Supplemental Table S2). After that, we used different concentrations of CaCl2 for cross-linking and varied the ejection of Alg droplets by adjusting the pressure. Optical images showed that neither adjusting the pressure nor the concentrations of CaCl2 could form spherical microspheres with uniform shape and suitable size when the Alg concentration is 0.25 wt% (Supplemental Figure S2). We observed that hydrogel crosslinking was more likely to form spherical microspheres under low air pressure (Supplemental Figures S2 and S3). When the Alg concentration was increased to 0.5 wt%, the rate of spherical formation increased significantly (Supplemental Figures S3). Meanwhile, results showed that lower pressure (0.03 MPa) could not meet printing requirements due to increased viscosity of Alg at 1 wt% concentration (Supplemental Figures S4). After adjusting the air pressure, 1 wt% Alg could cross-link effectively with any concentrations of Ca2+ and exhibited a homogeneous spherical structure in Alg microspheres. However, Alg droplets could not be printed properly at higher Alg concentrations (1.5 wt%), even at high pressures (0.05 and 0.07 MPa; Supplemental Figures S5A). After exploring Alg and Ca2+ concentrations, we found that 1 wt% Alg and Ca2+ solutions were optimal for this 3D printer. Subsequently, we explored the effect of air pressure on microsphere morphology and size in more detail. By increasing the air pressure range, we found that sphericity and size improved significantly at 0.07 MPa compared with 0.05 MPa (Figure 1(a) and (b)). In addition, we measured the viscosity of Alg solution with different concentrations using a rheometer (AntonPaar MCR 302). At a shear rate of 1/s, 0.25%, 0.5%, and 1.0% wt Alg solution had stickiness below 100 cP, while the 1.5% wt Alg solution had an initial viscosity of 710 cP and showed an inverse relationship with shear rate, making it unsuitable for inkjet printing (Supplemental Figures S5B). After optimization, the size of Alg microspheres with a repeatable size around 260 μm can be achieved to simulate the human alveolus, and the optimal conditions are under an air pressure of 0.07 MPa, the concentration of Alg and Ca2+ was 1 wt%.

Parameter optimization and characterization of 3D printed Alg microspheres. (a) Effect of air pump pressure on the sphericity rate and (b) size of Alg microspheres. (c) Effect of different print spacing on the size of Alg microspheres. (d) Physical pictures of different printhead heights. Effect of different (e) print height, (f) electrical valve opening, and (g) closing times on microsphere size. (h) Image of Alg microspheres under optimal parameter conditions, scale bar = 500 μm. (i) Size distributions of Alg microspheres. (j) The final selection of optimized microsphere printing parameters. Values shown are mean ± SD *p < 0.05. **p < 0.01. ***p < 0.001. ****p < 0.0001, versus Control group; ns indicates no statistical significance.
The printing parameters are likewise critical factors in the morphology and size of the Alg microspheres, including the print spacing, the print height, and the opening and closing times of the electrical valves. The print spacing refers to the distance between individual droplets. As shown in Figure 1(c), we observed that the print spacing significantly affected microsphere size at smaller spacings (0.15 mm), and this effect gradually diminished as the distance increased. In addition, we found that the print spacing also affected the uniformity of Alg microspheres. Therefore, we plan to introduce the standard deviation in the subsequent experiments to evaluate the uniformity of Alg microspheres generated under different parameter conditions to further ensure the validity of the screened results (Supplemental Table S3). Taken together, the 0.25 mm print spacing was considered a superior choice. As shown in Figure 1(d), print height is the distance from droplet generation to its contact with the CaCl2 solution surface. Due to their small size, droplets generated in a single pass are highly susceptible to air resistance, which alters their momentum upon entering the CaCl2 solution and thus influences the cross-linking process. The results showed that the size of the Alg microspheres increased as the print height decreased, down to a minimum of about 270 μm, but it started to increase again as the print height was further decreased (Figure 1(e) and Supplemental Table S4). Therefore, a print height of 40 mm was considered more appropriate in our experiments.
The size of the microspheres decreased significantly as the opening/closing time of the electric valve was continuously shortened (Figure 1(f) and (g)). About 300 ms was determined as the minimum limit of the electric valve closing time, while the minimum limit of the electric valve opening time was 100 ms, which was difficult to achieve in this experiment. When the opening time was shortened to 200 ms, the Alg microspheres began to deform, making them unsuitable for subsequent experiments (Supplemental Figure S6). Thus, based on the standard deviation results for both parameters (Supplemental Table S5 and S6), an electric valve opening time of 250 ms and a closing time of 300 ms were selected as optimal.
Collectively, we obtained the optimized printing parameter with the 1 wt% concentration of Alg solution and CaCl2 solution, 0.07 MPa air pressure, 250 ms electric valve opening time, 300 ms electric valve closing time, 0.25 mm print spacing, and 40 mm print height (Figure 1(j)). We succeeded in efficiently obtaining Alg microspheres with a uniform size of 262.63 ± 5 μm under these parameters (Figure 1(h) and (i)).
Surface functionalization of Alg microspheres
Modifying a cell adhesion layer to the surface of Alg microspheres is essential since it does not possess any cell binding sites. Type I collagen was deposited on the surface of Alg microsphere through simple physical mixing, followed by the addition of a polydopamine layer to enhance adhesion (Figure 2(a)). Results showed that the type I collagen content on the Alg microsphere surface decreased by 39.0% within 1 day, after which it stabilized (Figure 2(b)). In contrast, the type I collagen content in the supernatant increased by 86% within 48 h, then stabilized after a slight additional increase (Figure 2(b)). This result suggested that type I collagen was successfully deposited on the Alg microsphere surface and that a 48h incubation may be sufficient. Subsequently, the FT-IR spectra were used to analyze the characteristic functional groups of Alg, I-Alg, and P-Alg from 3500 to 500 cm−1. As shown in Figure 2(c), Alg microspheres exhibited characteristic infrared absorption peaks at 3416, 1627, 1438, 1078, and 539 cm−1. Similarly, I-Alg and P-Alg microspheres also exhibited signals of –OH in the range of 3400–3200 cm−1, but with significantly enhanced intensity, attributed to the hydroxyl groups in the type I collagen or dopamine structures deposited on the surface of Alg microspheres. P-Alg microspheres exhibited a new benzene ring signal in the range of 1538 to 1288 cm−1 compared to I-Alg microspheres, attributed to the polydopamine layer on the surface of P-Alg microspheres.
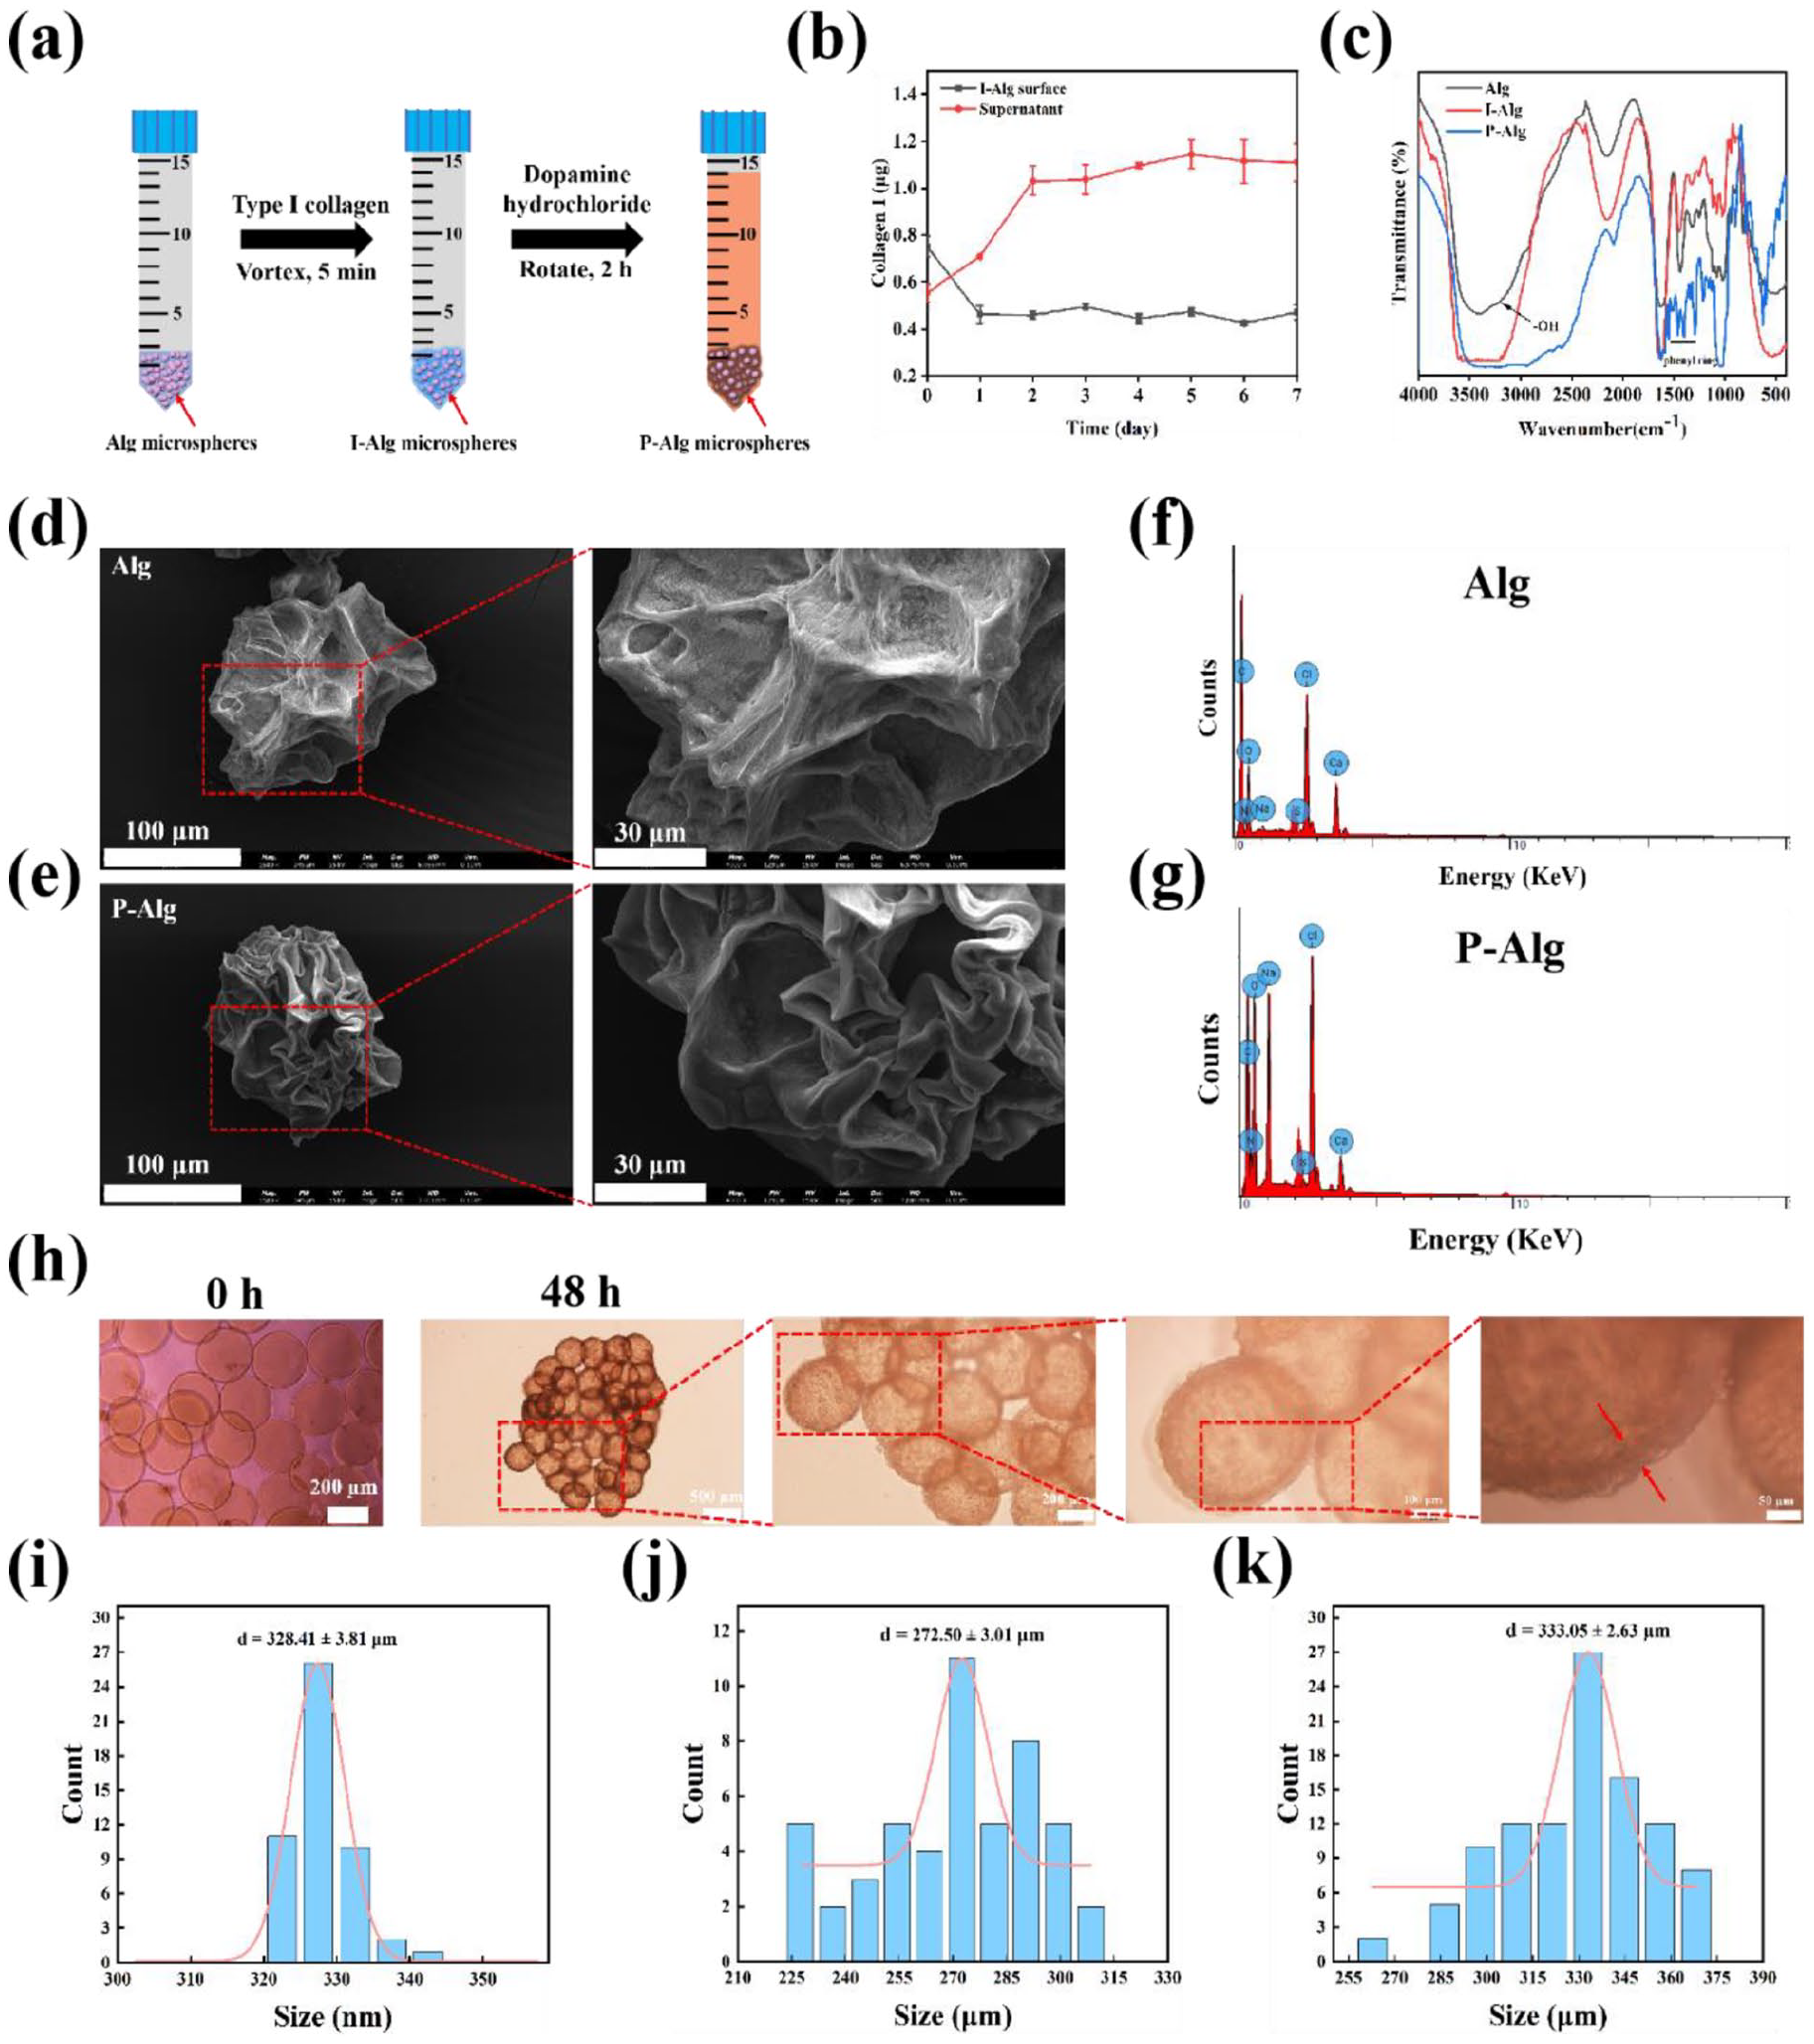
Characterization of Alg and P-Alg microspheres. (a) Preparation process of P-Alg microspheres. (b) Change curves of type I collagen content on the surface of I-Alg microspheres. (c) FT-IR curves of Alg, I-Alg, and P-Alg microspheres. (d) SEM images of Alg microspheres and (e) P-Alg microspheres. (f) Total energy spectrum of Alg microspheres and (g) P-Alg microspheres. (h) Bright field images of ALTs incubated in U-plates for 48 h. (i) Size distributions of P-Alg microspheres. Size distributions of (j) Alg microspheres and (k) P-Alg microspheres after stored for 3 mouths. Values shown are mean ± SD.
Furthermore, the surface morphological differences between Alg and P-Alg microspheres were observed and compared using SEM. As shown in Figure 2(d), Alg microspheres showed significant shrinkage, and dense and disordered granular protrusions appeared on the surface, which may be CaCl2 crystal grains after freeze-drying. In contrast, the P-Alg microspheres also aggravated shrinkage, with a relatively smooth surface and significantly fewer granular protrusions, mainly attributed to the polydopamine layers (Figure 2(f)). The energy dispersive X-ray spectrometer (EDS) showed the elements distribution of Alg and P-Alg microspheres, revealing the presence of elements such as C, O, Na, and Ca (Supplemental Figure S7). The atomic weight percentages and atomic percentages of Alg and P-Alg microspheres are shown in Supplemental Table S7. After modification with type I collagen and polydopamine layers, the weight percentages and atomic percentages of N, O, and Na elements were increased, while Ca element was decreased (Figure 2(e) and (g)).
P-Alg microspheres with mixed cells suspension (BEAS-2B:HUCEV:MRC5 = 1: 1: 2) were co-cultured in U-shaped plates for 48 h and observed by inverted fluorescence microscopy. As shown in Figure 2(h), compared with 0 h, a distinct cell layer formed on the surface of P-Alg microspheres, that formed a clumped alveolus-like structure under the traction and adhesion of cells. In addition, we counted the particle size distribution of newly prepared P-Alg, and its diameter was 328.41 ± 3.81 μm (Figure 2(i)). Subsequently, we examined the stability of Alg and P-Alg microspheres by detecting changes in particle size after storing them at 4°C for 3 months. After 3 months of storage, the Alg microspheres retained their spherical shape, with an average particle size of 272.50 ± 3.01 μm, which was an increase of about 10 μm compared to freshly prepared Alg microspheres, possibly due to the swelling of Alg microspheres caused by water absorption (Figure 2(k) and Supplemental S8(A)). In addition, the increased size of P-Alg was smaller than that of Alg for about 5 μm (from 328.41 ± 3.81 to 333.05 ± 2.63 μm), which was mainly attributed to the dopamine coating (Figure 2(j), 2(l), and Supplemental S8(B)). In summary, the P-Alg microsphere with high stability can be co-cultured with cells to construct functionalized alveolar-like lung tissue ALTs similar to the structure of human alveoli (Supplemental Figure S9).
Construction, characterization, and detection of the contracted mechanism of artificial lung tissue structure (ALTs)
Afterward, we optimized the ratio of P-Alg microspheres to cells. Single-cell suspensions of MRC5 cells, BEAS-2B cells, and HUVEC cells were prepared in a 2: 1: 1 ratio to prepare total cell suspensions. When the total number of cells was 4 × 10⁵ (Supplemental Figure S10(A)) and 3 × 10⁵ (Supplemental Figure S10(B)), the outer layer of cells exhibited high density, resulting in structural breakage and a lack of compactness in the ALTs. In contrast, when the total number of cells was 2 × 10⁵, ALTs with compact structure and regular shape were successfully prepared (Supplemental Figure S10(C)). In addition, increasing the ratio of P-Alg microspheres to cells provided additional space for cell proliferation, reduced the degree of ALTs contraction, and extended cultivation time (Supplemental Figure S11).
To reveal the contraction mechanism of ALTs, we identified the key cells responsible for ALTs contraction. We used the BEAS-2B, HUVEC, and BEAS-2B/HUVEC mixed cells cultured with P-Alg microspheres, respectively. The three groups showed slight contraction, and the edges of the BEAS-2B and HUVEC cell group showed fracture and a tendency to disintegrate, and a relatively complete structure was exhibited in the HUVEC + BEAS-2B cell group (Figure 3(a)). The area of the three groups shrunk into 90.21 ± 3.84%, 82.34 ± 6.00%, and 88.48 ± 3.22% after 1 day, and continued to shrink to 87.44 ± 3.42%, 70.77 ± 5.40%, and 69.84 ± 4.79%, respectively (Figure 3(b)). In contrast, the results showed that the area of the ALTs after adding the MRC5 cells was shrunk significantly to 34.65 ± 1.11% and 31.94 ± 6.64% for 1 and 3 days, respectively (Figure 3(c) and (d)). Notably, MRC5-ALTs (M-ALTs) produced shrinkage behavior with increasing roundness and denseness, suggesting that the shrinkage of ALTs was a self-assembly behavior (Figure 3(d)). Next, we labeled living cells using calcein-AM and labeled dead cells using propidium iodide (PI). The results showed that cells in ALTs exhibited high survival rates in 3 days, but the proportions of dead cells gradually increased with the past of culture time (Supplemental Figure S12-S15). This was mainly attributed to the limited attachment areas of P-Alg microspheres.
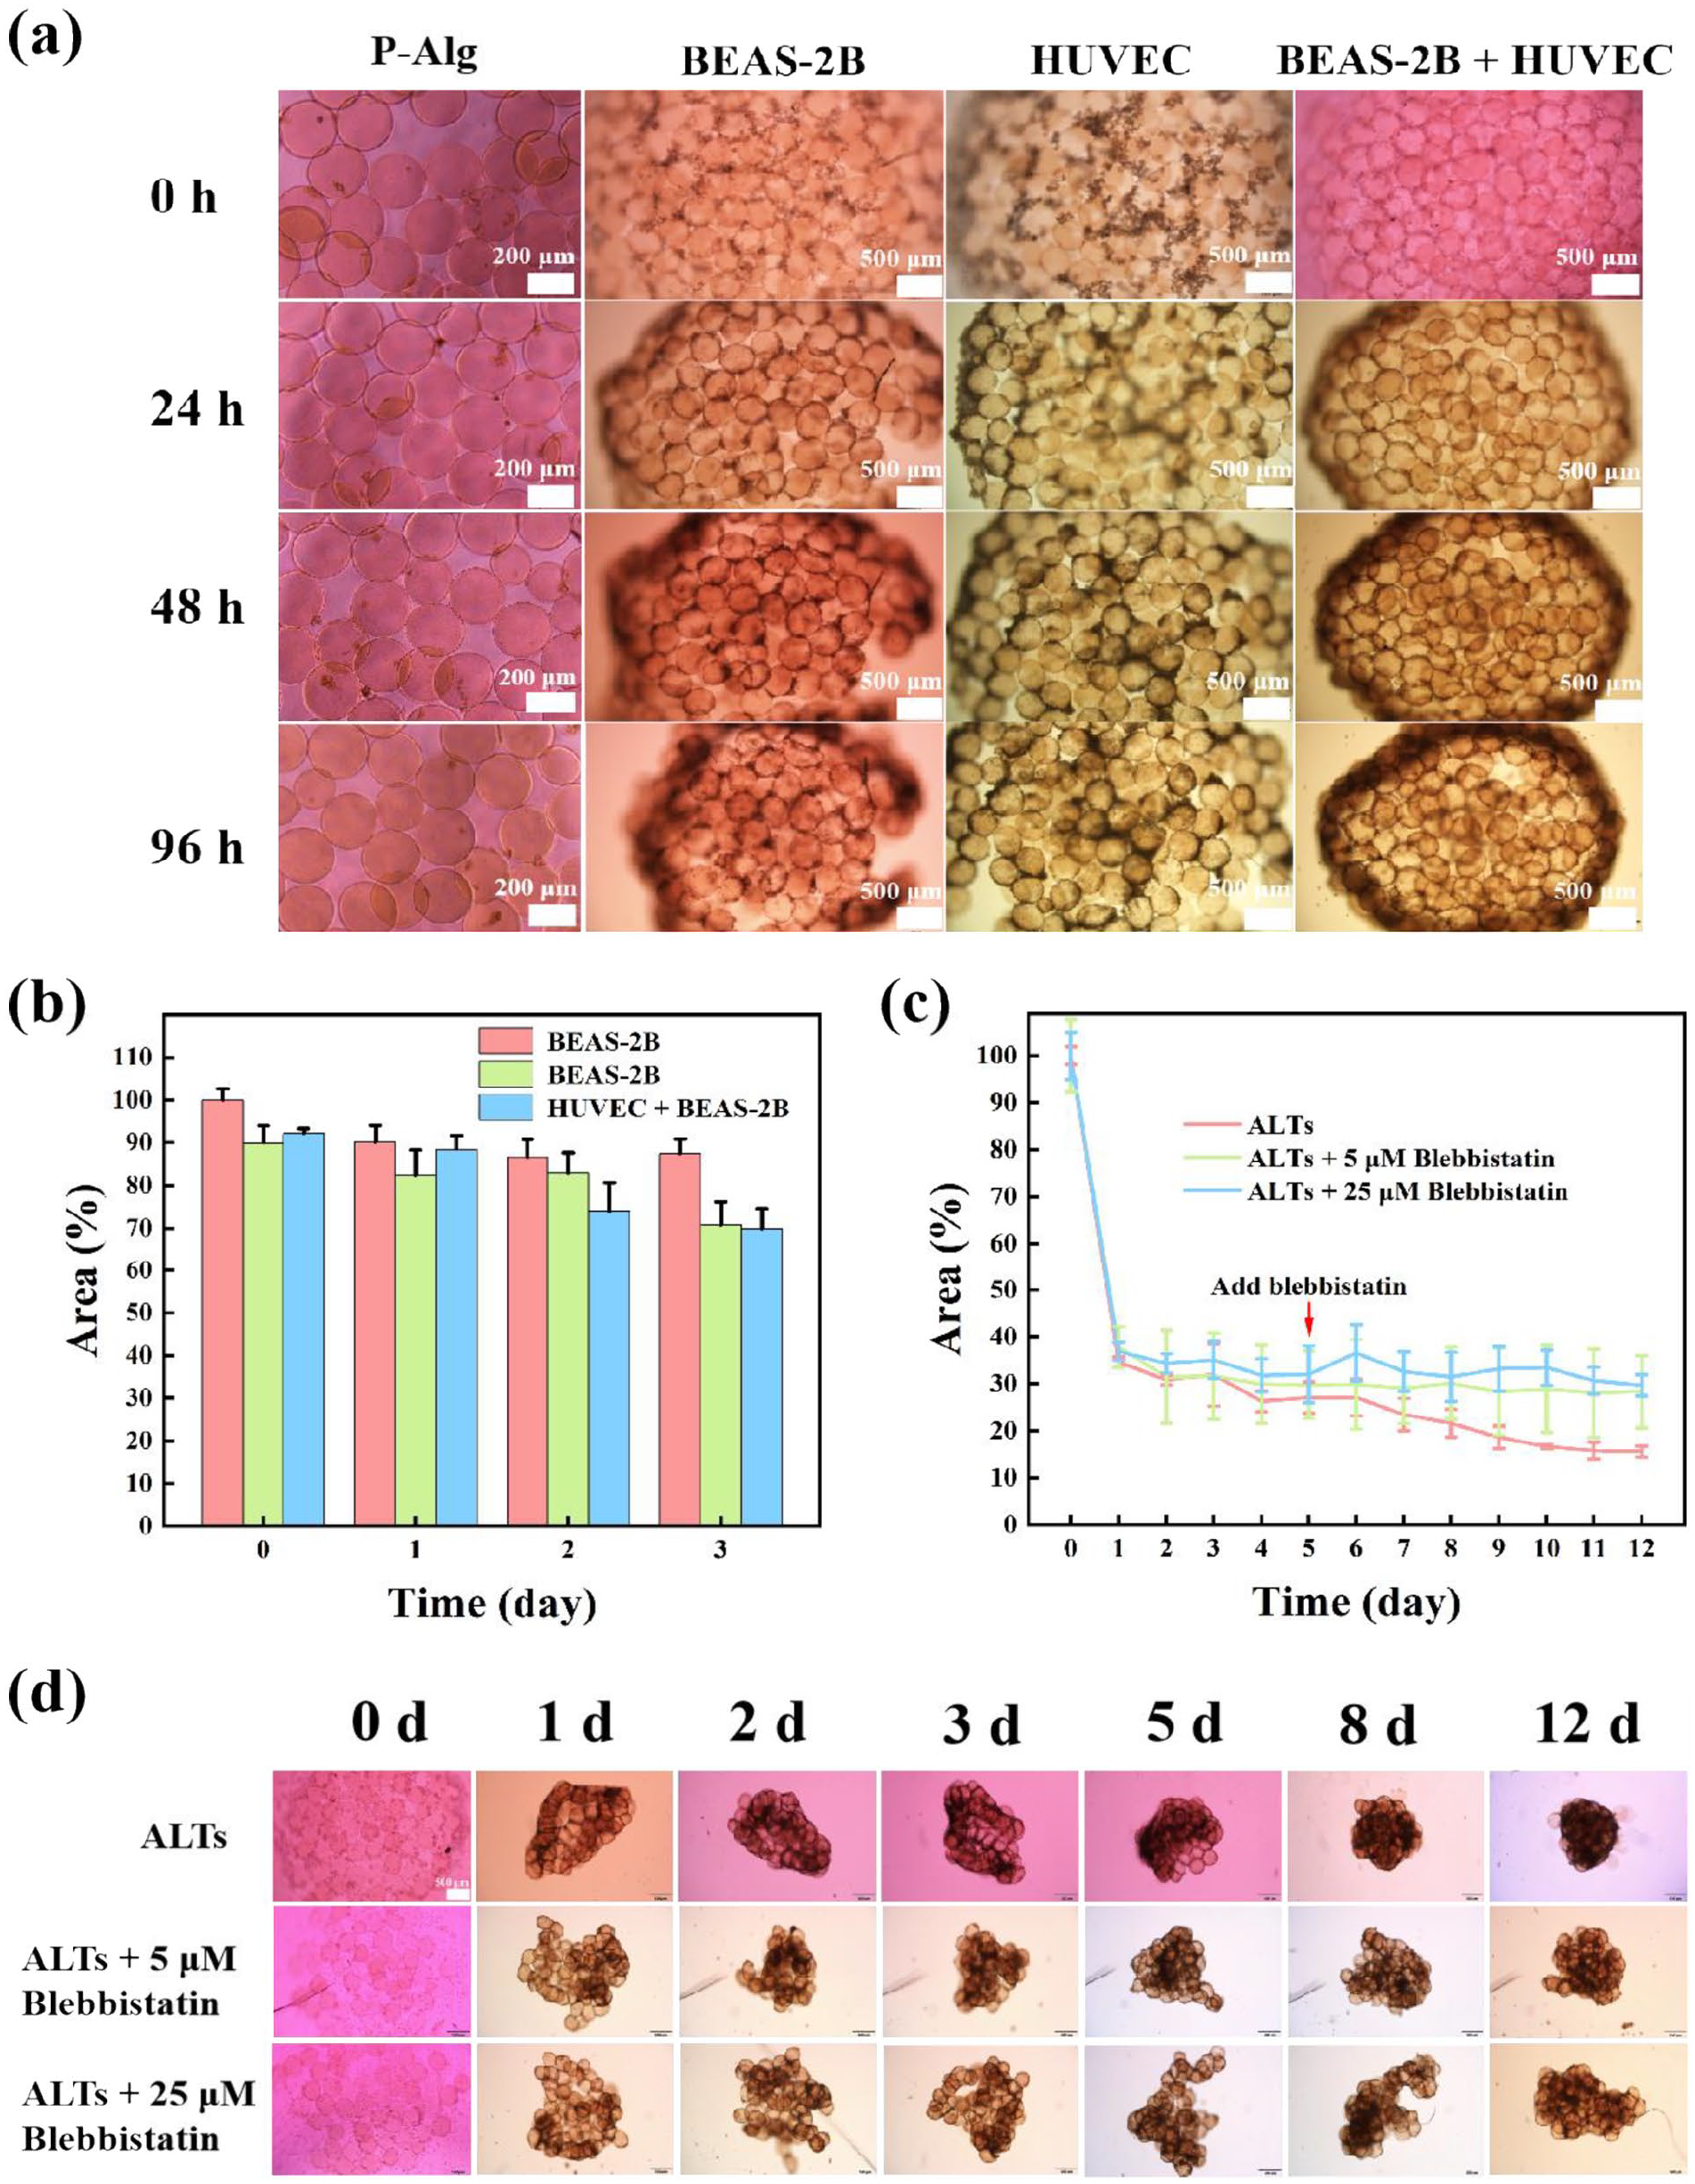
The contraction mechanism of ALTs. (a) Bright-field images of P-Alg microspheres incubated with BEAS-2B, HUVEC, and BEAS-2B + HUVEC cells at different time points, respectively, and (b) the quantitative analysis of the area changed (normalized with the control group). (c) The quantitative analysis and (d) images of the area changed (normalized with the control group) after treated with blebbistatin at different time points. Scale bar = 500 μm. Values shown are mean ± SD.
After that, we inhibited the proliferative behavior of MRC5 cells using blebbistatin reagent and blebbistatin was added on day 5 to exclude interference from the U-plates. Results showed that there were no significant changes in the area over the 6–12 days after adding blebbistatin, with the normalized area of 29.82 ± 7.18% to 28.37 ± 7.68% in the 5 μM group, and 31.98 ± 6.02% to 29.72 ± 2.24% in the 25 μM group. In contrast, the ALTs were significantly contracted from 27.08 ± 3.36% to 15.6 ± 1.17% in the control group (Figure 3(c) and (d)). Altogether, results suggested that MRC5 cells are effector cells that mainly promote the self-assembly behavior and contraction of ALTs.
Next, we observed the spatial distribution of MRC5 cells in ALTs via immunofluorescence staining. MRC5 cells were observed to grow along the surface of the P-AIg microspheres and mainly distributed in the gap between the P-Alg microspheres, partially explaining the contraction phenomenon of the ALTs (Figure 4(a) and Supplemental S16). Also, we found that the BEAS-2B and HUVEC cells were distributed both on the surface of the P-Alg microspheres and in the interspaces between the P-Alg microspheres, suggesting that the BEAS-2B and HUVEC cells were tightly interspersed in the ALTs (Supplemental Figure S17). Subsequently, the immunofluorescence staining was performed on ALTs, with Pan-CK (BEAS-2B cells), Vimentin (MRC5 cells), and CD-31 (HUVEC cells; Figure 4(b)). The merged image showed the three types of cells in a tightly staggered arrangement, which obviously help to promote the interaction between the three cells. Additionally, partial fluorescence overlap suggested a layered spatial distribution of the three cell types within the ALTs. In conclusion, the three types of cells were spatially distributed and tightly packed in the ALTs, with MRC5 cells forming a widely distributed “scaffolding skeleton” structure. In addition, in the 3D culture system constructed by P-Alg microspheres, the gene expression of tight junction protein of cells was significantly increased compared to these cells in 2D cultivation system, with increased of 2.91-folds (ZO-1), 3.23-folds (E-cadherin), 3.36-folds (Occludin), and 3.34-folds (Claudin-5), respectively (Supplemental Figure S18, the gene sequence used is shown in Supplemental Table S8).

Spatial distribution of the three cells in ALTs and the LPS-induced ALI model based on ALTs. (a) Full view of ALTs and the images in different magnifications. Red channel: Vimentin; Blue channel: DAPI. (b) Immunofluorescence staining of the ALTs to label the three cells. DAPI: nucleus, Pan-CK: BAES-2B cells, Vimentin: MRC5 cells, CD31: HUVEC cells. Scale bar = 100 μm. (c) Immunofluorescence staining of the tight junction proteins ZO-1 of the ALTs after 3 and 4 days cultured, scale bar = 200 μm. (d) Immunofluorescence staining of the Pan-CK and CD-31 after treating ALTs with different concentrations of LPS for 24 h, scale bar = 200 μm. (e) Quantification of the mean fluorescence intensity of ZO-1 after the ALTs treated with different concentrations of LPS for 24 h. (f) Quantification of the mean fluorescence intensity of Pan-CK and (g) CD-31 (n = 3–5). Values shown are mean ± SD. *p < 0.05. **p < 0.01. ***p < 0.001. ****p < 0.0001, versus Control group; ns indicates no statistical significance.
LPS-induced lung barrier damage ALI model-based ALTs
The lung barrier usually consists of lung epithelial cells and vascular endothelial cells, which are mainly maintained through tight junctions and adhesion junctions. These cells are highly selective for osmotic and transport functions and serve as a key barrier against exogenous pathogenic substances.39,40 Afterwards, we used the lipopolysaccharide (LPS) to induce the ALI model in vitro and vivo.41,42 Immunofluorescence staining for the tight junction protein ZO-1 (green channel) indicated the presence of a lung barrier in ALTs and its stronger expression in the gap between P-Alg microspheres (Figure 4(c) and Supplemental Figure S19). ALTs were incubated with 12.5, 25, 50, and 100 μg/mL LPS for 24 h, respectively. The fluorescence intensity of ZO-1 was decreased, indicating the damage to the ALTs lung barrier. As the concentration of LPS increased, the expression of ZO-1 (quantified using the mean fluorescence intensity values) in ALTs gradually decreased from 157.8 ± 1.35 (0 μg/mL) to 37.29 ± 5.76 (50 μg/mL), and further increasing LPS concentration marginally reduce the expression of ZO-1 (Figure 4(e), Supplemental Figure S20). Meanwhile, the fluorescence intensity of Pan-CK (BEAS-2B cells) and CD-31 (HUVEC cells) positive cells in ALTs decreased with increasing LPS concentrations compared to control (Figure 4(d), (f), and (g)). Therefore, LPS successfully induced an ALI model in ALTs with lung barrier damage at an optimal concentration of 50 μg/mL.
Introduction of macrophages in ALTs (ALTs@M)
To examine the broader applicability of this 3D bioprinting-based artificial lung tissue structure strategy, we introduced macrophages into the ALTs, resulting in an artificial lung tissue structure with macrophages (ALTs@M). The introduction of immune cells enhances the ability of ALTs to more closely mimic the in vivo microenvironment.43,44 We observed the structure of P-Alg microspheres, ALTs, and ALTs@M using SEM after fixation and gradient ethanol dehydration treatment. Results showed that unlike the SEM images of P-Alg microspheres obtained after lyophilization treatment, dehydration treatment largely preserved the original morphology of P-Alg microspheres (Figure 5(a)). A large number of regular wrinkles can be observed on the surface of P-Alg microspheres, which was mainly due to the crumpling of the Alg microspheres under their internal polydopamine coating due to the reduction of their volume and mass after undergoing gradient ethanol dehydration. The SEM images of ALTs and ALTs@M showed that the cells with different morphologies were uniformly distributed on the surface of P-Alg microspheres (Figure 5(a)). Meanwhile, some cells that showed a round-ball shape (marked by red dashed circles) were observed in the ALTs@M but not in the ALTs, potentially indicating macrophages. To further identify and examine the distributions of macrophages in ALTs@M, we performed multiple antibodies labeling on the ALTs@M slide, the four types of cells in ALTs@M were simultaneously labeled and visualized (Figure 5(b)). The results showed that macrophages were relatively uniformly distributed in ALTs@M, predominantly adhering to other cells or residing within the alveolar lumen, with few macrophages directly adhered to the surface of P-Alg microspheres.

Comparison between ALTs and ALTs@M. (a) The SEM images of P-Alg microspheres, ALTs, and ALTs@M. The macrophages were marked with red dashed circles in the images of ALTs@M. (b) The multiple antibodies Pan-CK, Vimentin, CD14, and CD31 were used to label BAES-2B, MRC5, THP-1, and HUVEC cells in ALTs@M section, respectively. ELISA assay for the expression of inflammatory factors of (c) TNF-α (n = 3), (d) IL-6 (n = 3), and (e) IL-1β (n = 4) from the ALTs and ALTs@M culture supernatant. Values shown are mean ± SD. *p < 0.05. **p < 0.01. ***p < 0.001. ****p < 0.0001, versus Control group.
We also examined the inflammatory factors including TNF-α, IL-6, and IL-1β of ALTs and ALTs@M before and after induction of the ALI model using 50 μg/mL LPS (Figure 5(c)–(e)). The results showed that the expression of TNF-α, IL-6, and IL-1β was significantly increased after LPS induction in both ALTs and ALTs@M groups. Notably, the secretion of inflammatory factors in the ALI model constructed by ALTs@M was all significantly higher than those in the ALTs-based ALI model, which were 5.37-folds, 2.32-folds, and 1.53-folds for IL-1β, TNF-α, and IL-6, respectively, indicating that we may establish a more realistic micro-environment compared with ALTs, and also created a new 3D method to study human immune microenvironments, especially the macrophages. Additionally, this ALTs construction strategy is generalizable and applicable to various cell types, allowing for the addition of different cells to create functionalized organoids with specific desired functions.
Conclusion and discussion
Here, we established an artificial lung tissue structure (ALTs) platform by constructing surface functionalized alginate hydrogel microspheres (P-Alg) with different cell types using 3D-inkjet bioprinting technology for lung disease modeling and immune cell interaction.
We chose inkjet printing technology for the construction of ALTs due to its high precision, scalability, and reproducibility, making it an ideal method for large-scale production of homogeneous microspheres for human cellular interactions and disease modeling. Inkjet printing offers significant advantages in terms of throughput and flexibility over alternative technologies such as microfluidics and lithography.6–8,45 The platform has good reproducibility, can be batch-manufactured, and supports long-term cell adhesion. In addition, the size and culture time of ALTs can be controlled by adjusting the ratio of P-Alg microspheres and cells, which somewhat bridges the gap between pulmonary disease modeling and evaluation. We selected 3D microspheres for their multifunctionality and scalability in modeling early-stage pulmonary diseases. Their controllable environment and high-throughput capacity make them ideal for studying cell interactions and inflammation.25,46 While alveolar models better mimic lung architecture, they are more complex to construct, whereas 3D microspheres offer a simpler, more adaptable alternative, particularly for macrophage and immune response studies. We obtained a more effective ALI model by introducing macrophages and constructed a potential human macrophage research model. The platform can be used to construct various 3D artificial lung tissue structure by using different cell types for the establishment of different patient-specific lung disease models, which is expected to be applied as a tool for more extended and practical research for personalized medicine and high-throughput drug discovery and drug screening.
This 3D bioprinting-based artificial lung tissue structure construction strategy provided adjustable alveolar microstructure that can be used for disease modeling, physiological studies, pharmacodynamic evaluation, and formulation evaluation in vitro. This artificial lung tissue structure construction strategy is very flexible, the materials and methods involved in the hydrogel microspheres and the surface modifications are interchangeable to accommodate different cell adhesion and artificial lung tissue structure construction. Additionally, this strategy can be adapted to a wide range of cell types, where the fibroblasts was highly required for adhesion and contraction of the microspheres. Thus, adding cells with this or similar functions may be necessary to expand artificial lung tissue structure types and applications when using this construction strategy. In our study, adding macrophages into the ALTs led to an increased secretion of inflammatory factors, suggesting a microenvironment closer to in vivo conditions. The constructed ALTs@M could serve as a new in vitro model for studying human macrophages. In addition, Yuan et al. 47 found that cell culture on functionalized hydrogel microspheres could effectively stimulate cell stemness and differentiation. Therefore, this functionalized hydrogel cell scaffold we constructed is expected to be used to culture and induce stem cells into artificial lung tissue structure in vitro. It greatly reduced the time and culture cost of organoid induction compared with the traditional methods of culturing and inducing organoids. Collectively, this 3D bioprinting-based ALTs construction strategy is expected to be applied to personalized medicine, which allows scalable construction of various patient-specific lung disease models in vitro and shows potential clinical applications.
Supplemental Material
sj-docx-1-tej-10.1177_20417314251328128 – Supplemental material for Construction of artificial lung tissue structure with 3D-inkjet bioprinting core for pulmonary disease evaluation
Supplemental material, sj-docx-1-tej-10.1177_20417314251328128 for Construction of artificial lung tissue structure with 3D-inkjet bioprinting core for pulmonary disease evaluation by Weimin Wan, Xi Wang, Rongtao Zhang, Yixuan Li, Haonan Wu, Yiman Liu, Fan Zhang, Jia Liu, Guiquan Liu, Lin Zhou, Zhenhua Wu, Hongju Mao and Jian Yang in Journal of Tissue Engineering
Footnotes
References
Supplementary Material
Please find the following supplemental material available below.
For Open Access articles published under a Creative Commons License, all supplemental material carries the same license as the article it is associated with.
For non-Open Access articles published, all supplemental material carries a non-exclusive license, and permission requests for re-use of supplemental material or any part of supplemental material shall be sent directly to the copyright owner as specified in the copyright notice associated with the article.