
Abstract
No permanent cure exists for salivary gland (SG) damage and consequent xerostomia (dry mouth) in patients undergoing radiotherapy for head and neck cancers. The lack of commercially available healthy human SG-derived cell lines has hindered in vitro studies of radiation-induced glandular injury. In this study, we successfully immortalized and characterized two novel human major SG-derived cell lines. Leveraging these cell lines and hyaluronic-acid hydrogels, we bioengineered distinct multicellular SG spheroids and microtissues expressing key acinar, ductal, myoepithelial, and mesenchymal cell markers in long-term cultures. Further, using this platform, we developed a proof-of-concept radiation injury model, demonstrating spheroid disruption characterized by actin depolymerization, DNA damage, apoptosis, and loss of SG-specific markers following radiation exposure. Notably, these detrimental effects were partially mitigated with a radioprotective agent. Our findings demonstrate that the bioengineered SG spheroids provide a scalable and versatile platform with significant potential for disease modeling and drug testing, thereby accelerating the development of targeted therapies for radiation-induced xerostomia.
Keywords
Introduction
Salivary glands (SGs) are secretory organs responsible for the production and secretion of saliva. In humans, there are three major and paired SGs, namely, the parotid gland (PA), the submandibular gland (SMG), and the sublingual gland (SLG). 1 Proper physiological functioning of the major SGs is crucial since they are responsible for the secretion of 90% of saliva, the rest supported by the several hundred minor SGs present in the lip, tongue, palate, etc. 2 A disruption in gland functioning can affect the salivary flow rate causing oral discomfort and disease. As an organ system, SGs portray a diverse range of pathologies ranging from inflammatory disorders to systemic conditions in addition to a wide variety of neoplasms.3,4 An undisputed outcome that arises due to SG dysfunction is xerostomia or dry mouth. Xerostomia can range from mild oral discomfort to severe dry mouth affecting the overall health, dietary intake, and quality of life of affected individuals. 5 This debilitating disease is crucially experienced by head and neck cancer (HNC) patients undergoing radiotherapy for cancer treatments. 6 The parallel induction of SG damage caused by ionizing radiation in HNC patients continues to be a significant contributor to the development of xerostomia. 7 According to global cancer statistics, HNCs are the seventh most common cancer type, with an estimated 900,000 new cases and 450,000 deaths annually. 8 While treatments in the form of salivary substitutes and artificial saliva exist, presently, there is no known permanent therapeutic solution to treat severe radiation-induced xerostomia. 9 Recently, stem cell therapy for the treatment of radiation-induced xerostomia has been introduced into clinical trials; however, there are several potential obstacles to its effective and timely implementation.10,11 Clinically approved drugs like amifostine and pilocarpine result in substantial side effects in patients and require surviving acinar cells (fluid-secreting SG cells) to function, underscoring the urgency of accelerated preclinical research for the development of successful therapeutics.12,13
SG cell culture techniques have served as an essential in vitro tool in our understanding of SG pathophysiology. The first evidence of human SG cell culture surfaced in the 1980s with the establishment of a myoepithelial cell line from a human pleomorphic adenoma arising in minor SG and the human salivary/submandibular gland (HSG) cell line, a neoplastic epithelial duct cell line derived from an irradiated human SMG.14,15 Since then, there has been a widespread use of the HSG cell line to study SG disorders such as xerostomia, Sjögren’s syndrome, and radiation-induced SG damage.16 –21 However, more than three decades after the cell line establishment, our lab conducted a short tandem repeats (STR) analysis on the HSG cell lines obtained from three different research laboratories, and we found that all sampled HSG lines were cross-contaminated with the HeLa cell line. 22 Other human SG cell lines that were developed include the minor SG duct cell line, 23 the SACC-83, a salivary cell line derived from adenoid cystic carcinoma of minor SG 24 , and several transformed versions of the above-mentioned cell lines. 25 It was not until 1993, that a normal, non-neoplastic SG cell line was established by Azuma et al. 26 The group isolated four cell clones, which were morphologically divergent and resulted in the formation of four distinct cell lines, representing the acinar, ductal, myoepithelial, and squamous cells, respectively, immortalized using simian virus 40(SV 40). However, these cell lines are not commercially available and limited studies have been conducted on them.
Currently, due to a lack of readily available normal (healthy, non-neoplastic) SG tissue-derived human cell lines, most in vitro SG research utilizes primary human and mouse SG cells. 27 While primary cells offer better physiological relevance, limitations with human SG tissue procurement and marked differences in the molecular profile of murine and human SGs cells may limit their long-term, translational applications. 28 Moreover, the slow and limited growth of primary cells further limits the widespread availability of human SG in vitro models for use in therapeutic testing and disease modeling applications. Conventional two-dimensional (2D) cell culture systems rarely mimic the innate characteristics of SG cells, particularly the secretory epithelial cells. To address these limitations, substantial progress has been made in bioengineering three-dimensional (3D) SG models using both natural and synthetic extracellular matrices (ECMs).29,30 In line with this effort, we recently optimized an expansion platform for SG acinar cell reorganization using an alginate-gelatin-hyaluronic acid (AGHA) hydrogel system. 31 Our findings demonstrate that AGHA hydrogels create favorable conditions for spheroid formation and enhance the secretory cell phenotype compared to conventional 2D culture systems. These advancements in 3D biomaterials, when combined with novel cell types, hold promise for developing physiologically relevant SG spheroid and organoid models for drug discovery and therapeutic applications.
In this work, we first successfully immortalized and established two SG cell lines derived from two major human SGs, the SMG and the SLG. Extensive characterization was performed to validate the authenticity of these cell lines and their ability to recapitulate key SG cell-specific features. Next, we cultured these cell lines in our recently optimized AGHA hydrogel system and established a 3D SG spheroid model. These SG microtissues exhibited the ability to maintain long-term viability, formed sizeable and distinct spheroid structures and expressed diverse proteins and gene profiles representing features of native human SGs. Lastly, we demonstrate the feasibility of using these SG spheroids as effective in vitro tools for modeling radiation-induced SG injury, particularly for use in drug screening applications.
Materials and methods
Results
Immortalization and establishment of new human SG cell lines
Single primary cells were obtained from human SMG and SLG using enzymatic dissociation and cultured in serum-free conditions as described in our previously established protocols. 32 Isolated SG cells (containing a mixture of acinar, ductal, myoepithelial, and mesenchymal cells) were then seeded into 6-well plates at a concentration of 1 × 10⁵ cells/well and subjected to varying the multiplicity of infection (MOI) of SV40 T particles at 70% confluency for optimal transduction. Successful transduction was observed at an MOI of 7 infected for 12 h with 5 µg/mL polybrene in serum-free Epi Max I complete culture medium (Supplemental Figure S1(a)). After 72 h post-transduction, cells were trypsinized and plated into new 100 mm petri dishes. Due to limited population doublings of the primary SG cells, no antibiotic selection was required for isolating transduced cells. Surviving clones were isolated using cloning rings and transferred into 48-well plates for expansion. We achieved immortalization and established cell lines obtained from both SMG and SLG tissues from two different patients, which were further characterized (Figure 1(a)). The first cell line was obtained from an SMG of a 37-year old male patient and was named SMG-Hu-0321, while the second cell line obtained from an SLG of a 62-year old female patient and was named SLG-Hu-1020, hereafter annotated as HuSMG and HuSLG cells respectively.
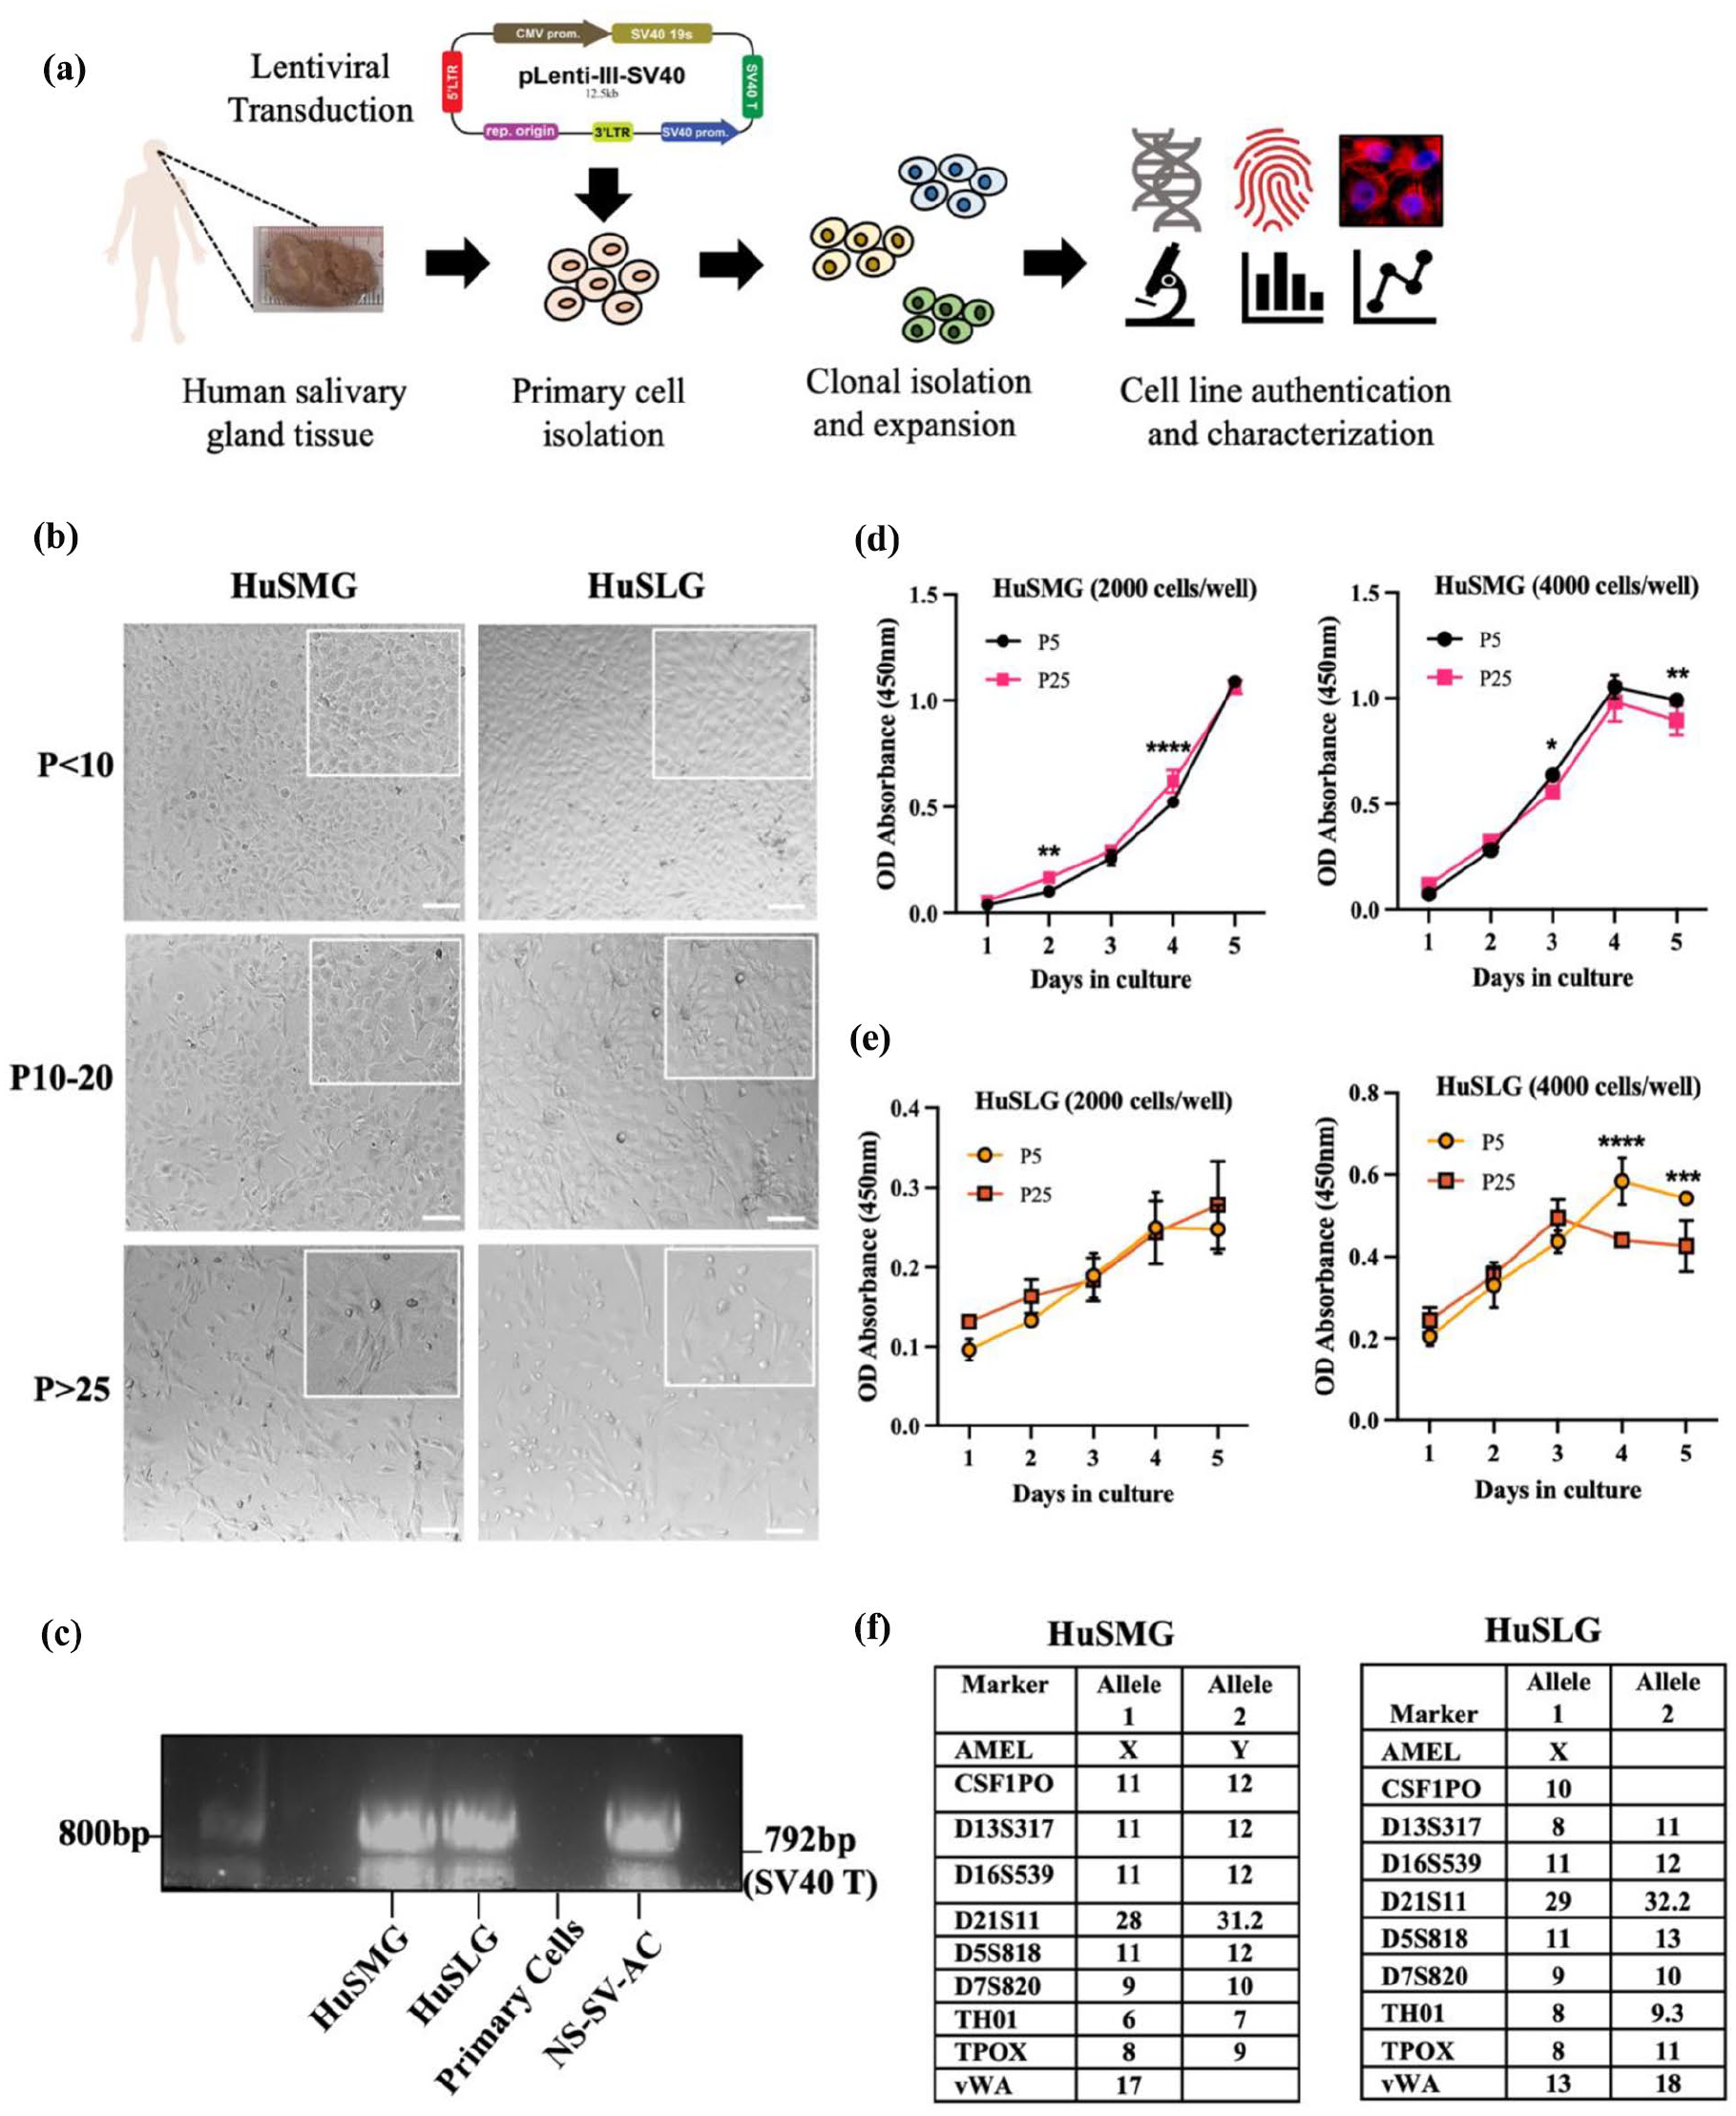
Establishment of immortalized human SG cell lines. (a) Schematic workflow outlining steps in cell line development and characterization. (b) Brightfield images showing morphologies of HuSMG and HuSLG cell lines at early (P < 10), intermediate (P = 10-20), and late (P > 25) passages. Magnification/scale: 5×/100 µm (zoom inset). (c) PCR-gel electrophoresis showing SV40 T transgene expression in the newly immortalized SG cell lines. NS-SV-AC (Normal Salivary-SV40-Acinar Cells) cell line was used as a positive control, and human primary SG cells were used as a negative control. (d and e) WST-8 cell proliferation assay comparing the metabolic activity of HuSMG and HuSLG cell lines at low (P5) and high (P25) passages seeded at 2000 cells/well and 4000 cells/well in 96-well plates. Values are plotted as mean OD (optical density) ± SD, n = 5, and recorded at the same time each day over 5 days. Statistical analysis was done using two-way ANOVA and Šídák’s multiple comparisons test to compare values between passages and different time points. *p < 0.05, **p < 0.01, ***p < 0.001, ****p < 0.0001. (f) STR profiles of the immortalized cell lines showing distinct alleles detected using 10 loci/markers confirming cell line origin from two different patients.
Morphologically, both cell lines appeared as polygonal-shaped cells at early passages (P< 10) and in high confluency. Specifically, the HuSMG cells displayed a typical cobblestone appearance resembling the SG primary epithelial cells (Figure 1(b) and Supplemental Figure S1(b)). However, at higher passages (P> 25) while the HuSMG cells maintained most of their phenotype, the HuSLG cell line showed differences in cell phenotype, displaying the presence of a few big and elongated cell types (Figure 1(b)). We successfully grew and expanded the immortalized cell lines for over 25 passages and confirmed the SV40 transgene expression in the cells using PCR (Figure 1(c)). To determine the cell proliferation rate and population doublings in our cell lines, we used the WST-8 cell proliferation assay (Supplemental Figure S1(c) and (d)). The HuSMG cells had a doubling time of ~25 h, whereas the HuSLG exhibited ~28 h to duplicate its population. In addition, we tested cell growth at low (P5) and high (P25) passages at different cell densities to determine if longer passages affected proliferation rate in either cell line. Naturally, higher absorbance values were obtained for cells seeded at higher density, but no significant changes were recorded in either cell lines cultured 20 passages apart (Figure 1(d) and (e)). To further confirm the identity and authenticity of the newly developed cell lines, we conducted STR DNA profiling, which revealed distinct alleles for both cell lines (Figure 1(f)). The STR profiles were cross-referenced with the ATCC, DSMZ, and CLAST STR databases, encompassing approximately 9000 human cell lines, to ensure authenticity and verify that the profiles were unique and did not match any existing cell lines (Supplemental Excel File). We further tested the cell lines for mycoplasma and found that all the cells, including the new cell lines developed in this work, were free of mycoplasma contamination (Supplemental Figure S1(e)). Lastly, to assess chromosomal aberrations commonly incurred in cell lines immortalized with SV40 gene, we performed karyotyping using DAPI banding. While the majority of the cells analyzed (~70%–80%) showed a normal karyotype in both the cell lines (Supplemental Figure S2(a) and (b)), a low population (~20%–30%), either at early or late passages, displayed the presence of tetraploid chromosomes and endoreduplication (Supplemental Figure S2(c)–(f)). Additionally, translocation and single missing chromosomes were observed in a few cells (~5%) analyzed from the HuSLG cell line (Supplemental Figure S2(g) and (h)).
Immortalized cell lines retain features of human primary SG cells
We next evaluated whether the newly immortalized cell lines expressed SG-specific genes and proteins. For gene expression analysis via RT-qPCR, primary non-immortalized SG cells were used as controls, and NS-SV-AC served as the reference immortalized cell line. AQP-5 mRNA levels were comparable between primary cells and HuSMG cell lines, whereas NS-SV-AC and HuSLG cells exhibited lower expression levels (Figure 2(a)). Similarly, the acinar cell marker NKCC1 was significantly upregulated in HuSMG cells but showed comparable, non-significant mRNA levels in both HuSLG and NS-SV-AC cell lines (Figure 2(b)). We also examined the expression of the epithelial tight junction protein ZO-1, which was low and comparable in NS-SV-AC and HuSLG cells relative to primary cells but markedly overexpressed in the HuSMG cell line (Figure 2(c)). Additionally, ACTA-2, a marker for myoepithelial cells, displayed a similar expression trend as ZO-1, indicating the presence of myoepithelial cells in all cell lines, with a higher prevalence in HuSMG cells (Figure 2(d)).

HuSMG and HuSLG cell lines show SG-specific markers at mRNA and protein levels. (a–d) Gene expression of new cell lines compared to primary non-immortalized cells as control, and NS-SV-AC as reference cell line determined using RT-qPCR. Data reported as relative fold change ± SE and normalized to GAPDH, (n = 3). Statistical analysis was performed using one-way ANOVA and Tukey’s multiple comparisons test. N.S: non-significant, *p < 0.05, **p < 0.01, ***p < 0.001, ****p < 0.0001. Representative images showing immunofluorescence staining of diverse SG markers in (e-h) primary SG cells, (i–l) in NS-SV-AC cell line, (m–p) in HuSMG cell line, and (q–t) in HuSLG cell line. Magnification/scale: 20×/100 µm.
To further investigate the expression of key SG-specific markers, we conducted a comprehensive immunocytochemical analysis of the newly immortalized cell lines, using primary SG cells and NS-SV-AC as reference cells. As expected, primary SG cells exhibited robust expression and proper localization of key markers, including acinar (AQP-5), epithelial (E-Cad), myoepithelial (α-SMA), and ductal (pan-CK) markers (Figure 2(e)–(h)). In contrast, NS-SV-AC cells displayed weak overall expression and poor localization of these markers (Figure 2(i)–(l)). Consistent with the gene expression data, HuSMG cells demonstrated relatively robust expression of acinar markers AQP-5 and NKCC1, with distinct localization patterns of epithelial marker ZO-1(Figure 2(m) and (n)). Given that immortalized epithelial cells frequently undergo epithelial-to-mesenchymal transitions (EMTs), we co-stained HuSMG cells with E-cadherin and vimentin. The staining revealed an irregular pattern, with dot-like adherens proteins distinct from vimentin expression (Supplemental Figure S3(a)). Furthermore, HuSMG cells exhibited weak staining for pan-cadherins, detecting both E-cadherins and N-cadherins, consistent with dynamic EMT processes in immortalized epithelial cells (Supplemental Figure S3(b)). Sparse yet localized expression of myoepithelial (α-SMA) and ductal (pan-CK) markers was also observed in HuSMG cells (Figure 2(o) and (p), respectively). To further characterize the positive pan-CK expression, we stained HuSMG cells for CK-5, CK-7, and CK-14 markers. Robust CK-5 expression was observed at early passages (P5-P10; Supplemental Figure S3(c)), but its loss in later passages suggests a decline in progenitor marker expression over time. CK7+ luminal ductal cells and CK14+ stem-like cells were detected even in cells cultured beyond passage 15, while the acinar progenitor marker Mist-1 was absent (Supplemental Figure S3 (d) and (e)).
In contrast, HuSLG cells exhibited some expression of the epithelial tight junction marker ZO-1 but showed poor localization or absence of acinar markers AQP-5 and NKCC1 (Figure 2(q) and (r), respectively). These cells also showed high expression of vimentin and pan-cadherins, with poorly distributed E-cadherin aligned along actin bundles connecting the cells (Supplemental Figure S3(f) and (g)). Interestingly, HuSLG cells displayed a distinct and higher expression of the myoepithelial marker α-SMA compared to both primary SG and HuSMG cells, alongside sparse detection of ductal cell populations, as indicated by a limited number of pan-CK-positive cells (Figure 2(s) and (t)). The pan-CK expression in early passages of HuSLG cells could be attributed primarily to a small population of CK-5-positive cells and a low percentage (<10%) of CK-7 expressing cells (Supplemental Figure S3(h) and (i)). Both CK-14 and Mist-1 markers were absent in HuSLG cells, confirming a low presence of ductal epithelial stem cells and the absence of acinar-cell-specific markers, respectively (Supplemental Figure S3(j)). These findings highlight the differential expression profiles and cellular compositions of the HuSMG and HuSLG cell lines, providing insights into their unique characteristics and potential applications in SG research.
Functional characterization of immortalized cell lines reveals distinct features of native SGs
To assess the functional properties of the newly immortalized cell lines, we evaluated their ability to maintain epithelial integrity by measuring TEER values. The NS-SV-AC acinar cell line was used as an internal control and reference. Both the HuSMG and HuSLG cell lines consistently exhibited significantly higher TEER values (210–250 Ohm cm²) over the first 3 days compared to the NS-SV-AC cell line (195–215 Ohm cm²). However, by day 4, the HuSLG TEER values began to decline, with all cell lines reaching comparable levels by day 5 (Figure 3(a)). These findings indicate that the newly immortalized cells possess the ability to polarize and regain epithelial characteristics when cultured in a transwell system.
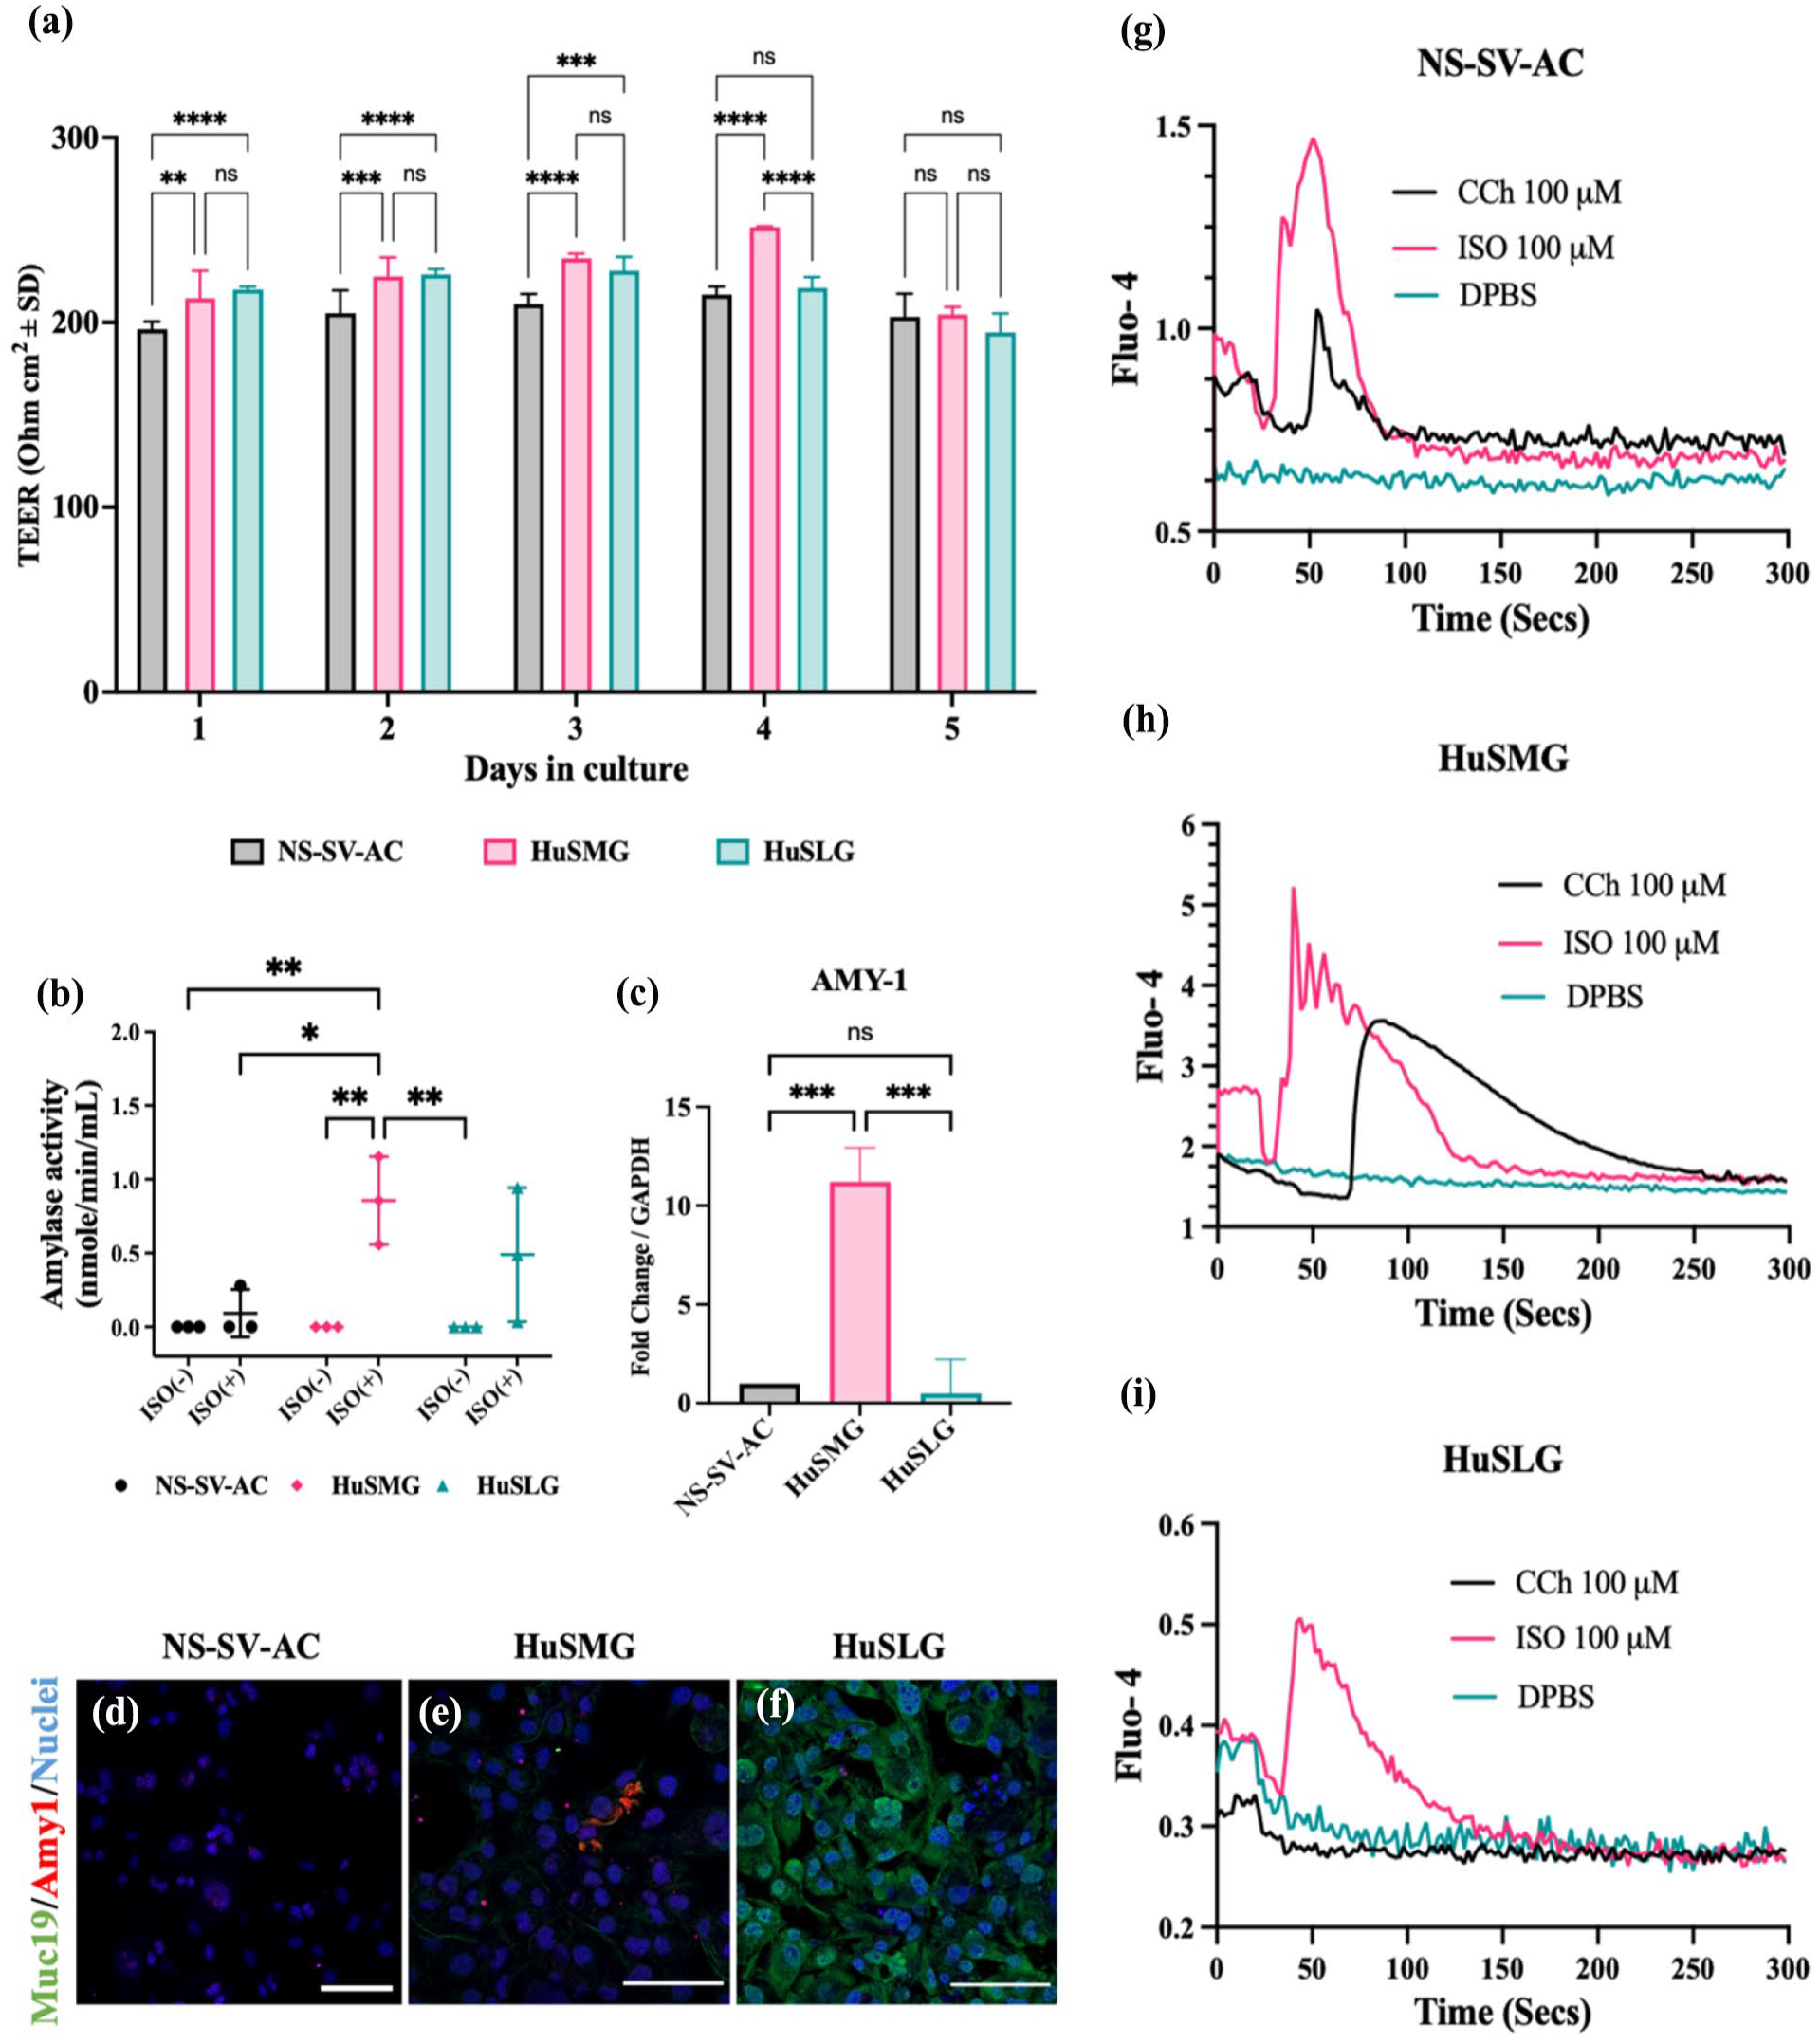
Functional assessment of immortalized SG cell lines. (a) TEER (Transepithelial Electrical Resistance) was measured across HuSMG and HuSLG cell lines cultured over 5 days using transwell filters in six-well plates, NS-SV-AC cell line was used as a control/reference cell line to compare new cell lines. Transwell filters without cells were used to measure blank TEER values. Data is presented as mean ± SD, (n = 6). (b) Amylase activity assay in the human SG cell lines with or without stimulation with α-adrenergic agonist isoprenaline (ISO-50 µM) for 2 h. Data is presented as mean ± SD, (n = 3). (c) Detection of AMY-1 gene expression in the human cell lines using RT-qPCR, data is presented as relative fold change ± SE, and normalized to GAPDH, (n = 3). Statistical analysis was performed using one-way ANOVA with Tukey multiple comparisons for TEER, amylase activity and RT-qPCR experiments, n.s: non-significant, *p < 0.05 **p < 0.01, ***p < 0.001, ****p < 0.0001. (d–f) Immunofluorescence staining of Amy-1 and Muc19 proteins in NS-SV-AC, HuSMG and HuSLG cell lines, respectively. Magnification/scale: 20×/100 µm. (g–i) Plots showing Fluo-4 peaks obtained by agonist-induced calcium influx in NS-SVAC, HuSMG and HuSLG cell lines, respectively. Cells were stimulated either with 100 µM CCh or 100 µM ISO and reference against Ca2+ and Mg2+ free DPBS as control.
As exocrine organs, SGs produce different secretory proteins which are specific to cell and gland types. Based on our putative results on the predominant acinar-like characteristics of the HuSMG cell line and a mixed population in the HuSLG cells, we next investigated the extent of amylase activity in the new cell lines. Our results show that HuSMG cells were able to respond to stimulation by β-adrenergic agonist isoprenaline (ISO) and secreted significantly higher amylase proteins than NS-SV-AC cells (Figure 3(b)). While the HuSLG cells also responded to stimulation by ISO, they secreted lower levels of amylase than the HuSMG cells. This could be attributed to the presence of serous demilunes as sole cells that are responsible for producing amylase proteins in the SLGs. We confirmed the amylase activity results by measuring the AMY-1 mRNA expression in the two new cell lines. As expected, the HuSMG cells showed a ~11-fold increase in AMY-1 expression as compared to the NS-SV-AC and HuSLG cell lines, corroborating the predominant acinar characteristics possessed by HuSMG cells (Figure 3(c)). We further characterized the cell lines by co-staining them for salivary α-amylase (Amy-1) and mucin 19 (Muc19) to differentiate between serous and mucous acinar cell populations. The NS-SV-AC cell line displayed low levels of amylase granules and an absence of Muc19 expression (Figure 3(d)). In contrast, the HuSMG cell line exhibited a few Amy-1+ cells and sparsely stained Muc19 in some cells, indicating the presence of seromucous acinar populations (Figure 3(e)). The HuSLG cell line, however, showed no detectable Amy-1 staining but demonstrated robust expression of Muc19 proteins (Figure 3(f)). The low Amy-1 expression observed in the NS-SV-AC and HuSMG cells could be attributed to the absence of agonist stimulation. Combined, these results confirm the presence of seromucous acinar populations in the HuSMG cell line and a low but predominantly mucous cell population in the HuSLG cell line.
To evaluate agonist-induced functional responses in the newly immortalized cell lines, we performed a Fluo-4 calcium assay to compare the intracellular Ca²⁺ release patterns of NS-SV-AC, HuSMG, and HuSLG cell lines. Cells were stimulated with 100 µM carbachol (CCh), a muscarinic receptor (M3) agonist, or 100 µM ISO, a β-adrenergic receptor agonist, with DPBS (Ca²⁺, Mg²⁺free) serving as a negative control. The NS-SV-AC cells exhibited a moderate peak of intracellular Ca²⁺ release in response to CCh, with activation observed in a subset of cells. In contrast, stimulation with ISO elicited a higher peak, indicating a more consistent Ca²⁺ release across multiple cells (Figure 3(g), Supplemental Videos 1 and 2). The HuSMG cells demonstrated significantly higher Fluo-4 dye loading efficiency, reflected in an elevated baseline fluorescence intensity. These cells produced excitation patterns similar to NS-SV-AC, with higher but transient ISO-induced peaks in a few cells. However, they displayed a lower yet sustained Ca²⁺ release in response to CCh, observed in most cells (Figure 3(h), Supplemental Videos 3 and 4). In contrast, the HuSLG cells exhibited the lowest Fluo-4 dye loading efficiency, consistent with their reduced acinar cell population. Upon ISO stimulation, the HuSLG cells showed a brief Ca²⁺ release peak, suggesting the presence of a limited number of functional acinar cells. Notably, the HuSLG cells displayed no response to CCh stimulation, indicating a negligible or absent M3 receptor-mediated Ca²⁺ release in this cell line (Figure 3(i), Supplemental Videos 5 and 6). All cell lines maintained resting Ca²⁺ levels when stimulated with DPBS alone. Overall, these findings highlight the cellular heterogeneity of the new cell lines and their ability to retain functional features representative of native SG tissue.
HuSMG and HuSLG cells reorganize to form 3D microtissues in hyaluronic acid hydrogels
After the establishment and extensive characterization of the new cell lines, we sought to test if they can expand and reorganize in 3D cultures. We previously showed that human SG cells can re-organize into 3D spheroids and express functional markers representing native SG tissues when cultured in biomimetic HA-based hydrogels. 31 In this work, using 3D hanging drop method, we tested the potential of HuSMG and HuSLG cells to reorganize and form 3D spheroids using alginate-gelatin-hyaluronic acid (AGHA) hydrogels (Figure 4(a)). Live/dead assay and confocal microscopy were used to track cell viability and 3D morphology through the function of time in 3D cultures.
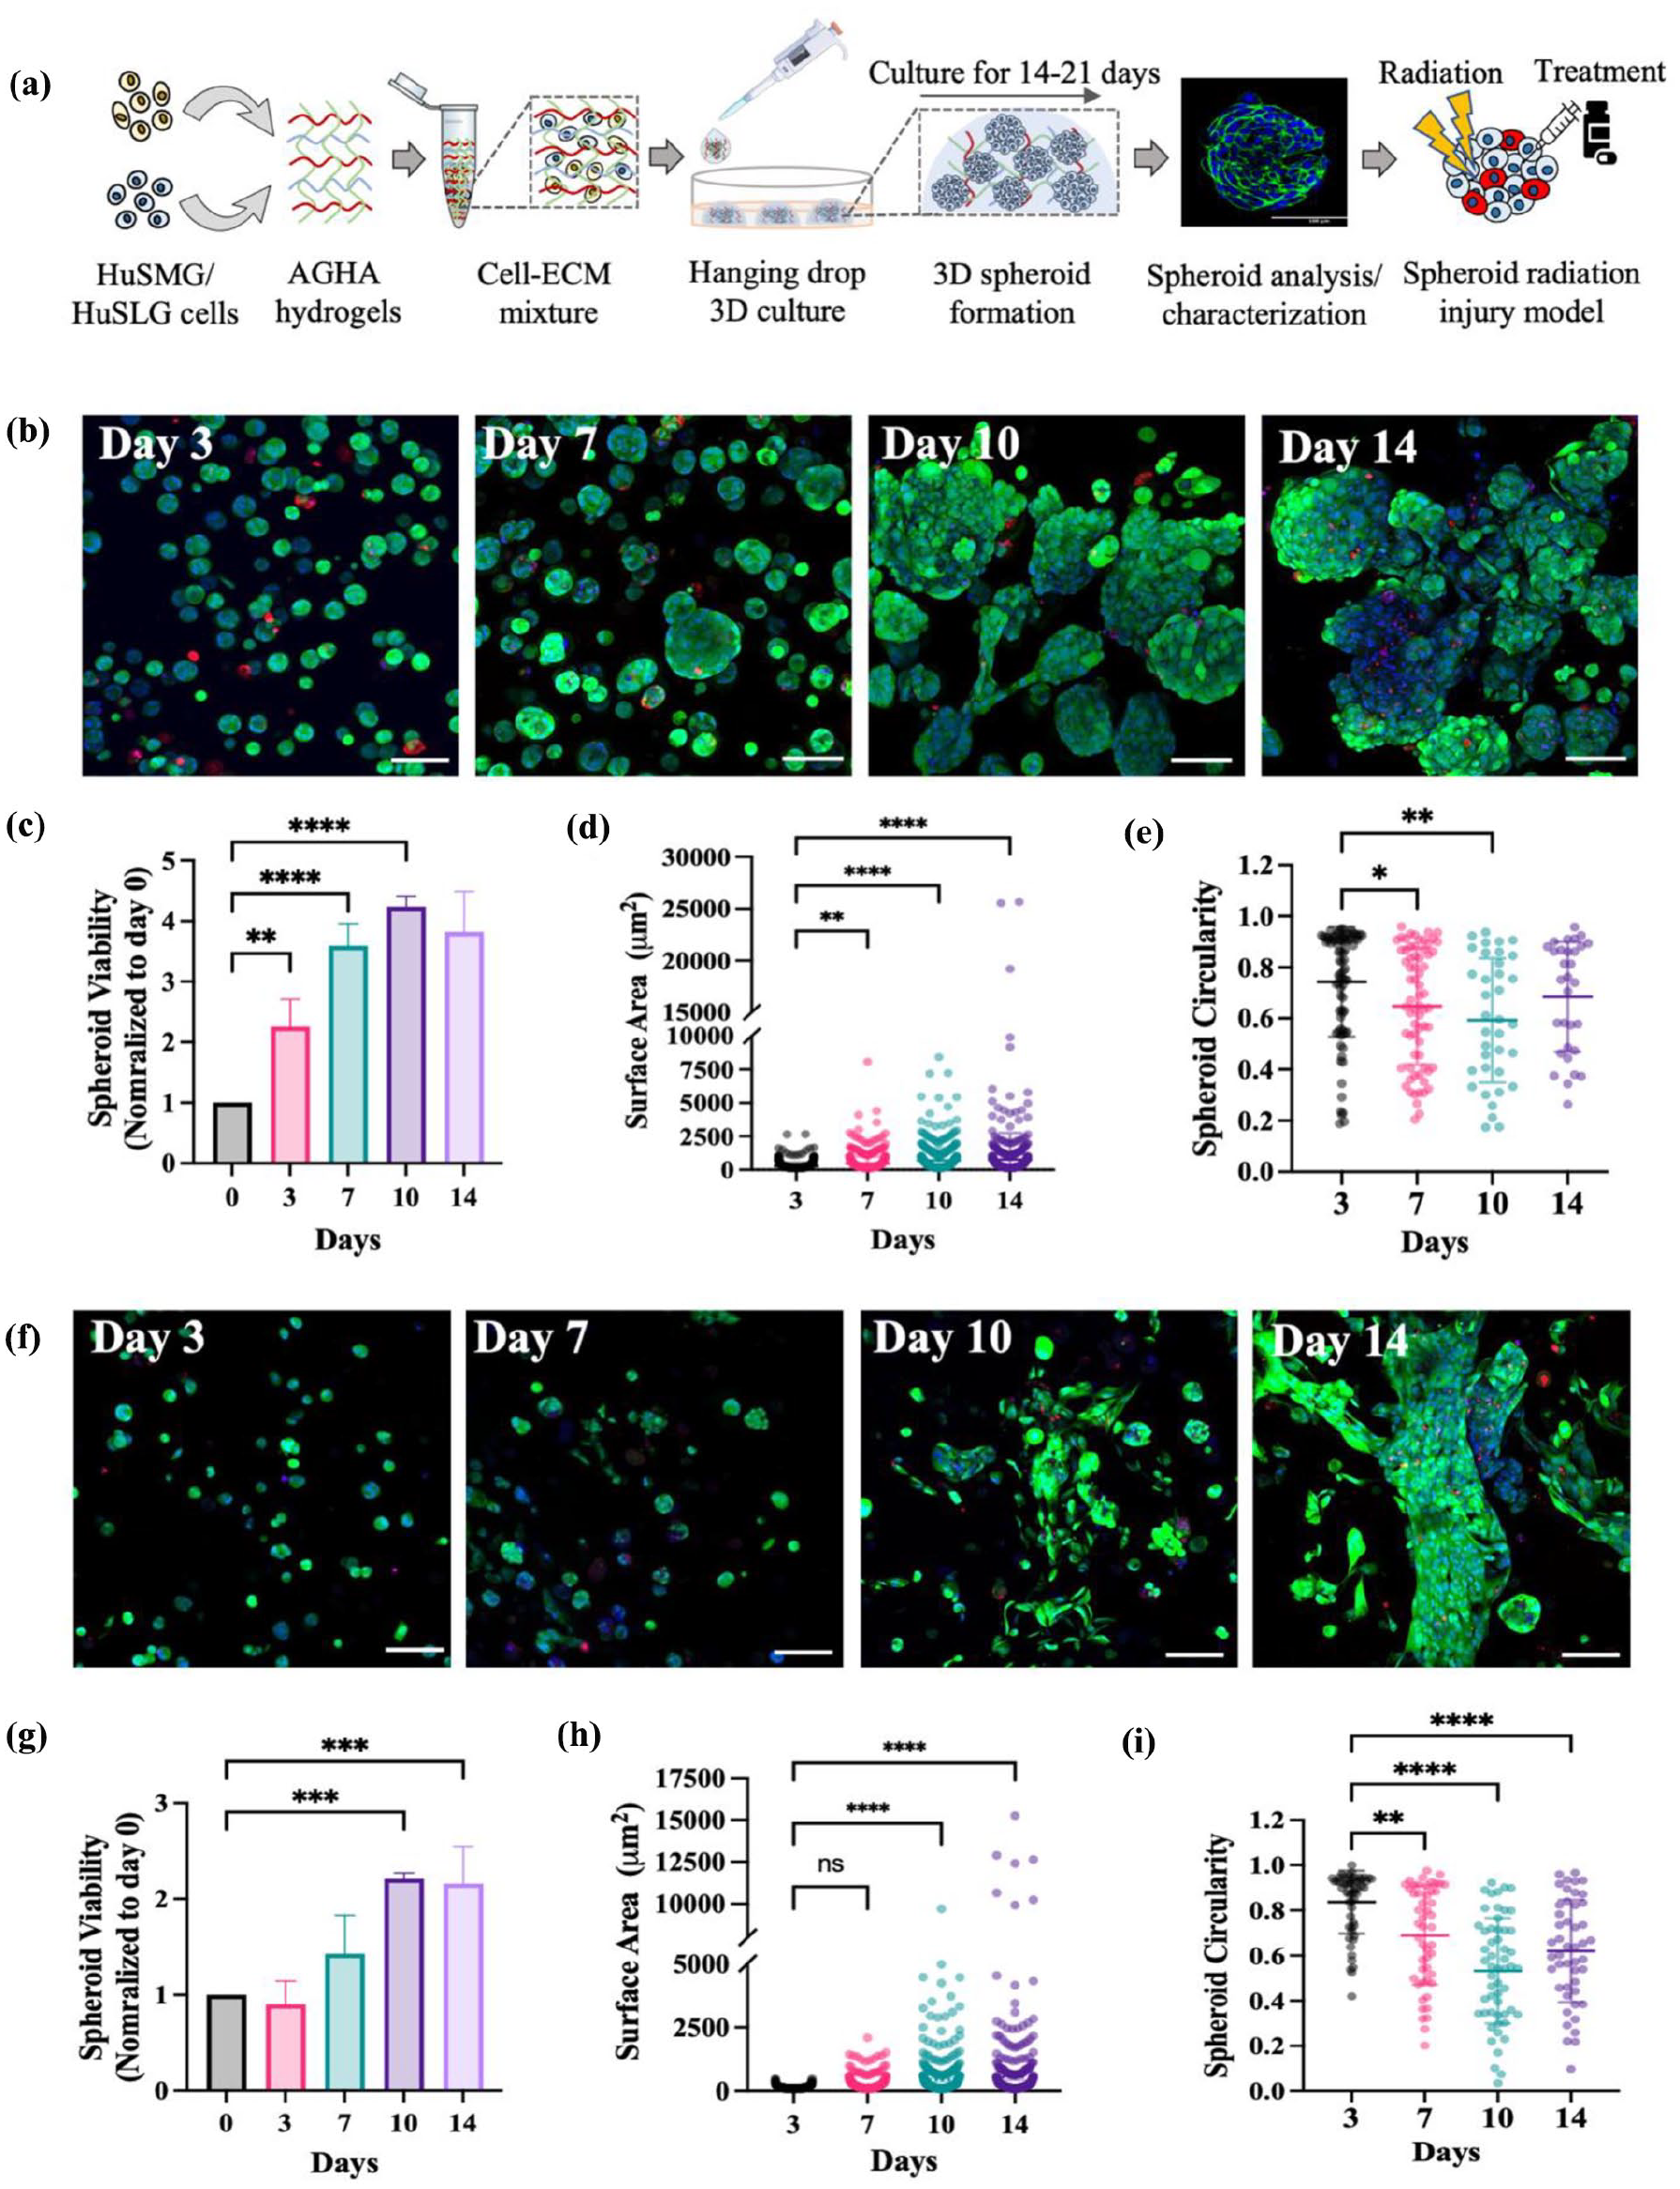
Establishment of human SG spheroid models. (a) Schematic workflow of AGHA hydrogel-based 3D spheroid culture. (b) Live-dead assay and confocal microscopy were used to track HuSMG spheroid formation and morphology, (c) spheroid viability (normalized to day 0), (d) spheroid surface area (n = 547–771), and (e) spheroid circularity (n = 31–82) over 14 days in culture. (f) Live-dead assay and confocal microscopy were used to track HuSLG spheroid formation and morphology, (g) spheroid viability (normalized to day 0) (h) spheroid surface area (n = 455–579), and (i) spheroid circularity (n = 47–55) over 14 days in culture. Magnification/Scale: 20×/100 um. Data is presented as mean ± SD, N ⩾ 3, N = hydrogel domes, n = total number of spheroids analyzed. Statistical analysis was performed using one-way ANOVA with Dunnett’s multiple comparisons test. *p < 0.05 **p < 0.01, ***p < 0.001, ****p < 0.0001.
HuSMG cells expanded and reorganized into small 3D spheroid-like structures starting day 3, further expanding to form large, interconnected spheroids at day 14 (Figure 4(b) and Supplemental Figure S4(a)). Quantitative analysis of confocal images indicated a ~4-fold increase in HuSMG spheroid viability between days 0 and 14 (Figure 4(c)). HuSMG spheroids showed a significant increase in surface area at day 14 reaching a maximum of ~25,000 µm2 in size compared to ~ 2,500 µm2 at the start of the culture (Figure 4(d)) which is also seen as a rise in Corrected Total Cell Fluorescence (CTCF) values at day 14 (Supplemental Figure S4(b)). Further, to test the intactness of these spheroids, we analyzed and calculated their circularity and roundness values. HuSMG spheroids, although without changes in roundness values (Supplemental Figure S4(c)), showed a significant change in spheroid circularity at days 7–10 (Figure 4(e)). This pattern may be attributed to the inherent capacity of these spheroids to engage in inter-spheroid crosstalk and establish interconnections with neighboring spheroids, resulting in reduced circularity values. This pattern is further corroborated by the analysis of spheroid numbers over time, as extended culture durations naturally facilitate spheroid fusion, leading to the formation of larger, interconnected structures, and a corresponding reduction in the total number of spheroids (Supplemental Figure S4(d)).
In parallel, we used live/dead assays to test both the morphologies and 3D reorganization of HuSLG cells within the AGHA matrix. Compared to HuSMG spheroids, HuSLG cells formed smaller, less spheroidal, and show sparser distribution of 3D structures at day 3–10, forming several large tubular/sheet-like microstructures at day 14 (Figure 4(f) and Supplemental Figure S4(e)). This difference can also be quantified as the low fluorescence intensity values observed during this culture period, which significantly increases at day 14 (Supplemental Figure S4(f)). A similar trend was observed with the spheroid viability, with a significant increase only observed at days 10–14 (Figure 4(g)). HuSLG microstructures also showed a significant increase in size and surface area at days 7–10, reaching a maximum of ~15,000 µm2 at day 14 (Figure 4(h)), but showed an overall lower size compared to HuSMG spheroids. The lower cell viability and size seen in HuSLG spheroids can be related to the observed differences between HuSLG and HuSMG cell growth and proliferation in 2D cultures. The changes in the spheroid or laminar microstructure morphologies adopted by HuSLG cells were confirmed by measuring the spheroid circularity and roundness values. HuSLG microtissues showed a significant difference in the circularity and roundness values as the culture progressed due to the deviation from conventional 3D spheroid morphology into large tubular, sheet-like structures at day 14 (Figure 4(i) and Supplemental Figure S4(g)) further resulting in reduced number of discrete spheroids at day 14 (Supplemental Figure S4(h)). Together, our results validate the potential of HuSMG and HuSLG cell lines to undergo expansion and cellular re-organization to form large, highly viable 3D microtissues with distinct morphologies within the AGHA hydrogel culture system.
Human salivary spheroids recapitulate markers specific to native salivary gland tissues
Once we established the SG spheroid models, we next verified if these spheroids retained the expression of key genes and proteins as previously detected in 2D cultures. Gene expression in HuSMG and HuSLG spheroids was analyzed using RT-qPCR and compared to NS-SV-AC cell spheroids. As expected, the HuSMG spheroids expressed high levels of acinar cell-specific markers including AQP-5 and NKCC-1, compared to the NS-SV-AC (acinar) spheroids (Figure 5(a) and (b)). In addition, there was an upregulation of NKCC-1 gene levels in HuSLG cells in 3D as compared to their 2D counterparts. Although non-significant, and unlike the 2D cultured cells, the HuSMG spheroids showed a low expression of ZO-1, which was also noted for the two other spheroid types (Figure 5(c)). Based on our previous work, AGHA-based hydrogels improved the secretory properties of NS-SV-AC cell line-derived spheroids compared to 2D cultures. 31 Since HuSMG cells in 2D culture showed predominant acinar phenotype and secretory functions, we tested if the 3D culture could improve these secretory

AGHA cultured HuSMG and HuSLG spheroids show diverse expression of SG tissue-specific genes and proteins. Detection of (a) AQP-5 (b) NKCC-1 (c) ZO-1 and (d) ACTA-2 genes in spheroids derived from NS-SV-AC, HuSMG, and HuSLG cell lines. (e and f) Whole mount immunofluorescence staining of HuSMG spheroids at day 14 showing expression of acinar cell markers AQP-5, NKCC-1, tight junction protein, ZO-1, and myoepithelial marker α-SMA, respectively and (g and h) of HuSLG spheroids at day 14 showing acinar markers AQP-5, NKCC-1, ZO-1 and myoepithelial marker α-SMA respectively. (i–l) Quantification of percentage of AQP5, ZO-1, NKCC-1 and α-SMA positive spheroids in HuSMG and HuSLG cell lines. (m) Immunofluorescence staining showing the distribution of ECM proteins Collagen IV and Laminins in HuSLG and HuSMG spheroids and (n and o) their percentage positive populations. Magnification/Scale: 20×/100 µm. Statistical analysis was performed using one-way ANOVA with Tukey multiple comparisons test for RT-qPCR and data is presented as mean ± SE and normalized to GAPDH gene (n = 3). A two-tailed Student’s t-test was performed to compare between percentage spheroid populations between HuSMG and HuSLG groups and data is presented as mean ± SD for (n = 3), ns: non-significant, *p < 0.05, **p < 0.01, ***p < 0.001, ****p < 0.0001.
features. We found that HuSMG spheroids showed a significant upregulation of AMY-1 gene compared to the other cell lines (Supplemental Figure S5(a)); as well as higher amylase activity with or without stimulation with ISO in comparison with its 2D counterparts (Supplemental Figure S5(b)). Furthermore, we found an upregulation in the gene expression levels of ductal progenitor marker CK-5 expressed by HuSMG spheroids, whereas the HuSLG microstructures increased the expression levels of luminal ductal cell marker CK7 (Supplemental Figure S5(c) and (d)). Both HuSMG and HuSLG spheroids maintained a high ACTA-2 expression compared to NS-SV-AC spheroids; however, the HuSMG spheroids showed a ~three-fold higher mRNA expression than HuSLG 3D structures, consistent with results from the 2D cultured cells (Figure 5(d)).
Next, we performed immunofluorescence analysis on the HuSMG and HuSLG spheroids to test the extent and location of different proteins. The HuSMG spheroids exhibited a robust expression and characteristic cell membrane co-localization of acinar markers AQP-5 and ZO-1; however, with a low and cytoplasmic expression of NKCC-1 (Figure 5(e) and Supplemental Figure S5(e)). Additionally, cell polarization in the HuSMG spheroids was further confirmed by the co-localization of pan-cadherins and ZO-1 tight junction proteins (Supplemental Figure S5(f)). Noticeably, and since these are solid spheroid models and lack a lumen commonly seen in cystic organoids, the staining pattern often appears strongly on the outer cell surface of the spheroids giving an “apical out” appearance. To test if the HuSMG spheroids retained myoepithelial and mesenchymal cell populations, we stained them for α-SMA and vimentin respectively, both showing a strongly positive staining pattern (Figure 5(f) and Supplemental Figure S5(g)). Consistent with our 2D staining results, the HuSMG cells stained positive for pan-CKs (Supplemental Figure S5(h)). On investigating further, the ductal populations in the HuSMG spheroids, despite significant mRNA levels, we found a lack of CK5 expression, possibly due to loss of translation of progenitor features in long-term cultures (Supplemental Figure S5(i)). Nonetheless, the HuSMG spheroids showed the presence of several CK7+ cells and a few CK14+ cells in distinct spheroids similar to the observed cellular heterogeneity observed in the 2D cultures (Supplemental Figure S5(j)).
In contrast, the HuSLG spheroids, while exhibiting co-localization, displayed a significantly lower percentage of AQP-5 and ZO-1 positive spheroids, and poorly localized NKCC-1 marker (Figure 5(g)) consistent with results from 2D cultures (Supplemental Figure S5(k)). However, the limited epithelial cell populations in HuSLG spheroids were detected by co-localizing pan-cadherins and ZO-1 proteins (Supplemental Figure S5(l)). Interestingly, as opposed to the mRNA expression, a greater percentage of HuSLG spheroids expressed the SMA marker (Figure 5(h)) but showed comparable levels of mesenchymal marker vimentin circumventing the outer surface of the spheroids (Supplemental Figure S5(m)). Further, we found a loss of pan-CKs in HuSLG spheroids which was confirmed by the lack of CK5 and CK14 markers with a negligible number of CK7+ cells in the culture supporting 2D culture results and further confirming the lack of major ductal cell populations in HuSLG cell line (Supplemental Figure S5(n)–(p)). The versatility of the hydrogel system enabled us to stain hundreds of spheroids at once to quantify the positive percentage of each cell marker tested in both HuSMG and HuSLG spheroids (Figure 5(i)–(l) and Supplemental Figure S5(q)–(v)). Finally, since we observed different re-organization patterns of the HuSMG and HuSLG cells, we tested for cell-secreted ECMs that might contribute toward spheroid formation and matrix remodeling. Notably, the HuSLG spheroids expressed higher levels of salivary ECM proteins, such as collagen IV and laminins compared to HuSMG spheroids (Figure 5(m)–(o)). Collectively, these results further reinforce the heterogenous nature of immortalized cell lines expressing key SG transcripts and proteins along with the ability to distinctly re-organize to form multicellular spheroids within the AGHA-culture system.
Modeling radiation-induced SG damage using 3D spheroids
The multicellular features of human salivary spheroids instigated us to apply these cell models as tools to investigate radiation injury and treatment response in vitro. To this extend, as a proof-of-concept, and due to their predominant acinar-like properties, we tested the response of HuSMG spheroids to irradiation (IR) damage and treatment with the radioprotective agent WR-1065, an active form of FDA-approved drug amifostine that is clinically used to treat xerostomia. HuSMG cells were 3D cultured for 14 days until spheroid formation and were subjected to sham IR, a single dose of 15 Gy IR or treated with 4 mM WR-1065 30 min before and after radiation. Culture medium was replaced post-treatment, and readouts were taken at different time points to measure spheroid viability, cell markers, and morphology (Supplemental Figure S6(a)). Live/dead assay and confocal imaging were used to analyze the spheroids at 2 and 24 h post IR (Supplemental Figure S6(b)). Cell death was observed just after 2 h in the IR and the treated groups, leading to a decline in spheroid viability in both groups compared to the control group (Figure 6(a) and (b)). To observe the delayed effects of IR and radioprotection on the HuSMG spheroids, we repeated the Live/dead assay at 24 h post-IR. Confocal images showed significant cell death occurring in the outer cells of the radiated spheroids, which were comparatively lower in the treatment group (Figure 6(c)). Spheroid viability dropped from ~75% at 2 h post-IR to nearly 50% after 24 h in the radiation group compared to the treated spheroids, which maintained cell viability owing to the radioprotective effects of WR-1065 (Figure 6(d)).
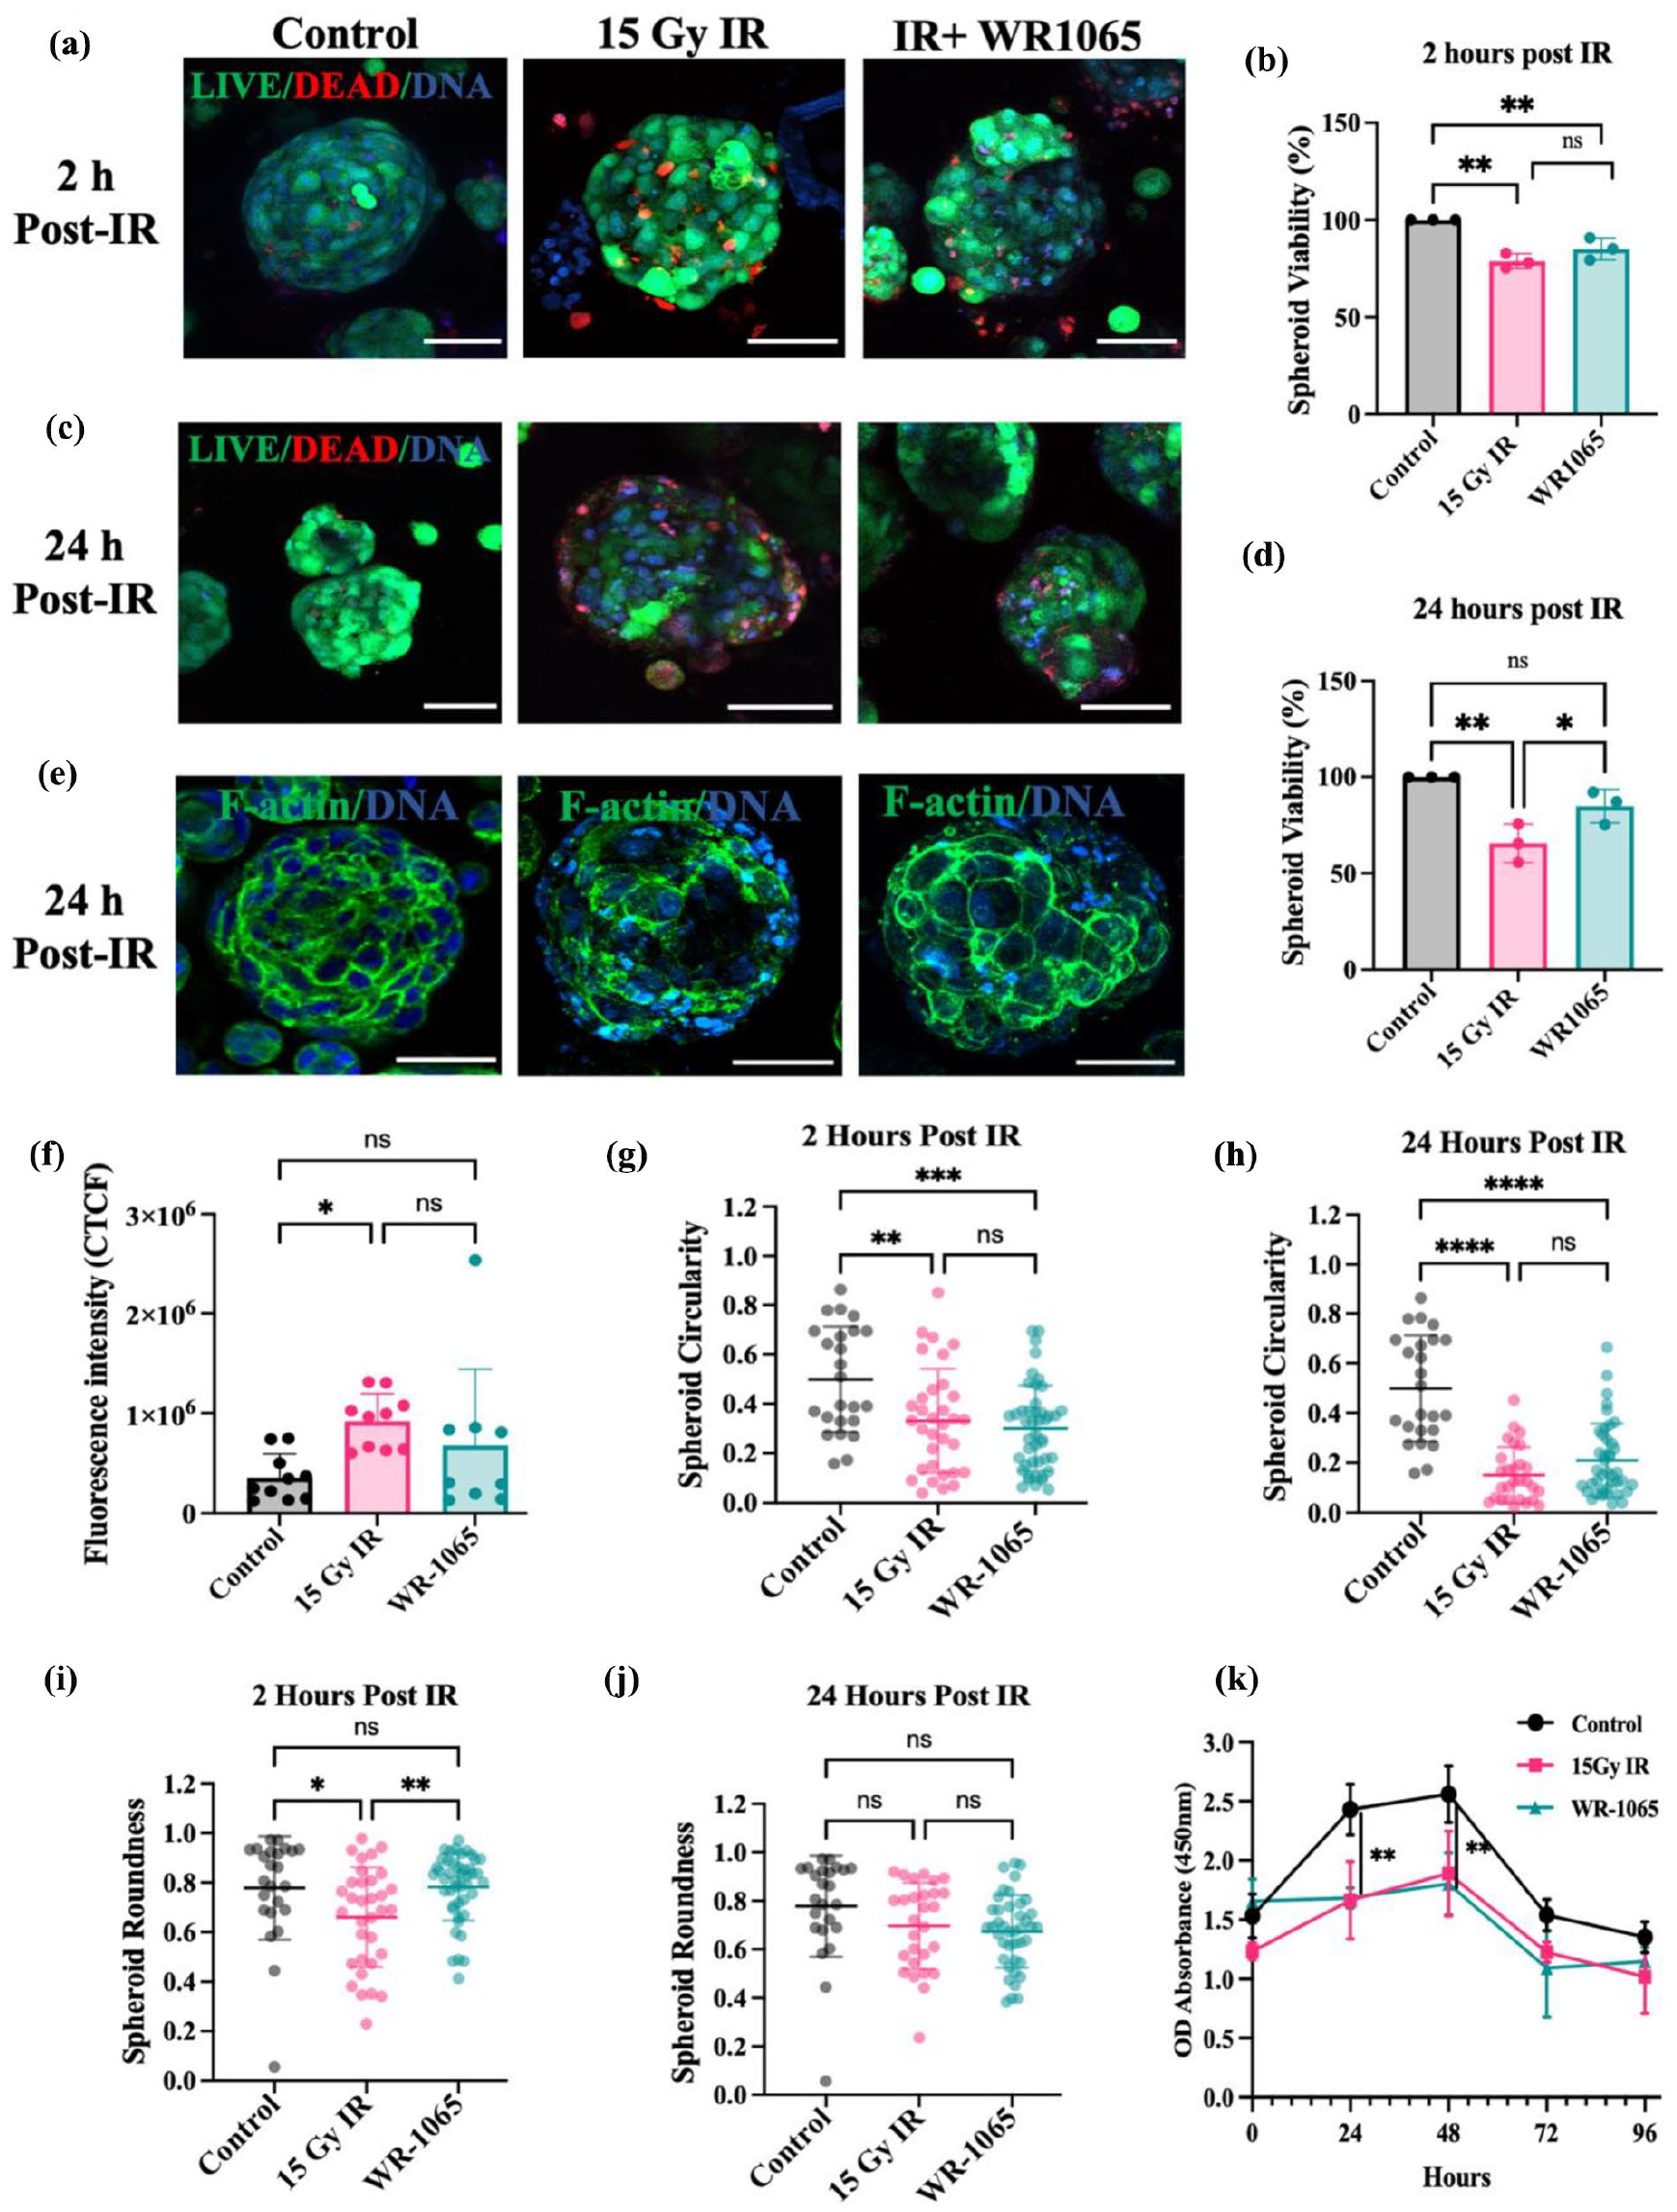
SG spheroids serve as in vitro models of radiation injury and treatment. (a) Live dead assay and confocal imaging of control, 15 Gy IR and WR-1065 treated SG spheroids at 2 h and (b) 24 h post-IR. (c and d) Quantification of spheroid viabilities of control, 15 Gy and WR1065 groups at 2 and 24 h, respectively (n = 15–30). (e) Confocal images of f-actin distribution in control,15 IR, and WR1065-treated SG spheroids at 24 h. and (f) Quantification of f-actin distribution as CTCF (n = 8–10). (g and h) Scatter plot quantifying spheroid circularity and (i and j) spheroid roundness post-irradiation in the control, 15 Gy IR and WR-1065-treated groups at 2 h (n = 24–45) and 24 h (n = 24–41), respectively. (k) WST-8 cell proliferation assay tracking spheroid metabolic activity every 24 h for the control, 15 Gy, and WR1065-treated spheroids over a 96 h period. Magnification/scale: 20×/50 um. Data is presented as mean ± SD, N ⩾ 3, N = hydrogel domes, n = number of spheroids analyzed per condition. Statistical analysis was performed using one-way ANOVA with Tukey multiple comparisons test. ns: non-significant, *p < 0.05 **p < 0.01, ***p < 0.001, ****p < 0.0001.
To further investigate the morphological differences between spheroid samples at 24 h post-IR, we stained cells for f-actin distribution to evaluate the spheroid cytoskeleton (Supplemental Figure S6(e)). While the control group showed the characteristic cell membrane localization of f-actin distribution seen in HuSMG spheroids, the radiated and treated spheroids showed disruption from the normal staining pattern and associated fragmentation (Figure 6(e)). CTCF values showed a significant increase in spheroids receiving 15 Gy IR, which was lower in the WR-1065 treated groups (Figure 6(f)). Additionally, to confirm cell disruptions and evaluate the loss of spheroid intactness, we analyzed the spheroid circularity and roundness values. Radiated HuSMG spheroids showed a significant decrease in circularities both at 2 and 24 h after IR and was not reversed by the radioprotective effects of WR-1065 (Figure 6(g) and (h)). This can be due to the initiation of cell death and, thereby disruptions on the outer surface of the spheroids after IR, which remains after WR-1065 treatment. While the radioprotective effects could prevent further damage and cell death in the spheroids, the circularity values remain unchanged, possibly due to a lack of clearance of the dead cells in the outer core of the spheroids.. Although there were significant differences in roundness values between radiated and treated spheroids early after IR, no significant changes were seen relative to control groups at 24 h (Figure 6(i) and (j)). In parallel, we used the WST-8 cell proliferation assay to track spheroid metabolic activity. A significant decrease in the metabolic activity of 15 Gy IR and WR-1065-treated spheroids was seen at 24 and 48 h after radiation, which was followed by a decrease in all groups reaching stable absorbance values at 96 h post-IR (Figure 6(k)).
To test how HuSMG spheroids respond to radiation and radioprotection by WR-1065, we fixed and stained the spheroids 48 h post-IR for detection of DNA damage response marker γH2AX, apoptotic marker caspase −3, and cell proliferation marker Ki-67. HuSMG spheroids receiving 15 Gy IR showed a robust expression of γH2AX on the outer surface of several spheroids, resembling the formation of nuclear apoptotic rings (Figure 7(a)). However, the γH2AX expression was largely pan-nuclear and, on quantification, showed significantly lower values in the WR-1065-treated group, indicating DNA damage protection (Figure 7(a) and (b)). Consequently, caspase 3, a key marker of cell apoptosis was also seen to be significantly elevated in the radiated spheroids, showing a strong nuclear expression in addition to the spheroid borders, which were seen to be lower in the treated groups (Figure 7(c)). Nonetheless, WR-1065-treated spheroids did not show a significant decrease in caspase 3 positive cell numbers, possibly due to the static nature of the culture system, where the previously dead cells remain in culture despite radioprotection to neighboring cells (Figure 7(d)).

SG spheroids serve as 3D models for studying radiation-induced DNA damage and repair. Whole-mount immunofluorescence staining and quantification respectively of showing (a and b) DNA damage marker γH2AX, (c and d) apoptotic marker caspase 3, and (e and f) cell proliferation marker ki-67 in HuSMG spheroids without irradiation (control/sham), subjected to 15 Gy irradiation and treated with WR-1065. Magnification/scale bar: 20×/100 µm, inset (25 µm). Data are presented as mean ± SD, n ⩾ 4. (g and h) Whole-mount immunofluorescence staining and quantification respectively of SG markers AQP-5/ZO-1 and (i and j) of CK7/CK14 markers in control, 15 Gy irradiated and WR-1065 treated HuSMG spheroids. Magnification/scale bar: 20×/100 µm. Data are presented as mean ± SD, n = 3. Statistical analysis was performed using one-way ANOVA with Tukey multiple comparisons test for quantifying γH2AX, caspase-3 and Ki67 cells/spheroid and using two-way ANOVA with Tukey multiple comparisons test for AQP5/ZO1+ and CK5/CK7+ spheroid quantification. *p < 0.05, **p < 0.01, ****p < 0.0001, ns = non-significant. (k) H&E staining performed on HuSMG spheroids under control (no IR), 15 Gy IR, or IR with WR-1065 showing small, condensed nuclei in affected cells (black arrows) Magnification/scale bar: 40×/20 µm.
To establish a correlation between cell death and remaining proliferating cells in our radiation injury spheroid model, we next stained the spheroids for the Ki-67 marker (Figure 7(e)). We did not see any significant differences in the Ki67 index of control and 15 Gy IR spheroids; however, there was a significant increase in the number of Ki67 positive cells observed in the IR + WR-1065 group (Figure 7(f)). The radioprotective effects of WR-1065, in addition to the higher proliferation rate of HuSMG cells compared to primary cells, may have contributed to the high Ki67 index in this group.
Next, we evaluated changes in SG markers in response to radiation injury and the radioprotective effects of WR-1065. HuSMG spheroids exposed to a 15 Gy single dose of radiation exhibited a significant loss of AQP-5 and ZO-1 markers. While AQP-5 expression showed partial recovery in the WR-1065-treated group, ZO-1 expression was completely lost and remained absent even after treatment (Figure 7(g) and (h)). We further assessed the effect of radiation on ductal populations by co-staining for CK7 and CK14 markers in the spheroids. As expected, control HuSMG spheroids displayed several CK7+ and a few CK14+ spheroids. However, radiation exposure caused a drastic decrease in these populations, leaving only a few CK7+ spheroids and resulting in a significant loss of CK14+ cells (Figure 7(i)). Notably, neither cell population showed recovery in the WR-1065-treated group, suggesting that WR-1065 does not provide radioprotection for these specific cell types (Figure 7(j)). Finally, we fixed and embedded our spheroids to test the histological differences in the radiated and treated spheroids. H & E staining revealed the presence of dark and condensed nuclei indicative of pyknosis both in the 15 Gy IR and the IR + WR-1065 treated groups (Figure 7(k)). Collectively, we used different tests and assays combined with confocal image-based analysis and showed that AGHA-cultured SG spheroids serve as novel tools for in vitro modeling of radiation injury. Additionally, our experiments support that these proof-of-concept radiation models can be applied for drug screening applications to test different therapeutic strategies for cell specific types for xerostomia alleviation.
Discussion
In this study, we successfully immortalized and characterized two novel human SG cell lines derived from normal (healthy, non-neoplastic) human major SGs. The first cell line, SMG-hu-0321 (annotated as HuSMG), was established from the SMG, while the second line, SLG-hu-1020 (annotated as HuSLG), was derived from the SLG. Both cell lines were generated by infecting a mixture of primary SG cells obtained from SMG and SLG tissues using SV40 lentiviral transduction. The polarized nature of salivary epithelial cells, coupled with the high toxicity associated with lipofection methods, necessitated the use of the SV40 lentiviral system for efficient immortalization.36,37 Despite these challenges, we successfully cultured and stably passaged these cell lines for over 25 passages. Given the frequent occurrence of cross-contamination or misidentification in immortalized cell lines, 22 we performed STR analysis to confirm the identity and uniqueness of the newly established cell lines. STR profiles were compared against global cell line STR databases such as ATCC, DSMZ, and CLAST, which include approximately 9000 cell lines. The results confirmed the unique profiles of the HuSMG and HuSLG cell lines, validating their authenticity. To further assess potential genetic drift caused by SV40 transduction, we conducted karyotyping of the cell lines. Endoreduplication and resulting polyploidy were observed in the new cell lines, likely induced by the SV40 oncogene, which can bypass mitotic divisions and increase DNA content in cells. 38 Similar phenomena have been reported in other immortalized cell lines transduced with SV40 large T (LT) genes. 39 Interestingly, this mechanism of endoreduplication is utilized by Drosophila SG cells during gland development and for secretory function. 40 However, our findings emphasize the importance of monitoring immortalized cell lines for potential genetic transformations, especially during long-term culture.
Although cell lines cannot fully replicate the complex features of primary cells, particularly in SGs, where functional secretory cells are highly differentiated and challenging to maintain in vitro, these newly developed cell lines provide a valuable alternative. 41 They exhibit diverse SG marker expression, encompassing acinar, ductal, and myoepithelial origins, making them a promising resource for protocol optimization and high-throughput assays. The HuSMG cell line predominantly expressed acinar markers, including AQP-5, ZO-1, and NKCC-1, alongside a subset of ductal and myoepithelial markers such as CK7, CK14, and α-SMA. In contrast, the HuSLG cell line displayed lower expression of acinar markers, with only a small subset of cells positive for AQP-5 and ZO-1, likely reflecting the limited number of primary SG acinar cells transduced during establishment. Similarly, HuSLG cells exhibited minimal ductal populations in 2D cultures, with only a few CK7+ cells but a prominent and distinct expression of α-SMA, indicative of myoepithelial cells. Neither cell line maintained lineage-restricted progenitor markers like Mist-1 and CK-5, likely due to the loss of progenitor features during extended SV40-mediated immortalization, a phenomenon observed in other progenitor cell types.42,43 Interestingly, HuSMG cells retained noticeable levels of the ductal progenitor marker CK14, which appeared resistant to SV40-induced transformations. As with other epithelial cell types, extended culture passages can influence phenotype, potentially inducing EMTs. 44 Co-staining the cell lines with epithelial marker E-cadherin and the mesenchymal marker vimentin revealed a dynamic, dot-like distribution of cadherins along cell membrane-associated actin bundles, alongside a cytoskeletal pattern of vimentin expression. These observations align with patterns reported in other transformed cell lines, where epithelial and mesenchymal phenotypes coexist in a dynamic interplay driven by culture conditions and the extent of cellular transformation. 45
Reflecting their cellular heterogeneity and respective tissue origins, the HuSMG and HuSLG cell lines demonstrated distinct functional characteristics. Consistent with the properties of native SG tissues, HuSMG cells exhibited higher expression of amylase proteins, indicative of their acinar-like features, while HuSLG cells predominantly expressed mucin, aligning with their mucous-rich profile. 46 Further functional analysis of agonist-induced calcium influx revealed that HuSMG cells responded to both muscarinic and adrenergic agonists, showing robust intracellular Ca²⁺ release consistent with their acinar phenotype. In contrast, HuSLG cells exhibited limited Ca²⁺ release in response to adrenergic stimulation, likely reflecting their inherently lower acinar cell populations. These findings underscore the functional diversity retained by these cell lines, mirroring key aspects of native SG tissue.
Over the past decades, 3D culture techniques have become a cornerstone of SG tissue engineering, demonstrating promising results in preserving functional markers and closely mimicking the native tissue environment.30,47 However, many of these advances have relied on the use of complex matrices such as Matrigel, which is derived from mouse tumors and poses challenges to the translational potential of derived products. 48 Moreover, extracellular matrices like Matrigel or basement membrane extract (BME) are characterized by lot-to-lot variability and a lack of tunability, limiting their suitability for generating tissue-specific matrices. 49 We recently established an AGHA-based biomimetic system, biomechanically replicating human SG tissues, consisting of a blend of alginate, gelatin, and HA for the expansion and culture of SG acinar cells. 31 By using AGHA-based hydrogel and the new cell lines, we established SG spheroid models, which exhibited the ability to proliferate and form large 3D microtissues within 14 days of culture. To evaluate the shape and intactness of spheroids within 3D microenvironment, parameters such as surface area projection, roundness, and circularity values are calculated.50,51 Additionally, these parameters may vary depending on the ECM properties, the type of cells and their origin. 52
While the HuSMG re-organized as compact, circular and smooth spheroids, the HuSLG cells showed a preference to form tubular or sheet-like microtissues in addition to spheroids. It is well known that cell-matrix reciprocity within hydrogels relies on the cell type-specific signaling and subsequent remodeling of ECM. 53 We hypothesize that since the HuSLG cells presented high expression of SMA and vimentin, the cell-mediated remodeling of gelatin and HA would be different in HuSLG spheroids compared to the acinar and ductal cells present in HuSMG spheroids, which predominantly may reorganize via CD44-mediated interactions with HA. 54 This model of cell organization has been observed with other vascular smooth muscle cells which reorganize to form vessel-like structures owing to their contractile phenotype.55,56 While the ability of salivary gland epithelial, acinar or progenitor cells to reorganize into 3D structures within HA hydrogels has been well established in previous works.54,57,58 We confirmed the multicellular nature of both HuSMG and HuSLG cell lines in a highly tunable 3D culture system using AGHA hydrogels, by validating the expression of acinar, ductal, myoepithelial, progenitor, and mesenchymal cell populations within the spheroids. Additionally, supporting our previous work, salivary cell lines significantly improved the expression of functional markers, such as AQP5 and AMY-1, in 3D hydrogels compared to 2D cultures.
Radiation injury to SGs causes irreversible damage to key salivary cell types and no therapeutic cure exists to treat permanently damaged SGs. 59 Recently, tissue array chips have been proposed as in vitro platforms to run high throughput assays for SG therapeutic discovery. 34 We combined novel SG cell lines and tunable hydrogels and employed the simple hanging-drop technique to produce hydrogel domes forming several SG spheroids without the hassle of 3D printing or other biofabrication requirements. Using live cell imaging, immunodetection, and confocal analysis, we demonstrated that salivary spheroids respond to IR by inducing cell death, starting in the outer surface of the 3D structures, and then spreading into the tightly packed cells interior to the surface. Furthermore, similar to other reports, we confirmed the efficacy of WR-1065, an active form of amifostine, as SG spheroid radioprotector, where SG microtissues were protected and rescued from extensive damage due to IR injury. 60 Damage to salivary cell membranes due to IR was evidenced by disruption and an increase in expression of filamentous actin. This can potentially be attributed to the polymerization and thickening of actin stress fibers also seen in other mammalian cell types, including mice SG cells post radiation.61,62 Further, we observed that non-treated spheroids showed significant DNA damage and cell death, as evidenced by high expressions of γH2AX and caspase-3 markers, respectively. These results correspond to results from other in vitro models against radiation induced cell and DNA damage.34,63 It has been observed that high levels of Ki-67 marker in several types of cancers and cell types are associated with radiosensitivity.64,65 We observed elevated Ki-67 levels in the radiated spheroids that received treatment with WR-1065, potentially due to the radiosensitive nature of salivary cells, partial radioprotection offered by WR-1065, and the highly proliferative nature of cell lines as opposed to SG primary or progenitor cells.
To assess the detrimental effects of radiation on SG-specific markers, we performed immunostaining of key acinar and ductal cell populations found in the HuSMG spheroids. A 15 Gy single dose of radiation resulted in a significant loss of AQP-5 and ZO-1, key markers of acinar cell functionality and epithelial integrity, respectively. Although WR-1065 treatment led to partial recovery of AQP-5 expression, the ZO-1 proteins were completely lost even after radioprotective intervention. This suggests that while WR-1065 may offer some protection for specific acinar features, it fails to restore epithelial polarity disrupted by radiation, previously also confirmed by actin disruptions. Radiation also severely affected ductal cell populations, as indicated by the drastic reduction in CK7+ and CK14+ spheroids. The absence of recovery for these markers in the WR-1065-treated group suggests the limited efficacy of WR-1065 in protecting ductal cell populations. Together, these results suggest that while WR-1065 provides partial protection for certain acinar characteristics, it may be insufficient for comprehensive radioprotection of SG cells, particularly for epithelial integrity and diverse cell populations. This underscores the need for more effective radioprotective strategies to mitigate the broad impact of radiation on SG cells and tissues.
Conclusions
In summary, we successfully established and characterized two novel immortalized human SG cell lines through lentiviral transduction. These cell lines demonstrate the ability to recapitulate key characteristics and functional features of native human SG cells, providing valuable alternative cell sources for in vitro SG research. Additionally, we utilized AGHA hydrogels to develop and characterize distinct SG spheroid models capable of expressing functional SG-specific markers. Finally, we demonstrated that these bioengineered SG spheroids serve as innovative tools for studying radiation-induced injury in vitro and offer versatile platforms with a potential for evaluating the efficacy of therapeutic drugs and small molecules.
Supplemental Material
sj-docx-1-tej-10.1177_20417314251326667 – Supplemental material for Development of human salivary gland cell lines for modeling radiation-induced damage in three-dimensional spheroid cultures
Supplemental material, sj-docx-1-tej-10.1177_20417314251326667 for Development of human salivary gland cell lines for modeling radiation-induced damage in three-dimensional spheroid cultures by Sangeeth Pillai, Jose G. Munguia-Lopez, Younan Liu, Jordan Gigliotti, Anthony Zeitouni, Joseph M. Kinsella and Simon D. Tran in Journal of Tissue Engineering
Footnotes
Acknowledgements
The authors would like to thank Dr. Amalia Dutra and Dr. Evgenia Pak at the National Human Genome Research Institute, NIH, USA for their help and assistance with karyotyping experiments. The authors thank Dr. Masayuki Azuma for providing the NS-SV-AC cell line. Additionally, the authors thank Genome Quebec for their assistance with the STR analysis of the cell lines used in this work.
Ethical approval statement
Use of human samples were approved and conducted according to the guidelines by the McGill Institutional Review Board (IRB) for the project “Tissue engineering an artificial salivary gland device” study number—A05-M62-05B.
Funding
The author(s) disclosed receipt of the following financial support for the research, authorship, and/or publication of this article: This work was supported by funding from the Natural Sciences and Engineering Research Council of Canada (NSERC) fund RGPIN-03615 and Canada Research Chairs fund 262076 to SDT, Fonds de recherche Quebec Sante (FRQS) doctoral award 304367 to SP.
Declaration of Conflicting interests
The author(s) declared no potential conflicts of interest with respect to the research, authorship, and/or publication of this article.
Data availability statement
All datasets generated or analyzed during the current study are included in this published article and its Supplemental Information. Additional experimental details and data used or analyzed in this study are available from the corresponding author upon reasonable request.
Supplemental material
Supplemental material for this article is available online.
References
Supplementary Material
Please find the following supplemental material available below.
For Open Access articles published under a Creative Commons License, all supplemental material carries the same license as the article it is associated with.
For non-Open Access articles published, all supplemental material carries a non-exclusive license, and permission requests for re-use of supplemental material or any part of supplemental material shall be sent directly to the copyright owner as specified in the copyright notice associated with the article.