
Abstract
Human cerebral organoids (hCOs) offer the possibility of deepening the knowledge of human brain development, as well as the pathologies that affect it. The method developed here describes the efficient generation of hCOs by going directly from two-dimensional (2D) pluripotent stem cell (PSC) cultures to three-dimensional (3D) neuroepithelial tissue, avoiding dissociation and aggregation steps. This has been achieved by subjecting 2D cultures, from the beginning of the neural induction step, to dual-SMAD inhibition in combination with CHIR99021. This is a simple and reproducible protocol in which the hCOs generated develop properly presenting proliferative ventricular zones (VZs) formed by neural precursor and radial glia (RG) that differentiate to give rise to mature neurons and glial cells. The hCOs present additional cell types such as oligodendrocyte precursors, astrocytes, microglia-like cells, and endothelial-like cells. This new approach could help to overcome some of the existing limitations in the field of organoid biotechnology, facilitating its execution in any laboratory setting.
Keywords
Introduction
Human cerebral organoids (hCOs) are three-dimensional (3D) tissues generated from human pluripotent stem cells (hPSCs) capable of recapitulating the cellular and structural complexity of the developing human brain.1 –3 The use of hCOs is contributing enormously to a better understanding of aspects related to neurodevelopmental and neurodegenerative diseases,1,4,5 neuropsychiatric disorders,6,7 and as a model of brain tumors 8 or infectious diseases.9 –11 Furthermore, hCOs generated from patient induced pluripotent stem cells (iPSCs) or from genome edited hPSCs, allow obtaining models for the study of neuropsychiatric and neurodegenerative diseases in addition to drug testing.12,13
A variety of methods have been developed to obtain hCOs, highlighting the unguided protocols which result in organoids that generate different brain regions spontaneously1,2,14 while guided protocols generate organoids from a specific brain region through the use of different patterning factors.15 –22 Although these protocols have been a major advance in the field, they are still complex and need to be refined in some aspects. One drawback is that most of the protocols have failed to recapitulate all the cell types that make up the brain, missing cells as important as astrocytes, oligodendrocytes, microglia, or endothelial cells, which limits the use of hCOs for disease modeling or drug testing.3,23
Another important aspect to improve is the considerable variability and heterogeneity between different batches of hCOs obtained. This can be due, in part, to variations in the efficiency of neuroectodermal differentiation of embryoid bodies (EBs),3,23,24 which constitute a bottleneck in the generation of hCOs affecting the efficiency and homogeneity of hCOs.
Here, we describe a new approach to generate hCOs, in which dissociation and aggregation steps of EBs is not required; instead, we perform neural induction in adherent human embryonic stem cells (hESCs) cultures, going directly from a 2D to 3D model. We have achieved this by strategically combining dual SMAD inhibition with the appropriate dose of CHIR99021 (CHIR; a GSK3 inhibitor/Wnt activator) generating neuroepithelial tissue that subsequently give rise to properly developed hCOs. These hCOs contain a high cellular diversity including neural progenitors, different types of neurons, astrocytes, oligodendrocyte precursor cells (OPCs) along with cells of microglial-like, and endothelial-like lineages.
This is a simple and reproducible method in any laboratory setting. We believe that this methodology may have great potential to generate hCOs for use as a model to study human brain development and disease, as well as for drug testing.
Methods
Cell culture: Human pluripotent stem cells (hPSCs)
hESCs (AND-2 cell line) were obtained from the “Biobanco de células madre de Granada” (ISCIII, Spain). This cellular line was verified to be free of mycoplasma contamination and cultured on Mouse Embryonic Fibroblasts (MEFs). MEFs were mitotically inactivated by overnight treatment with mitomycin C (1 μg/ml; Sigma, M0503-2MG) under standard conditions and plated at a density of approximately 16,000 cells/cm2 to use them as feeders for cultures. AND-2 culture was maintained on MEFs (see schematic representation in Figure 1) in hESC medium [KnockOut DMEM (Gibco, 10829-018), with 20% Serum Replacement (Gibco, 10828-028), 2 mM L-Glutamine (L-Glut; Lonza BE17-605E), 1× Non-Essential Amino Acids (NEAA; Gibco, 11140-050), 50 U/ml Penicillin/Streptomycin (Lonza, DE17-602E), 50 µM 2-mercaptoethanol (Gibco, M6250)] and supplemented with 10 ng/ml Fibroblast Growth Factor 2 (FGF2; PetroTech, AF-100-18B), and 5 µM ROCK Inhibitor Y-27632 (Y; Tocris, 129830-38-2). Fresh medium was changed every other day until isolated AND-2 colonies presented small-medium size. Plates were incubated at 37°C and 5% CO2.

Generation of hCOs by direct induction of neuroepithelium in hESC colonies. (a) Schematic representation of the main stages for hCOs generation and timeline of the different media and factors employed. Representative bright-field images of the morphological features of the different developmental stages of the hCOs: hESC colonies in proliferation; Neural induction stage, 3D structures detaching from the plate; 3D neuroepithelial-like structures transferred to a new low-adhesion plate (suspension) in neural induction; Differentiating hCOs; hCOs in maturation (maintenance medium). Scale bar = 100 µm. (b) Representative bright-field images of the morphological changes during neural induction progression of the hESCs: hESCs in proliferation; hESC colonies in neural induction begin to differentiate producing tissue remodeling (white arrows); 3D structures are generated from the colonies and start to detach from the plate; 3D structures (in suspension) with neuroepithelial-like border (white square). Scale bar = 100 µm. (c) Representative images of the neuroepithelial structures immunostained for Ki67, Sox2, Vimentin, and Nestin (green). Nuclei are stained in blue with Höechst. Scale bar = 50 µm. (D) Absolute quantification by RT-qPCR of MKI67, SOX2, VIM, and NES gene expression in neural induction stage. Data represent mean ± SD (n = 4 for each experiment; results were confirmed in two independent experiments). White dashed lines mark the structures to show the neuroepithelium.
Generation of hCOs directly from hESCs
On day 0 hESC medium was substituted by neural induction (NI) medium. NI medium was adapted from previous protocols.25 –27 This is composed by N2 medium [DMEM:F12 with GlutaMAX (Gibco, 31331-028), 6 mg/ml D-Glucose (Merck, 104074), 1× N2 Supplement (Gibco, 17502-048), 2.6 mg/ml AlbuMAX (Gibco, 11020-021), 5 mM HEPES (Gibco, 15630-056), 50 U/ml Penicillin/Streptomycin (Lonza, DE17-602E), 1× NEAA (Gibco, 11140-050)], and NB medium [Neurobasal medium (Gibco, 21103-049) with 1× B27 Supplement without Vitamin A (Gibco, 12587-010) and 2 mM L-Glut (Lonza, BE17-605E)] 1:1 with 0.1 mM L-Ascorbic Acid (Sigma, A4544), 10 µM SB-431542 (Tocris, 301836-41-9), 50 ng/ml Noggin (PetroTech, 120-10C), 28 and 3 µM CHIR99021 (CHIR; Tocris, 252917-06-9).
Different concentrations of CHIR (1, 2, 3, and 10 μM and vehicle = DMSO) were tested on hESCs. Only the 3 µM concentration was effective for the formation of neuroepithelial 3D structures from the cell colonies (Supplemental Figure S1).
Medium was renewed every other day until approximately day 7, when 3D structures started to detach from the plate. These 3D structures were collected by pipette and transferred into an ultra-low attachment 6-well plate (Corning, CLS3471), they were maintained on floatation in NI medium for 5 days more. On the twelfth day, when the floating 3D structures achieved a spheroid shape, NI medium was changed to differentiation medium [N2 medium and NB medium 1:1 with 1.3 μg/ml Insulin (Sigma, I9278)].1,2 After 7 days of growth in differentiation medium, the hCOs were subjected to maintenance medium [N2 medium and NB medium (but with B27 Supplement with Vitamin A (Gibco, 17504-044)) 1:1 with 1.3 μg/ml Insulin].1,2 These hCOs were grown and maintained for up to 2 months.
Histology and immunohistochemistry (IHC)
For the stages of neural induction, differentiation, and maturation (1 and 2 months), hCOs were fixed in 4% paraformaldehyde (PFA; Sigma, P6148) for 15 min at 4°C followed by washing with PBS (Lonza, 17-515Q) three times for 5 min. Tissues were left in 30% sucrose (Merck, 107654) overnight and then embedded in 7.5% gelatin (Merck, 104070)/15% sucrose and frozen with isopentane (VWR, 24872) until used. About 15 μm sections were then obtained using a Cryostat (Leica).
For IHC, sections were blocked and permeabilized in Blocking solution (0.25% Triton X-100 (BioRad, 161-0407), 5% Normal Horse Serum (NHS; Gibco, 2493028), and 0.1% BSA (Sigma, A7906) in PBS) for 1 h at room temperature (RT). Sections were then incubated with primary antibodies in Blocking solution overnight at 4°C: rabbit anti-Ki67 (1:250, Thermo Scientific, MA5-14520), rabbit anti-Sox2 (1:1000, Millipore, AB5603), mouse anti-Vimentin (1:500, Santa Cruz, SC-6260), rabbit anti-Nestin (1:200, Sigma, N5413), goat anti-DCX (1:100, Santa Cruz, SC-8066), mouse anti-βIIITubulin (1:500, Biolegend, 801202), mouse anti-MAP2 (1:200, Sigma, M4403), rabbit anti-SYN1 (1:200, Millipore, AB1543), mouse anti-GFAP (1:1000, BD Pharmigen, 556327), rabbit anti-S100β (1:100, Abcam, ab52642), rabbit anti-IBA-1 (1:400, Wako, 019-19741), mouse anti-CNPase (1:200, Millipore, MAB326), rabbit anti-VEGFR2 (KDR; 1:100, Cell Signaling, 2479) and rat anti-CD31 (1:50, BD Pharmigen, 553370).
After removal of primary antibody, tissues were washed (0.25% Triton X-100 in PBS) and incubated for 1 h at RT with one of the corresponding secondary antibodies: donkey anti-rabbit Alexa Fluor 448 (1:500, Invitrogen, A21206), donkey anti-mouse Alexa Fluor 448 (1:500, Invitrogen, A21202), donkey anti-mouse Alexa Fluor 555 (1:400, Invitrogen, A31570), donkey anti-goat Alexa Fluor 555 (1:400, Invitrogen, A21432), and goat anti-rat Alexa Fluor 555 (1:400, Invitrogen, A21434). Finally, nuclei were stained with Höechst 33258 (Invitrogen) diluted in PBS (1:500) for 5 min at RT. Samples were analyzed under a fluorescence microscope (Leica DM IL LED). Analysis and photographs of fluorescent-immunostained sections were carried out using a confocal microscope (Leica SP5) and a fluorescence microscope (Leica DM IL LED) coupled to a camera Leica DFC 345 FX. In all experiments, digitalized images were captured using Leica LAS V4.0 software.
RNA isolation and RT-qPCR
Total RNA was isolated from hCOs with the RNeasy Mini extraction kit (Qiagen, 74104) according to manufacturer’s instruction and treated with DNAses to avoid amplification of undesired genomic DNA. 1 µg of total RNA was reverse-transcribed at 25°C for 10 min, 50°C for 60 min, and 75°C for 10 min, in a 20 μl reaction mixture using SuperScriptIII-RT (Invitogen, 56575). Relative amounts of cDNA were quantified by RT-qPCR using the PowerUp SYBR-green system (Applied Biosystems, A25742) according to the manufacturer’s protocol. 10 ng of total cDNA and 10 μM of primers were used in a 15 μl reaction mixture. RT-qPCR were performed using primers for the human target genes: MKI67 (Forward: TGACCCTGATGAGAAAGCTCAA; Reverse: CCCTGAGCAACACTGTCTTTT), SOX2 (Forward: GGGGGAATGGACCTTGTATAG; Reverse: GCAAAGCTCCTACCGTACCA), NES (Forward: GAGGTGGCCACGTACAGG; Reverse: AAGCTGAGGGAAGTCTTGGA), VIM (Forward: TACAGGAAGCTGCTGGAAGG; Reverse: ACCAGAGGGAGTGAATCCAG), DCX (Forward: GGATCCAGGAAGATCGGAAG; Reverse: TTGTCTGAGGAACAGACATAGCT), TUBB3 (Forward: GCAACTACGTGGGCGACT; Reverse: ATGGCTCGAGGCACGTACT), MAP2 (Forward: ATCTCTTCTTCAGCACGGCG; Reverse: CAGGGGTAGTGGGTGTTGAG), SYN1 (Forward: GACGGAAGGGATCACATCAT; Reverse: CTGGTGGTCACCAATGAGC), GFAP (Forward: GTTCTTGAGGAA-GATCCACGA; Reverse: CTTGGCCACGTCAAGCTC), AIF1 (Forward: TTAATGGAAATGGCGATATTGA; Reverse: TTCTTTAGCTCTAGGTGAGTCTTGG), OLIG2 (Forward: ATCGCATCCAGATTTTCGGGT; Reverse: CCAGGGGAAGATAGTCGTCG), NG2 (Forward: CCTTGGCTTTGACCCTGACTA; Reverse: CAGGTGGTTCTCACCGAAGA), S100B (Forward: GGAAGGGGTGAGACAAGGA; Reverse: GGTGGAAAACGTCGATGAG), MBP (Forward: AGCGCACCTGTGATTGATAG; Reverse: AAGACGCGTTTTGGCATCAC), MOG (Forward: TTTTGATCCCCACTTTCTGAGG; Reverse: CGTAGCTCTTCAAGGAATTGCC), PLP1 (Forward: GGCTAGGACATCCCGACAAGTT; Reverse: ACAGCAGAGCAGGCAAACAC), GALC (Forward: CTCAGTGCCGTCTGTTGTC; Reverse: TACCCAGAGCCCTATCGTTC), PDGFRA (Forward: TACACTTGCTATTACAACCACA; Reverse: ATCCTCCACGATGACTAAAT), O4 (Forward: GTGGCGGATCGAGTTCTTC; Reverse: CTCATCAGCCAGGCCATTG), P2RY12 (Forward: GATGCCACTCTGCAGGTTG; Reverse: GTGCACAGACTGGTGTTACC), CX3CR1 (Forward: CTTACGATGGCACCCAGTGA; Reverse: CAAGGCAGTCCAGGAGAGTT), KDR (Forward: GGCCCAATAATCAGAGTGGCA; Reverse: CCAGTGTCATTTCCGATCACTTT), PECAM1 (Forward: AACAGTGTTGACATGAAGAGCC; Reverse: TGTAAAACAGCACGTCATCCTT), ICAM1 (Forward: ATGCCCAGACATCTGTGTCC; Reverse: GGGGTCTCTATGCCCAACAA), CD68 (Forward: CGAGCATCATTCTTTCACCAGCT; Reverse: ATGAGAGGCAGCAAGATGGACC), and housekeeping gene TBP (Forward: GAGCTGTGATGTGAAGTTTCC; Reverse: TCTGGGTTTGATCATTCTGTAG).
The Applied Biosystems QuantStudio 3 Real-Time PCR System was used to determine the levels of target mRNA in each sample, estimated by absolute quantification (standard curve method) or relative quantification (2−ΔΔCt method). In both analysis, relative gene expression levels were normalized against TATA-binding protein (TBP) levels in each sample.
hCOs diameter and area
The different measures of hCOs and VZ diameter and area were carried out using ImageJ. The measures of the hCOs diameter and area were performed in bright-field images of the hCOs in neural induction (floatation), differentiation, and maturation stages. Results are shown as the mean ± SD of 11–14 different hCOs (n = 11–14 hCOs/condition).
The measures of VZ diameter and area were done using immunoreactivity images of the hCOs, where the VZs were clearly delimited, for NI (floatation), differentiation, and maturation stages (1 and 2 months) stages. Results are shown as the mean ± SD of 11–13 different VZs (n = 11–13 VZs/condition). For diameter measures, a mean was done between the longest and the shortest diameter of each hCO.
Statistical analysis
Statistical tests were run using GraphPad Prism 9. Results are shown as the average ± SD of data from three to four experiments (n = 3 or 4). Mean values were compared using the one-way ANOVA for multiple comparison. p Values <0.05 were considered to be statistically significant (*p < 0.05; **p < 0.01; ***p < 0.001; and ****p < 0.0001).
Single-cell RNA-seq sample preparation, experiment, and data analysis
A batch of AND-2 organoids at 4 weeks of maintenance, cultured in multiwell plates, were collected with the aid of a pipette and treated with HBSS (Hank’s Balanced Salt Solution; 1×, Gibco, #14180046) for 15 min. The organoids were centrifuged (3 min at 600 rpm) and digested with trypsin (0.025%, Gibco) for 20 min at 37°C and trypsin inhibition with 1:1 DMEM:F12 + 10% FBS. Subsequently, the dissociated and individual cells were centrifuged (3 min at 600 rpm) and resuspended in a buffered solution of BSA (0.04%, Sigma) in PBS at 4°C. Counting and viability was assessed using Trypan blue staining.
The single cell library was prepared according to manufacturer’s instructions using the 10× Genomics Chromium Single Cell 3’ Library & Gel Bead Kit v3.1 (10× Genomics) workflow by the Genomics Unit of the Instituto de Salud Carlos III. The Chromium Controller was run according to the protocol producing the single cell gel beads in emulsion mixture and the libraries were quality tested using a 2100 Bioanalyzer Instrument (Agilent). cDNA library was sequenced on the Novaseq 6000Dx sequencer (Illumina) obtaining a total of 273,571 raw reads. Raw scRNA-seq output was processed in order to generate a count matrix with CellRanger Count (v6.1.2, 10× Genomics), which performed read alignment using STAR with GRCh38 human reference genome with a mapping rate of 95%. The observed number of cells sequenced from CellRanger was 11,139 cells with identification of 21,669 genes.
Data analysis was performed using the Seurat (v4.0) package in R. The count matrix was filtered removing from further analysis: any feature that was expressed in less than three cells, any cell with <200 expressed genes, any cell with more than 17% mitochondrial genes expressed, or any cell with less than 20,000 total UMI counts. The post-processing data, corresponding to 11,079 cells (with genes per cell ranging from 261 to 10,251), were normalized using sctransform. We perform PCA with the scaled data and the shared nearest-neighbor graph was constructed with dims = 1:18. To cluster the cells we apply the Louvain algorithm, choosing as optimal the resolution of 0.4 to generate the clusters. Data visualization was done by using the Uniform Manifold Approximation and Projection (UMAP) and cell type assignment for each cluster was defined by interpreting the expression of known specific cell-type marker genes. All data plotting and analysis were performed in R (https://www.r-project.org/).
To further confirm correct patterning of the organoids, we used VoxHunt (v1.0.1). To select a suitable developmental stage for detailed voxel visualization of spatial similarity patterns, we compute the correlation of each cell in the scRNAseq clusters to the structure from fetal developmental stages E11.5–E18.5 of the Allen Developing Mouse Brain Atlas.
Results
Generation of hCOs by direct induction of neuroepithelium in hESC colonies
To promote neuroectodermal differentiation, hESCs growing on feeder cells were directly subjected to neural induction (NI) medium (Figure 1(a)). NI medium was modified from previous protocols25 –27 and supplemented with L-Ascorbic acid, SB-431542 (TGF-β pathway inhibitor; 10 µM), and Noggin (inhibitor of BMP signaling; 50 ng/ml). 28 In addition, the small molecule CHIR99021 (CHIR; an activator of Wnt signaling and GSK3 inhibitor; 3 µM) was added. Previously, several concentrations of CHIR, based on previous results from the group, were tested. The most effective dose to obtain neuroepithelial-like structures was 3 µM (Supplemental Figure S1). The lowest doses of CHIR failed to induce neuroepithelium, and the highest concentrations resulted in cell death, indicating that the CHIR dose is the limiting factor in this process.
After 5–7 days in NI medium, many 3D structures began to protrude from the hESC colonies; they were transferred to a low-adherence plate to be kept suspended in NI medium for another 5–6 days. As shown in Figures 1(a) and (b), these 3D structures showed a dense core with a transparent border along the entire periphery reminiscent of neuroepithelium (the tissue that gives rise to hCOs). These neuroepithelial-like aggregates were subsequently cultured in differentiation medium1,2 for 6 days and finally transferred to maintenance medium1,2 (Figure 1(a)).
In order to verify the neuroepithelial nature of the 3D structures generated, some of them were selected and kept in suspension until they acquired a rounded shape (white square in Figure 1(b)). After processing, we observed that these tissues contained proliferative cells (positive for the cell cycle marker Ki67) and abundant immunoreactivity for the neural precursor markers Sox2, Vimentin, and Nestin (Figure 1(c)). These data were corroborated by RT-qPCR at gene expression level (Figure 1(d)).
The efficiency of neuroepithelial induction with this protocol was almost 100% (97.54 ± 2.45%) as neuroepithelial tissue is generated directly in the plate and can be manually selected and collected under the microscope. Furthermore, this method is highly productive, it allows for the generation of a large amount of hCOs, since cell colonies can produce several rounds of neuroepithelial tissue. In addition, this protocol has been used successfully for obtaining hCOs from several lines of human iPSCs (hiPSCs; Supplemental Figure S2) which confirms its reproducibility.
Evolution of hCO morphology and ventricular zones (VZs) over time
To study the evolution of these neuroepithelial-like aggregates and whether they could generate hCOs correctly, they were cultured in differentiation medium and subsequently switched to maintenance medium until the desired culture times.
Bright field images showed that the differentiating hCOs presented a spherical morphology with smoothed edges and translucent areas (dashed white lines), being homogeneous with respect to each other (Figure 2(a)). In the maturation stage, the organoids started to acquire a denser appearance and also progressively increased in size reaching a diameter of 0.33 ± 0.04 mm and an area of 0.081 ± 0.019 mm2 (Figure 2(b)).

hCOs morphology and development of the ventricular zones (VZs) during differentiation and maturation. (a) Representative bright-field images of hCOs in differentiation, and maturation (1 and 2 months). VZs are marked with white dashed lines. (b) Individual hCO diameter and area (black dots) and the mean (horizontal line) ± SD (n = 11–14 hCOs/condition) are plotted. (c) Immunoreactivity for Ki67 and Sox2 (green) of VZs in differentiating and maturating (1 and 2 months) hCOs. Nuclei are stained in blue with Höechst. (d) Relative quantification by RT-qPCR of MIKI67 and SOX2 gene expression in neural induction, differentiation and maturation (1 and 2 months) of hCOs. Data represent mean ± SD (n = 4 for each experiment; results were confirmed in two independent experiments). Statistical analysis was performed using one-way ANOVA (multiple comparisons of each group vs NI group); ***p < 0.001; ****p < 0.0001. (e) Plotting of the mean ± SD of the diameter and the area of the VZs (n = 11–13 VZ/condition) during the development of the hCOs. Scale bar = 100 µm.
To assess cellular structure and morphogenesis of the hCOs, we performed IHC analyses which confirmed that the transparent areas (marked with dashed white lines in Figure 2(a)) were proliferative giving rise to dense core regions containing proliferating Ki67+ cells within them (Figure 2(c)). Abundant immunoreactivity for the neural precursor and radial glia (RG) marker Sox2 was also observed, confirming the presence of the VZs (Figure 2(c)). RT-qPCR analysis showed that MKI67 gene expression decreased after 1 and 2 months of maturation; however, SOX2 decreased to a lesser extent (Figure 2(d)), indicating the presence of neural precursors throughout the differentiation and maturation process. Furthermore, the size of the VZs increased from differentiation until 1 month of maturation and was maintained thereafter, reaching a mean size of 0.13 ± 0.03 mm in diameter and 0.012 ± 0.005 mm2 in area in the 2-month-old organoids (Figure 2(e)).
Neurogenesis and neuronal maturation in hCOs
Once the presence of VZ was verified, we wanted to check whether the organoids were differentiating into neurons, that is, the existence of neurogenesis, and the degree of maturity of these neurons. Immunofluorescence images showed that migrating neuroblasts (doublecortin+; DCX+) were present already from the differentiation stage (Figure 3(a)); DCX gene expression increased throughout the maturation stages (Figure 3(b)), indicating that neurogenesis is present, or even increased throughout the hCOs development and maturation process.

Neuronal differentiation and maturation in hCOs. (a) Immunoreactivity for different neuronal markers (DCX, βIIITubulin, and MAP2; red) and synaptic marker (SYN1; green) in differentiating and 1 and 2 months maturating hCOs. VZs are marked with white dashed lines and present immunoreactivity for Ki67 and Sox2 (green). Nuclei are stained in blue with Höechst. Scale bar = 100 µm. (b) Relative quantification by RT-qPCR of DCX, TUBB3, MAP2, and SYN1 gene expression. Data represent mean ± SD (n = 4 for each experiment; results were confirmed in two independent experiments).
Likewise, the immunoreactivity for the neuronal markers βIIITubulin and MAP2 (microtubule associated protein 2; marker for more mature neurons) and for the synaptic vesicle marker, Synapsin I (SYN1; Figure 3(a)) was observed as early as the differentiation period and increased throughout maturation process. These results were confirmed at mRNA expression level (Figure 3(b)).
The distribution of neurons around the VZs (Sox2+ cells or Ki67+ cells in clusters) showed the typical architecture in which neural precursors are centrally located and neurons migrate and differentiate outwards in the mantle zone (Figure 3(a)). This indicates that most of the proliferating neural progenitors of the hCOs were differentiating into post-mitotic and mature neurons with the time in culture.
Cell diversity profile of the hCOs by biomarker immunostaining and RT-qPCR
After verifying the presence of neuronal progenitors and neurons in different degrees of maturation in the hCOs, we wanted to analyze the existence of other non-neuronal cell phenotypes in these cultures.
Positive cells for the astrocyte marker GFAP (glial fibrillary acidic protein) and S100β (S100 protein subunit beta) were detected at 2 months of culture, in the maturation stage (Figure 4(a)). RT-qPCR analysis of GFAP and S100B gene expression showed a progressive increase with the time in culture (Figure 4(b)). Therefore, although in hCOs in the maintenance stage new neurons continue to be generated (due to the maintenance of VZs with neural precursors and RG cells), we think that gliogenesis could begin at this stage.
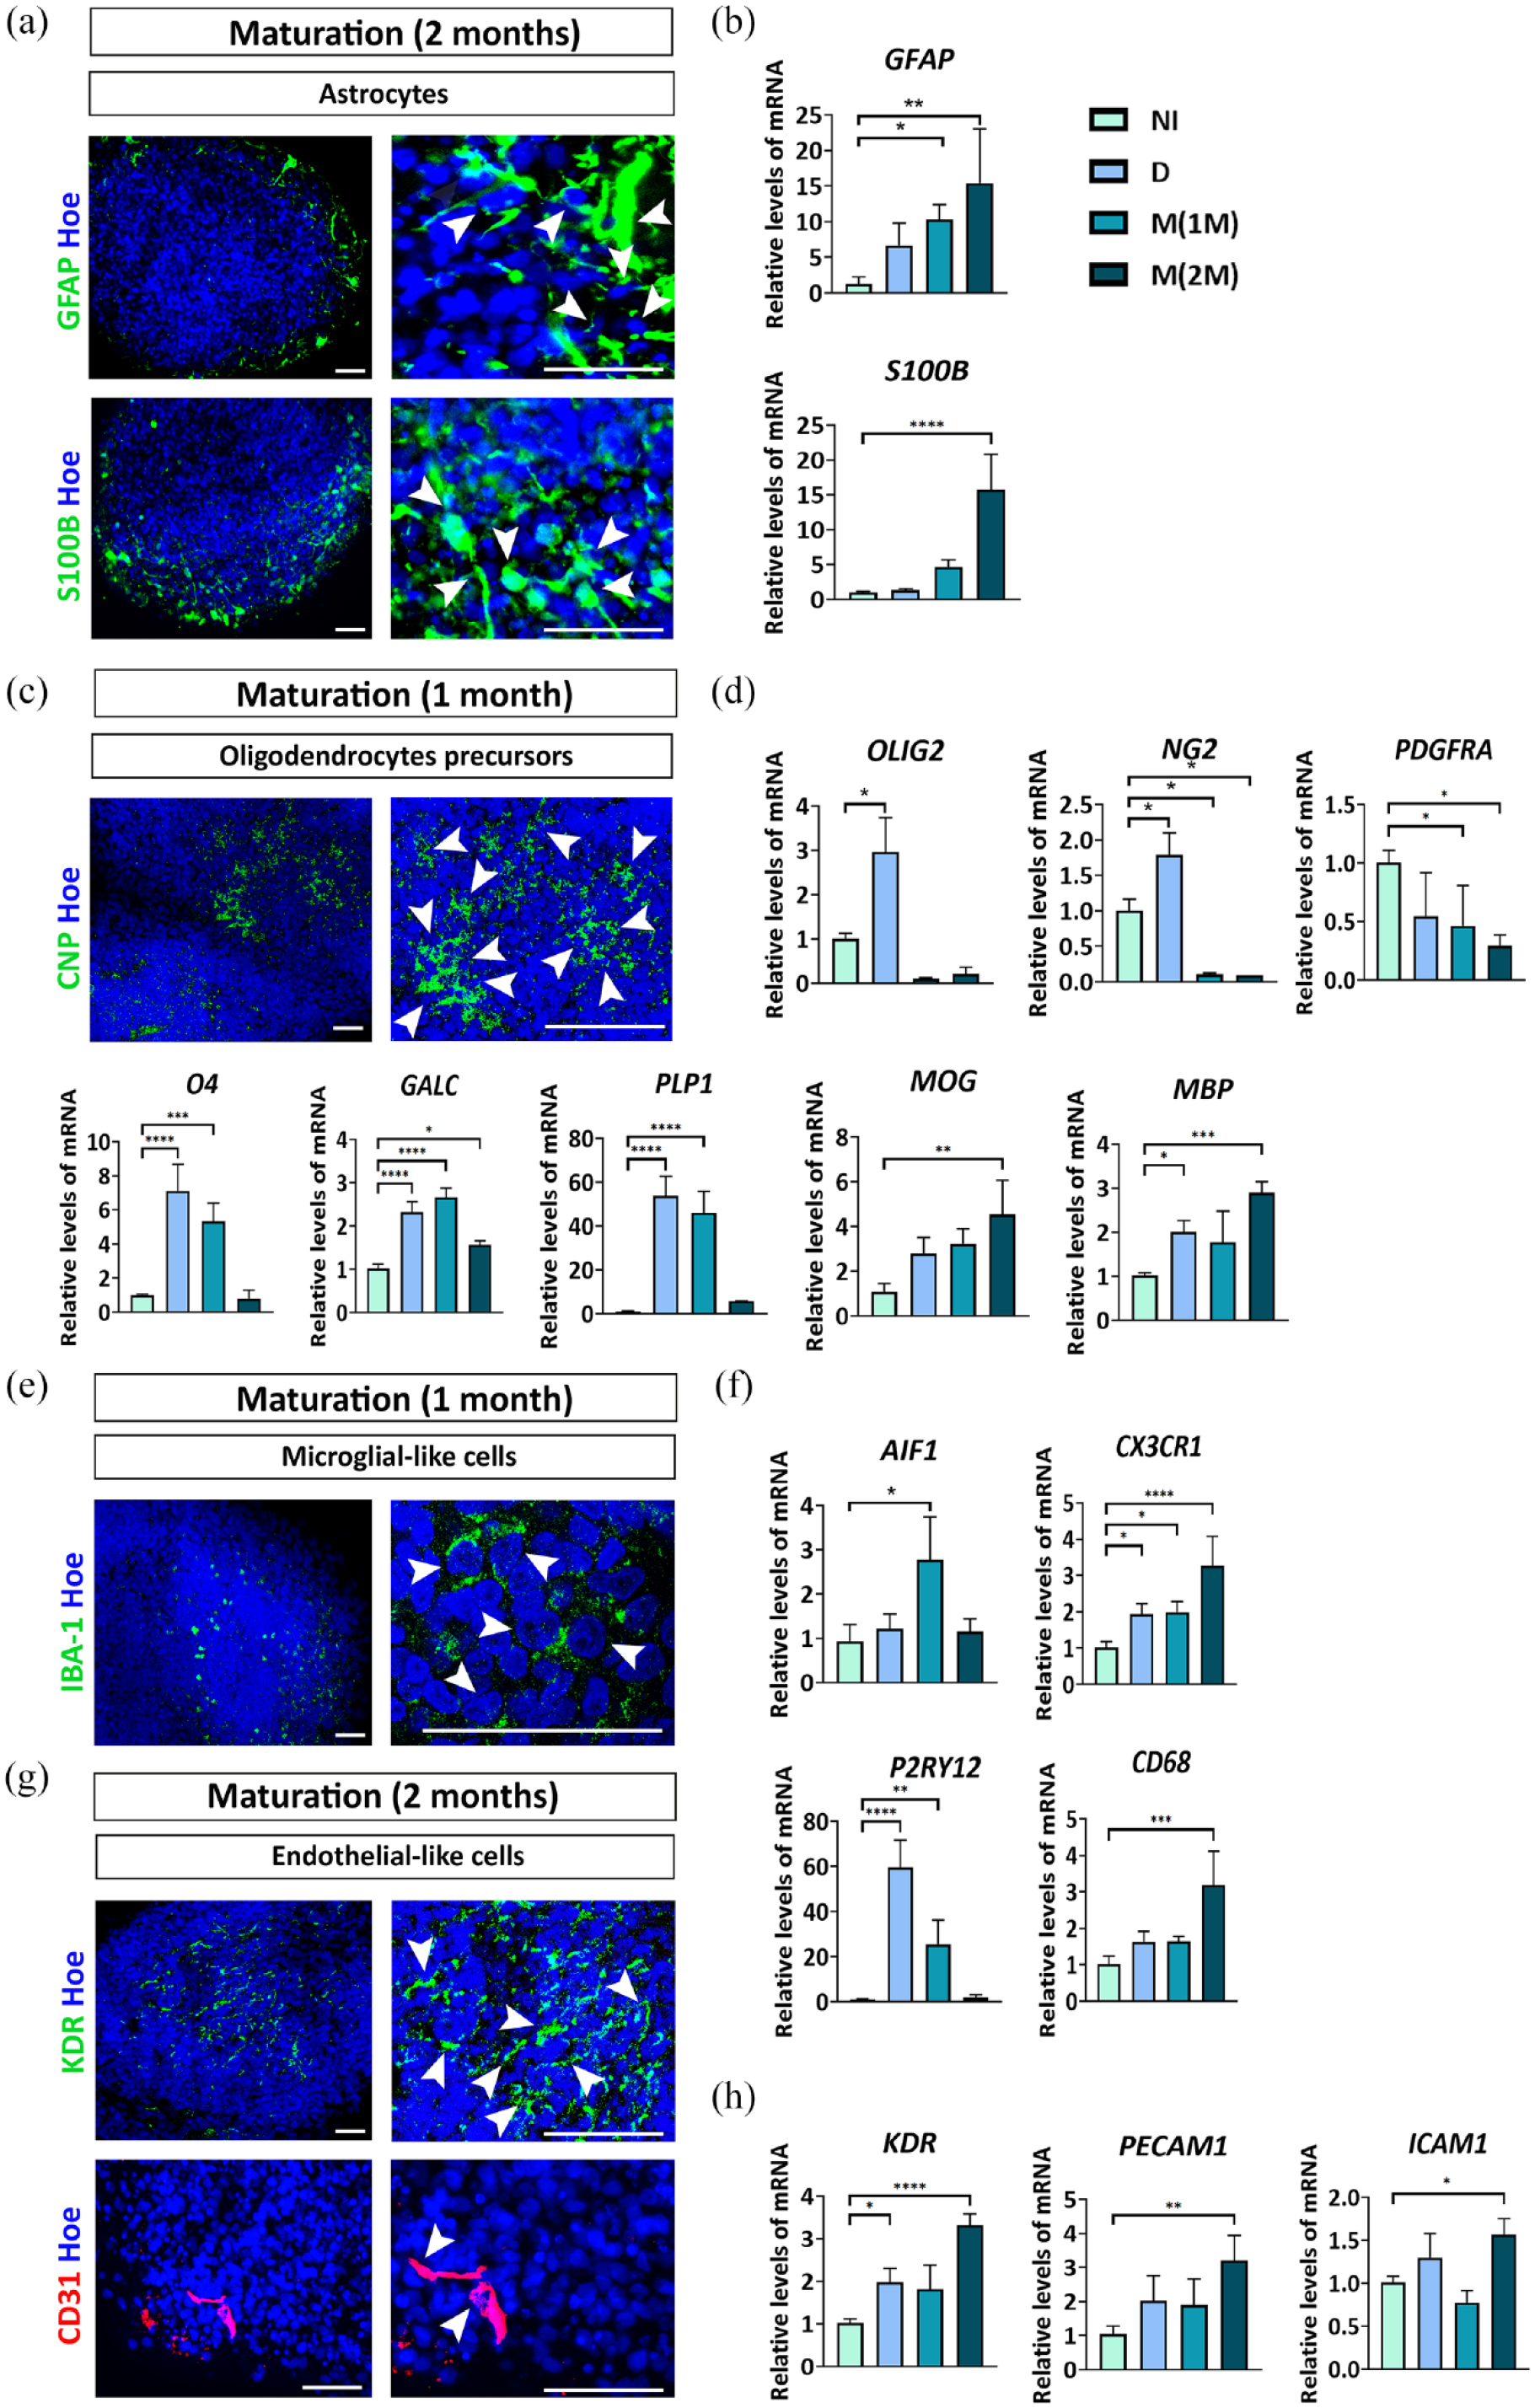
Brain cell phenotypes in the hCOs at the maturation stage (1 or 2 months). (a) Immunostaining of GFAP (green) and S100β (green) in 2 months maturating hCOs. Nuclei are stained in blue with Höechst. White arrows indicate immunolabeling for the different markers in hCOs. Scale bar = 50 µm. (b) Relative quantification by RT-qPCR of GFAP and S100B in neural induction, differentiation and maturation stages. (c) Immunostaining of CNP (green) at 1 month maturating hCOs. (d) Relative quantification by RT-qPCR of OLIG2, NG2, PDGFRA, O4, GALC, PLP1, MOG, and MBP in neural induction, differentiation and maturation stages. (e) Immunostaining of IBA-1 (green) at 1 month maturating hCOs. (f) Relative quantification by RT-qPCR of AIF1, CX3CR1, P2RY12, and CD68 in neural induction, differentiation and maturation stages. (g) Immunostaining of KDR (green) and CD31 (red) in 2 months maturating hCOs. (h) Relative quantification by RT-qPCR of KDR, PECAM1, and ICAM1 in neural induction, differentiation, and maturation stages.
In addition, immunoreactivity for CNPase (2′,3′-cyclic nucleotide 3′-phosphodiesterase; a marker of mature oligodendrocytes) was observed in hCOs during the maturating step (Figure 4(c)). Interestingly, a differential pattern was detected in the expression of marker genes for cells of oligodendrocyte lineage. Gene expression of OPCs biomarkers as OLIG2 (oligodendrocyte transcription factor 2) and NG2 (neuron-glial antigen 2, also known as chondroitin sulfate proteoglycan 4, CSPG4) increases during differentiation stage and decreases during hCOs maturation (Figure 4(d)). Another of OPCs marker gene is PDGFRA (platelet-derived growth factor alpha receptor) whose expression decreases in hCOs over time (in differentiation and maturation stages), which could indicate that OPCs are differentiating toward a more mature lineage. For this purpose, we analyzed the gene expression of O4 (marker of pre-oligodendrocytes), GALC and PLP1 (markers of mature oligodendrocytes), where we observed an increased expression during differentiation stage and 1 month of hCOs maturation (Figure 4(d)). Finally, we also analyzed the gene expression of myelin proteins associated to myelinating oligodendrocytes such as MOG (myelin oligodendrocyte glycoprotein) and MBP (myelin basic protein) that both showed a progressive increase over time in culture and significant differences at 2 months of hCOs maturation (Figure 4(d)).
Another important cell type is microglia that is responsible of the immune response in the brain. At 1 month of maturation, the gene coding for IBA-1, AIF1 (allograft inflammatory factor 1), increased its expression (Figure 4(f)) which coincides with the presence of IBA1+ microglial-like cells represented in Figure 4(e). We also analyzed by RT-qPCR the gene expression of CX3CR1 (microglia marker), P2RY12 (marker strongly expressed in resting microglia), and CD68 (marker strongly upregulated in reactive microglia), indicating the presence of microglia-like cells in hCOs that could be in different functional states (Figure 4(f)).
Additionally, some cells were positive for the vascular endothelial growth factor receptor 2 (VEGFR2, also known as KDR) and CD31, suggesting that endothelial-like cells are present in hCOs (Figure 4(g)). Moreover, RT-qPCR analysis of KDR, PECAM1 (platelet and endothelial cell adhesion molecule 1, also known as CD31), and ICAM1 (intercellular adhesion molecule 1, also known as CD54) gene expression showed an increase with the time in culture, especially at 2 months of hCOs maturation (Figure 4(h)).
Together, the results indicate that the protocol here presented allows for the development of astrocytes, oligodendrocytes precursors, microglia-like cells, and endothelial-like cells inside the hCOs, although in a smaller proportion than neurons generation.
Cell diversity profile of the hCOs by single cell transcriptomics
The single-cell RNA sequencing (scRNA-seq) analysis of the hCOs at 4 weeks supplied a view of cell-to-cell gene expression variability. After processing the transcriptomic data of 11,079 high quality cells, we grouped cells into ten cellular clusters based on their transcriptional similarity (in the range of 35–4,426 cells per cluster). To achieve the identification of the cell types that constitute each cluster we compiled a set of specific marker genes for the main brain cell types, presented in Figure 5(a). We do the assignment for each cluster according to the expression of cell-type marker signatures and the results are showed with the Uniform Manifold Approximation and Projection (UMAP) representation in Figure 5(b). We found expression of Radial Glia (RG) cell markers (SOX2, GLI3, and HES1) in three clusters. Clusters of ventricular or apical radial glia (aRG) and proliferative RG (pro-RG) expressed PAX6 and SOX1. In accordance with the found in the primate brain, the aRG cells are known to divide several times and we named as pro-RG to the cluster that has expression of the genes MKI67, TOP2A, and CENPF. aRG cells produce basal or outer radial glial cells (oRG) with the marker signature genes HOPX, FAM107A, and LIFR, thought to be important for gyrencephalic brain development, especially associated with the apparition of cortical folds. 29 Because we found in the oRG cluster expression of cells with the astroglia marker S100B, we decided to call it “oRG + Astroglia” cluster, as previously used in the study of Uzquiano et al. 30 A smaller and defined cellular cluster present expression of GFAP and S100B and we assigned as Astrocyte (AS) cluster (Figure 5(c)).

scRNA-seq reveals cellular identity of cells in the hCOs. (a) Schematic representation of the marker genes assisting with cell type assignment in cerebral organoid-derived single-cell RNA-seq data. (b) Uniform Manifold Approximation and Projection (UMAP) plot from unsupervised clustering of single-cell RNA sequencing data identifying cell populations and bar plot displaying the proportion (%) of each cluster. Colors represent the ten cell clusters annotated as Excitatory Neurons (EN), Interneurons (IN), Neurons (N), IPC (Intermediate Precursor Cells), Oligodendrocyte Precursors Cells (OPC), Astrocytes (AS), outer Radial Glia and Astroglia (oRG + Astroglia), aRG (apical Radial Glia), proliferative Radial Glia (pro-RG), and Mesodermal (MES). (c) Dot plot indicates the expression of cell type-specific marker genes. The dot size represents the percentage of cells expressing the gene (we show two different scales to facilitate the visualization separated by an horizontal line in the plot), and the color gradient from low (blue) to high (red) indicates the average relative expression across each cell type. We highlight with a box the genes of interest for the definition of each cellular cluster. (d) Color-coded nebulose density plots of the expression patterns of specific-type genes of microglial (AIF1) and endothelial (KDR) cells. (e) Dot plot showing the expression for the cellular cluster of marker genes of CR: Cajal-Retzius; CP: Choroid Plexus; FD: Forebrain Dorsal; FV: Forebrain Ventral; HY: Hippocampus; and MB/HB: Midbrain and Hindbrain.
The cluster of cells with expression of PDGFRA, CSPG4 (NG2), and FOXO4 was assigned to Oligodendrocyte Progenitor Cells (OPC), very close to the Intermediate Precursor cluster (IPC) with expression of TUBB3. The Neuron (N) cluster has expression of TUBB3, DCX, and MAP2 but without expression of synaptic markers as NRXN1 or SYN1. We defined as glutamatergic or Excitatory Neurons (EN) the group of cells with expression of the transporter genes SLC17A6 (VGLUT2) and SLC17A7 (VGLUT1) and as GABAergic neurons or Interneurons (IN) the group of cells with expression of the amino acid synthetic enzymes GAD1 and GAD2 and the transporter SLC32A1. Only one cluster of cells did not have RG or neuronal markers, so this cluster was characterized as Mesoderm cells (MES), because showed expression of TTN and MYH3 (Figure 5(c)).
UMAP representation of the cell-type clusters found shows horizontal separation from left to right of the characterized as pro-RG (5.44%), aRG (5.58%), oRG + Astroglia (6.79%), AS (0.32%), OPC (4.70%), MES (2.29%), IPC (3.90%), and the neuronal clusters comprised the major number of cells and present a vertical distribution in N (7.66%), EN (36.91%), and IN (26,41%) cells. In addition to these cell populations, it is important to note that we found cells with expression of microglial cells markers as AIF1, CD74, and SALL1 (0.013%). Additionally, some cells expressed endothelial cell markers KDR, VCAM1, and ICAM1 (0.033%; Figure 5(d)).
We detected the expression of the Cajal-Retzius cell marker RELN and deep and superficial cortical layer markers such as CUX1 (layer 2/3), BCL11B (CTIP2; layer 5C), or SYT17 (layer 6). To aid in the identification of regions within the organoid we present the expression of some genes related to forebrain: dorsal (EOMES), ventral (GSX2), hippocampus (PROX1), Choroid Plexus marker (TTR), and some markers of midbrain and hindbrain (HOXA3, HOXB3, IRX2, PAX2, GBX2, and ZIC1; Figure 5(e)). There was an absence of markers identifying mesenchymal lineages (DCN, MYOG, and MYH1) or retinal cells (OPN1SW, RCVRN, and TULP1). To continue with the study of the regional identity of the organoids, we evaluated the similarity scores of the scRNAseq transcriptomic data compared with the Allen Developing Mouse Brain Atlas data using VoxHunt v1.0.1. 31 For the whole scRNAseq data and for each cluster, we visualize the similarity using sagittal view voxels and we found that most clusters showed the highest median similarity with structures at E13.5, that is presented in Supplemental Figure S3.
Discussion
Human cerebral organoids (hCOs) are a promising model capable of overcoming some of the current limitations in advancing our understanding of human brain development and disease. In recent years, efforts are being made to generate hCOs that can better recapitulate the physiology of the human brain and to increase the efficiency and reproducibility of existing protocols; however, they still need to be refined and improved in several aspects.
In this work we have developed and optimized a new approach for the generation of hCOs based on a simple and reproducible protocol in which dissociation and aggregation steps for EB formation are avoided. hPSCs in adherent cultures are subjected to a NI medium (consisting of a strategic combination of patterning factors) allowing the direct transition from a 2D to a 3D culture model, in which neuroepithelial structures are generated in a highly efficient manner. In addition, this is a productive protocol that allows for a large amount of hCOs to be obtained, as the cell colonies can produce several rounds of neuroepithelial tissue.
The vast majority of current methods for the generation of hCOs start with the formation of EBs,1,2,4 –10,16,25 however, this process has some limitations, such as cell stress and apoptosis during cell colony dissociation and cell aggregation that result in variability and heterogeneity in size and ability to differentiate toward a particular lineage. 24 The protocol described here promotes the generation of neuroepithelial tissue in an efficient manner such that almost 100% of the 3D structures generated present peripheral neuroepithelium, the tissue of origin of the hCOs. This contrasts with the variability observed in EB-derived methods. 2
To achieve rapid induction of the neuroepithelium, several groups have employed dual-SMAD inhibition (Noggin and SB factors), which involves inhibition of the mesodermal and endodermal lineages by inhibiting the Bone Morphogenetic Protein (BMP) and Transforming Growth Factor-β (TGF) signaling pathways, respectively.10,16,25,26 An enzyme that also plays a key role in neurodevelopment is Glycogen Synthase Kinase 3 (GSK3) as it regulates molecular pathways such as Wnt/βcatenin, coordinates processes such as neuroectodermal induction, neuroepithelial proliferation, neurogenesis, and neuronal guidance and migration.27,32,33 To promote efficient induction of neuroepithelial tissue, in addition to dual-SMAD inhibition, we have added CHIR, a GSK3 inhibitor.34 –38 Previous studies have used dual-SMAD inhibition in combination with a CHIR gradient in hESCs to model human neural tube development in vitro, 39 indicating the importance of the CHIR concentration used in this process. To our knowledge, this is the first time in an hCOs generation protocol that this combination of pattering factors has been added directly to hPSC colonies at the earliest stages of neural induction.
After characterization of the hCOs generated, it was found that they showed an adequate recapitulation of human neurodevelopment, with the presence of different types of neural progenitors, with a correct pattern of differentiation and cellular distribution. We found neural precursors in the VZs, migrating and differentiating radially outwards to give rise to neurons which reach a considerable degree of maturity. These characteristics are in agreement with established protocols.1,2,16
The generated hCOs, in addition to containing a substantial number of neurons, also developed astrocytes and oligodendrocyte precursors. In hCOs generation protocols astrocytes usually originate at later stages, however in this protocol we were able to detect them earlier, meaning that the hCOs would have the capacity to enrich into astrocytes if the protocol is prolonged for longer.
The protocol presented here allows the development of microglial-like and endothelial-like cells derived from mesodermal progenitors, 40 which is probably due to the unguided culture condition of the protocol which could be related to the existence of the MES cell pool. In most hCOs transcriptomes with other protocols, no expression of these microglial and endothelial markers is detected. 41 The importance of the presence of endothelial cells in hCOs lies in the fact that in addition to lining the lumen of blood vessels, these cells are responsible for oxygen and nutrient transport, playing an important role in maintaining vascular homeostasis in organs. Microglia constitute the brain’s immune system and are of vital importance for the proper development and function of the brain.
The method we propose is reproducible in different hPSCs lines, generating neuroepithelial structures with close to 100% efficiency, and hCOs that exhibit correct structuring and spatial arrangement similar to those reported in previous studies. Furthermore, our hCOs model represents the diversity of cell types found in the brain (neurons, astrocytes, OPCs, microglial-like cells, and endothelial-like cells) which makes it a good model that could allow the study of pathologies specific to these cell types such as neuroinflammation, astroglial reactivity, or demyelination, related to neurodegeneration. Moreover, both neurodevelopment and the different pathologies of the brain cannot be studied without taking into account the interactions that occur between the different cell types.
Therefore, we believe that this new protocol could help to improve or overcome some of the current limitations in the field of hCOs, thus promoting the applications of this innovative technology and facilitating its execution in any laboratory environment, representing a benefit for many researchers.
Supplemental Material
sj-docx-1-tej-10.1177_20417314231226027 – Supplemental material for Efficient generation of human cerebral organoids directly from adherent cultures of pluripotent stem cells
Supplemental material, sj-docx-1-tej-10.1177_20417314231226027 for Efficient generation of human cerebral organoids directly from adherent cultures of pluripotent stem cells by Rosa González-Sastre, Raquel Coronel, Adela Bernabeu-Zornoza, Patricia Mateos-Martínez, Andreea Rosca, Victoria López-Alonso and Isabel Liste in Journal of Tissue Engineering
Supplemental Material
sj-tif-2-tej-10.1177_20417314231226027 – Supplemental material for Efficient generation of human cerebral organoids directly from adherent cultures of pluripotent stem cells
Supplemental material, sj-tif-2-tej-10.1177_20417314231226027 for Efficient generation of human cerebral organoids directly from adherent cultures of pluripotent stem cells by Rosa González-Sastre, Raquel Coronel, Adela Bernabeu-Zornoza, Patricia Mateos-Martínez, Andreea Rosca, Victoria López-Alonso and Isabel Liste in Journal of Tissue Engineering
Footnotes
Acknowledgements
The authors thank to Genomics Unit of the Instituto de Salud Carlos III (ISCIII) for contributing in the processing and sequencing of the sc RNA-seq assay; to Advanced Light Microscopy Unit (ISCIII) for contributing to the acquisition of the confocal microscopy images; and Laura Maeso for the technical support.
Authors contributions
RGS performed the experiments and analyzed and interpreted data. RGS, RC, ABZ, PMM, and AR generated the hCOs. IL supervised hCOs generation, designed the study, and interpreted the results. VL performed the analysis and interpreted of the scRNAseq data. RGS, PMM, VL, and IL wrote the manuscript in consultation with all authors. All authors read and approved the final manuscript.
Availability of data and materials
Transcriptomic scRNAseq data were deposited in the NCBI Gene Expression Omnibus (GEO) and can be retrieved using GEO series accession number: GSE242329
Declaration of conflicting interests
The author(s) declared no potential conflicts of interest with respect to the research, authorship, and/or publication of this article.
Funding
The author(s) disclosed receipt of the following financial support for the research, authorship, and/or publication of this article: Grant PID2021-126715OB-I00 funded by MCIN/AEI/10.13039/501100011033 and “ERDF A way of making Europe,” by the Grant of Instituto de Salud Carlos III (ISCIII) PI22CIII/00055, grant RTI2018-101663-B-100 funded by MCIN/AEI/ and the UFIECPY 398/19, PEJ2018-004965 grant to RGS funded by AEI.
Ethical approval
The work conducted in the present study was approved by the ISCIII Ethics Committee (Ref. CEI-PI93-2020) and then authorized by the Spanish National Committee of Guarantees for the Use and Derivation of Human Cells and Tissues.
Informed consent
Not applicable.
Human rights
Not applicable.
Supplemental material
Supplemental material for this article is available online.
References
Supplementary Material
Please find the following supplemental material available below.
For Open Access articles published under a Creative Commons License, all supplemental material carries the same license as the article it is associated with.
For non-Open Access articles published, all supplemental material carries a non-exclusive license, and permission requests for re-use of supplemental material or any part of supplemental material shall be sent directly to the copyright owner as specified in the copyright notice associated with the article.