
Abstract
Pancreatic cancer (PC) is a fatal malignancy in the human abdominal cavity that prefers to invade the surrounding nerve/nerve plexus and even the spine, causing devastating and unbearable pain. The limitation of available in vitro models restricts revealing the molecular mechanism of pain and screening pain-relieving strategies to improve the quality of life of end-stage PC patients. Here, we report a PC nerve invasion model that merged human brain organoids (hBrO) with mouse PC organoids (mPCO). After merging hBrOs with mPCOs, we monitored the structural crosstalk, growth patterns, and mutual interaction dynamics of hBrO with mPCOs for 7 days. After 7 days, we also analyzed the pathophysiological statuses, including proliferation, apoptosis and inflammation. The results showed that mPCOs tend to approximate and intrude into the hBrOs, merge entirely into the hBrOs, and induce the retraction/shrinking of neuronal projections that protrude from the margin of the hBrOs. The approximating of mPCOs to hBrOs accelerated the proliferation of neuronal progenitor cells, intensified the apoptosis of neurons in the hBrOs, and increased the expression of inflammatory molecules in hBrOs, including NLRP3, IL-8, and IL-1β. Our system pathophysiologically replicated the nerve invasions in mouse GEMM (genetically engineered mouse model) primary and human PCs and might have the potential to be applied to reveal the molecular mechanism of nerve invasion and screen therapeutic strategies in PCs.
Introduction
Pancreatic cancers (PCs), uniformly deadly gastrointestinal tumors, are characterized by the extensive infiltration of multiple organs and parallel/surrounding anatomical structures, especially nerve fibers, nerve plexus, major vessels, and even spinal cords.1–3 The grim prognosis of PC is due to its late diagnosis, early cancer metastasis and neural invasion. 4 In PC patients, nerve invasion is the process by which neoplastic cells infiltrate the nerve fiber and plexus and randomly afflict the spine.2,5 Neural invasion alters the anatomical structure of the nerve and causes unbearable chronic back pain that mentally and psychologically devastates PC patients.2,6 An applicable model to provide mechanistic insight into PC nerve invasion is urgently needed.
Studies of neural invasion in PCs mainly depend on orthotopic and xenograft tumors or GEMM (genetic engineering mouse model) PC models.5,7–9 In vitro, coculturing mouse dorsal root ganglia (DRG) with cancer cells was applied to reveal the interactions between the cancer cells and the nearby nerve or ganglion, similar to the models of nerve invasion in other cancers.8,10 A solid tumor is an organ. 11 In the DRG coculturing system, neoplastic cell team behaviors during invasion are challenging to evaluate, especially for solid ductal carcinomas in which neoplastic cells form ducts. In addition, the long-term maintenance of DRG in dishes is challenging because degeneration and death of cells are common in tissue culture.
An organoid, a compartmentalized culture system, is a disciplined assembly of cells that anatomically and physiologically resemble the target organs. It is defined as a collection of organ-specific cell types that develop from stem cells or organ progenitor cells and self-organize similarly to those in vivo through cell sorting and spatially constrained lineage commitment. 12 Organoids create many different diseases and developmental models without ethical and physiological restrictions, providing a valuable tool in vitro for many developmental diseases, even cancers. 13 Organoids have been developed for use in organs and tissues, such as the optic cup structures, 14 kidney, 15 liver, 16 thymus, 17 retina, 18 lung and airway epithelium of the human fetus. 19 Human brain organoids facilitated the study of the complex neural organization of cellular structures in vitro, thus allowing us to build a more complex model for neurodevelopmental disorders, even cancers. The differentiation of organoids toward specific brain regions can be driven by adding morphogen, which helps build the cerebellum, 20 hypothalamus, 21 pituitary, 22 hippocampus, 23 thalamus, 24 brainstem, 25 midbrain, 19 spinal cord, 26 and choroid plexus 27 organoids.
PC, known as pancreatic ductal adenocarcinoma (PDAC), is a solid tumor rich in extracellular matrix (ECM), including collagen and its neoplastic cells formed ducts. 28 PC organoids, ductal organoids, mimic the pathophysiological state of neoplastic cells in vivo, providing a tool to screen therapeutic drugs.29,30 Previously, we isolated KPIC cells, epithelial cells, from primary tumor-bearing mice that harbor major mutations in PC, including KRAS (KrasG12D), TP53 (Trp53R172H/+), CDKN2A (Ink4flox/+) and Ptf1/p48-Cre (KPIC) mutations. 31 KPIC cells formed a ductal organoid in the Matrigel system with conditioned medium. Thus, hBrOs and mPCOs provide a tool to understand the crosstalk between nerve tissues and neoplastic cells during invasion.
Here, we constructed a fused organoid model to mimic the pathophysiology of neuronal invasion in PCs by using hBrOs and mPCOs and evaluated the pathophysiological and immunological changes in hBrOs and mPCOs during neural invasion.
Materials and methods
Ethics statements
All mice were kept in animal facilities with air conditioning at the School of Basic Medical Science. The school of Basic Medical Science of Fudan University and the Use Committee approved all animal procedures. The human ethics committee of Huashan/Zhongshan Hospital of Fudan University approved the study.
Patient data and follow-up
These PC patients underwent surgery in the Department of Pancreatic Surgery at Zhongshan/Huashan Hospital of Fudan University and Hospital between 2006 and January 2019. Clinicopathological characteristics were recorded in our previous publications.
Mouse spinal cord nerve infiltration
Tumor samples from KPIC mice were described in our previous publication. 31
KPIC tumor cells were isolated from mice harboring mutations in KRAS (KrasG12D), TP53 (Trp53R172H/+), CDKN2A (Ink4flox/+) and Ptf1/p48-Cre (KPIC).
Organoid culture
KPIC cells were cultured in DMEM with 10% FBS at 37°C and 5% CO2 ambient. To construct mPCO, KPIC cells were digested using 0.25% trypsin (1 mL per well of a six-well plate). After digestion for 2 min in a 37°C incubator, the reaction was terminated by supplying the culturing medium. After 2 min of centrifugation at 1500 rpm, the supernatant was discarded. After discarding the supernatant, the cells were resuspended using 3 mL of the culturing medium, and the cells were counted to adjust the concentration. After adjusting the cellular concentration, the cells were centrifuged at 1500 rpm for 2 min and resuspended using Matrigel solution after discarding the supernatant. The solution was gently shaken into a single cell solution, 30 μL of Matrigel solution with 5000 KPIC cells was plated on 24-well plates, and the wells with organoids were maintained at room temperature for 30 min for solidification. PancreaCult Organoid Growth Medium was supplied for culture.
Constructing hBrO
H9 was used to construct human brain organoids (hBrO) by a modified 3D organoid culture method. hESC-H9 (WA09) was a gift from Prof. Su-Chun Zhang, University of Wisconsin. In brief, hPSCs were aggregated by the modified SFEBq method, 32 digested into single cells, and then transferred to a 96-well plate with a V-bottom base to construct hBrOs, and morphogenetic elements were supplied at different time points to induce differentiation. After over 30 days in the culture, the hBrO was moved to the small cut of the mPCO system at day. Another 10 μL of Matrigel stock solution was added to fix the hBrOs position. The merging dynamics were monitored and recorded by phase contrast microscopy.
Coculture
hBrOs were added on Day 5 to the mPCOs. The culture medium was removed from the wells prior to addition, and 10 μL of Matrigel stock solution was added again to the original matrix collagen colloid. All the above steps were performed on an ice platform. The hBrOs were then quickly placed on the surface, and the wells were maintained at room temperature for 30 min until the 10 μL of Matrigel had solidified. Afterward, 500–600 mL of preconfigured NM medium was added to completely submerge the organoids. The medium was changed daily, and observations were recorded under white light.
Histology and immunostaining
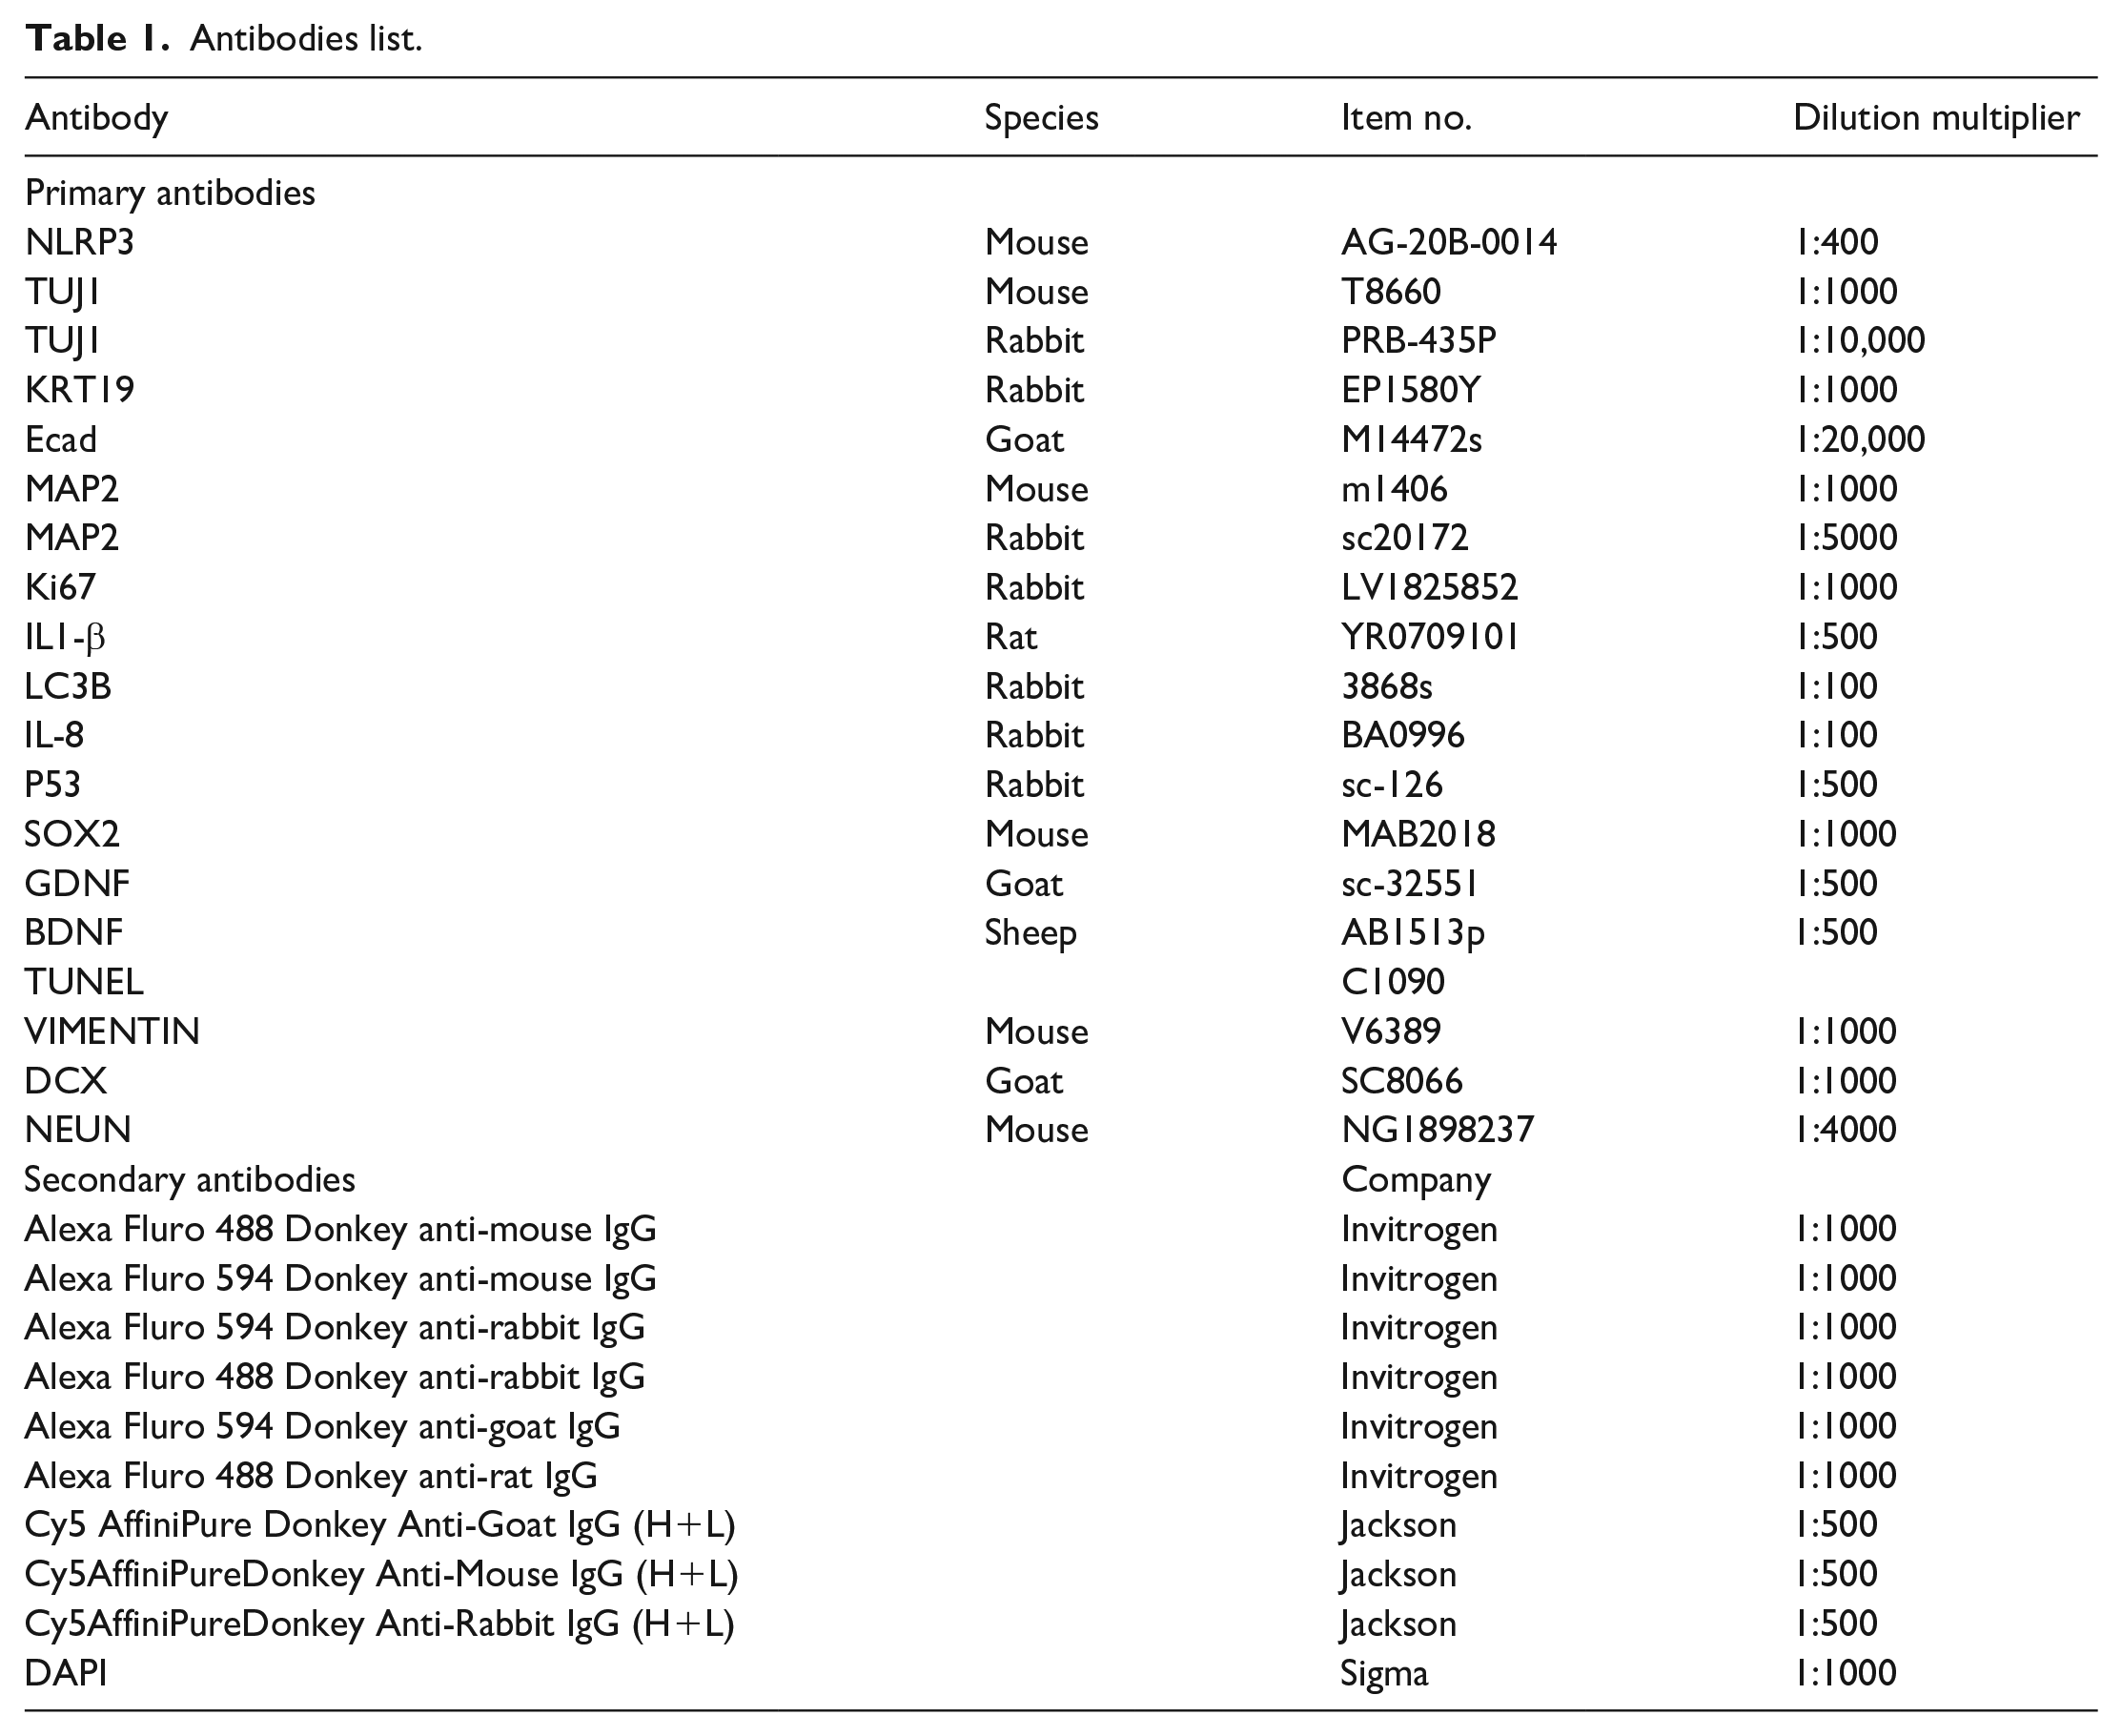
H&E staining of paraffin slices was performed by a routine staining method for paraffin sections. Organoids were fixed with 4% paraformaldehyde (PFA) for 4 h. After fixation, the fixed organoids were moved to a 30% sucrose solution for dehydration and cryoprotection. The organoids were embedded in OCT and cryosectioned in a cryostat into 10 μm slices. Frozen organoid sections were washed in PBS, blocked, permeabilized in blocking buffer (0.3% Triton X100, 10% normal donkey serum in PBS) for 1 h, and incubated with primary antibodies in a buffer (PBS with 0.3% Triton X100 and 5% donkey serum) overnight at 4°C. After washing in PBS for 2 h, the slices were incubated with a secondary antibody solution that contained the corresponding fluorescence conjugated antibodies, DAPI solution, and 5% donkey serum for 1 h. After washing several times, the sections were mounted on an aqueous mounting medium for microscopy.
Antibodies list.
Calibrating immunofluorescent signals
The necrotic center was excluded from the measurement. We drew a 200 μm diameter circle at the edge of the hBrO by using ImageJ and calculated the average fluorescence intensity (minus the background fluorescence intensity to standardize the value). The distance criteria are shown in Supplemental Figure 1. Relative fluorescence intensity was measured by using Fiji(manager-measure-results-mean). We first calculated the average fluorescence intensity within the 200 μm circle. Then, the background fluorescence intensity was subtracted. We took the final result as the relative level. When dividing the fluorescence intensity in the circular area by DAPI, we also used the result after subtracting the background value. Therefore, there are no units of relative fluorescence intensity. Therefore, the comparisons were based on the same dyeing process only. The distance was also measured by using Fiji (manager-measure-results-length), and the units of distance were all μm.
LC‒MS data
After isolating the mPCOs from the well, the organoids were transferred to a dish containing DMEM/F12 on ice, resuspended and mixed with 1 mL pipette to suspend, and precipitated for 1 min. After discarding the supernatant, the precipitant for LC‒MS analysis was used for LC‒MS analysis. The protocols included LC‒MS and data acquisition and processing of the core facility in the State Key Lab of Genetic Engineering. 33
High-resolution images and image processing
Nikon A1, Structured Illumination microscopy (SIM) (Nikon, Japan), and Zeiss 880 or 710 confocal microscopy (Zeiss, Jena, Germany) were applied to scan all images. ImageJ software (Fiji, NIH, Bethesda, MD, USA) was used for cell counting, fluorescence intensity statistics, and morphological analysis. Imaris 9.8 (Bitplane AG, Zürich, Switzerland) was used for cell morphological analysis.
Statistical analyses
The statistical analyses were performed in SPSS version 21.0 (SPSS Inc, Chicago, IL, USA), R version 3.3.0 (http://www.r-project.org/), and GraphPad. The Kaplan–Meier method and the log-rank test were used to estimate the survival.
Results
Neural invasion is a common characteristic of human and murine aggressive PCs and a bone fade indicator for a grim outcome
To see the universal correlations of neural invasion with PC patient outcomes, we have revisited our 15-year follow-up data of PC patients who we previously reported.6,34–36 Our data from two independent hospitals, including 410 patients, showed that neural invasion is a bona fade indicator of poor prognosis (Figure 1(a)), consistent with previous multiple publications.35,37,38 We also observed that our murine primary KPIC tumor widely invaded the celiac nerve plexus and spine and paralyzed the tumor-bearing KPIC mice 31 (Figure 1(b) and (c); Video 1A), and histopathology and immunostaining with p53 and E-cadherin antibodies revealed that many neoplastic cells invaded into the spine of KPIC mice (Figure 1(c)). This finding indicates that KPIC cells are candidates to study nerve invasion in PCs.

Nerve invasion is a common characteristic of human and murine PCs related to grim outcome. (a) Kaplan‒Meier-Meier curves showed that nerve invasion is a bona fade indicator of grim prognosis in human pancreatic cancer patients. Log-rank test. (b) H&E staining and Tuj-1 immunostaining revealed that primary KPIC PC invaded the celiac nerve of KPIC tumor-bearing mice. The celiac nerve surrounding the splenic artery and vein was infiltrated by macrophages and neutrophils (black [white in right panel] arrows, celiac nerve plexus; sp, spleen; SA, spleen artery; SV, spleen; green arrows, neutrophils). Scale bars, 200 μm and 50 μm. (c) Histology and E-cadherin and p53 antibody immunostaining in the tissues of KPIC primary PC invaded to the spine, and paralyzed tumor-bearing mice showed that many p53- and E-cadherin-labeled tumor cells attached or intruded into the spine of the tumor-bearing mice (middle panels, magnified region in the left panels, black arrows). Scale bars, 200 and 50 μm.
Characterizing mPCOs and hBrOs
mPCOs were cultured in Matrigel for 5 days with Pancreatic OGM Mouse Basal Medium (STEMCELL, USA) (Figure 2(a)). KPIC cells formed mPCOs that expanded from 50 to 120 μm in diameter from Day 1 to Day 5, and the size was stable from Day 5 to Day 10 (Figure 2(a)). PDAC ductal cells expressed cytokeratin-19 (KRT-19) and E-cadherin. 28 Cytokeratin and E-cadherin antibody immunostaining revealed that mPCOs expressed KRT-19 and E-cadherin (Figure 2(b)). Pancreatic cancer cells have a strong affinity and prefer to move toward neurons. 39 LC‒MS data of KPIC cells and mPCOs showed that KPIC cells expressed nerve invasion-related molecules,3,5,40 including Anxa2, Arhgd1β, Muc1, and Egfr. In particular, Anxa2, the main driver of nerve invasion, 40 was extremely high in both 2D and 3D cultures (Figure 2(c)). Human embryonic stem cell (hESC)−H9 was induced to create hBrOs. After induction for over 30 days, hESC-H9 cells formed 3D hBrOs with a developing brain signature. MAP2/SOX2/NEUN/DCX antibody immunostaining showed that hBrO mimicked developing/fetal human brain, same as published literature41,42 (Figure 2(d), Supplemental Figure 2). The compartmentalized nature of mPCO and hBrOs made the two organoids suitable for revealing the crosstalk between neural and ductal compartments.

Characterization of mPCO and hBrO. (a) Morphology of mPCO on Days 1 and 5. The diameter of the mPCO increased from Day 1 to Day 5 and was stable from Day 5 to Day 11. n ⩾ 3. Scale bars, 50 μm. (b) Representative images of KRT19 and E-cad antibody staining in mPCOs. The lower panels are single-channel images, scale bars, 100 μm. (c) Relative expression levels of nerve invasion-related proteins in KPIC cells in 2D/3D culture detected by LC‒MS. (d) MAP2 antibody staining of whole hBrO was taken by light sheet microscopy (see Video S2). The whole hBrO is clarified by a CLARITY protocol. The lower panel is a single layer image from the Z-stack. Scale bars, 200 and 50 μm. (e) Schematic of the construction of the nerve invasion system by mPCO and hBrO. After culturing mPCOs for 5 days, 10 μL of Matrigel was added to the top of the mPCOs. Then, hBrO was gently placed in Matrigel. Scale bars, 400 μm.
mPCOs prefer to attach or invade hBrOs
Neural invasion was defined as the presence of cancer cells in any nerve layer by invading, circling, or crossing the nerve. 43 Matrigel, which contains collagen, mimics the extracellular matrix (ECM) of pancreatic cancer with abundant stroma.44,45 On Day 5, we transferred the hBrO cultured over 1 month into the mPCOs (Figure 2(e)). Merging hBrOs into mPCOs neither affected the increase in hBrOs nor slowed the expansion of mPCOs (Figure 3(a)). Notably, following the expansion of mPCOs, mPCOs touched the hBrOs around Day 7 and partially inserted into the hBrOs at Day 11 (Figure 3(a)). The approximation of the KPIC duct to hBrOs caused the retraction/shrinking of neural projections that protruded from the margin of hBrOs (Figure 3(b)). H&E staining of the merged organoids confirmed that mPCOs partially protruded into the hBrOs, resembling spinal invasion in primary KPICs (Figures 1(c), 3(c) and (d)). Immunostaining with KRT-19, E-cadherin, and MAP2 antibodies revealed that the mPCO was attached entirely to hBrOs, neuronal projections also touched the rim of mPCOs, and some mPCOs reshaped their ductal structure into a convoluted structure and formed a prominent invasive frontier that structurally protruded into hBrO (Figure 3(d)). Other KPIC ducts completely burrowed into hBrO, resembling the metastatic lesion in the spinal cord of KPIC mice. The projection of MAP2+neurons closely contacted the neoplastic cells in the mPCO, which resembled tumor innervation in vivo. Pancreatic cancer cells secrete neurotrophic factors such as GDNF(glial cell line-derived neurotrophic factor)/BDNF(brain-derived neurotrophic factor) to attract nerve fibers, which promotes the invasion process. 46 Immunostaining with KRT-19 and GDNF/BDNF antibodies revealed that mPCOs expressed a higher level of the neurotrophic factor GDNF, which might attract the projections of hBrO and contribute to the innervation of mPCOs (Figure 3(e)). At the same time, the ductal structure of the mPCO changed as it entered the hBrO. These findings suggested that when cocultured in vitro, mPCOs could not only approximate or invade but even reach the deeper region of hBrOs, resembling the invasive behavior of PC in vivo (Figure 3(f)).

Histological characteristics of the nerve invasion system. (a) The dynamics of cocultured mPCO and hBrO at Days 1, 5, 7, and 11 (white arrow, typical mPCO intruding hBrO). Scale bars, 200 and 100 μm. (b) Comparing the length changes of the neuronal projections in hBrO and mPCO+hBrO (white arrow, neuronal projections). n ⩾ 3. Scale bars, 100 μm. (c) A hematoxylin-eosin staining image of mPCO+hBrO showed that a mPCO partially protrudes into hBrOs (white arrows, mPCO). Scale bars, 300 μm. (d) Representative images of MAP2, E-cad, and KRT19 antibody staining in mPCO+hBrO showed that mPCO is closely attached to hBrO and projecting neuronal projections conjugated/contacted with mPCO. Scale bars, 50, 100, and 15 μm. (e) The representative images of GDNF/BDNF and KRT19 antibody staining in mPCO+hBrO showed that mPCO expressed GDNF/BDNF and KRT+cells from mPCO protruding into hBrO which represent the prominent invasive fronts. Scale bars (above), 70, 80, and 20 μm (insert). Scale bars (below), 80 and 10 μm (insert). (f) Classification diagram of the different invasion levels including “approximate,” “contact” and “insert.” Representative images of GDNF, VIMENTIN, and KRT19 antibodies staining in mPCO+hBrO-D30/D120. D30/D120, hBrO was cultured for 30/120 days before adding to the mPCOs. “Approximate,” mPCOs approached to the hBrO but no substantial contact. “Contact,” mPCOs contact with hBrO, where the boundary line is no longer clear. “Insert,” deeper access caused deformation of hBrO. Scale bars, 30 μm.
The status of proliferation and apoptosis in hBrO during PC ductal invasion
The hBrOs model is a developing brain model. 47 In addition, brain insults increase the proliferation of the neuronal stem cell pool.48,49 Others observed that pancreatic cancer invasion increases neural protruding and neural bodies in DRG coculturing models. 3 We detected proliferation with the Ki67 antibody and apoptosis with the TUNEL assay to determine how mPCO invasion affected proliferation and apoptosis in both hBrO and mPCOs. The approximating and invading KPIC ductal cells to hBrOs increased the proliferation and apoptosis of cells in hBrOs (Figure 4(a)–(c)). To determine whether the toxic gradient effect of mPCOs on hBrO exists, we calibrated the gradient patterns of TUNEL or Ki67 signals in hBrOs that corresponded to the distance to the KPIC PC ducts (Supplemental Figure 1). The approximating of the KPIC PC duct to hBrO did not create a gradient death (p = 0.363) or proliferative (p = 0.666) patterns in the hBrOs, and the approximating of hBrOs also did not affect the proliferation and apoptosis of KPIC ductal cells (Figure 4(d)). However, at the margins, we observed more proliferative cells (p = 0.088) near the mPCO, whereas apoptotic (p = 0.652) cells were enriched at the center (Figure 4(e)–(g)). To see if the ductal density in mPCO affects the proliferation of hBrO in the mPCO+hBrO, we generated an mPCO with 9000 KPIC cells and then plated hBrO on the mPCO as previously described. The increase of ductal density in mPCO reduced Ki67+ neuronal cells in mPCO+hBrO compared to the hBrOs (p < 0.001) (Figure 4(b)). These findings reveal the direct toxic effect of KPIC ductal cells on the neurons in hBrOs, consistent with increasing neural plasticity during neural invasion in pancreatic cancer. 50

Pathophysiological characteristics of the nerve invasion system of PCs. (a) Representative images of TUNEL and Ki67 antibody staining in hBrO or mPCO+hBrO cells. Ki67-positive cells were enriched around the neural tube (white circled region, neuronal tube). Scale bars, 30 μm. (b) Comparing the relative intensity of Ki67 in mPCO+hBrO with 9000 and 5000 KPIC cells with hBrO. n ⩾ 4. (c) Comparing the relative intensity of TUNEL in hBrO with mPCO+hBrO. n ⩾ 3. (d) The gradient changes (relative to hBrO) of Ki67 or TUNEL staining intensity (adjusted by the intensity of DAPI signals) in the ducts of mPCO in the nerve invasion system suggested that hBrO had no significant effect on the proliferation and apoptosis of mPCO. n ⩾ 3. (e) Whole slide scanning images of TUJ-1 and Ki67 antibody immunostaining in mPCO+hBrO. Scale bars, 200 and 50 μm. (f) MAP2, TUNEL, and KRT19 antibody staining in mPCO+hBrO. White dashed frame, mPCO. Scale bars, 200 and 30 μm. (g) The relative intensity of KRT19 in hBrO/mPCO+hBrO. This shows the specificity of KRT19 for mPCOs. The relative intensity of Ki67, TUNEL or DAPI in hBrO/mPCO+hBrO. n ⩾ 3. All data, means ± s.e.m.s. *, p < 0.05, **, p < 0.01, ns, no significant difference.
KPIC PC duct invasion induced inflammation in hBrOs
Tissue damage and infection activate the NLRP3 inflammasome in neurons, a vital complex of the innate immune response.51,52 IL-1β is a secretory cytokine controlled by NLRP3. 53 Nlrp3 expression dramatically increased (p < 0.001) in the spinal region where metastatic KPIC cells infiltrated, and some cells surrounding metastatic lesions in the spine had moderate Il-1β (p < 0.001) staining signals (Figure 5(a) and (b)). We also observed that the nerve fibers or plexus invaded or approximated by tumor cells upregulated IL-8 and NLRP3 in human PDAC compared to the nerve fibers or plexus that were not invaded by tumor cells (Figure 5(c) and (d)). To determine whether the invasion of mPCOs affects NLRP3 expression in the neurons of organoids, we used immunostaining with NLRP3 and TUJ-1 antibodies to observe NLRP3 changes in the neurons of organoids. NLRP3 expression in cocultured hBrOs was higher than that in hBrOs (p < 0.001), which is related to pain 54 (Figure 5(e)). Notably, NLRP3 expression is dramatically increased in the region where the KPIC PC duct is approximated or touched. Its expression in some regions showed a gradient increasing pattern from the distal to proximal of the approximating mPCOs(p < 0.001) (Figure 5(f)). The gradient patterns of IL-1β in the hBrO were not significant in the region where the KPIC PC ducts infiltrate or attached (p = 0.787) (Figure 5(g)). Inflammation paralleled nerve invasion, and the damaged nerve recruited immune cells, including cytotoxic T lymphocytes, macrophages, and mast cells.13,50 IL-8 recruits neutrophils, basophils and T cells during the inflammatory process and is expressed in perineural immune infiltrates in pancreatitis. 55 We previously found that increased IL-8 levels in the blood serum and tissues of PC patients were related to poor outcomes. 34 IL-8 levels in blood serum are also upregulated in brain injury. 56 IL-8 was increased in the invading mPCOs that completely burrowed into hBrOs and in the surrounding cells in hBrOs that circled invasive lesions or approximated KPIC PC ducts (p = 0.001) (Figure 5(e) and (h)). These findings revealed that the invasion of mPCOs into hBrOs induced inflammatory reactions that resembled the inflammatory reaction in vivo.

Immunological characteristics of the nerve invasion system of PCs. (a) Representative images of NLRP3 and IL-1β antibody staining in the spine with metastases in KPIC mice with primary PC. H&E staining showed the metastatic lesion in the spinal cord (consecutive sections; white arrows, metastatic lesions or cells in H&E; white dashed frame, the metastatic lesions in IF; the lower panels, spine without metastatic lesions). Scale bars, 100 μm. (b) Comparison of the relative intensity of IL-1β and NLRP3 in the spine with and without metastasis. N: without metastasis M: with metastasis. (c and d) IL-1β/TUJ-1/KRT19 and NLRP3/MAP2/E-cad antibody staining in human PDAC (white dashed frame, plexus). (e) Representative images of IL-8 and NLRP3 antibody immunostaining in hBrO and mPCO+hBrO cells. Comparison of IL-8 and NLRP3 immunostaining intensity in hBrO with mPCO+hBrO. White dashed frame, mPCO. n ⩾ 3. Scale bar, 50 μm. (f) TUJ-1 and NLRP3 antibody immunostaining in mPCO+hBrO showed gradient patterns of NLRP3 staining signals in the hBrO depending on the distances to the mPCOs. p < 0.0001. White dashed frame, mPCO. Scale bars, 200 μm, 100 and 50 μm. (g) IL-1β antibody immunostaining in mPCO+hBrO (white dashed frame, mPCO). The relative intensity of IL-1β in mPCO+hBrO showed that the IL-1β signals in the coculture system did not depend on the distance to mPCO, scale bars, 200 and 20 μm. (h) IL-8 antibody immunostaining in mPCO+hBrO showed that the KPIC PC duct burrowed into hBrO showed an evaluated level of IL-8(white dashed frame, a burrowed mPCO in hBrO). The measurement of IL-8 intensity in mPCO+hBrO showed that the IL-8 signals in hBrO were gradient. Data, mean ± s.e.m. *, p < 0.05, **, p < 0.01, ns, no significant difference. Scale bars, 200 and 20 μm.
Discussion
Human PC neoplastic cells uniformly invade the nerve. 38 A useful model of PC nerve invasion should show significant pathophysiology and molecular signatures, resembling the nerve invasion in human PCs. Here, we constructed an hBrO and mPCO coculturing system and partially replicated the pathophysiological processes of nerve invasion in PCs. Our mPCO models revealed the nerve invasion process of mPCOs and the retraction of neuronal projections when mPCOs approximated hBrOs. In addition, nerve invasion of KPIC PC ducts induced proliferation of neuronal cells in hBrOs, consistent with multiple human/murine brain observations in insults.57,58 KPIC cells harbor Kras mutation. 31 Kras mutation enhanced macropinocytosis, and nutrient scavenging ability, including glucose and amino acids.59,60 We also noticed that increasing the ductal density of mPCO inhibited the proliferation of hBrOs in mPCO+hBrO. This phenomenon might result from nutrient deprivation due to more KPIC tumor cells scavenging large amounts of nutrients by macropinocytosis. In addition, the coculturing system induced neuronal inflammation in hBrOs, mimicking the neuronal inflammation of nerve tissues in murine PC models. Our primary models suggested that the hBrO and mPCO coculturing platform is suitable for revealing the molecular mechanism in nerve invasion and testing therapeutic approaches.
Technically, this system has several advantages over the system of coculturing cancer cells with DRG neurons. hBrOs can be maintained for over 200 days. Thus, the applicable platform is suitable for the long-term monitoring of cancer cell behavior and neuron behavior during nerve invasion. hES and hiPS-derived hBrOs provided a sustainable/reproducible source for brain tissue. Brain organoids were previously used to observe the interaction between nerve cells and malignant cells in glioblastoma, 61 while the crosstalk between neurons and tumor cells is beyond brain tumors. Peripheral nerve invasion presents in almost all pancreatic cancers, 80% of head and neck cancers, 75% of prostate cancers, and 33% of colorectal cancers. 62 In addition, brain metastasis is common in pancreatic and lung cancer63,64 and causes a devastating pain and death. This system has the potential to extend into other types of neuroinvasive tumors for screening pain relieving drugs. Analgesics and opioids are limited medications for pancreatic cancer-related pain. Although there are some alternative treatments, such as ganglion blocks, available for cancer patients, 65 severe side effects are common for most treatments. 66 Thus, targeted therapy, which mitigates the underlying mechanism of pain, is an alternative medication for managing the pain related to nerve invasion. Therefore, in vitro models are available tools to screen specific analgesic drugs on the basis of pain mechanisms. Inhibition of CCL21 and CXCL10 or their receptors, which reduces hypersensitivity in mice with pancreatic ductal adenocarcinoma, 67 is an example of targeted pain management. In the future, combined with high-throughput screening technology, this system will become an applicable tool for drug screening.
The limitation of the current system is that brain organoids are developing models so that they lack an immune cell population and mature myelination of neurons. Although we observed astrocytes and oligodendrocytes in the organoids, the axons of neurons still lack mature myelination. Thus, the present system is unsuitable for studying the toxic effect of the myelin sheath and immune cell pathophysiology in nerve invasion. In the future, more sophisticated organoids with myelination and immune cells, even with circulation, might provide a comprehensive view of crosstalk between neoplastic cells and the nervous system.
Supplemental Material
sj-jpg-1-tej-10.1177_20417314221147113 – Supplemental material for Construction of a pancreatic cancer nerve invasion system using brain and pancreatic cancer organoids
Supplemental material, sj-jpg-1-tej-10.1177_20417314221147113 for Construction of a pancreatic cancer nerve invasion system using brain and pancreatic cancer organoids by Chenyun Song, Xinyu Chen, Jixin Ma, Hada Buhe, Yang Liu, Hexige Saiyin and Lixiang Ma in Journal of Tissue Engineering
Supplemental Material
sj-jpg-2-tej-10.1177_20417314221147113 – Supplemental material for Construction of a pancreatic cancer nerve invasion system using brain and pancreatic cancer organoids
Supplemental material, sj-jpg-2-tej-10.1177_20417314221147113 for Construction of a pancreatic cancer nerve invasion system using brain and pancreatic cancer organoids by Chenyun Song, Xinyu Chen, Jixin Ma, Hada Buhe, Yang Liu, Hexige Saiyin and Lixiang Ma in Journal of Tissue Engineering
Supplemental Material
sj-jpg-3-tej-10.1177_20417314221147113 – Supplemental material for Construction of a pancreatic cancer nerve invasion system using brain and pancreatic cancer organoids
Supplemental material, sj-jpg-3-tej-10.1177_20417314221147113 for Construction of a pancreatic cancer nerve invasion system using brain and pancreatic cancer organoids by Chenyun Song, Xinyu Chen, Jixin Ma, Hada Buhe, Yang Liu, Hexige Saiyin and Lixiang Ma in Journal of Tissue Engineering
Footnotes
Data availability
All relevant data are within the paper and are available to anyone for a reasonable request.
Declaration of conflicting interests
The author(s) declared no potential conflicts of interest with respect to the research, authorship, and/or publication of this article.
Funding
The author(s) disclosed receipt of the following financial support for the research, authorship, and/or publication of this article: This work was supported by the National Natural Science Foundation of China (82071269 to LM), the National Key Research and Development Program of China (2021YFA1101302 to LM).
Supplemental material
Supplemental material for this article is available online.
References
Supplementary Material
Please find the following supplemental material available below.
For Open Access articles published under a Creative Commons License, all supplemental material carries the same license as the article it is associated with.
For non-Open Access articles published, all supplemental material carries a non-exclusive license, and permission requests for re-use of supplemental material or any part of supplemental material shall be sent directly to the copyright owner as specified in the copyright notice associated with the article.