
Abstract
Ovarian cancer is the second most common gynecological malignancy in women. More than 70% of the cases are diagnosed at the advanced stage, presenting as primary peritoneal metastasis, which results in a poor 5-year survival rate of around 40%. Mechanisms of peritoneal metastasis, including adhesion, migration, and invasion, are still not completely understood and therapeutic options are extremely limited. Therefore, there is a strong requirement for a 3D model mimicking the in vivo situation. In this study, we describe the establishment of a 3D tissue model of the human peritoneum based on decellularized porcine small intestinal submucosa (SIS) scaffold. The SIS scaffold was populated with human dermal fibroblasts, with LP-9 cells on the apical side representing the peritoneal mesothelium, while HUVEC cells on the basal side of the scaffold served to mimic the endothelial cell layer. Functional analyses of the transepithelial electrical resistance (TEER) and the FITC-dextran assay indicated the high barrier integrity of our model. The histological, immunohistochemical, and ultrastructural analyses showed the main characteristics of the site of adhesion. Initial experiments using the SKOV-3 cell line as representative for ovarian carcinoma demonstrated the usefulness of our models for studying tumor cell adhesion, as well as the effect of tumor cells on endothelial cell-to-cell contacts. Taken together, our data show that the novel peritoneal 3D tissue model is a promising tool for studying the peritoneal dissemination of ovarian cancer.
Introduction
Ovarian carcinoma is the most lethal gynecological disease. 1 It is the second most common gynecological malignancy in women with a 5-year survival rate of around 43% in Germany. 2 Ovarian carcinoma is a heterogeneous malignancy that metastasizes typically and predominantly in the abdominal cavity. 3 Due to tumor growth with associated ascites production and rapid spread in the peritoneal cavity, more than 70% of the patients are diagnosed at an advanced stage. 4
The peritoneum is the place of the initial contact of ovarian carcinoma cells after they leave the primary tumor cell mass of the ovaries. The human peritoneum is a flat, elastic, serous membrane, which forms the lining of the abdominal cavity (peritoneum parietale) and internal organs (peritoneum viscerale). 5 The peritoneum consists of a mesothelial monolayer, underlying basal lamina, and the connective stromal tissue based on a collagen matrix, 6 which contains fibroblasts, extracellular matrix (ECM), blood vessels, lymphatic vascular networks, and nerve fibers. 7
Abdominal spread is the reason for consecutively developing an ileus, which is the most common cause of death for the patient. So far, a patient’s individualized therapeutic strategy is lacking. This is mainly due to the lack of knowledge of molecular and genetic determinants. In particular, the reasons for the predominantly peritoneal metastasis of ovarian cancer cannot be adequately explained. Since peritoneal metastasis is an important prognostic factor and leads to a lethal outcome, pathological mechanisms at the initial stage of this process can provide the key to therapeutic strategies.
For the efficient study of the mechanism of peritoneal metastasis, it is necessary to have an adequate model system. Animal models, including nude mice, are suited for mimicking the in vivo situation, but there are still differences in comparison to humans. In addition, they are very expensive and time-consuming in planning and implementation and also require high personnel and logistical resources. In search for a more adequate test system similar to the in vivo situation, the usage of 3D tissue models is increasingly gaining significance. In vivo correlation can be achieved by mimicking the structure and function of the human peritoneum on a high level. In 3D tissue models, cells are cultured in a three-dimensional shape, either in form of spheroids or organoids, or supported by an ECM, which can be synthetic or originate from the decellularized native tissues.8,9 Decellularized matrices can be populated with a wide variety of cells, such as fibroblasts and epithelial cells, to obtain models that mimic the desired tissue. Small intestinal submucosa scaffold (SIS) derived from pigs has already been successfully used to generate 3D models of skin, airway, and intestine,10,11 as well as of the urogenital tract mucosal surfaces. 12 Regarding the peritoneal models, apart from the usage of explants,13,14 there have been several reports, in which either human omentum fibroblasts were mixed with the ECM and covered by a layer of primary human mesothelial cells, 15 or an artificial human peritoneal tissue was generated by cell-accumulation technique. 16 A peritoneal model using a porous matrix as support has not been described so far.
In this study, we have developed a human peritoneal 3D tissue model based on the SIS scaffold, which mimics the histology of the peritoneum. The model includes primary human dermal fibroblasts, building the stroma, an apical layer of mesothelial cells (LP 9 cells), and an optional basal layer of endothelial cells (HUVEC). We used this model to perform an initial evaluation of the interaction of ovarian carcinoma cells (SKOV-3) with the surface of the peritoneum and the effect this interaction has on the endothelial layer. Our results demonstrate that the novel 3D tissue model we developed represents a useful tool for studying the adhesion of ovarian carcinoma cells to the human peritoneum, opening the possibility for further in-depth analysis of this process in an environment that closely mimics the in vivo situation.
Materials and methods
Cell lines
Human dermal fibroblasts (HDFib), isolated according to the published protocol from foreskin biopsies of healthy donors, 17 were cultured in Dulbecco’s Modified Eagle Medium (DMEM) (Sigma/Merck, Darmstadt, Germany). HUVEC (Invitrogen C-003-5C), the Human Umbilical Vein Endothelial Cells, were cultured in VascuLife VEGF Endothelial Cell Culture Medium (Lifeline Cell Technology, California, USA). The SKOV-3 (Human ovary: ascites adenocarcinoma cells) and SKOV-3-GFP cell lines were cultured in RPMI (Gibco/Thermo Fisher Scientific, Massachusetts, USA). All media were supplemented with 10% v/v fetal calf serum (FCS) (Sigma/Merck, Darmstadt, Germany) and 1% w/v penicillin/streptomycin (Gibco/Thermo Fisher Scientific, Massachusetts, USA). Human mesothelial cell line LP-9 (Coriell Institute AG07086) was cultured in a 1:1 mixture of MCDB 105 (Sigma/Merck, Darmstadt, Germany) and M199 (Sigma/Merck, Darmstadt, Germany), 15% v/v FCS and 1% penicillin/streptomycin w/v, plus 10 ng/ml hEGF (Sigma/Merck, Darmstadt, Germany) and 400 ng/ml hydrocortisone (Sigma/Merck, Darmstadt, Germany). Before seeding the LP-9 cells, the flask was coated with 3–5 ml gelatine (1% w/v gelatine in 0.9% w/v NaCl solution) for 30 min. SKOV-3-GFP cell line was created using the lentiviral system for the introduction of constitutively expressed GFP. 18 pLVTHM plasmid (empty backbone, second-generation lentivector expressing shRNA from the tetracycline-inducible H1 promoter and GFP), was a gift from Didier Trono (plasmid 12,250; Addgene).
Generation of the SIS scaffold-based 3D tissue cell models
Preparation of porcine small intestinal submucosa scaffold and decellularization was done according to the established protocol. 11 In short, after the removal of the mesentery system, the gut lumen was rinsed with running tap water. Then, the gut was cut into 10–15 cm long pieces, which were inverted. Subsequently, the mucosa was removed mechanically by scraping. The pieces were stored overnight at 4°C in PBS + 1% w/v Pen/Strep on a rocking shaker. To decellularize the gut, the lumen was filled with 50–100 ml of 34 g/l deoxycholate solution and incubated for 1.5 h on a shaker at 4°C. The deoxycholate solution was replaced by phosphate-buffered saline (PBS), followed by one more hour at 4°C on the shaker. The gut segments were cut, opened, and transferred into fresh PBS supplemented with 1% w/v Pen/Strep for 5 h for further washing, which included the exchange of the solution every hour by fresh PBS + 1% w/v Pen/Strep. Finally, the scaffold was sterilized by γ-irradiation using 25 kGy (BBF Sterilisationsservice GmbH, Rommelshausen, Germany), and stored at 4°C in fresh PBS. Pieces of the SIS scaffold were mounted on the plastic 6.5 mm diameter cell crowns by spreading and fixing them between two parts of the crown, which insert into each other generating a Transwell®-like setup with an apical and the basolateral chamber separated by the SIS scaffold. After that, 100,000 fibroblasts were seeded on the apical side of each cell crown in the appropriate medium. The medium was exchanged every 2 days. After 4 days, 100,000 mesothelial cells were seeded on the apical side of the model. Tissue models were cultured under submerged static conditions. Three days later, 300,000 HUVEC cells were seeded on the basal side of the scaffold. For this, first, the cell crowns were turned, and the basal side of the scaffold was coated with fibronectin (100 µl, 5 µg/cm2) (Fibronectin bovine plasma; Sigma-Aldrich, Darmstadt, Germany) for 20–30 min. HUVECs were added and 6 h later, the cell crowns were turned to their initial position and from that point on incubated on an orbital shaker at 25 rpm at 37°C/5% CO2 in the tissue culture incubator.
SKOV-3-GFP (20,000 and 100,000 cells per cell crown) cells were added to the apical side 2 or 4 days later when the fluorescence measurement with FITC-Dextran (Sigma/Merck, Darmstadt, Germany) was between 4% and 6%. To match the requirements for different media for fibroblasts, mesothelial, endothelial, and SKOV-3 cells, the models were cultured in HUVEC VascuLife medium in the basolateral chamber and a mixture of fibroblast/mesothelial (1:2) or a mixture of fibroblast/mesothelial/SKOV-3 (1:2:1) cell medium.
For further processing, tissue models were either fixed in paraformaldehyde (PFA) or glutaraldehyde (GA) for microscopy, or the cells were lysed in Laemmli buffer for protein gel electrophoresis and western blot.
Barrier integrity
We used transepithelial electrical resistance (TEER) as a measurement for the barrier integrity of the epithelial cell monolayer. 19 We considered TEER values below the measured value for the empty SIS scaffold (between 80 Ω cm2 and 90 Ω cm2) as a background. TEER was measured using Millicell® ERS-2 Volt-Ohm Meter. In addition, the integrity of the monolayer was assessed using 4 kDa FITC-dextran (Sigma/Merck, Darmstadt, Germany) permeability assay before seeding of HUVEC cells, after 2 days of cultivation of HUVEC cells, and after 2 and 5 days after addition of SKOV-3-GFP cell line. For this purpose, 0.25 mg/ml FITC-dextran was dissolved in the cell culture medium and filtered. The medium was removed from the apical and basal sides of the cell crown. One microliter of fresh medium was added to the basal side and 300 µl of FITC-dextran containing medium to the apical side. After 30 min of incubation at 37°C, 200 µl from the lower compartment were collected into a 96 well plate (black, clear-bottom) and fluorescence was analyzed using a TECAN reader (absorption 490 nm, emission 525 nm). The results were normalized to the sample with an empty SIS scaffold.
Histology
Tissue models were fixed in 4% w/v PFA. After paraffin-wax embedding, samples were sectioned to 6 μm thickness. Hematoxylin and eosin (H&E) staining was performed after the deparaffinization process in xylene and graded alcohols.10,11
Immunofluorescence microscopy
4% PFA w/v was used to fix the tissue models for 1 h on cell crowns. Afterward, the tissue models were washed with PBS, permeated using 1% w/v saponin (Sigma/Merck, Darmstadt, Germany), blocked with 1% w/v bovine serum albumin (BSA) in PBS, and decorated with primary antibodies overnight. This was followed by decoration with fluorophore-coupled secondary antibodies, DAPI (Sigma, Darmstadt, Germany), and mounting using MOWIOL (Carl Roth, Karlsruhe, Germany). Z-stacks of images were obtained through 25 µm from the top of the monolayer using Leica SP5 and processed by FIJI. 20
Scanning electron microscopy (SEM)
For SEM, tissues were fixed with 6.5% glutaraldehyde (GA) at room temperature for 1 h. Further preparations and analysis of the samples proceeded as already described12,21 using JSM-7500F JEOL microscope.
Cytokine quantification
ELISA MAX assay kit (Biolegend, BIOZOL Diagnostica Vertrieb GmbH, Munich, Germany) was used to detect and quantify the amounts of vascular endothelial growth factor (VEGF) in the medium from the apical and basal compartment of SIS tissue models according to the manufacturer’s instructions.
Antibodies
The antibodies used were anti-CD44 (~3 µg/ml (1:100); Proteintech, Manchester, UK), anti-CD31 (~10 µg/ml (1:100), Lot P2B1, Abcam, Cambridge, UK), and anti-VE-Cadherin (1:100; D87F2, rabbit, Cell Signaling; Frankfurt a. M., Germany). Atto647 (~10 µg/ml (1:100), Lot BCCB3581 rabbit, Sigma/Merck, Darmstadt, Germany) and Alexa555 (~ 20 µg/ml (1:100), Lot 1094410 mouse; Sigma/Merck, Darmstadt, Germany) were used as secondary antibodies. For western blot analysis anti-Actin (1:1000, clone AC-15, mouse, Sigma/Merck; Darmstadt) and anti-GFP (~0.17 µg/ml (1:1000), rabbit polyclonal, GeneTex, Irvine, USA) antibodies were used.
Statistical analyses and graphic
Statistical analysis was performed with one-way ANOVA, Tukey’s multiple comparison test, using GraphPad Prism Software (GraphPad Software, Inc.). The images used in graphics were adapted from the Servier Medical Art templates (smart.servier.com).
Human peritoneal biopsy samples
We used peritoneal tissue samples collected during our previously published work. 22 Non-malignant peritoneal tissue was collected from patients undergoing surgery because of uterine myoma or uterine prolapse. For morphological characterization, H&E staining was performed. All patients gave their informed consent. Tissue collection was approved by the Ethics Committee of the University of Ulm.
Results
Establishment and characterization of SIS-based 3D tissue models
To generate 3D tissue models that could be used to study the attachment and interaction of ovarian cancer cells with the mesothelial cell layer, we used the SIS scaffold as a matrix to mimic the connective tissue of the peritoneum. We populated the SIS scaffold successively with human dermal fibroblasts, LP-9 mesothelial cells, and finally HUVEC cells, to imitate the endothelial lining of blood vessels and provide the vascular barrier. First, primary dermal fibroblasts were seeded on the apical side of the SIS scaffold. Four days later, LP-9 cells were seeded on top and allowed to grow for further 3 days, when HUVEC cells were added on the basal side of the model to obtain a biomimetic model of the peritoneum (Figure 1(a)). Maturation of the models was followed by measuring transepithelial electrical resistance (TEER) and barrier permeability using FITC-dextran assay until day 16 (Figure 1(b) and (c)). The TEER values as well as the permeability changed significantly on day 9 after the introduction of HUVEC cells. FITC-dextran assay showed a significant decrease of permeability of the SIS model on day 9 from ~39% to ~5%, whereas after that point the permeability remained almost unchanged until day 16 (Figure 1(b)). The TEER for our models showed an increase from day 7 (93.36 Ω cm2) to day 9 (101.03 Ω cm2) and stayed nearly the same until day 12 (102.03 Ω cm2). Afterward, a decrease was measured (Figure 1(c)). We, therefore, decided to use the models from day 9, when we considered them mature for our purposes.

Establishment of the SIS-scaffold peritoneal 3D tissue model. (a) A schematic representation of the workflow, starting from the seeding of the fibroblasts on the SIS scaffold in cell crowns on the first day, followed by the addition of the LP-9 cells apically on day 4 and, after reversing the cell crown orientation, HUVEC cells on the basal side of the scaffold on day 7. After several hours of incubation to allow HUVEC cells to attach to the scaffold, cell crowns were reverted into the original orientation and incubated on the shaker for the following 2 days. Up to day 16, the models were monitored to determine the changes in permeability (FITC-dextran measurements) and TEER (b and c). Models as in (a) were monitored from day 7 (HUVEC addition) to day 16 and permeability to FITC-dextran (b) or TEER (c) were assessed in regular intervals. The graphs show relative permeability in comparison to the empty scaffold (b), or the average TEER from three different measurements (c). The values are derived from at least three independent models, and the graphs represent mean values ±SD. Significance was calculated using one-way ANOVA, Tukey’s multiple comparison test; ***p < 0.001.
For further examination, SIS tissue models were fixed in PFA and embedded in paraffin, followed by H&E staining, or analyzed by immunofluorescence and confocal microscopy. Histological characterization showed a thin but dense layer of mesothelial cells on the apical side (Figure 2(a)), resembling the histology of the human peritoneum (Figure 2(b)). Beneath this layer, fibroblasts could be observed growing occasionally within the SIS scaffold, whereas on the basal side of the SIS scaffold endothelial cells appeared as a monolayer (Figure 2(a)). Immunofluorescence staining with CD44 for LP-9 and CD31 antibodies for HUVEC cells, followed by confocal microscopy of the apical and basal side of the model showed a continuous layer of both LP-9 mesothelial cells (Figure 2(c)) and endothelial HUVEC cells (Figure 2(d)).
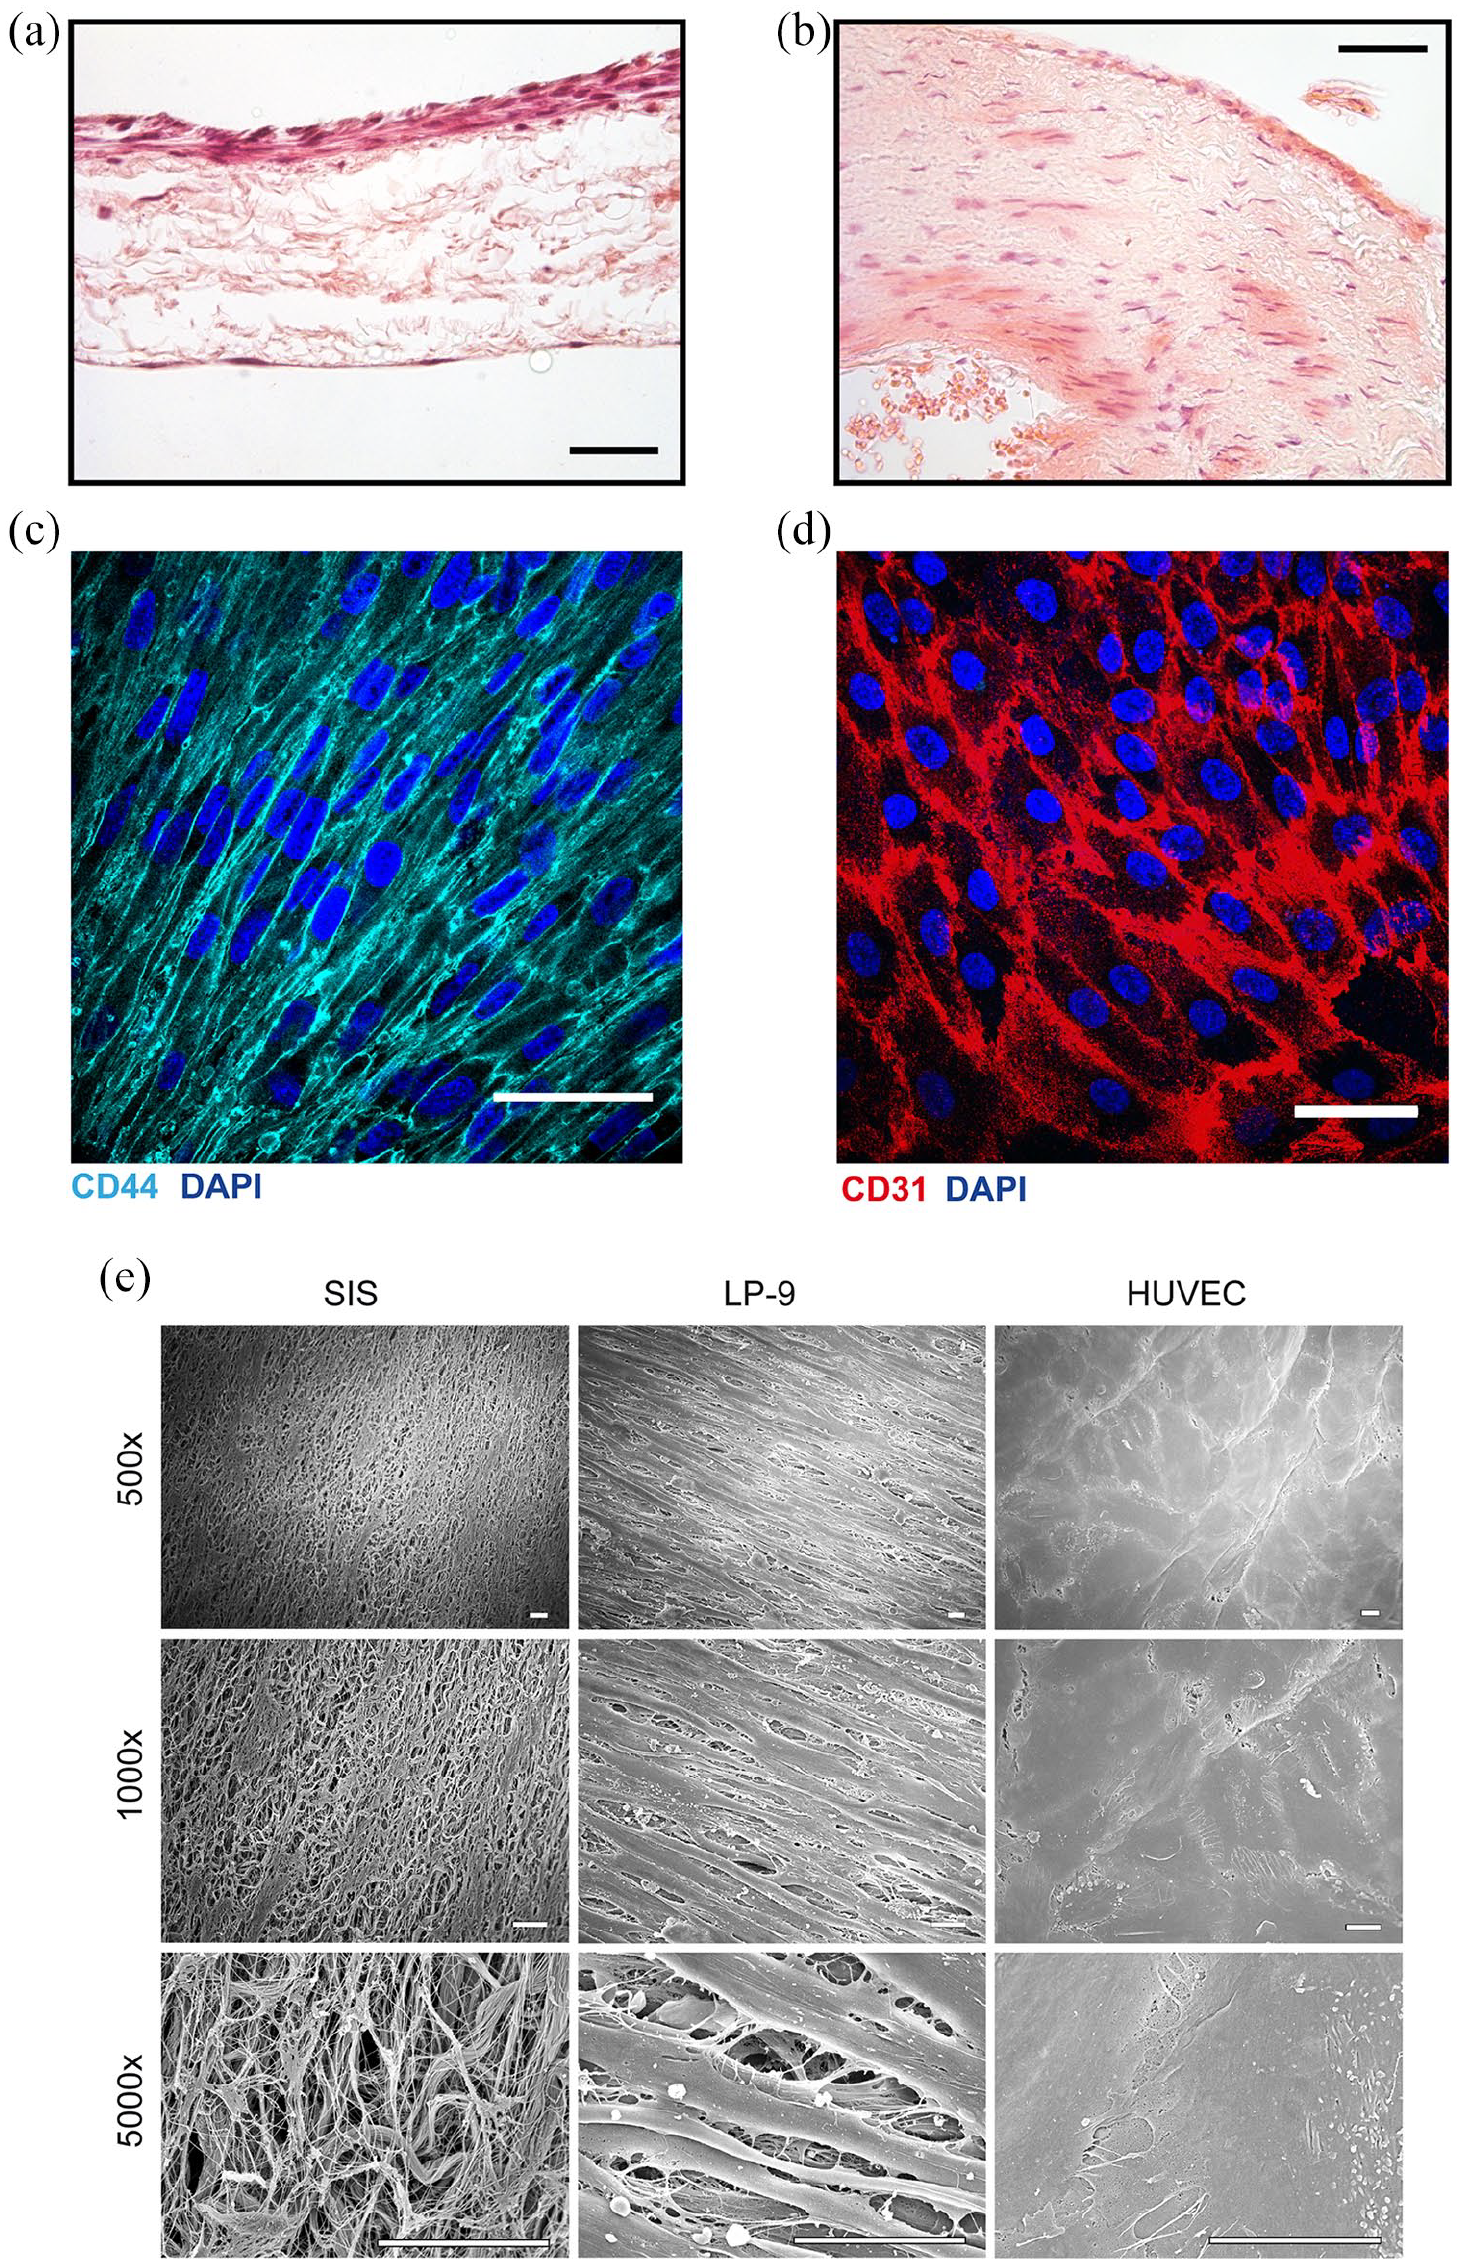
Microscopic characterization of the SIS-scaffold peritoneal 3D tissue model. (a and b) Tissue samples were fixed in paraformaldehyde, dehydrated, cleared, and embedded in paraffin. Sections were analyzed by H&E staining and microscopy. 3D tissue model, with three types of cells (LP-9 on the top, fibroblasts in the scaffold, and endothelial HUVEC cells on the bottom) (a) is shown in comparison to the peritoneal tissue biopsy from a healthy patient (b). The scale bar is 100 µm. (c and d) SIS-scaffold tissue models were grown for 9 days, fixed, and stained for immunofluorescence microscopy using DAPI and mesothelium-specific marker CD44 (c) or endothelium-specific marker CD31 (d). The images were taken from the apical side of the model (c) or the basal side of the model (d) using a confocal microscope and were processed by Image-J. The scale bar is 50 µm. (e) Scanning electron microscopy of the empty SIS scaffold (left-hand panels), the apical, Lp-9-Populated side of the models (middle panels), and the basal, HUVEC-populated side (right-hand panels) from 3D peritoneal models prepared as in (c and d). The scale bar is 10 µm.
SEM analysis was then performed to compare the surface of the empty SIS scaffold with the apical and basal sides of the mature models. In the empty SIS scaffold, the fibers of the matrix were visible (Figure 2(e), left-hand panels). On the apical side of mature models, a layer of elongated, overlapping LP-9 cells could be seen (Figure 2(e), middle panels), whereas the basal side appeared covered with an uninterrupted sheet of flat endothelial cells (Figure 2(e), right-hand panels). These data show that within 9 days we could reproducibly generate 3D tissue models that contain three types of cells, namely fibroblasts, mesothelial, and endothelial cells.
Interaction of SKOV-3 ovarian carcinoma cells with 3D tissue models of peritoneum
After the establishment and morphological characterization of the SIS scaffold-based peritoneal 3D tissue model, we added the ovarian carcinoma cells (SKOV-3) to the apical side of the model to study the interaction with the mesothelial cells. To enable easier detection, SKOV-3 cells were tagged with constitutively expressed GFP using a lentivirus-based system (Figure 3(a)). Upon addition of SKOV-3 cells to the model, followed by medium exchange 48 h later, H&E staining of tissue sections showed that tumor cells interacted with and efficiently attached to the layer of LP-9 cells (Figure 3(b)). In comparison to the patient biopsy (Figure 3(c)), we did not observe infiltration of SKOV-3 cells into our model.

The interaction of the SKOV-3 ovarian cancer cells with the 3D peritoneal tissue models. (a) A schematic representation of the workflow for the analysis of the interaction of tumor cells with models. Upon maturation of models on day 9, SKOV-3 cells labeled with constitutively expressed GFP (SKOV-3-GFP) were added to the apical surface of the models in different numbers, left to interact for 2 days, and then measurements (permeability to FITC-dextran, TEER) were made. The medium was collected for later ELISA measurements and exchanged for a fresh one. The same procedure was repeated 3 days later, on day 14. (b and c) Microscopic analysis after H&E staining of the models on day 14 where 100,000 SKOV-3-GFP cells were added (b) in comparison to a patient tumor biopsy (c). The arrows indicate potential SKOV-3-GFP or tumor cells, respectively. The scale bar is 100 µm. (d) Peritoneal 3D tissue models were analyzed by immunofluorescence microscopy on day 14 after the addition of 20,000 and 100,000 SKOV-3-GFP cells. The images show the GFP signal in green, CD44 staining in magenta, DAPI staining in blue, and an overlay image. The scale bar is 50 µm. (e) The models as in (d) were analyzed by scanning electron microscopy to observe the interaction of SKOV-3-GFP cells with the LP-9 cells of the apical side of the model. The scale bar is 10 µm.
Immunofluorescence analysis of the models to which SKOV-3 cells were added showed that GFP-positive cells could be detected attached to the layer of CD44-positive LP-9 cells. The increase in the number of SKOV-3 cells added, from 20,000 to 100,000, resulted in the increased density of GFP-positive cells on the models (Figure 3(d)). Finally, SEM analysis showed several rounded cells with highly irregular surfaces attaching to a layer of elongated cells, for which we presume are SKOV-3 and LP-9 cells, respectively (Figure 3(e)). Interestingly, the rounded cells seemed to attach to the underlying elongated cells through many fiber-like structures (Figure 3(e), right-hand panel, highest magnification). In comparison to the LP-9 cells from the control models (Figure 2(e)), the addition of SKOV-3 cells led to the appearance of numerous budding vesicles on the surface of LP-9 cells (Figure 3(e)). This could be the consequence of the changes in the cell culture medium but could also be the result of the interaction of the mesothelial cells with tumor cells.
The interaction of the SKOV-3 cells with 3D peritoneal tissue models is quantifiable and leads to changes in the endothelial cell layer
We next searched for a way to quantify the interaction of SKOV-3 cells with the 3D peritoneal tissue models. Similar to Figure 3(d) we added different numbers of SKOV-3 cells to the models and counted the number of GFP-positive cells on the surface on day 2 and day 5 after the SKOV-3 addition (day 11 and day 14 in total). Using this method, we could observe that more cells were attached after we added the higher number of SKOV-3 cells, but there was no significant proliferation of the cells from day 2 to day 5, at least not according to this method of quantification (Figure 4(a)). We also treated the surface of the models with Laemmli buffer to lyse the cells and analyzed cell lysates by SDS-PAGE and western blot. We could observe an increase in the GFP signal depending on the number of SKOV-3 cells added, which indicates that by this method we can reliably quantify the number of attached tumor cells (Figure 4(b)).
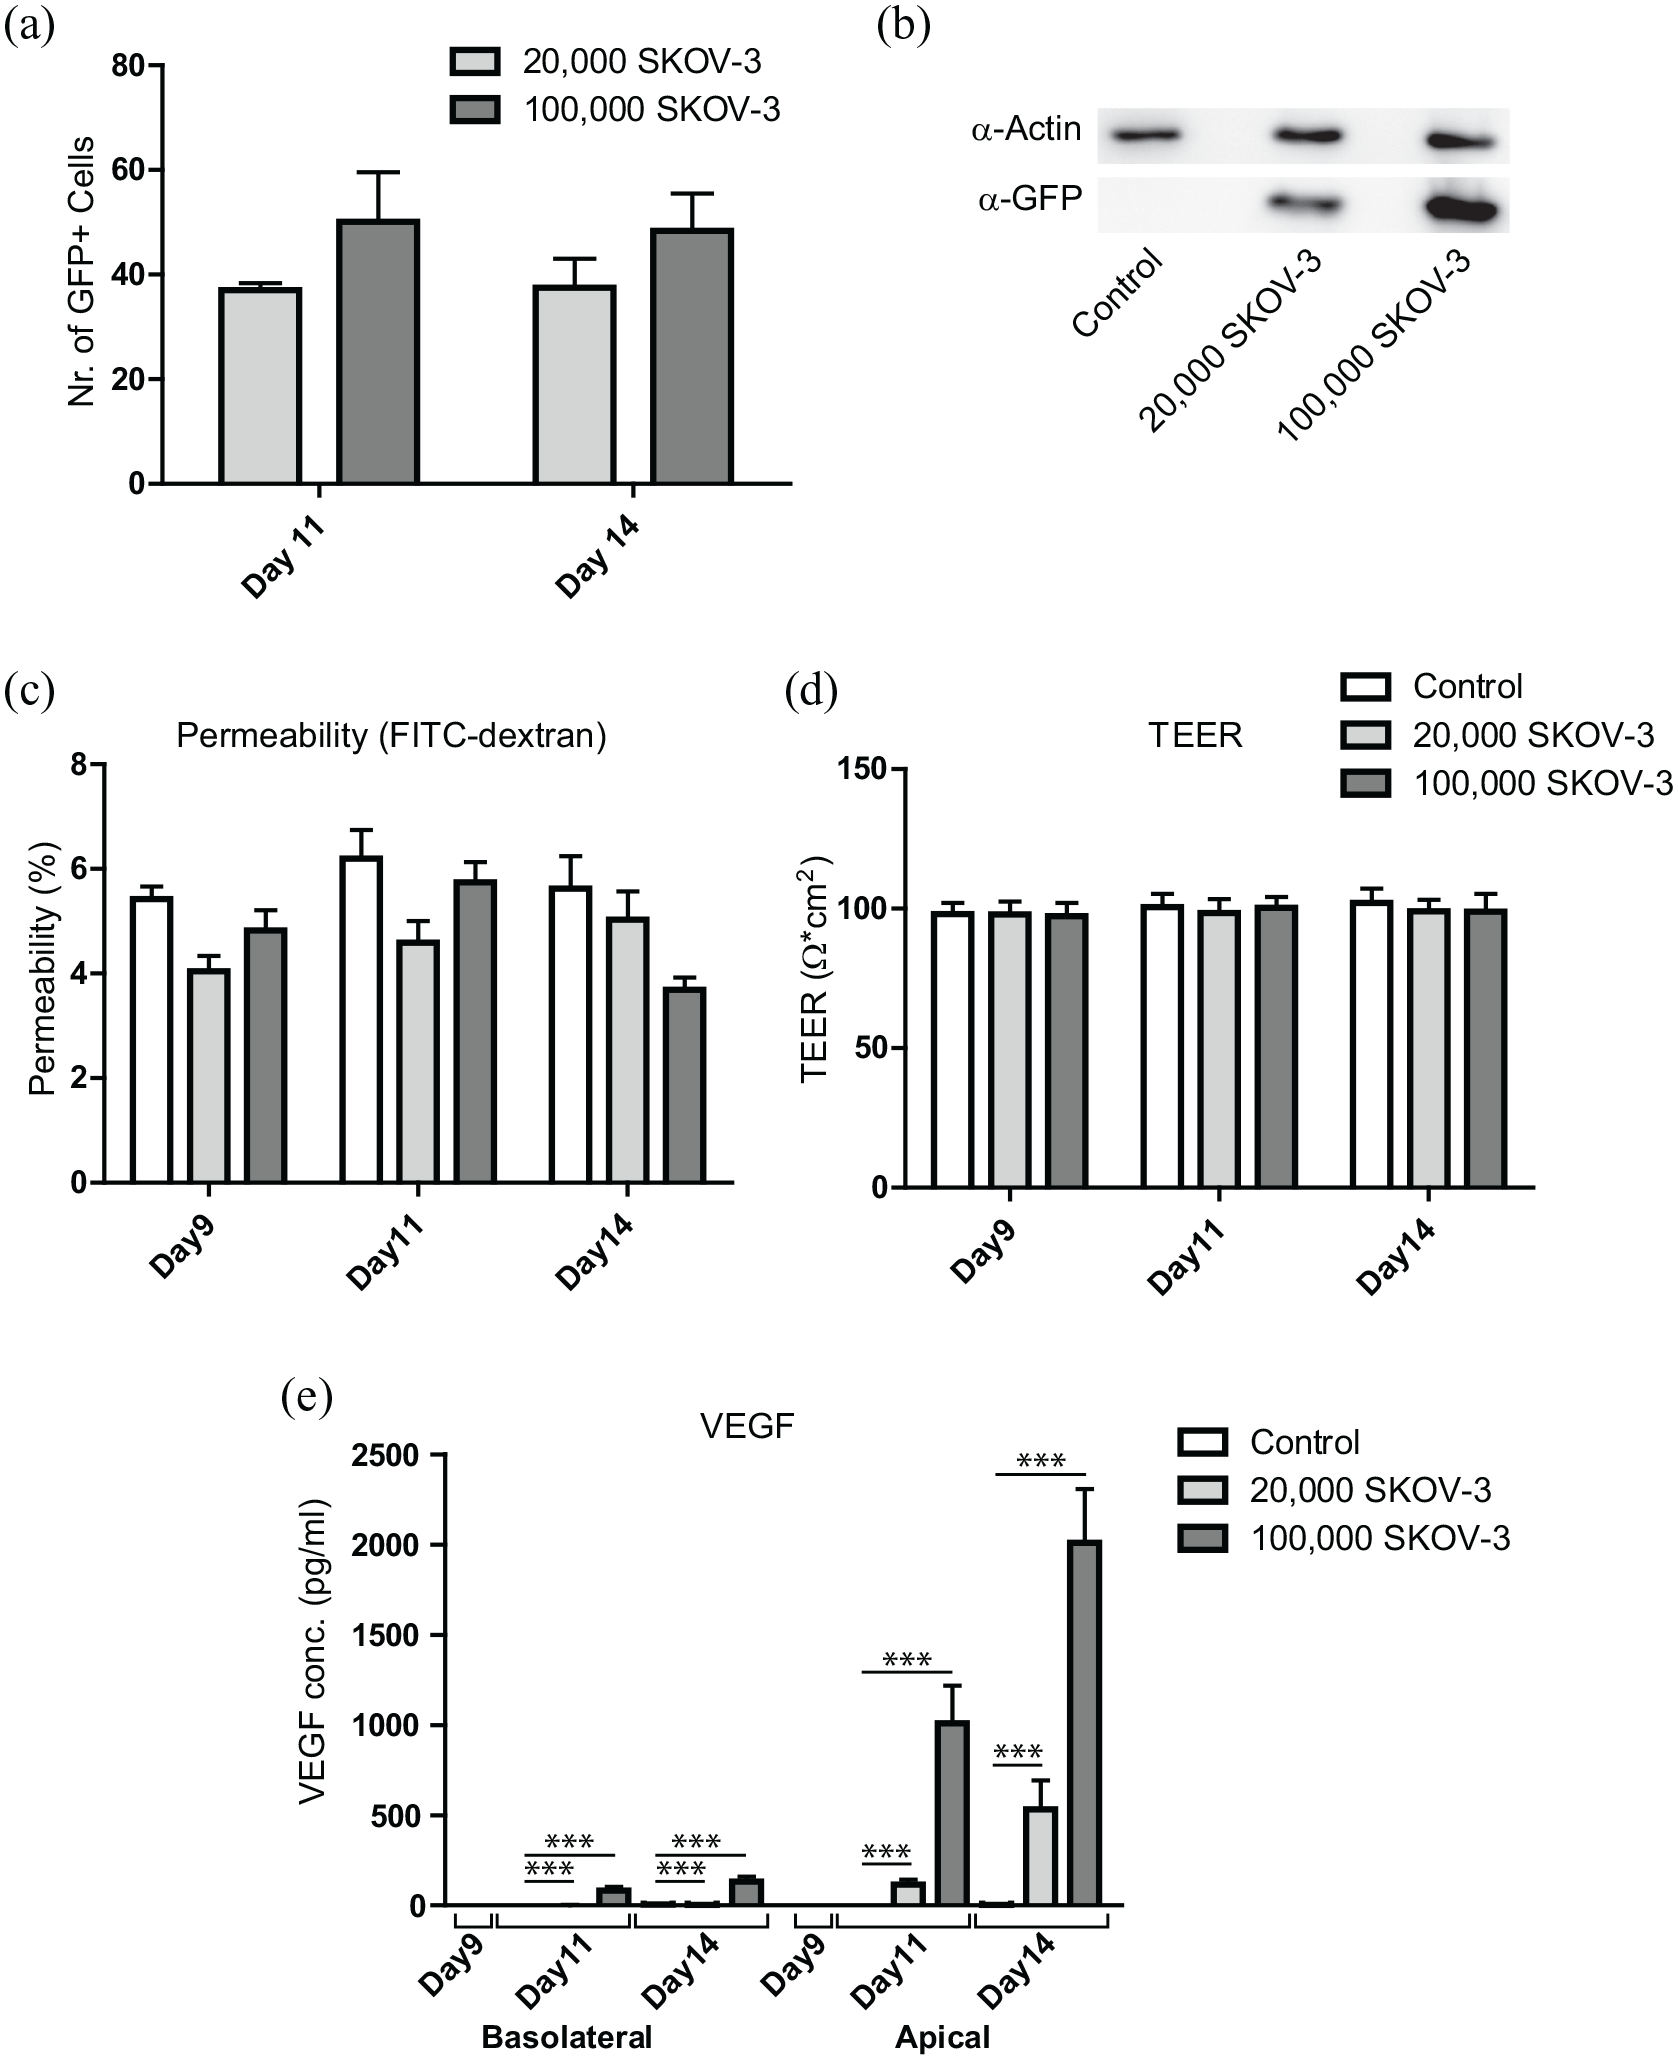
Analysis of the effects of SKOV-3-GFP cell addition to the peritoneal 3D tissue models. (a) Models were prepared for immunofluorescence analysis as described in Figure 3(d) and the number of GFP-positive cells was counted manually from at least five different fields of view for each sample. The graph shows mean values ±SD from three independent experiments. (b) Models were grown and incubated with 20,000 and 100,000 SKOV-3-GFP cells as in (a). On day 14, cells from the apical side of the scaffold were taken up in Laemmli buffer and the samples were analyzed by SDS-PAGE and western blot, using antibodies against actin and GFP. (c and d) As described in the workflow in Figure 3(a), permeability and TEER of the models with added SKOV-3-GFP cells were assessed on the day of the addition (day 9) and 2 or 5 days later. The graphs represent mean values ±SD from at least three independent experiments. Permeability to FITC-dextran is presented as relative values to those measured for an empty SIS scaffold. (e) The medium was collected as described in Figure 3(a) and the amounts of VEGF were assessed on day 11 (48 h old medium) and day 14 (72 h old medium) using ELISA. The graph represents mean values ±SD from at least three independent experiments, for the medium collected from the bottom compartment (basolateral) and top compartment (apical) of the cell crowns, for control, 20,000 and 100,000 of SKOV-3-GFP cells added. Significance was calculated using one-way ANOVA, Tukey’s multiple comparison test; ***p < 0.001.
Further characterization of the models where SKOV-3 cells were added showed that permeability to FITC-dextran varied depending on the day and the number of SKOV-3 cells added but was generally slightly lower in the models where the SKOV-3 cells were present in comparison to the SKOV-3-free models (Figure 4(c)). On the other hand, TEER values remained unchanged (Figure 4(d)). This shows that the addition of SKOV-3 cells did not lead to significant changes in model permeability within the 5 days of our assessment.
SKOV-3 cells produce high amounts of VEGF 23 ; therefore, we tested the amounts of VEGF in the apical and basolateral compartments of our models, depending on the number of SKOV-3 cells added and the length of incubation. We could show that in the apical compartment, the amounts of measured VEGF increased with incubation time, and, even more, depended on the number of SKOV-3 cells in the model. On the basolateral side, the VEGF amounts approximately doubled between day 11 and day 14 and were approximately 40 times increased in models with 100,000 SKOV-3 cells as compared to the ones where 20,000 SKOV-3 cells were added. In general, however, the VEGF levels were low, either because of the poor diffusion or because of VEGF being used up by the endothelial cells (Figure 4(e)).
To distinguish between these two possibilities, we analyzed cell-cell contacts between endothelial cells in models with lower and higher SKOV-3 cell numbers, after 5 days of incubation (day 14) using immunofluorescent staining for VE-cadherin and confocal microscopy. We observed that, upon the addition of SKOV-3 cells to the models, and depending on the SKOV-3 cell number, the membrane localization of VE-cadherin diminished, and the signal became increasingly cytosolic (Figure 5), indicating the loosening of the intercellular contacts. This might be the result of the exposure of endothelial cells to high levels of VEGF produced by SKOV-3 cells on the surface of the models.

The presence of SKOV-3-GFP cells on the apical side of the peritoneal 3D tissue models influences VE-cadherin distribution in endothelial HUVEC cells on the basal model side. 3D tissue models of peritoneum were grown for 9 days and then SKOV-3-GFP cells were added to the apical side, as described in Figure 3(a). Five days after the addition of the tumor cells the models were fixed and HUVEC cells on the basal side were decorated with DAPI and VE-cadherin and analyzed by confocal microscopy. The scale bar is 50 µm.
Taken together, our data show the successful establishment of novel 3D peritoneal tissue models, which we used to study in a quantifiable manner the interaction of SKOV-3 cells with mesothelial cells, and the effect of tumor cell attachment on the integrity of the endothelial layer.
Discussion
In this work, we established a novel 3D tissue model of the human peritoneum based on the SIS scaffold, which included three different types of cells representative of the mesothelial layer, stroma, and endothelial layer. We next showed that these models were in certain aspects comparable to the native human peritoneal tissue; however, they lack blood vessels and immune cells. In addition, the connective tissue of the peritoneum and SIS scaffold we used differ as well. Our models, nevertheless, can be used to quantifiably assess the attachment of ovarian carcinoma cells to mesothelial cells, as well as to study the impact this interaction has on the endothelial cell layer.
Our model differs from the currently available models in that it uses the SIS scaffold to support the mesothelial cells. Whereas in other models, the stroma was mimicked by fibroblasts mixed with the ECM consisting of collagen, 15 or by coating the cells with gelatine and fibronectin and seeding them on Transwell® inserts using the cell accumulation technique, 16 we used a biological ECM. The advantages of the SIS scaffold are that it contains a mixture of structural molecules and growth factors, including collagen, elastin, glycosaminoglycans, and proteoglycans as opposed to only a single or double component. 24 Considering that the composition of the ECM can be important for understanding metastasis, 7 using SIS scaffold might lead to the generation of models better mimicking the in vivo situation.
In comparison to the previous models used for studying the interaction between mesothelium and ovarian cancer cells, our model shows certain advantages. Iwanicki et al. 25 model used a monolayer of immortalized lung mesothelium to study the attachment of ovarian cancer spheroids. Despite offering the possibility to study dynamic interactions of the mesothelial cells with the spheroids using time-lapse microscopy, it is still a simplified structure since only a few histological aspects of the peritoneum are included.
Several other models have also used cultured monolayer of mesothelial cells for studying the interaction of ovarian cancer and peritoneum.26,27 A different example is the study of Kanemoto and colleagues 28 where they investigated the interaction of ovarian cancer cells with different ECM constituents. The advantages of models that combine these two aspects, to which our model belongs, are clear, due to the higher correlation of such models to the natural environment.
The model introduced by Kenny et al. 29 contains two cell types, the mesothelial cells, as well as the omentum fibroblasts. Using omentum fibroblasts, instead of human dermal fibroblasts that we, as well as Asano and colleagues, 16 have used is an advantage of these models and we will consider doing it in the future. However, this model consisted of layered cells without a scaffold and did not include endothelial or immune cells. In contrast, the presence of endothelial cells in our model creates not only more physiological conditions but enables us to study the effect that the presence of tumor cells has on the endothelial barrier.
The model of Asano et al. made by cell-accumulation technique is an advanced model including three types of cells similar to our model but does not include scaffold. For this, different cells are covered with nanofilms of gelatine and fibronectin and assembled layer-by-layer.30,31 Using this model, they could show the invasion of SKOV-3 cells as opposed to the non-invasive behavior of colon cancer cells HT-29. In our model, during the 5 days after the introduction of SKOV-3 cells, we did not observe the invasion, as the cells remained on the surface of the models (Figure 3). This can either be the consequence of the different properties of the SIS scaffold that might not support the invasion, the properties of the SKOV-3 cell line, which is derived from serous cystadenocarcinoma, or our period of observation was too short. Nevertheless, we could demonstrate the high VEGF production of SKOV-3 cells and its effect on the loosening of the endothelial barrier, which corresponds to the in vivo situation.
SKOV-3 and A2780 are the most frequently used cell lines for ovarian cancer models besides OVCAR-3 and IGROV1. 32 Due to the easy labeling of the SKOV-3 cells with the cytosolic GFP marker, which is a prerequisite for the reliable quantification of the attachment efficiency of these cells, we have performed the initial experiments using this cell line. It would be interesting to compare the results using other cell lines, or even primary tumor cells derived from the patients.
We have used microscopy for quantifying the number of attached SKOV-3 cells and have observed no increase in the number of green cells from day 11 to day 14. This could be the consequence of the usage of mixed medium, which might have slowed down the proliferation of SKOV-3 cells. It is important to note, however, that microscopy is not an entirely reliable method for the quantification of the number of attached cells because it is difficult to differentiate between the cells growing on top of each other. For more reliable quantification one could turn to Western blot or attempt to detach the cells from the scaffold and use FACS to count the number of GFP-expressing cells.
For angiogenesis regulation, VEGF is the most important factor. It is highly expressed in ovarian cancer and secreted into ascites to an extremely high degree. 33 Our previous work showed that a high concentration of VEGF leads to increased vascular permeability of peritoneal vessels, which facilitates local tumor spread.33,34 Supporting these observations, the data obtained with our model also show that an increasing number of SKOV-3 cells leads to a higher concentration of VEGF, which is consequently reflected in the decrease of the membrane localization of VE-cadherin, indicating the loosening of the endothelial cell-to-cell contacts. Our model can be therefore used to assess the effect of tumor cells on the loosening of the vascular barrier. The decrease in membrane localization of VE-cadherin, however, does not lead to significant changes in the permeability of our models, which might be because the changes are small and compensated by the presence of SKOV-3 cells.
For the further advancement of our 3D model, we plan, in addition to using primary patient-derived cells, to also adjust the medium to better correspond to the peritoneal fluid, for example by increasing the amount of fibrinogen. Our preliminary experiments also open the possibility of using the cells for transcriptome analysis of mesothelial and cancer cells at different stages of interaction, which would be achieved by detaching the cells from the scaffold and differentiating between the GFP-labeled tumor cells and unlabeled mesothelial cells.
Conclusion
Our study shows the successful establishment of a novel human peritoneal 3D tissue model, which is a reproducible tool that can be used for studying the dissemination of ovarian cancer and the interaction between cancer, mesothelial, and endothelial cells at the peritoneum. The tissue model offers the opportunity for studying inter-individual differences or differences of ovarian carcinoma cells subtypes. In addition, these models could be a platform to analyze the efficiency of drugs or antibodies preventing the attachment of tumor cells. Furthermore, our 3D models are suitable for investigations of other pathologies at the peritoneum, such as endometriosis.
Footnotes
Acknowledgements
Data availability
Data and research material related to this publication are available from the corresponding authors on reasonable request.
Declaration of conflicting interests
The author(s) declared no potential conflicts of interest with respect to the research, authorship, and/or publication of this article.
Funding
The author(s) disclosed receipt of the following financial support for the research, authorship, and/or publication of this article: This work was supported by the Deutsche Forschungsgemeinschaft (DFG) GRK 2157 3D Tissue Models for Studying Microbial Infections by Human Pathogens to VK-P and TR. This publication was funded by the German Research Foundation (DFG) and the University of Wuerzburg in the funding program Open Access Publishing.