
Abstract
The immaturity of human induced pluripotent stem cell derived engineered cardiac tissues limits their ability to regenerate damaged myocardium and to serve as robust in vitro models for human disease and drug toxicity studies. Several chronic biomimetic conditioning protocols, including mechanical stretch, perfusion, and/or electrical stimulation promote engineered cardiac tissue maturation but have significant technical limitations. Non-contacting chronic optical stimulation using heterologously expressed channelrhodopsin light-gated ion channels, termed optogenetics, may be an advantageous alternative to chronic invasive electrical stimulation for engineered cardiac tissue conditioning. We designed proof-of-principle experiments to successfully transfect human induced pluripotent stem cell derived engineered cardiac tissues with a desensitization resistant, chimeric channelrhodopsin protein, and then optically paced engineered cardiac tissues to accelerate maturation. We transfected human induced pluripotent stem cell engineered cardiac tissues using an adeno-associated virus packaged chimeric channelrhodopsin and then verified optically paced by whole cell patch clamp. Engineered cardiac tissues were then chronically optically paced above their intrinsic beat rates in vitro from day 7 to 14. Chronically optically paced resulted in improved engineered cardiac tissue electrophysiological properties and subtle changes in the expression of some cardiac relevant genes, though active force generation and histology were unchanged. These results validate the feasibility of a novel chronically optically paced paradigm to explore non-invasive and scalable optically paced–induced engineered cardiac tissue maturation strategies.
Introduction
Because the human heart cannot regenerate following injury and undergoes progressive cardiac muscle loss and dysfunction, there is a broad interest to develop cellular strategies for cardiac repair and regeneration.1,2 Injected or infused cell therapies result in modest improvements in myocardial function; however, greater than 90% of cells are lost within the first few days following transplantation. 1 Tissue engineering strategies that combine cells with supportive biomaterials before transplantation result in increased cell survival and both myocardial structural and functional recovery.3–15 Tissue engineering strategies utilizing cardiac patches, injectable delivery matrices, microspheres for cell encapsulation, and engineered cardiac tissues (ECTs) all face the challenge of cardiomyocyte (CM) immaturity, particularly when myocardial cells are derived from human-induced pluripotent stem cells (h-iPSCs).8–10,12 ECTs have been generated from a wide range of vertebrate cell sources3,4,6,7,9,10,12–19 and a wide range of tissue geometries.5,6,7,8,11,13,15 ECT implantation results in structural and functional recovery in both small7,10–12,15,18,20 and large animal9,13 preclinical models. However, immune rejection remains a major barrier to ECT survival post-implantation, resulting in major efforts to generate immune tolerant allogeneic or autologous h-iPSC cell sources for tissue repair and regeneration.
ECTs possess a range of immature structural and functional characteristics, including immature sarcomeric structure, undeveloped ion exchange and storage architecture4,8,14,18,21 and reduced force generation and relaxation characteristics compared to mature, adult myocardium.17,22–24 Bioreactors can mimic some in vivo conditions, such as cyclic stretch and mechanical stresses via continuous or pulsatile perfusion and fluid shear forces, and these bioreactors promote differentiation of immature cardiac cells.8,25 ECT perfusion increases nutrient transport, and mechanical stretch modulates cytoskeletal architecture and integrin binding, receptor tyrosine kinase activation, and GTPase activity, all leading to accelerated growth and differentiation.25,26
Electrical stimulation (ES) has been used to stimulate CM maturation for more than 2 decades25,27–42 and may promote CM differentiation by replicating endogenous electric fields present during embryonic development that influence cellular behavior, proliferation, and migration.28,29 In general, these techniques produce ES to the entire ECT via field stimulation and studies using ECTs derived from rat CM demonstrated increased myocyte volume fraction, alignment, and connexin-43 expression 31 as well as a positive force–frequency relationship, representative of a more mature contractile phenotype. 21 ES effects were also observed in h-iPS-derived ECTs, including greater force generation and myofiber alignment and enhanced electrophysiological properties.30,33 At the cellular and molecular scale, ES was shown to induce a hypertrophic CM response, including increased myosin light chain expression and enhanced atrial natriuretic factor secretion, which may depend on calcium influx and the calcium-calmodulin pathway due to the inhibition of atrial natriuretic factor (ANF) secretion by nifedipine, 32 and the activation of c-Jun N-terminal kinase (JNK), which could activate downstream gene pathways. 43 Intracellularly, ES triggered mitochondrial proliferation and maturation, 39 increasing the expression of nuclear respiratory factor 1 (NRF-1) and activator protein 1 (AP-1) transcription factors,40,41 which are frequently upregulated in response to cellular stress, as well as upregulation of a muscle-specific metabolic gene, Adss1, through the involvement of the calcineurin/NFAT3 and GATA4 pathways. 42 Hybrid approaches, such as the combination of ES with topographical cues, have enhanced cell morphology and contractile maturation 27 and the combination of ES and mechanical stretch increased cell alignment and nonlinear anisotropic behavior. 44 In non-CM studies, ES increased cardiac gene expression and triggered elongation and alignment perpendicular to the electric field in mesenchymal stem cells, 45 and increased sarcomere organization in C2C12 myoblasts. 34 However, although these structural and functional effects of ES are well described, our understanding of the precise mechanisms by which ES induces ECT differentiation and maturation is limited and they remain largely undefined. Furthermore, while ES can produce beneficial effects, this technique is invasive, can generate toxic Faradaic reactions at higher voltages, and has limited spatiotemporal resolution.33,45–48 Furthermore, a major limitation of in vitro experimental systems that directly electrically stimulate engineered tissues is the complexity and expense of the apparatus and the requirement to directly instrument each tissue. In contrast, a non-contacting optogenetic stimulation system can be scaled to much larger culture ECT arrays because of the lack of direct electrical instrumentation of individual tissues and the relatively low cost and reusable nature of LED arrays.
Optogenetic stimulation is an alternative and, perhaps, less invasive and more scalable strategy to stimulate ECT maturation versus traditional ES. 45 Optogenetics involves the heterologous expression and subsequent light stimulation of light-sensitive ion channels, channelrhodopsins (ChR), initially derived from Chlamydomonas reinhardtii, and subsequently derived from other algal species, to produce action potentials. 49 Following heterologous expression of ChR, blue light stimulation causes an all-trans retinal chromophore in the channel to isomerize to 13-cis retinal, triggering an action potential. 49 Since the initial study which utilized channelrhodopsin-2 (ChR2), a range of neuroscience and cardiac studies have used ChR2 to generate controlled action potentials in single cells and tissues.49–51 These light sensitive ion channels include point mutation chimeric ChR1 and ChR2 variants such as ChIEF, which have been developed to produce large photocurrents with reduced light desensitization. 52 Advantages of optogenetic stimulation compared to ES include noninvasiveness, cell-specificity, sarcolemmal level negative-feedback, scalability, and the potential for lower toxicity 33,45,48
Cardiac optogenetic applications are relatively novel but demonstrate the utility of this approach. ChR2 was successfully expressed and stimulated in mouse embryonic stem cell (ESC) derived CM. 46 Expressing ChR2 in human embryonic kidney (HEK) cells and showed that HEK light stimulation could produce electrical wave propagation through the co-cultured HEK-ChR2 + CM monolayers. 51 ChR2 was successfully applied for acute stimulation in the context of C2C12 myotubes and rat ECTs.53,54 Cardiac optogenetics has been demonstrated in human cells as well, expressing functional ChR2 in h-ESC and h-iPSC derived CM.47,49 However, to date no study has successfully expressed a functional ChR protein in ECTs composed of h-iPSC CM, or used this approach to chronically stimulate and mature CM. Therefore, in the current study, we expressed the ChIEF protein in h-iPSC-CM derived ECTs to investigate the effects of optogenetic stimulation for 7 days on h-iPSC ECT structural and functional maturation.
Materials and methods
Construction of optogenetic human-iPSC derived ECTs
We generated ECTs from h-iPSCs (4-factor (Oct3/4, Sox2, Klf4, and c-Myc) line 201B6) produced at the Center for iPS Cell Research and Application, Kyoto, Japan, as previously described.
10
The h-iPSC line was maintained on thin-coat Matrigel (growth factor reduced, 1:60 dilution; BD Biosciences, San Jose, CA) in 1 ng/mL human basic fibroblast growth factor (hbFGF; WAKO, Osaka, Japan) augmented mouse embryonic fibroblast conditioned medium (MEF-CM) generated in our laboratory. For cardiovascular (CV) cell lineage induction, we (1) treated undifferentiated h-iPSCs with Versene (0.48 mM ethylenediaminetetraacetic acid (EDTA) solution; Life Technologies, Carlsbad, CA) treatment, (2) re-plated cells at 1000 mm-2 on Matrigel-coated plates in hbFGF-augmented MEF-CM for 2–3 days, (3) overlaid with Matrigel (1:60 dilution) for an additional day, then replaced the MEF-CM with RPMI + B27 medium (RPMI1640; Life Technologies, 2 mM L-glutamine; Life Technologies, 1X B27 supplement without insulin; Life Technologies) supplemented with 100 ng/mL Activin A (R&D, Minneapolis, MN) and 100 ng/mL Wnt3a (R&D) for 24 h (differentiation day 0; d0), and (4) added 10 ng/mL human bone morphogenetic protein 4 (BMP4; R&D) and 10 ng/mL hbFGF at d1 for 2 or 4 days with no medium change.
55
For CM and endothelial cell (EC) differentiation, we refreshed the RPMI + B27 culture medium at d5, supplemented with VEGF165 (Miltenyi, Bergisch Gladbach, Germany), and refreshed culture medium every other day. To generate a predominantly mural cell (MC) population, we replaced the culture medium at d3 with RPMI + 10% fetal bovine serum (FBS) medium (RPMI1640, 2 mM
For each ECT, we combined three million cells from the CM + EC and MC protocols. We cultured two ECT groups to day 14 (D14). One group was not transfected and did not undergo any light simulation. In the second D14 group, ECTs were transfected and we performed chronic optical pacing (C-OP) as described below from D7 to D14. We cultured an additional group of non-transfected tissues to D28. Therefore, we had three ECT groups: D14 control, D14 C-OP, and D28. The final average CM/EC/MC% concentration was 60%/13%/12% for D14 control tissues, 56%/11%/14% for D14 C-OP tissues, and 69%/6%/12% for D28 tissues.
We suspended each cell mixture in culture medium (Modified Dulbecco’s Essential Medium, Invitrogen) containing 20% FBS (Invitrogen) as previously described. 10 We added the suspended cells to a solution of soluble acidic rat-tail collagen type-1 (pH = 3 in HCl; Sigma), neutralized with alkali buffer (0.2M NaHCO3, 0.2M HEPES, 0.1 M NaOH), and Matrigel. The total volume of the cell/matrix solution was 200 μL, with a collagen concentration of 0.67 mg/mL and Matrigel fraction of 15%. We transfected cells with an adeno-associated virus (AAV)1/2-CAG-oChIEF-tdTomato vector (VectorBioLabs, Malvern, PA) added directly to the cell/matrix mixture at a multiplicity of infection (MOI) of 500 based on pilot dose-transfection efficiency experiments that resulted in at least 20% transfection efficiency without cell death and resulted in 100% OP capture. Other than the addition of the AAV1-ChIEF construct, all other ECT fabrication processes were similar to our previously published methods.10,12 For control tissues and day 28 ECTs, we omitted this viral transfection step. We then generated linear ECTs using a Flexcell® FX-5000TT system and a collagen type-1 coated silicone membrane 6-well plate (TissueTrain®, Flexcell International, Hillsborough, FL). Using vacuum suction, we deformed the silicone membrane at the bottom of each well into a 20 mm length x 2 mm width trough. We added 200 μL of the cell/matrix mixture to each vacuum-generated trough to form a cylindrical ECT, with the ends extending onto nylon mesh anchors. After 120 min, we released the vacuum suction and added pre-culture medium to the tissue (PM; alpha minimum essential medium (αMEM; Life Technologies) augmented with 10% FBS, 100 U/mL penicillin-streptomyocin (Life Technologies), and 5 × 10⁻⁵ M 2-mercaptoethanol (Sigma)). During ECT culture, we changed medium every 48 h. We conducted ECT formation and culture in an incubator maintained at 37°C and 5% CO2.
Chronic light stimulation
We performed C-OP of ECTs from D7 to D14 of in vitro culture using a custom-built LED (470 nm Rebel LED, model SP-01-04, Luxeon, Alberta, Canada) array driven by BuckPuck DC LED drivers (LEDsupply, Randolph, VT) and a programmable microcontroller (Arduino Uno, Italy) to generate broad field optical stimulation of all cells within the ECT, similar to the approach of broad electrical field stimulation. We mounted the LEDs on a high-alpha heat sink (Luxeon) for thermal management. We controlled the pulse width and frequency of the LEDs using an Arduino Uno microcontroller (Italy). We programmed the Arduino with free Arduino IDE software. We used a 5 ms pulse width. At the beginning of each C-OP culture day, we measured the optical maximum capture rate (MCR) using video microscopy (MU1000, AmScope, Irvine, CA). The C-OP rate for the next 24 h was then set at a rate 0.5 Hz below the MCR. We recorded intrinsic beat rate, optical MCR, and C-OP rate daily from D7 to D14. For D14 control ECTs and D28 ECTs, we only recorded the daily intrinsic rate.
Force testing
We measured ECT mechanical function using a custom-isolated muscle testing system containing temperature-regulated perfusion bath and pacing electrodes (model 801 C, Aurora Scientific, Aurora, Ontario, Canada). 18 On the final culture day (D14 or D28), we excised and placed each linear ECT from the TissueTrain® plate in the perfusion bath filled with 2,3-butanedione monoxime (BDM) to temporarily halt ECT shortening. Using 10-0 nylon suture, we attached one end of the ECT to a force transducer (model 403A, Aurora Scientific) and the other end to a thin metal shaft connected to a micromanipulator for length adjustment. We washed out the BDM and filled the perfusion chamber with warmed Tyrode’s solution, pre-bubbled with 95/5% O2/CO2 gas. After a 20-min equilibration period, including one Tyrode’s change at the 10-min mark, we determined individual ECT maximum length (Lmax) by manually stretching the ECT until we observed no further increase in active force. Each ECT was held at Lmax for all measurements. After a 5-min equilibration period, we refreshed the Tyrode’s solution and recorded force at the intrinsic beat rate for 30 s using a 2 kHz sampling rate. We then performed electric field pacing of the ECT, starting at the intrinsic beat rate (rounded to the nearest 0.5 Hz) and then increasing in 0.5 Hz increments while recording for 10 s at each pacing rate. We determined electrical MCR at the onset of 2:1 block. For a subset of D14 C-OP ECTs (n = 6), we optically paced with a 470 nm LED placed below the perfusion bath. We optically paced at the intrinsic rate and then increased the OP rate in 0.5 Hz increments until the optical MCR. For each OP rate, we recorded force for 30 s, including intrinsic beating for 10 s. Increasing pacing rate was associated with reduced active force and increased passive force.
We measured ECT diameter at Lmax from a digital image recorded during testing (MU1000, AmScope, Irvine, CA), performed three measurements per ECT, then used the mean diameter to calculate ECT cross-sectional area assuming a circular geometry. For each electric field pacing frequency, we calculated mean active stress (σA), relaxation time to 50% diastolic stress (RT50), stress-frequency relationship, beat-to-beat hysteresis (σbb), and systolic potential energy. We used Fourier analysis of the force trace to determine the MCR. We calculated stress (σ) as force divided by cross-sectional area. After applying a low-pass Gaussian filter to smooth the data, we identified local minima (σmin) and maxima (σmax) stress values and calculated σA as the difference between each σmax and its preceding σmin. We calculated the mean σA at each captured frequency to determine stress–frequency relationship. We additionally calculated RT50 at 3.0 Hz pacing. To obtain σbb, we calculated σA for each contraction cycle and then for each pair of successive cycles, we calculated the magnitude of the difference in σA divided by the overall mean σA. We defined this value as σbb and calculated the mean σbb over all cycles. Systolic energy is related to the stress-time integral, similar to pressure-volume area. 23 We calculated the systolic stress-time integral for each σmin-to-σmin cycle, normalized to both time and σmax. Since our ECT functional tests were performed at Lmax, contractions were isometric and we therefore only measured potential energy. We calculated the mean normalized systolic stress-time integral and defined this value as the mean systolic potential energy (SPE). All analyses were performed with automated software developed in MATLAB® (Mathworks, Natick, MA).
Patch clamp
A limited number of proof of principle patch clamp recordings were performed as previously described. 56 In brief, we placed an ECT in a perfusion chamber filled with BDM treated Tyrode’s solution. Pulled borosilicate glass capillaries were filled with the following solution: 117 mM K-gluconate, 13.0 mM KCl, 1 mM MgCl2, 0.07 mM CaCl2, 0.1 mM ethylene glycol-bis(β-aminoethyl ether)-N,N,N′,N′-tetraacetic acid (EGTA), 10 mM HEPES, 2 mM Na-ATP, and 0.4 mM Na-GTP. We randomly patched the filled borosilicate capillary onto ChIEF-expressing single cells within the ECT. ChIEF-expressing cells were identified with differential contrast imaging system fitted with a Chroma49005 filter for tdTomato expression. A blue light emitting diode (Prizmatix UHP 460, Prizmatix, Southfield, MI) reflected into an objective was used to excite the patched cell. A Multiclamp 700B amplifier was used for whole cell recordings. We analyzed patch clamp data using pClamp 10® software (Molecular Devices, Sunnyvale, CA).
Histological assessment
We collected ECTs at D14 or D28 after force testing, fixed them with 4% paraformaldehyde (PFA) at room temperature for 30 min, and stored in 1X PBS at 4°C until processing.
Whole mount tissue immunofluorescence staining
We washed fixed ECTs in 1% Triton X-100/PBS for 1 h and then blocked with 1% Triton X-100/PBS + 10% FBS for 1 h. To identify CM in ECTs, we applied a primary antibody to cardiac troponin T (cTnT, Ms-295, ThermoFisher Scientific) 1:400 in 1% Triton X-100/PBS + 10% FBS + 0.2% sodium azide overnight at 4°C followed by a wash with 1% Triton X-100/PBS + 10%FBS for 1 h and 1% Triton X-100/PBS for three wash cycles of 10 min each. We then incubated with Alexa Flour 488 donkey anti-mouse IgG secondary antibody (Molecular Probes, Oregon, USA) in 1% Triton X-100/PBS + 10%FBS + 0.2% sodium azide + 5% donkey serum overnight at 4°C. We stained nuclei with 4′,6-diamidino-2-phenylindole (DAPI) (R37606, molecular probes, Oregon, USA) for 30 min at room temperature. After immunofluorescence (IF) staining, we equilibrated ECT samples with 100% glycerol overnight followed by 75% glycerol for 2 h. We cleared ECTs in 53% benzyl alcohol, 45% glycerol, and 2% 1,4-diazabicyclo[2.2.2]octane (DABCO) 57 for 2 h and then changed to fresh clearing solution overnight at the dark. Processed samples were stored in clearing solution at 4°C for further imaging.
IF staining for paraffin sections
We processed ECTs for paraffin blocks and cut into 5 µm sections for IF staining. After blocking with 0.1 M glycine + 0.5% Triton X-100/PBS, we applied a primary antibody to cTnT (Ms-295, ThermoFisher Scientific) 1:400 in 1% bovine serum albumin (BSA) to identify CM and Living Colors DsRed Polyclonal Antibody (Cat# 632495, Clontech, Takara Bio USA, Inc.) 1:300 in 1% BSA to identify ChIEF-tdTomato expressing cells overnight at 4°C. We then incubated slides with Alexa Flour 488 donkey anti-mouse IgG and Alexa Flour 594 donkey anti-rabbit IgG secondary antibodies (Molecular Probes, Oregon, USA) in 5% donkey serum for 1.5 h at room temperature. We mounted slides with ProLong® Gold Antifade Reagent with DAPI (Molecular Probes, Oregon, USA).
Image acquisition and analyses
We performed confocal imaging of whole-mount and paraffin sectioned ECTs using a Nikon ECLIPSE Ti Confocal System (Nikon, Tokyo, Japan) attached to a Nikon Ti-E inverted microscope platform and Nikon NIS Elements AR software (Nikon). Images were saved as 12-bit raw files for further processing. For whole-mount ECTs, we placed samples in a 10 mm glass bottom dish filled with clearing solution and acquired a 3D z-stack using a 10X 0.3 NA objective at 1024 x 1024 pixel density and 3 μm z-step. We acquired z-stack images to a depth just past the ECT midpoint, typically 150 slices (679 μm). Since our linear ECTs were symmetric, we did not require the whole thickness for analysis. Images of paraffin sections were obtained with a 40X 1.30 NA objective at 1024 x 1024 pixel density. We acquired images of the ECT midsection and used a tiled image to capture the entire ECT width.
We measured CM alignment from cTnT-stained whole-mount 3D images based on our previous method. 58 Alignment concentration κ describes the concentration of local orientation vectors around the mean direction. Higher values of κ indicate greater alignment. We quantified the CM and transfected cell populations from cTnT- and tdTomato-stained 40X images of paraffin sections. We segmented the DAPI, cTnT, and tdTomato channels separately using the Chan-Vese level set method. 59 Prior to segmentation, we preprocessed the DAPI channel with a rolling ball background subtraction 60 and the cTnT and tdTomato channels with contrast-limited adaptive histogram equalization. 61 From the DAPI image, we separated individual nuclei using a watershed and vertex graph algorithm. 62 For each individual nucleus, we compared the overlap between the nucleus boundary and the segmented cTnT and tdTomato images to determine CM and transfected identity. We recorded the percent cTnT-positive, tdTomato-positive and double-positive nuclei. We performed all image analyses with Matlab® (Mathworks, Natick, MA).
Real-time quantitative polymerase chain reaction
We performed qPCR as described in our previous work. 12 We homogenized fresh ECT samples in Trizol reagent (Life Technologies, Cat. No: 15596026), using an Omnitip Tissue homogenizer (USA Scientific, Ocala, USA; Cat. No. 6615-7273) and isolated total RNAs with the RNeasy Mini Kit (Qiagen, Valencia, USA; Cat. No. 74104) according to the manufacturer’s instructions. We measured RNA quality and quantity using the NanoDrop ND-2000 (ThermoFisher Scientific). Both 260/280 and 260/230 ratios of RNA samples were approximately 2.00. We performed reverse transcription with the SuperScript VILO cDNA synthesis system (Invitrogen, Cat. No.11754-050). To conduct qPCR, we applied TaqMan Gene Expression Assays (ThermoFisher Scientific) with a StepOnePlus Real-time PCR system (Applied Biosystems) and used 18 S rRNA as endogenous control. All qPCR experiments were performed with 2–3 biological replicates and technical triplicates for each group.
Statistical analyses
We statistically compared D14 control (n = 13) and C-OP tissues (n = 15). We also statistically compared C-OP ECTs (n = 15) to a prolonged culture D28 tissues (n = 2). To establish a comparison between two groups, we used unpaired Student’s t-test at a significance level of p < 0.05.
Results
ChIEF transfection of h-iPSC-derived CMs within ECTs successfully results in acute and C-OP
Following initial pilot experiments using several AAV constructs and transfection doses, we transfected differentiated h-iPSC derived cardiac cells with an AAV1/2-CAG-ChIEF-tdTomato virus at an MOI of 500 by adding virus directly to the cell/matrix mixture at the time of ECT formation. All transfected cells expressed the tdTomato reporter, and this MOI did not change the % of CM within h-iPSC ECTs and the mean CM fraction was similar in D14 control (n = 9) and C-OP (n = 10). D14C-OP ECTs began to spontaneously beat after 3 days of culture, similar to control ECTs (Figure 1).

ECT formation and chronic optical pacing (C-OP) protocol: (a) ECTs were generated from a multi-component mixture of cardiomyocytes, endothelial cells, and mural cells, differentiated from h-iPSCs. Cells were mixed with culture medium, collagen I, and Matrigel. AAV1/2-CAG-oChIEF-tdTomato virus was then added to the gel mixture at 500 MOI. The gel mixture was poured into FlexCell® TissueTrain® wells deformed into a cylindrical mold by vacuum suction and anchored by nylon mesh tabs. The TissueTrain® plate was placed on top of an Arduino-controlled LED platform for chronic optical pacing. ECTs were cultured at 37 C, 5% CO2. (b) At culture day 7, C-OP was initiated. C-OP ECTs were stimulated with a pulsed 470 nm LED. A representative C-OP protocol is shown. At each culture day, we measured the maximum capture rate (MCR) and set the C-OP rate at 0.5 Hz below MCR.
Force–length and force–frequency testing of C-OP h-iPSC ECTs confirm functional maturation
OP during in vitro force testing confirmed OP capture (Figure 2). Electric field pacing was used for all quantitative force-length and force-frequency data collection in order to compare our results to other published studies using ES. We noted rate-dependent changes in both passive and active stress typical of immature myocardium (Figure 2). We noted a negative force–frequency relationship (reduced active force at higher pacing frequencies) typical for immature ECTs (Figure 2).
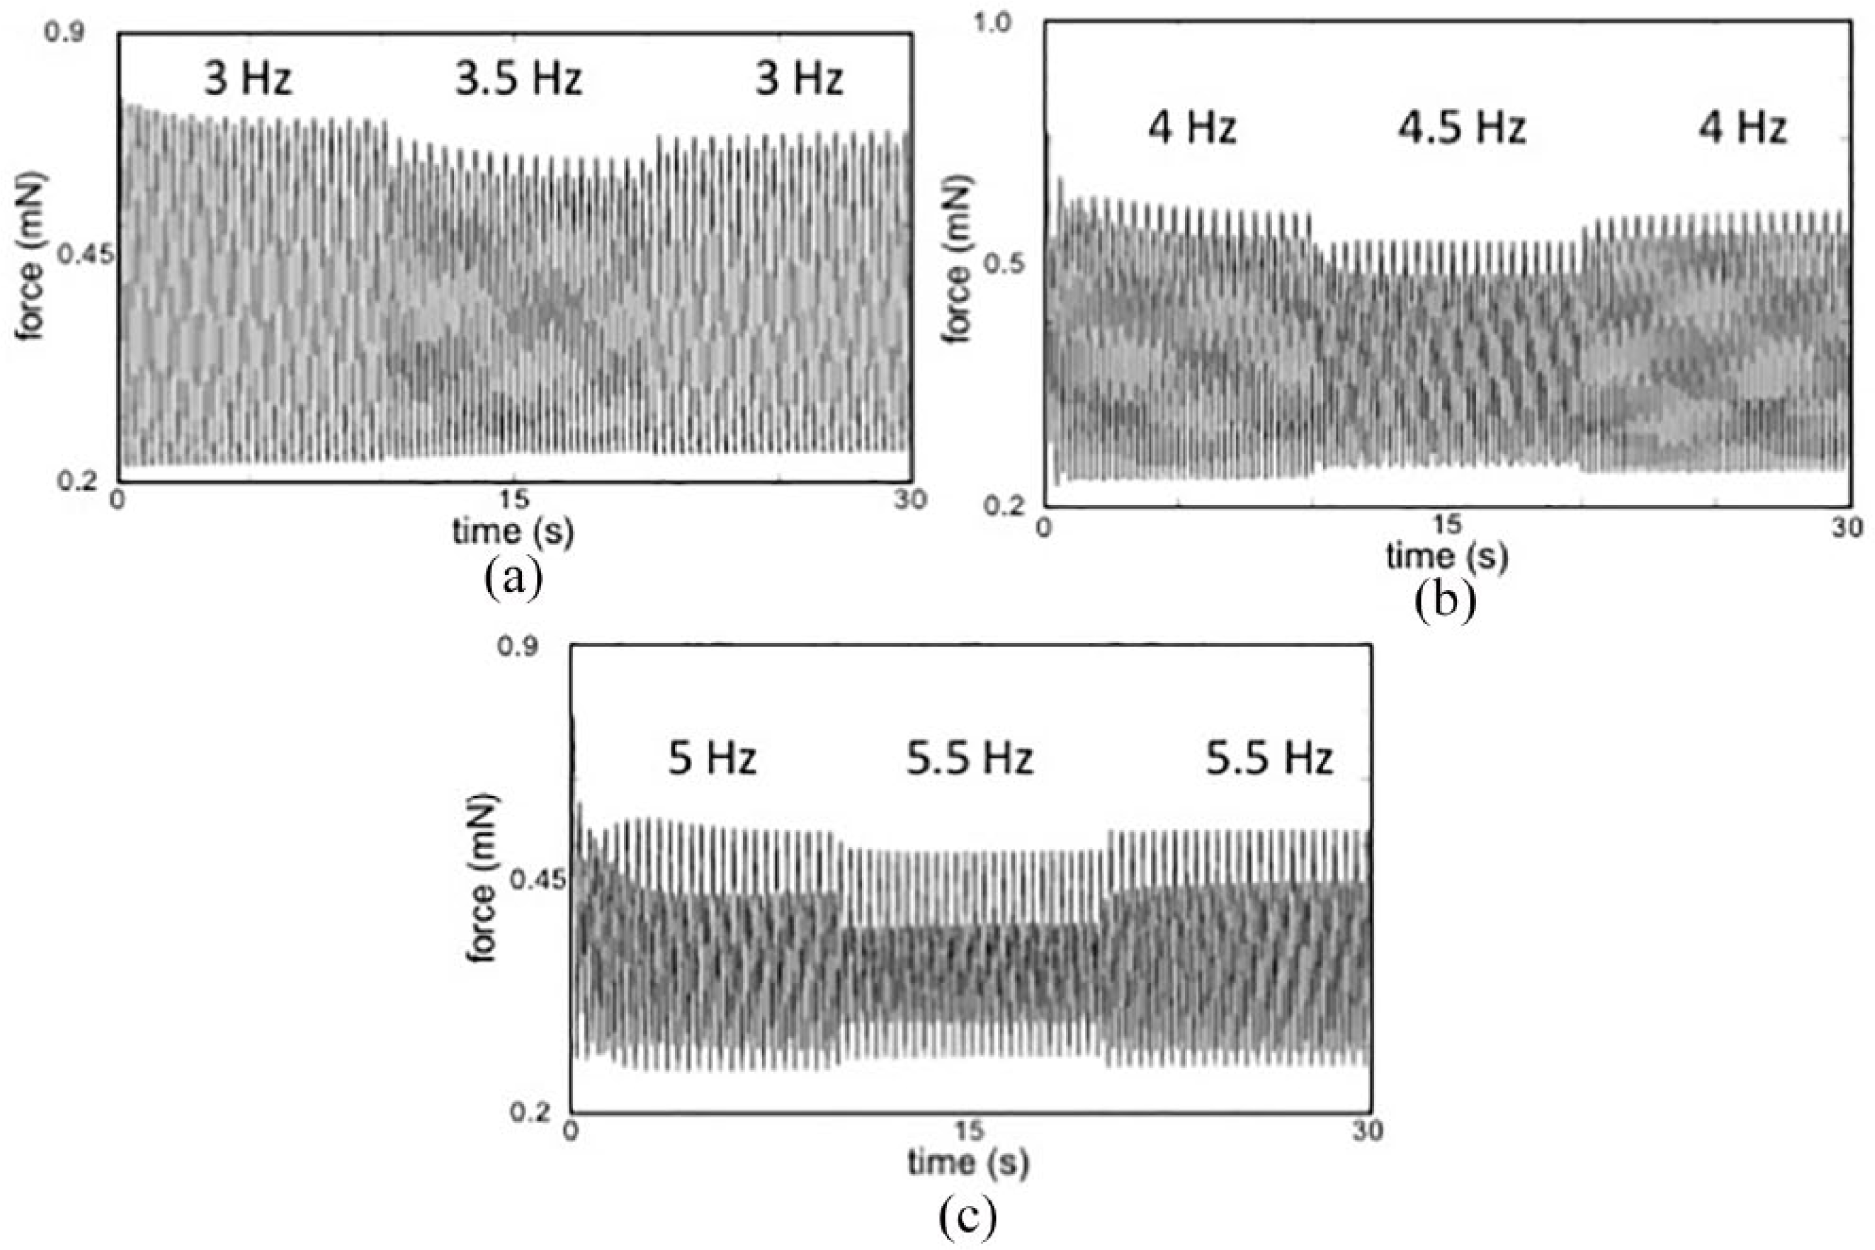
Representative force tracings at increasing electrical pacing rates display decreasing active force and increasing beat-to-beat hysteresis: Active force decreased and passive force increased during each stepwise increase in pacing rate: (a) 3 to 3.5 to 3 Hz. (b) 4 to 4.5 to 4 Hz. (c) 5 to 5.5 to 5 Hz. While difficult to see at the 3 Hz (180 beats per minute), at higher pacing rates there is an incremental increase in the amplitude variation between sequential beats, termed beat-to-beat hysteresis. Greater beat-to-beat hysteresis at increasing pacing rates suggests greater phase lag in calcium cycling at higher beat rates, consistent with immature myocardium. s: seconds; mN: millinewtons.
As described in the Materials and Methods section, we developed an automated Matlab analysis module to quantify ECT performance (Figure 3).

Analysis of ECT performance: For this representative example, a C-OP ECT is analyzed at an acute electrical pacing rate of 4.5 Hz. Mean σA was 0.29 mN/mm2, σbb was 0.17, RT50 was 63 ms, and normalized systolic energy was 0.53. (a) Representative stress versus time data. Force data were divided by ECT cross-sectional area to calculate stress. A cycle is defined as contraction followed by relaxation. The minimum stress before the onset of contraction is σmin and the peak stress is σmax. Active stress, σA, is the difference between σmax and σmin. Beat-to-beat hysteresis, σbb, is the magnitude of the difference between the σA of an even-numbered cycle and the σA of the preceding odd-numbered cycle, divided by the overall mean σA. (b) Fast Fourier transform (FFT) analysis of the stress versus time signal. An acute electrical pacing frequency was considered captured if it matched the peak frequency of the FFT power spectrum. (c) RT50 calculated for cycle 1 in (a). RT50 is the time for stress to relax by 50% of σA from σmax. (d) Normalized systolic energy calculated for cycle 1 in (a). Stress and cycle time were both normalized to a maximum value of 1. The area of the shaded region under the stress-time curve is related to systolic energy during contraction.
We confirmed acute OP triggered CM depolarization and action potential generation within D14C-OP ECTs using pulsed blue light stimulation and patch clamp recording (Figure 4(a)) through visual inspection as well as brief video recordings. Acute OP captured all beats when paced above the intrinsic beat rate until reaching the MCR. Both the D14C-OP and D28 ECTs achieved higher electric field paced MCRs versus D14 control ECTs (5.37 ± 0.69 vs 6.50 ± 0.71 vs 4.35 ± 0.59 Hz, p < 0.001, Figure 4(b) and (c)), indicating improved ECT maturation after C-OP. However, the MCR for D14C-OP ECTs was less than that of D28 ECTs (p < 0.05, Figure 4(c)). Consistent with this trend in CM maturation, RT50 measured at 3.0 Hz decreased in D14C-OP ECTs compared to controls (88.00 ± 9.60 vs 104.23 ± 6.66 ms, p < 0.001, Figure 4(d)) and further decreased by D28 (65.60 ± 2.12, p < 0.05 vs D14 C-OP, Figure 4(d)). We additionally observed that D14C-OP ECTs displayed a less negative stress–frequency relationship than control ECTs while D28 ECTs displayed the least negative stress–frequency relationship (Figure 4(e)), consistent with ECT functional maturation. Consistent with pacing induced maturation in calcium cycling and mechanical restitution, we noted reduced σbb at higher frequencies in D14C-OP ECTs compared to D14 control ECTs (Figure 4(f)). Of note, σbb was negligible by D28 (Figure 4(f)). ECT σA was similar between D14 control and D14C-OP ECTs (0.72 ± 0.39 vs 0.52 ± 0.27 mN/mm2, p = 0.14, Figure 4(g)), and D14 control and D14C-OP ECTs had similar CM percentages (50 ± 13 vs 48 ± 13). σA trended lower for D28 ECTs (0.17 ± 0.11, p = 0.08 vs D14 control, Figure 4(g)) consistent with reduced CM survival following prolonged ECT in vitro culture. Systolic energy, a normalized contractile efficiency index calculated at 3 Hz, significantly decreased in D14C-OP ECTs compared to D14 control ECTs (0.47 ± 0.03 vs 0.54 ± 0.02 J/m3-s, p < 0.001, Figure 4(h)). As expected, systolic energy was lower in the more functionally mature D28 ECTs compared to D14C-OP ECTs (0.41 ± 0.01 J/m3-s, p < 0.05 vs D14 C-OP, Figure 4(h)).
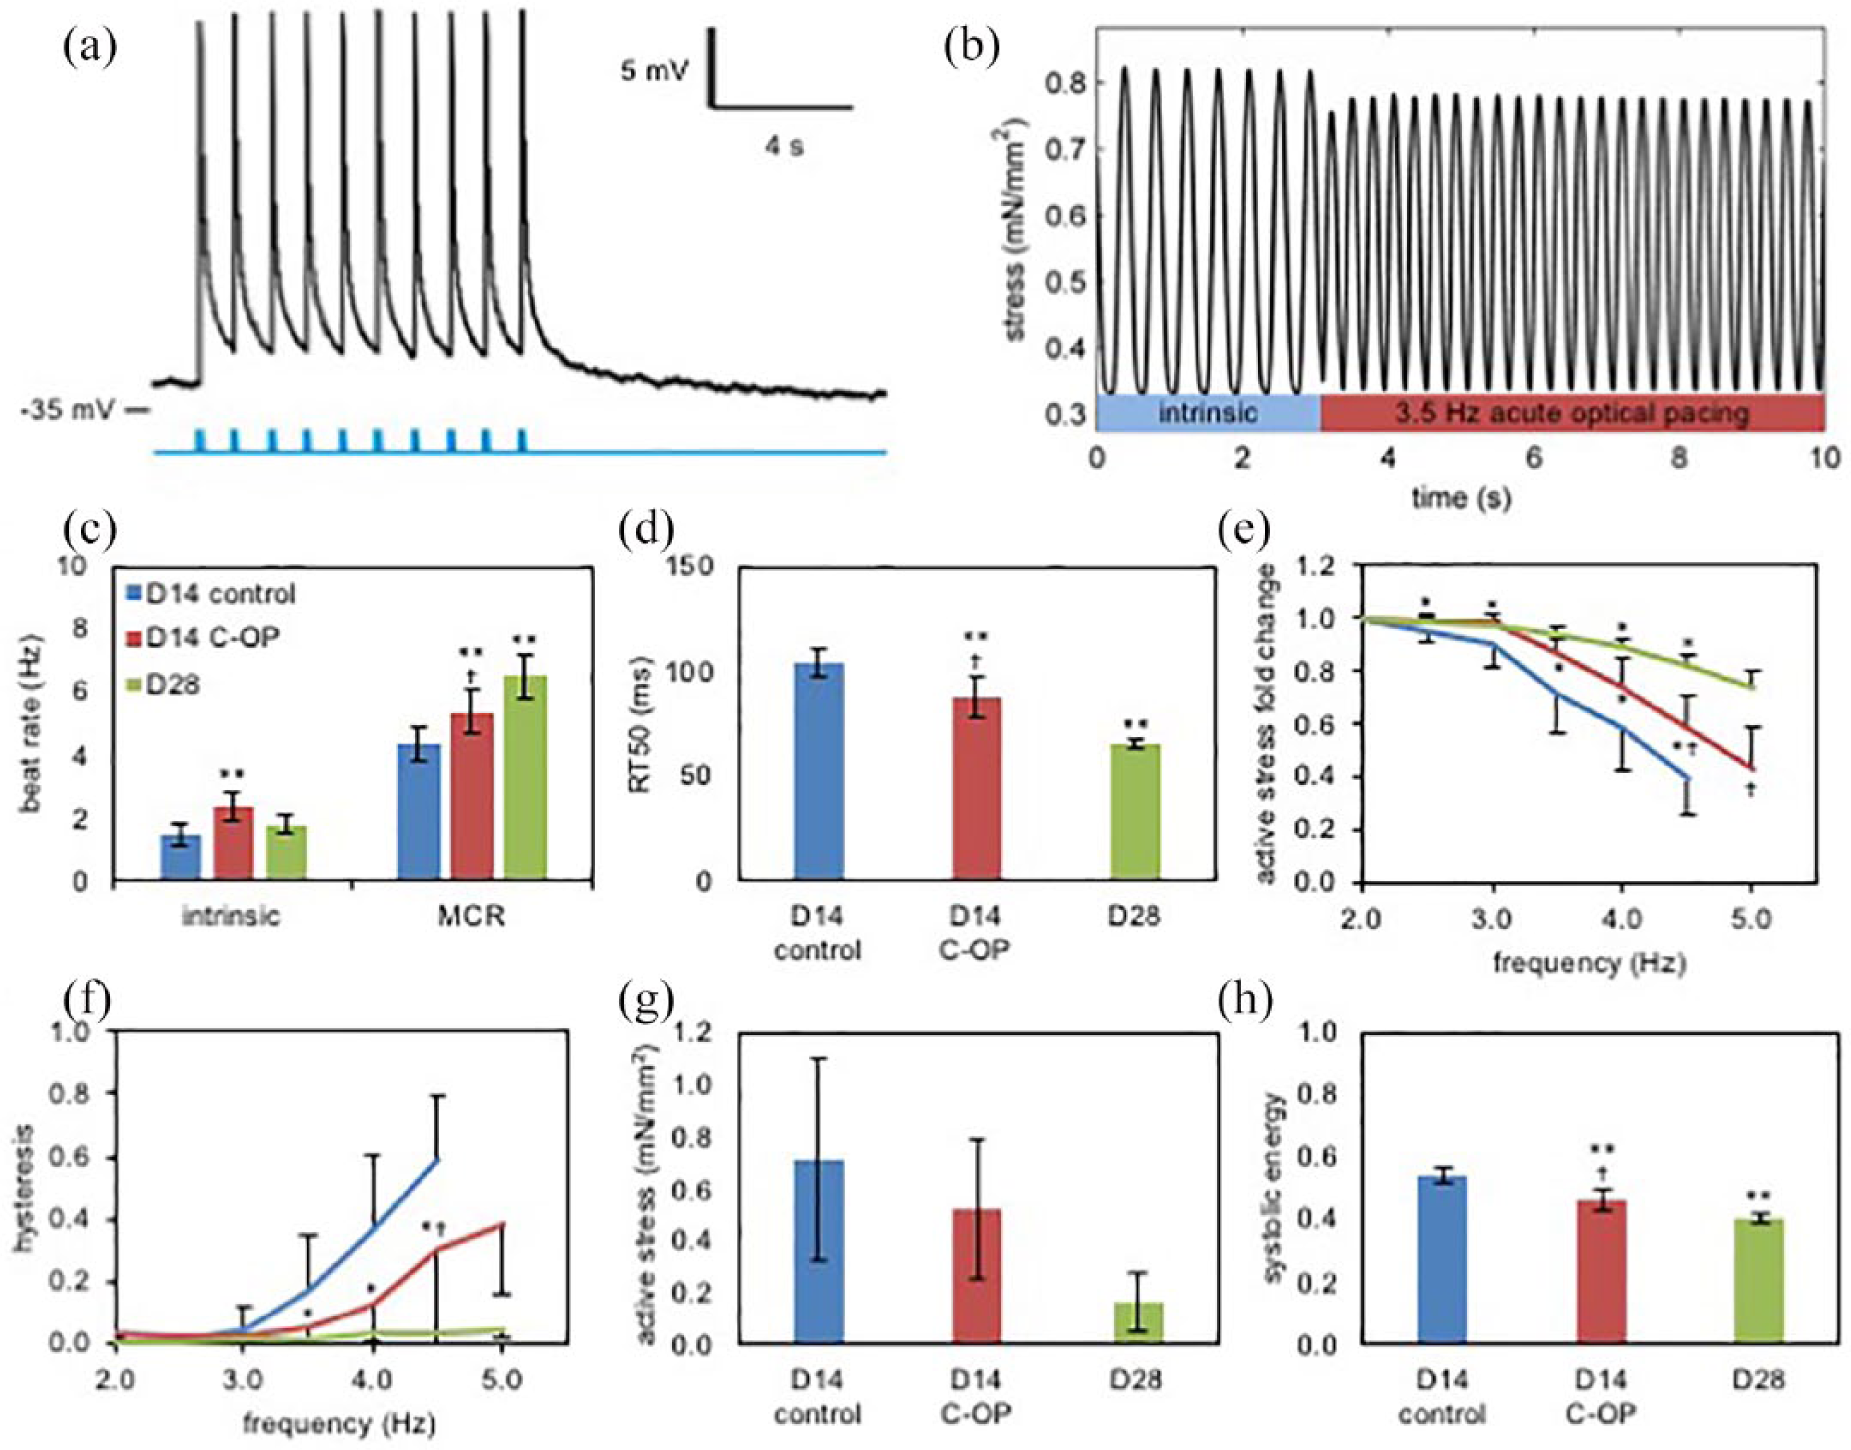
Impact of chronic optical pacing (C-OP) on functional maturation of h-iPSC ECTs: (a) Representative patch clamp recording from a D14h-iPSC CM after ECT ChIEF transfection. Blue ticks indicate 470 nm light pulses. (b) Representative stress trace during acute optical pacing of a C-OP ECT. After 3 s of spontaneous beating, we began acute pacing with a 470 nm 3.5 Hz pulsed LED. (c) Mean intrinsic beat rate and maximal capture rate (MCR) for D14 control (n = 13), D14 C-OP (n = 15) and D28 (n = 2) ECTs. Intrinsic beat rate increased after C-OP and MCR increased after C-OP and prolonged culture to D28. (d) Mean RT50 AT 3 Hz acute electrical pacing decreased after C-OP and after prolonged culture to D28. (e) Stress-frequency curves showed a less negative relationship after C-OP or prolonged culture to D28. (f) Pacing rate dependent beat-to-beat hysteresis decreased after C-OP and was absent in D28 ECTs. (g) Mean active stress was similar in D14 control and C-OP ECTs and trended lower in D28 ECTs (p = 0.08 vs D14 control). (h) Mean normalized systolic energy at 3 Hz acute electrical pacing decreased after C-OP and further decreased by D28. Error bars show standard deviations. See (c) for color legend. Results in (c–h) obtained with 5 V acute electrical field pacing.
C-OP does not accelerate structural maturation
We quantified the impact of C-OP on structural maturation through IF of fixed D14C-OP and D14 control ECTs. Whole h-iPSC ECTs (Figure 5(a)) were placed into 2D paraffin blocks for serial section processing (Figure 5(b) and (c)) or stained as whole mounts for 3D confocal imaging (Figure 5(d), (g) and (i)). ChIEF proteins predominantly co-located with cTnT-positive cells consistent with preferential CM transfection (Figure 5(c)). D14 control and C-OP ECTs displayed similar CM fractions (50 ± 13% vs 48 ± 13%, Figure 5(e)). In D14C-OP ECTs, 20 ± 6% of CM were transfected and 67 ± 14% of all transfected cells were CM. In contrast to the functional maturation noted after 7 days of C-OP, CM alignment was similar between D14 control and C-OP ECTs (κ = 3.76 ± 1.11 vs 3.42 ± 1.33, Figure 5(f)). The 3D distribution and alignment of local CM orientations were also similar between D14 control (Figure 5(g) and (h)) and D14C-OP (Figure 5(i) and (j)) ECTs, consistent with the similar σA noted above (Figure 4(g)).

Impact of chronic optical pacing (C-OP) on structural maturation of h-iPSC ECTs: (a) Representative, linear and cylindrical h-iPSC ECT constrained at the long axis ends by mesh nylon anchors. (b–c) Representative central paraffin sections of a (b) D14 control ECT showing 54% CM and (c) D14 C-OP ECT showing 52% CM and 13% ChIEF-transfected cells. Nuclei were stained with DAPI (blue), CM with cTnT (green) and ChIEF-transfected cells with tdTomato (red). CM were predominantly located at the outer surface and the majority of transfected cells were CM. Inset in (c) shows higher magnification of double-positive cTnT and tdTomato cells. (d) Whole mount confocal image of a control D14 ECT. (e) Mean CM fraction and (f) mean alignment concentration (κ) were similar in D14 control (n = 9) and C-OP (n = 10) h-iPSC ECTs. Error bars show standard deviations. (g–j) Representative local CM orientations within D14 (g) control and (i) C-OP h-iPSC ECTs. Color-coded lines indicate local CM orientation magnitudes in the circumferential (green), radial (red), and axial (blue) directions. For clarity, only a subset of the orientations is shown. Insets are 3X magnification of regions enclosed by the yellow dashed lines. (h and j) Spherical histograms of local CM orientations. CM in both control and C-OP aligned parallel to the ECT long axis. The volume of each ray represents the relative count in each direction and the mean CM orientation is shown by the thick red line. κ for the control sample (h) was 3.89 while the C-OP sample (j) was 3.46. Scale bars: 5 mm (a), 250 μm (b, c, d, g, i), and 100 μm (c inset). Orientation axes also serve as scale bars in (d, g, i).
C-OP upregulates a potassium channel that contributes to cardiac repolarization
We performed RNA analysis on biologic triplicates of D14 control, D14C-OP ECTs, and D28 ECTs (Figures 6 and 7). cTnT (Figure 6(a)), SERCA2A (Figure 6(a)), and KCNJ2 (Figure 6(b)) mRNAs, common markers for maturity, were not upregulated in D14C-OP tissues. The ratio of MLC2v and MLC2a, an indicator of ventricular phenotype development, was also similar. KCND3, a transcript encoding the Kv4.3 ion channel responsible for the transient outward potassium current (Ito) 63 was significantly upregulated twofold in D14C-OP ECTs (Figure 6(b)). A single biological replicate of RT-qPCR was completed on RNA isolated from D28 ECTs (Figure 7). RNA analysis of D28 ECTs had been previously completed for D28 large format h-iPSC ECTs and showed similar results. 12 Common structural and electrophysiological genes were upregulated in the D28 ECTs from this study: RYR2, SERCA2A, Cacna1D, SCN4A, KCND3 (Figure 7). The types of genes increased reflecting the enhanced electrophysiological properties of the extended ECT culture. SERCA2A and RYR2 could underlie the improved function of D28 ECTs.

Quantitative PCR of genes encoding contractile proteins, Ca2+ cycling mechanisms, and ion channels in D14 control and C-OP ECTs: (a) expression of genes related to CM contraction (cardiac troponin T (cTnT) ventricular myosin light chain 2 (MLC2v) atrial MLC2 (MLC2a) and MLC2v/MLC2a ratio) and genes related to Ca2+ transients (ryanodine receptor 2 (RYR2) ATPase sarcoplasmic/endoplasmic reticulum Ca2+ transporting 2 (SERCA2A), phospholamban (PLN), calsequestrin 2 (CASQ2) aspartate beta-hydroxylase (ASPH), and sodium/calcium exchanger 1 (SLC8A1) C-OP did not produce significant differences in expression of contractile- or Ca2+ transient-related genes. (b) Expression of genes encoding sarcolemmal voltage-gated L-type Ca2+ channels (Cacna1 C, Cacna1D), T-type Ca2+ (Cacna1G), Na+ (SCN4A, SCN5A), and K+ (KCNH2 (rapidly activating delayed rectifying), KCNJ2, KCNJ12 (inward rectifying), KCND3 (transient outward)) and connexin (GJA1). C-OP resulted in a significant increase in the expression of the transient outward K+ channel KCND3. Expression of all other ion channels and connexin were unchanged after C-OP. *p < 0.05. For each gene, 2–4 biological experiments were conducted and qPCR was performed in triplicate for each biological sample. Error bars show standard deviations.

Quantitative PCR for a single biological experiment comparing D14 control, D14 C-OP, and D28 ECTs: (a) Expression of genes related to CM contraction (cardiac troponin T (cTnT) ventricular myosin light chain 2 (MLC2v) atrial MLC2 (MLC2a) and MLC2v/MLC2a ratio) and genes related to Ca2+ transients (ryanodine receptor 2 (RYR2) ATPase sarcoplasmic/endoplasmic reticulum Ca2+ transporting 2 (SERCA2A) phospholamban (PLN), and calsequestrin 2 (CASQ2) Expression was similar for all genes in D14 control and C-OP, following the full qPCR study in Figure 3. The MLC2v/MLC2a was increased in the D28 sample, suggesting a more ventricular phenotype, while increased RYR2 and SERCA2A and decreased PLN suggest more mature Ca2+ handling. (b) Expression of genes encoding sarcolemmal voltage-gated L-type Ca2+ channels (Cacna1 C, Cacna1D), T-type Ca2+ (Cacna1G), Na+ (SCN4A, SCN5A), and K+ (KCNJ2 (inward rectifying), KCND3 (transient outward)) and connexin (GJA1). The expression of transient outward K+ channel KCND3 increased in both the C-OP and D28 samples, suggesting a role for this channel in electrophysiological maturation during C-OP. L-type Ca2+ and Na+ were also increased in the D28 sample, but did not show a similar increase in C-OP ECTs. These data come from a single experiment and are not sufficient for statistical analysis.
Discussion
Our findings show that CMs within h-iPSC ECTs effectively express ChIEF after AAV transfection, and 2D paraffin sections confirmed co-localization of cTnT and ChIEF in D14C-OP ECTs (Figure 5C), consistent with a previously published study that showed efficient expression of ChR in h-iPSC-CMs. 47 Co-localization may explain how optical stimulation directly perturbed the CM cell membrane to produce action potentials and trigger myocyte contraction.
Acute optical stimulation during patch clamp and force testing demonstrated action potential generation and contraction in response to light excitation (Figure 1(a) and (b)). Efficient CM stimulation requires action potential generation; therefore, we validated action potential generation in response to acute optical stimulation by patch clamp. 24 In native tissue, action potential generation couples to calcium-induced calcium release from the SR (excitation-contraction coupling). 24 We confirmed excitation-contraction coupling by optical stimulation using force testing (Figure 4(b)). Optical stimulation during force testing could pace tissues to a maximum rate of 5 Hz, demonstrating comparable excitation–contraction coupling to ES. It is worth noting that ES resulted in higher MCRs than acute optical stimulation, possibly due to greater percentage capture of CM during ES.
We performed C-OP of ECTs for 7 days to test the hypothesis that C-OP can induce ECT functional maturation. We chose ChIEF because this channel does not desensitize with chronic light stimulation, and we chose an AAV1 vector because of its safety and efficient transfection of h-iPSC-CMs.52,64,65 These three properties exhibited utility as demonstrated by the significant results of C-OP (Figures 1 and 5(b)). Similar CM percentages between D14 control and D14C-OP ECTs supported low AAV toxicity (Figure 5(e)). We added the AAV1-ChIEF at the time of ECT formulation rather than after ECT gel compaction to assure a uniform distribution of the vector within the ECT. Successful C-OP also demonstrated the usefulness of our custom-built LED system.
C-OP increased both ECT MCR and intrinsic beat rate (Figure 4(c)). However, D28 control ECTs still captured at a higher rate than D14C-OP ECTs consistent with our previous study showing induction of maturation by extended in vitro culture (Figure 4(c)). 12 MCR is an integrated measure of CM maturation and higher capture rates correlate with increased connexin-43 expression and potassium channel expression.12,33 The 1 Hz increase in MCR after C-OP is comparable to previous chronic ES studies.25,33,38 C-OP did not mature ECTs by decreasing spontaneous beating, 8 and instead we found an increase in intrinsic beat rate (Figure 4(c)). This result differs from an ES study of h-iPSC derived cardiac spheroids that showed a decrease in spontaneous beating rate possibly due to a reduction of HCN4 mRNA, a gene encoding a pacemaking channel. 36 However, our findings are consistent with a study of mouse-derived cardiac embryoid bodies in which spontaneous beating increased in response to ES. 3 Possibly, C-OP induced an upregulation of HCN4 channels, unlike normal electrophysiological maturation.
C-OP also decreased σbb, RT50, and systolic energy consumption (Figure 1(d), (f) and (h)). Similar to MCR, these parameters decreased further in D28 ECTs compared to D14C-OP ECTs. Improvement in hysteresis and RT50 also correlate with increased connexin-43 expression and upregulation of potassium channel expression. 12 Mathematical modeling demonstrates hysteresis occurs due to out-of-phase action potentials and calcium cycling. 66 Thus, we propose that the decreased hysteresis indicates maturation of excitation–contraction coupling. ES studies have shown an improvement in relaxation time similar to our result following C-OP. 21 D14C-OP and D28 ECTs used less systolic energy during contraction at 3 Hz pacing as indicated by decreased stress-time integral values. The stress-time integral relates to energy consumption during contraction. 22 Increased expression of mitochondrial genes and mitochondria number could underlie this result, as observed in ES of neonatal rat CM. 39
C-OP ECTs maintained σA, as a function of increasing pacing frequency, better than control constructs, but not to the same degree as D28, particularly at the higher pacing rates of 4.5 and 5 Hz (Figure 4(e)). The underlying mechanism for improved maintenance of σA production correlates with increased expression and development calcium handling structures. 21 Calcium handling maturation could increase stress preservation due to quicker calcium release and reuptake. 21 Even though C-OP improved stress preservation, it did not reach the threshold of generating a positive force–frequency relationship as observed in a previous ES study and extended culture study.12,21
We observed a decreasing trend in absolute σA from D14 control to D14C-OP ECTs to D28 ECTs, although this result was not significant (Figure 4(g)). Possibly, C-OP, ChR expression, or AAV transfection decreased σA through cell toxicity that was not evident by histology (Figure 5(e)). C-OP may generate hydrodynamic shear, a morphology-altering force. 25 The neutral response of σA to C-OP contrasts with chronic ES, which has been noted to increase active force by 1.5 times. 30 However, the difference in the results of C-OP could be due to our pacing at around 3 Hz rather than pacing at a lower rate of 2 Hz/1.5 Hz. 30 Lower pacing rates may be more conducive to σA improvements.
Alignment analysis of 3D whole mount images showed C-OP did not alter cell orientation (Figure 4(h) and (j)). This result suggests C-OP may not affect pathways related to cell migration. ES, unlike C-OP, correlates with cellular alignment in some cases.31,35 However, the direct causal effect of ES on cell alignment remains unclear. Other studies have demonstrated topographical cues influence alignment more than ES or that a combination of mechanical stretch and ES is required to improve alignment.27,44 Additional research is needed to understand the mechanistic relationship between stimulating ECT contraction and CM alignment.
RT-qPCR analysis identified KCND3, the gene encoding the Kv4.3 channel responsible for the Ito current, as a potential candidate for the electrophysiological maturation induced by C-OP.12,63 This channel provides a partial mechanism for electrophysiological maturation as the KCND3 mRNA was the only gene significantly upregulated in D14C-OP ECTs (Figure 6(b)). KCND3 also increased in the one biological replicate of D28 ECTs, as well as our previous study of D28 large format ECTs, 12 relating the KCND3 increase to maturation (Figure 7(b)). Furthermore, increased expression of Kv4.3 could improve hysteresis and MCR as the channel decreases repolarization time; overexpression of Kv4.3 in isolated guinea pig myocytes decreased membrane potential during the plateau phase and shortened action potential duration. 67 Surprisingly, RNA analysis did not reveal significant upregulation of calcium handling structures to explain σA preservation, unlike D28 ECTs (Figures 5(a) and 7(a)). Our RNA result was consistent with a previous ES study that showed no upregulation of SERCA2A. 30 Additional experiments including western blot analysis would validate differences at the protein level as observed previously with ES. 21
As stated previously, ECTs possess an immature phenotype which confounds translation into CV regeneration therapies or drug testing platform technologies.8,68 Bioreactors induce differentiation and maturation by replicating in vivo signals: mechanical stretch, perfusion, and ES.8,25 However, no ECT differentiates into a fully mature construct. 8 Also, ES can be invasive and produces toxic Faradaic reactions.33,45–48 Therefore, the cardiac tissue engineering field needs alternative, less toxic, conditioning protocols that produce a level of maturity comparable to ES. We present here a novel, alternative chronic stimulation protocol for cardiac tissue engineering, using expression of light sensitive ion channels. After extensive review, this is the first successful attempt at C-OP of engineered ECTs consisting of h-iPSC cardiac cells. Our results show effective ChIEF transfection of h-iPSC-CM, demonstrate an LED-based optical pacing protocol for ECTs, and provide evidence of functional ECT maturation in response to C-OP.
Our current study does have some limitations that are relevant to highlight. First, our current study does not include a ChIEF transfected, non-paced subgroup, and thus it is possible that some of the effects of altered ECT function and gene expression may be a result of ChIEF transfection rather than C-OP. While this is not likely, future experiments can address this concern. Second, the focus of our current C-OP validation study was the impact of C-OP on h-iPSC ECT functional maturation rather than identifying changes in ion channel expression, function, and molecular mechanisms for this response. We used classic patch clamping techniques only to validate optical capture of transfected CM within ECTs and all subsequent functional data involved optical or electrical field stimulation. Future experiments can address the electrical properties of individual CM within ECTs or CM isolated from d14 ECTs using patch clamping techniques, recognizing the significant technical challenges of this approach, and guide further investigation into changes in ion channel expression and function. Third, we used visual evidence of beating as evidence for broad field OP triggered CM depolarization within ECTs rather than optical dyes. Finally, our current approach is relevant to the scalable maturation of in vitro ECTs but may be less applicable to in vivo ECT maturation that is more likely to occur as the result of paracrine signaling and biomechanical loading. Future experiments can further address excitation dynamics and the ability of narrow field OP to capture regions within the ECT and assess wave propagation through the ECT.
Footnotes
Author contributions
M.D., W.J.K., F. Ye., F. Yuan, J.P.T., P.C., W.G., and B.B.K. conceived and designed the experiments; M.D., W.J.K., F. Ye., F. Yuan, J.P.T., S.S., T.N., and P.C. performed the experiments; M.D., W.J.K., F. Ye., F. Yuan, J.P.T., S.S., P.C., W.G., and BBK analyzed the data; H.M. and W.G. contributed reagents/materials/analysis tools; M.D., W.J.K., F. Ye., T.N., H.M., W.G., and B.B.K. wrote and revised the manuscript; and B.B.K. provided funding for the project.
Declaration of conflicting interests
The author(s) declared no potential conflicts of interest with respect to the research, authorship, and/or publication of this article.
Funding
The author(s) disclosed receipt of the following financial support for the research, authorship and/or publication of this article: This work was supported by the Kosair Charities Pediatric Heart Research Endowment (B.B.K).