
Abstract
Pathogenic mutations in Bcl2-associated athanogene 3 (BAG3) cause genetic dilated cardiomyopathy (DCM), a disease characterized by ventricular dilation, systolic dysfunction, and fibrosis. Previous studies have demonstrated that BAG3 mediates sarcomeric protein turnover through chaperone-assisted selective autophagy to maintain sarcomere integrity in the human heart. Although mouse models provide valuable insights into whole-organism effects of BAG3 knockout or pathogenic variants, their utility is limited by species-specific differences in pathophysiology, which often do not translate to humans and contribute to the failure of clinical trials. As a result, the development of induced pluripotent stem cell-derived cardiomyocytes (iCM) and engineered heart tissues presents a promising alternative for studying adult-onset cardiac diseases. Here, we used genome engineering to generate an isogenic pseudo-wild-type control cell line from a patient-derived iPSC line carrying a pathogenic BAG3 variant, clinically presenting with DCM. While monolayer iCMs recapitulated some features of BAG3-mediated DCM, such as reduced autophagy, mitochondrial membrane potential, and decreased HSPB8 stability, they failed to develop the age-associated impairment in sarcomere integrity. Therefore, we developed a mature, patient-specific, human engineered heart tissue model of BAG3-mediated DCM and compared it to its isogenic healthy control. We demonstrated successful recapitulation of adult-like features of the clinically observed disorganized sarcomeres and impaired tissue contractility, thereby providing a platform to investigate BAG3-related pathophysiology and therapeutic interventions.
Keywords
Introduction
Dilated cardiomyopathy (DCM) is characterized by ventricular dilation, systolic dysfunction, and fibrosis. 1 It is the second most common cause of heart failure, underlying 40% of all cases. It is estimated that about one-third of DCM cases are driven by an identifiable genetic component. 2 Pathogenic mutations in Bcl2-associated athanogene 3 (BAG3),3,4 a co-chaperone protein that facilitates proteostasis in cardiomyocytes (CMs), 5 are closely linked to DCM development.3,4,6–8 BAG3 mediates chaperone-assisted selective autophagy (CASA) of sarcomeric proteins by recruiting heat shock proteins HSP70 and HSPB8, and the E3 ligase CHIP to facilitate the ubiquitination of sarcomeric proteins at the Z-disk, such as filamin-C and myosin binding protein C. 9 In mice, global knock-out (KO) of BAG3 results in early lethality at 4 weeks with a fulminant myopathy phenotype, 10 whereas CM-specific depletion of BAG3 induces DCM, heart failure, and lethality at 8 months. 11 Additionally, the loss-of-function E455K mutation of BAG3 in mice manifests in impaired proteostasis in CMs, leading to DCM and heart failure.11,12 Apart from monogenic disease, BAG3 levels are decreased in non-genetic heart failure, affecting a much larger patient population,13,14 implicating it as a broader therapeutic target. Thus, BAG3 has emerged as an attractive therapeutic target for DCM intervention.
To achieve therapeutic potential, further understanding of BAG3-mediated DCM necessitates modeling in human cells. Although mouse models can be readily utilized for drug testing, 12 the generation of mutation-specific mice models is lengthy and costly. Importantly, mice have inherently different physiology from humans, including a much higher resting heart rate and differences in ion channels, signaling pathways, and pharmacokinetic properties. Many therapies that were successful in mouse studies have failed in clinical trials. 15
Induced pluripotent stem cell (iPSC)-derived CMs (iCMs) have revolutionized two-dimensional in vitro models of human heart disease, including those induced by BAG3. 16 However, many studies examining the effects of specific genes rely on homozygous KO models, which often present with severe phenotypes, whereas heterozygous mutations that are commonly observed in clinical settings, can result in milder phenotypes, making patient-derived cell lines a more relevant model for studying these conditions. As such, multiple iPSC lines with pathogenic variants of BAG3 generated from patients can be utilized to study a spectrum of effects on DCM.17,18 Furthermore, CRISPR/Cas9 technology is a powerful tool to generate isogenic control lines by correcting the mutation, allowing the study of the effects of the mutation in isolation, independent of other genetic factors.19,20 Yet, iCMs’ limitation in functional maturity is well described, and they often fail to capture phenotypes of adult-onset heart disease. 21
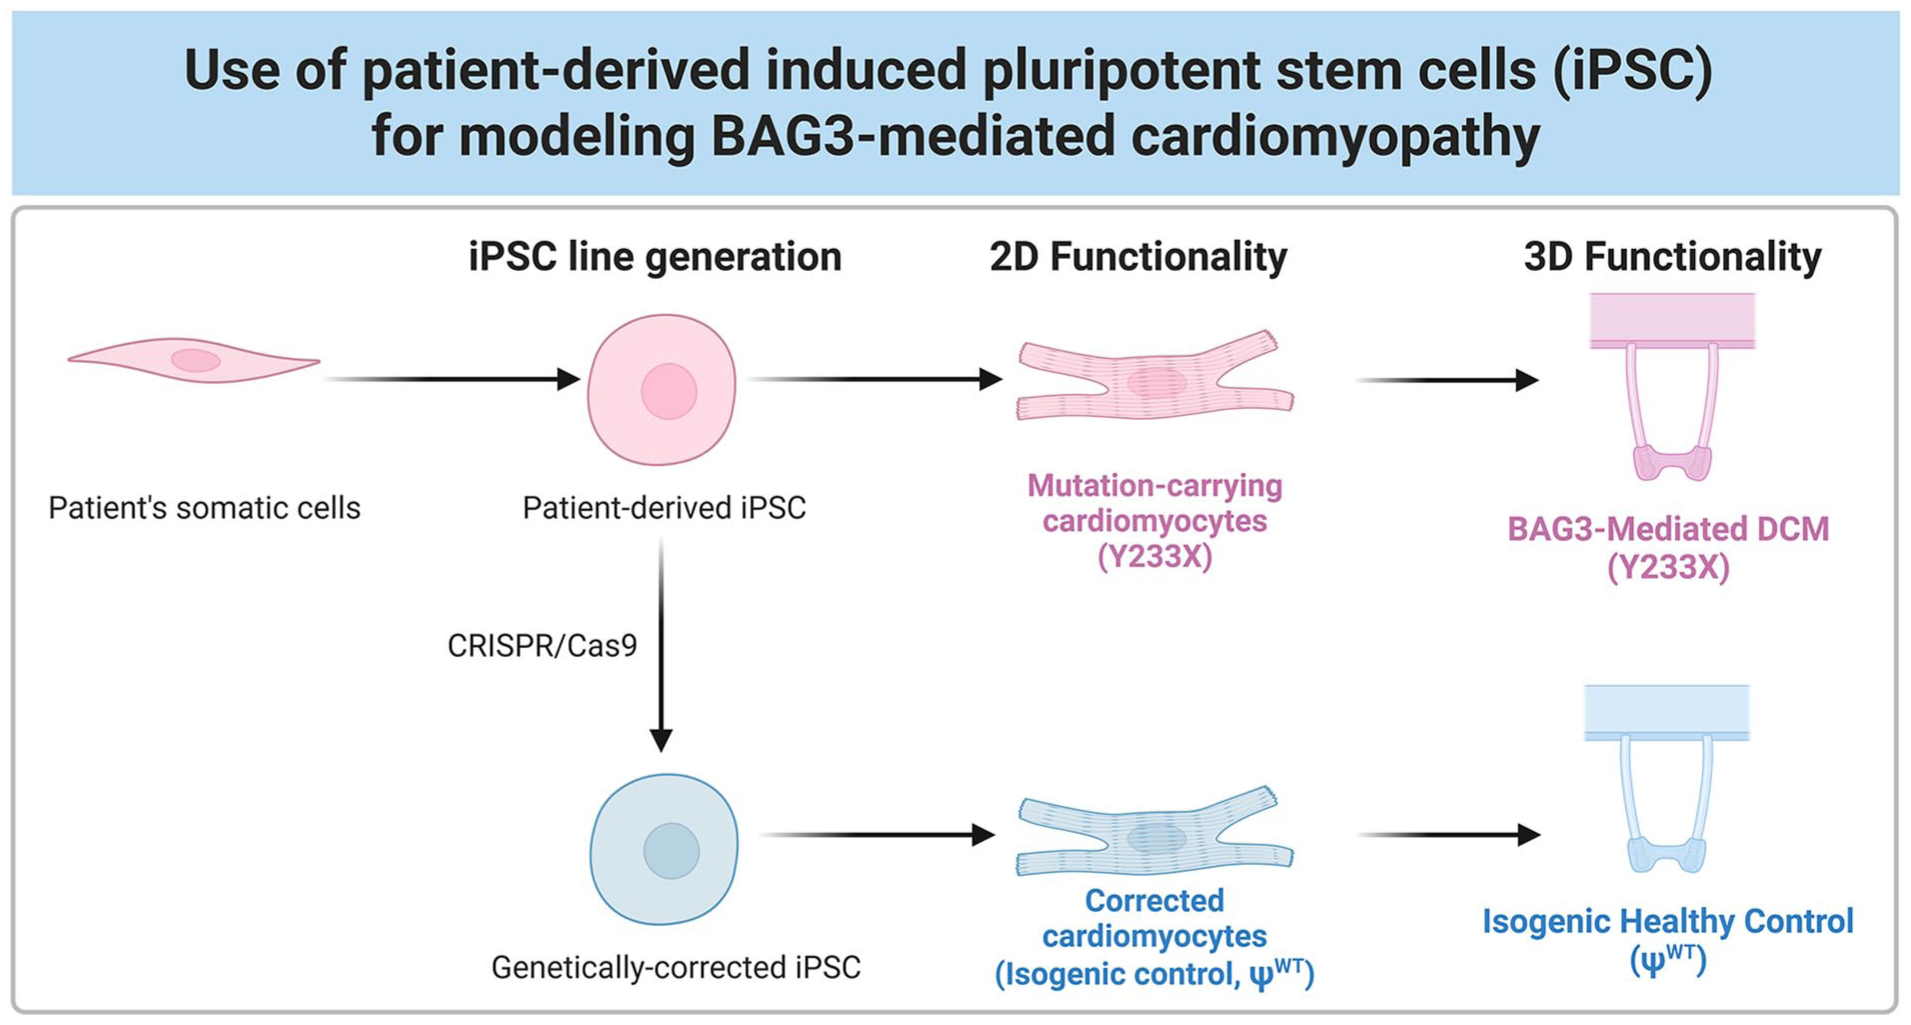
To overcome these limitations, our lab, along with others, has focused on developing mature engineered human heart tissues (EHTs) that can accurately recapitulate the adult pathophysiology of heart failure and serve as reliable platforms for drug testing.21–25 Here, we utilized these tissues to recapitulate the features of mature, patient-specific engineered heart tissue models of BAG3-mediated DCM and its isogenic pseudo-wild-type healthy control (Figure 1). By leveraging the use of iCMs, CRISPR/Cas9 genome editing, and tissue engineering, we demonstrate the successful recapitulation of clinically observed disorganized sarcomeres that impair tissue contractility in vitro. Our approach demonstrates the utility of mature EHT platforms in modeling BAG3-mediated DCM and establishes a preclinical framework for testing targeted therapies for genetic heart disease.
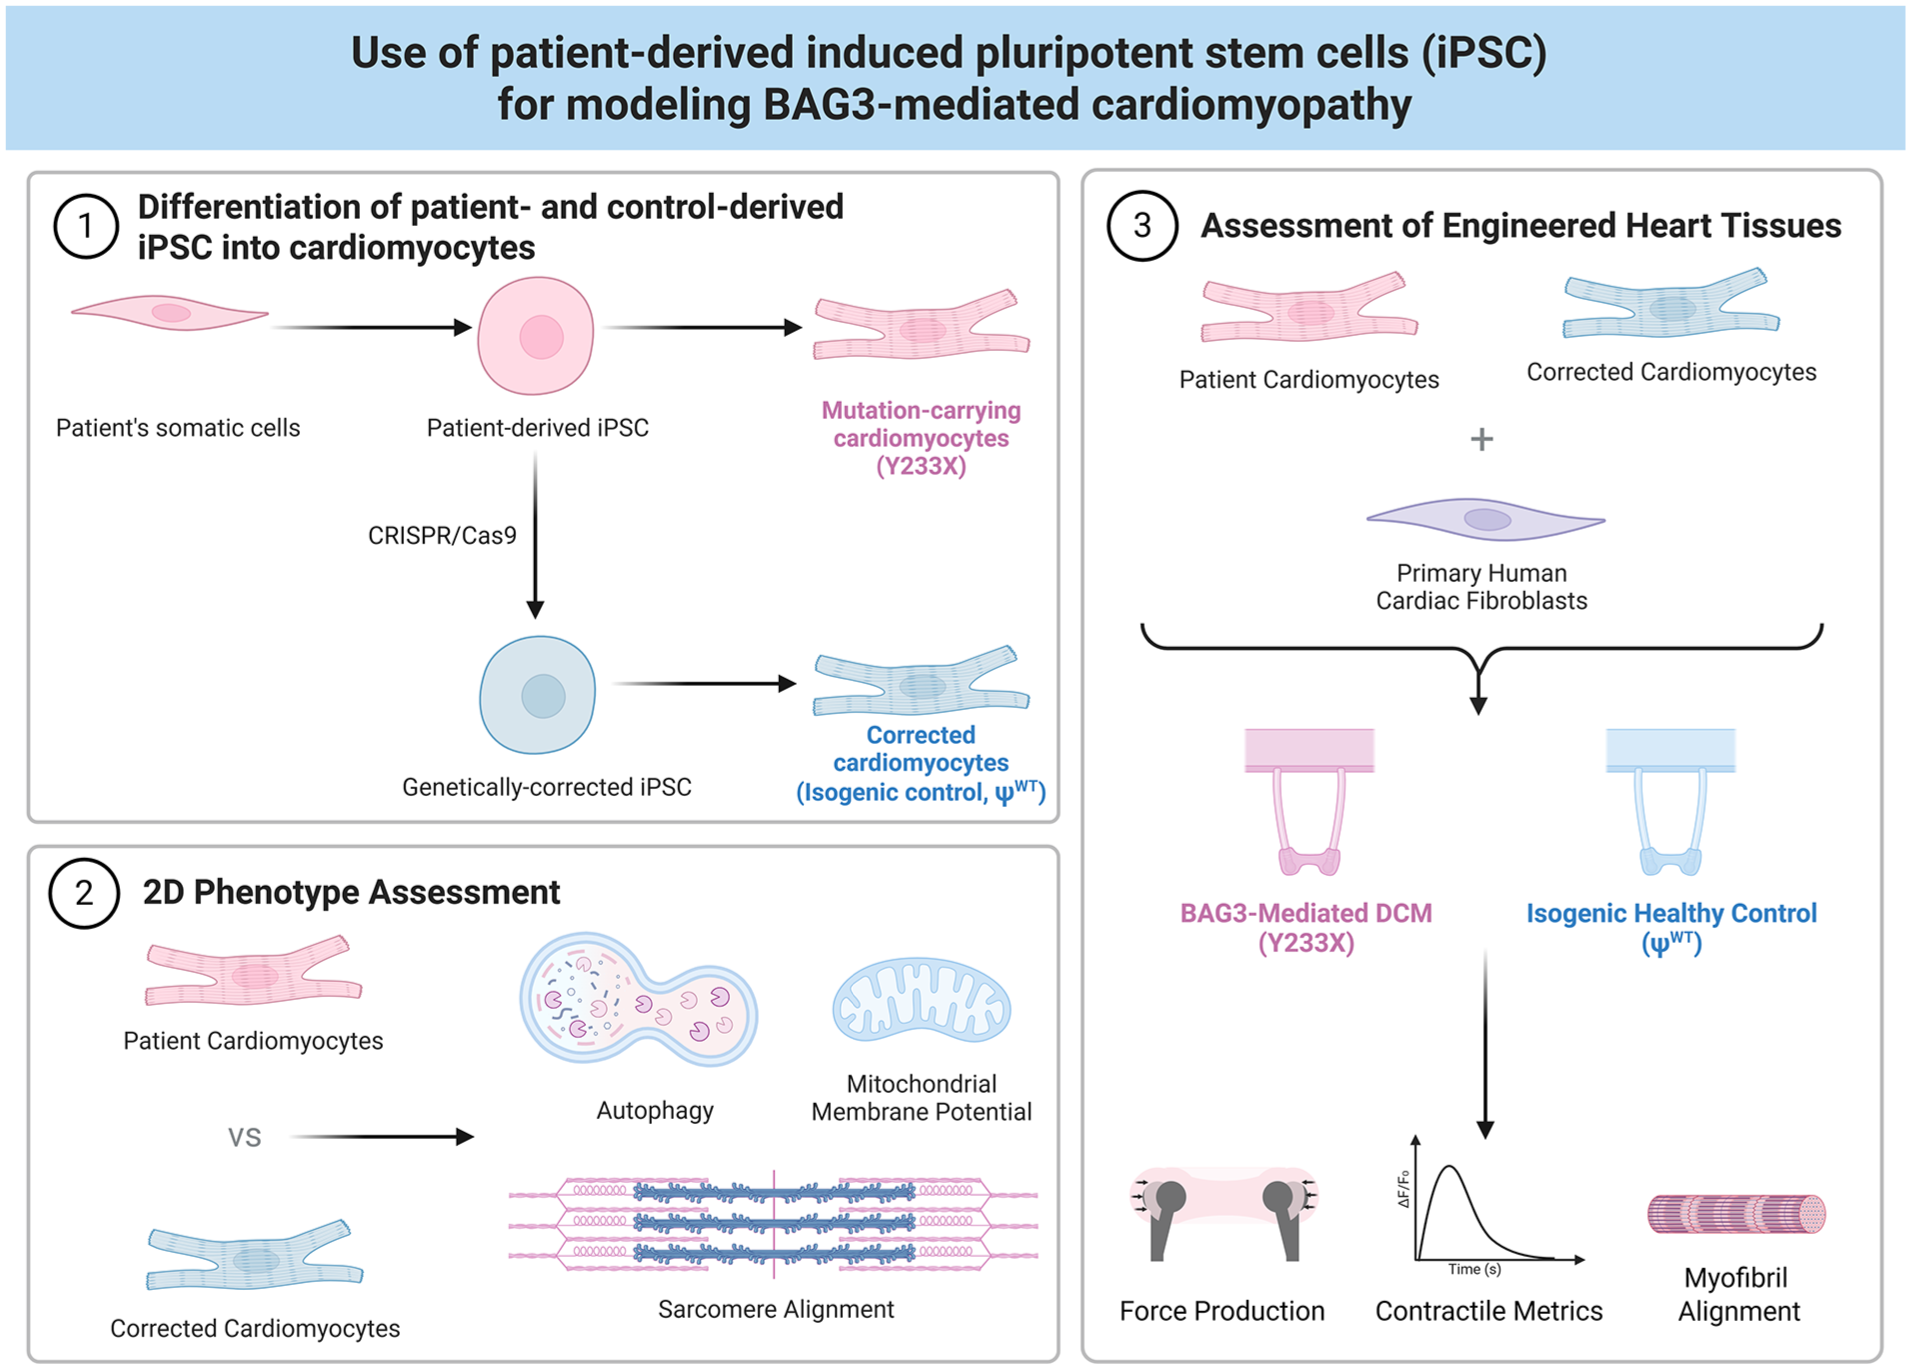
Schematic overview of the the experimental design. (1) Generation of an isogenic pseudo-wild-type control line (ΨWT) from a patient-derived iPSC line harboring a pathogenic variant of BAG3 (Y233X) and differentiation toward cardiomyocytes. Both cell lines are concurrently assessed for BAG3-mediated DCM phenotypes in (2) 2D and (3) 3D engineered heart tissues.
Methods
iPSC culture
Human iPSC lines were maintained in mTeSR Plus medium (Stem Cell Technologies) with 1% penicillin/streptomycin (Gibco) on Matrigel coated plates. Cells were passaged every 3–4 days using 0.5 mM EDTA (Invitrogen) and treated with 5 µM Rock inhibitor (RI, Y-27632 Tocris) for 24 h post-passaging. The female iPS cell line with a mutation in the BAG3 gene (SCVIi073-A, RRID:CVCL_C6SK) was obtained from the Stanford Cardiovascular Institute Biobank (Dr. Joseph Wu) through a material transfer agreement.
Generation and characterization of isogenic corrected iPS cell line
For comprehensive details on guide RNA design and editing strategy, please see Patel et al. 26 Briefly, stem cells were pre-treated with 5 µM RI for 2 h prior to nucleofection. Cells were dissociated using Accutase. Next, 1 million cells were mixed into a reaction mix containing sgRNA (Synthego, CRISPRevolution sgRNA EZ Kit), donor sequence (IDT, Alt-R Donor Oligos), and Cas9 protein (IDT, Alt-R S.p. HiFi Cas9 Nuclease V3), as well as P3 primary cell buffer and Supplement in a 100 µL cuvette (Lonza V4XP-3024), prepared as stated in Table 1. Cells were electroporated in a 4D-NucleofectorTM Core Unit (Lonza, cat# AAF-1002B) using program CA137. Immediately post-nucleofection, cells were resuspended in mTeSR Plus medium supplemented with 10% CloneR and seeded into 24-well plates pre-coated with Matrigel. CloneR was removed after 24 h and mTeSR Plus medium was refreshed daily. Following 5 days of recovery, edited cells in each well were dissociated and 3000 cells were seeded per 10 cm Matrigel-coated cell culture dish to promote single colony formation. After an additional 5 days of growth, 100–200 single-cell colonies were picked in a sterile hood and transferred to 96-well plates for genotyping. Genomic DNA was isolated by using 30 µL of QuickExtract DNA Isolation solution per well. Subsequently, 2 µL of isolated DNA was used per PCR reaction with 5× Taq Mastermix (NEB Biosystems). The thermocycling protocol used was denaturation for 4 mins at 94°C, 40 cycles of denaturation at 94°C for 15 s, annealing at 65°C for 15 s, and extension at 68°C for 15 s, followed by a final extension at 68°C for 5 min. Subsequent Sanger sequencing analysis was performed by GENEWIZ (Azenta Life Sciences). Karyotyping was performed by the Stem Cell Core facility at Columbia University.
Reagents used for electroporation (100 µL cuvette).

The sgRNA, Homology Directed Repair (HDR) sequence, and PCR primers used are shown in Table 2.
sgRNA, HDR sequence, and PCR primers for CRISPR/Cas9 Correction of Y233X mutation.

Cardiomyocyte differentiation, proliferation, and culture
Cardiomyocytes were differentiated from iPSCs as previously described.22,27 Two days prior to differentiation, hiPSCs were replated in 6-well plates at a density of 1.5E6 cells per well with 5 µM RI. The medium was refreshed with mTeSR Plus the following day. At the start of differentiation (Day 0), the medium was switched to a chemically defined medium containing RPMI1640, albumin, and ascorbic acid (CDM3), supplemented with 6 µM CHIR99021 (Tocris). On day 2 post differentiation, medium was switched to CDM3 containing 2 µM Wnt-C59 (Tocris). Cells were refreshed in CDM3 on day 4, 6, and 8 post differentiation. On day 10–12 post differentiation, beating cardiomyocytes were switched to RPMI 1640 with B27 Supplement (ThermoFisher). Cardiomyocytes were dissociated with TrypLE Select Enzyme (10×, Gibco), replated, and expanded for one passage in RPMI 1640 with B27, supplemented with 2 µM CHIR99021, refreshed every other day. 28 Cells were switched back to RPMI 1640 with B27 1 day prior to incorporation in EHTs or replated for monolayer experiments. Cardiomyocyte differentiations of >90% Troponin T-positive cells by flow cytometry were used for tissue experiments (Supplemental Figure 1).
Flow cytometry
Differentiation efficiency of the iCMs was determined by Troponin T-positive staining with flow cytometry. Briefly, dissociated single cells were pelleted and fixed in 4% PFA, then washed twice with PBS. Permeabilization was performed using 0.1% Triton X-100 in PBS, followed by incubation with an Alexa Fluor 647-conjugated primary antibody against troponin T (BD Biosciences, Cat no. 565744) according to the manufacturer’s instructions. After 30 min of staining, cells were washed three times with PBS and analyzed using a NovoCyte Quanteon cell analyzer.
Immunofluorescence
Cells were fixed using 4% paraformaldehyde (Sigma, Cat no. 252549) in PBS for 15 mins at room temperature, whereas tissues were fixed for 30 min at room temperature, and subsequently washed three times for 5 mins with PBS. Afterwards, samples were permeabilized in 0.25% (v/v) Triton X-100 (Sigma-Aldrich, Cat no. T8787-250ML) for 10 mins at room temperature and blocked using the blocking buffer (10% (v/v) FBS in PBS) for 1 h at room temperature under gentle shaking. The primary antibodies were diluted in 1% BSA in PBS and incubated for 2 h at room temperature. The primary antibodies used were anti-SOX2 (1:100, BioLegend, #651902), anti-Oct3/4 (1:100, Santa Cruz, sc-8628), anti-Nanog (1:100, Cell Signaling Technologies, #4903S), and anti-sarcomeric-α-actinin (1:500, Sigma, A7811). After washing the samples three times in PBS, they were incubated for 1 h with secondary antibody (1:1000 in 5% BSA in PBS) at room temperature (Goat anti-Rabbit IgG Alexa Fluor 594, Invitrogen A11012, Goat anti-Mouse IgG Alexa Fluor 647, Invitrogen A21235, and Donkey anti-Goat IgG Alexa Fluor 546, Invitrogen A11056). Subsequently, three washes of 5 mins in DPBS were performed. The samples were counterstained using DAPI (1 µg/mL in DPBS, BD Pharmingen). Samples were imaged using the Nikon A1 Confocal Microscope with a 20× objective or a 60×/1.49 Apo TIRF oil immersion lens and analyzed in ImageJ (Fiji).
RNA isolation, cDNA synthesis, and RT-qPCR
mRNA was isolated from iPSCs and iCMs using the RNeasy Mini Kit (Qiagen, Cat no. 74106) according to the manufacturer’s protocol. RNA quality was ensured with a proper 260/230 ratio between 1.8 and 2.2 and a proper 260/280 ratio (~2.0) using the NanoDrop One (Thermofisher). cDNA samples were obtained from 0.5 µg RNA using High Capacity cDNA Reverse Transcription Kit (Applied Biosystems, Cat no. 4368813) according to the manufacturer’s instructions. Reverse transcriptase quantitative polymerase chain reaction (RT-qPCR) was performed with 5 ng cDNA per sample, 10 µM (stock solution) of forward and reverse primer (see Table 3) at a final concentration of 0.2 µM, and Fast SYBR Green Master Mix (Applied Biosystems, Cat no. 4385612) in a 96-well plate (Applied Biosystems, Cat no. 4346906). Thermal cycling was performed in a StepOne Plus Real Time PCR System (Applied Biosystems) using 40 cycles of two-step PCR protocol of 95°C melting for 3 s and 60°C annealing and extension for 30 s, preceded by an initial hot start at 95°C for 20 s. Validation of primer efficiency and specificity was assessed by their melt curves (Supplemental Figure 2). Relative gene expression was calculated using the 2−ΔCt method.
Primers used.

Protein isolation and western blot
iPSCs and iCMs were washed with ice-cold PBS and lysed directly on the plate in Pierce IP Lysis Buffer (ThermoFisher, #87787) containing protease and phosphatase inhibitors (ThermoFisher, #78442) to obtain protein samples. The collected lysate was intermittently vortexed for 20 min while remaining on ice. Removal of cell debris occurred through centrifuging the lysate at 16,000g for 10 min at 4°C. The protein content in the supernatant was quantified using the Pierce BCA kit (Thermofisher). Lysates were mixed with 4× Laemmli buffer and boiled at 95°C for 5 min and 10–20 µg total protein was loaded in a 4%–20% Tris-glycine gel (Thermofisher, XP04205BOX). The gels were transferred onto 0.2 µm nitrocellulose membranes and blocked in 5% non-fat dry milk in TBST for 1 h. Incubation with primary antibodies was done overnight at 4°C in 5% BSA in TBS with 0.1% Tween 20 (TBST). The following primary antibodies were used: HSPB8 (1:1000, Proteintech, #15287-1-AP), BAG3 (1:3000, Proteintech, #10599-1-AP,), P62/SQSTM1 (1:1000, Proteintech, #18420-1-AP), HRP-conjugated β-actin (1:1000, Cell Signaling Technologies, #5125), and HRP-conjugated GAPDH (1:1000, Cell Signaling Technologies, #3683). The next day, the membranes primed with unconjugated antibodies were washed and blotted with an HRP-linked rabbit secondary antibody (1:5000, Cell Signaling Technologies, #7074) in milk for 1 h at room temperature. Western blot membranes were imaged on a Licor Odyssey Fc system, after incubation with enhanced chemiluminescent (ECL) substrate (SuperSignal West Femto Maximum Sensitivity Substrate, ThermoFisher), and band intensity was quantified using the ImageStudio Lite Software (v5.2).
Mitochondrial assays
To assess the mitochondrial membrane potential in iCMs, we utilized the MitoProbe TMRM Assay Kit (ThermoFisher, Cat no. M20036) according to the manufacturer’s instructions. We analyzed the mean fluorescent intensity using a flow cytometer (NovoCyte Quanteon). To assess the amount of active mitochondria per cell, we stained the iCMs using MitoTracker Green (ThermoFisher, Cat no. M7514) according to manufacturer’s protocol and assessed the mean fluorescent intensity using flow cytometry.
Sarcomere score assignment
To assess the sarcomere integrity of monolayer iCMs, we stained the iCMs with sarcomeric α-actinin, as detailed in Immunofluorescence section. Subsequently, images were evaluated and scored in a blinded and randomized fashion by a group of seven expert scientists. The scoring system was defined based on previous reports 16 : Score 5: all myofilaments are continuous, well ordered and in parallel; Score 4: all myofilaments are continuous, well ordered, but not running in parallel; Score 3: significantly disordered myofilament with fragmentation that accounts for <50% of the total area of the cell; Score 2: significantly disordered myofilaments with fragmentation and disintegration that accounts for >50% of the area; Score 1: no identifiable myofilament structures (Supplemental Figure 3). Scores from seven blinded scientists were (1) averaged to obtain a single score per cell and evaluated by an unpaired, two-tailed Student’s t-test. and (2) the mode of the scores was further evaluated with Fisher’s exact test. The assessment of the sarcomere integrity in EHTs was performed in a similar fashion, based on the scoring system presented in Supplemental Figure 4. Score 5: all myofilaments are intact and running in parallel; Score 4: all myofilaments are intact but not running in parallel; Score 3: significantly disordered myofilament with fragmentation that accounts for <50% of the total area; Score 2: significantly disordered myofilaments with fragmentation and disintegration that accounts for >50% of the area; Score 1: no identifiable myofilament structures. Three tissues of each group were stained with sarcomeric α-actinin as described. Images were prepared in ImageJ (Fiji) to obtain 6–10 ROIs per tissue that were scored by the experts. The average and mode of the scores per tissue were determined.
Generation and maintenance of cardiac tissues
Prior to tissue formation, human primary cardiac fibroblasts (HCFs) were cultured in fibroblast growth media 3 (FGM3, PromoCell) until 70%–80% confluence and used at passage 4. Tissues were generated in the milliPillar platform as described in our recently reported pipeline. 25 Briefly, culture platforms were cast from PDMS in custom-milled molds containing electrodes for electrical stimulation. i CMs and HCFs were dissociated to single cells using 10× TrypLE (ThermoFisher) and 1× TrypLE, respectively. 550,000 cells per tissue (85% iCMs and 15% HCFs) were resuspended in 5 mg/ml fibrinogen (Sigma-Aldrich, cat. no. F3879).
For each tissue, 13.5 µl of cell suspension was mixed with 3 µl of thrombin (5 U/ml, Sigma-Aldrich, cat no. T6884). After formation, tissues were maintained in fresh B27 media. Seven days after tissue formation, media was changed to a 50/50 mixture of B27 media and a RPMI-based metabolic maturation media. This culture media contained AlbuMAX (ThermoFisher, Cat no. 11020021) with higher calcium content (1.8 mM) and lower glucose content (3 mM) to promote fatty acid oxidation, as detailed in previous publications.22,31
To mature tissues, we implemented a 2-week ramped electrical stimulation regimen, using a custom-built stimulator, 25 that started at 2 Hz, and the frequency was increased by 0.33 Hz every 24 h until the frequency of 6 Hz was achieved. Thereafter, tissues were maintained at 2 Hz stimulation for one more week. The voltage of the stimulator was set to deliver biphasic pulses at ±2.5 V. The media was supplemented with 5 mg/mL 6-aminocaproic acid (Sigma-Aldrich A7824) throughout the tissue experiment. Tissues videos were analyzed using our recently reported machine-learning based open-source pipeline, BeatProfiler, 32 which generated the metrics for cross-sectional area, passive tension, active force, and contraction dynamics.
LDH assay
LDH secretion by engineered heart tissues was measured using the LDH-Glo Cytotoxicity Assay (Promega) according to manufacturer’s protocol in an opaque white 96-well plate. Briefly, 5 µl of supernatant was mixed with 95 µl of LDH storage buffer (200 mM Tris-HCl, pH 7.3, 10% Glycerol, 1% BSA) and stored at −20°C until the start of the assay, while avoiding freeze-thaw cycles. The endpoint luminescence was measured after 1 h of incubation at room temperature in light conditions using the Synergy H1 Plate Reader (BioTek).
Statistical analysis
Statistical significance was determined using an unpaired, two-tailed student’s t-test, one-way ANOVA followed by Bonferroni’s post hoc test, two-way ANOVA followed by Sidak’s post hoc test, or a Fisher’s exact test using GraphPad Prism 10.4.0 (GraphPad Software, La Jolla, CA). The p-value of less than 0.05 was considered statistically significant.
Results
Generation and characterization of CRISPR/Cas9 corrected isogenic control of patient-derived iPS cell line with a Y233X pathogenic variant of BAG3
From the Stanford Cardiovascular Institute Biobank, we obtained iPSCs from a 60-year-old female patient with a history of non-ischemic cardiomyopathy. 17 Genetic testing revealed two mutations in BAG3, namely a termination mutation in p.Tyr233Ter (c.699C>A), which GeneDx classifies as disease-causing and SCICD classifies as likely disease-causing; and a second mutation at p.Ala262Thr (c.784G>A), which is a variant of uncertain significance. Lastly, the patient also harbored a variant of unknown significance in the TTN gene: p.Leu3557ThrfsX9 (c.10670dupG), which was retained in both cell lines. We subsequently utilized CRISPR/Cas9 and homology-directed repair to correct the p.Tyr233Ter (Y233X) termination mutation (Figure 2(a)), while preserving the mutation p.Ala262Thr of unknown significance. The corrected iPSC line, or pseudo-wild-type (ΨWT), presented with normal karyotype (Figure 2(b)). Both cell lines exhibit pluripotency based on immunofluorescence imaging of pluripotency markers SOX2, Oct3/4, and Nanog (Figure 2(c)).
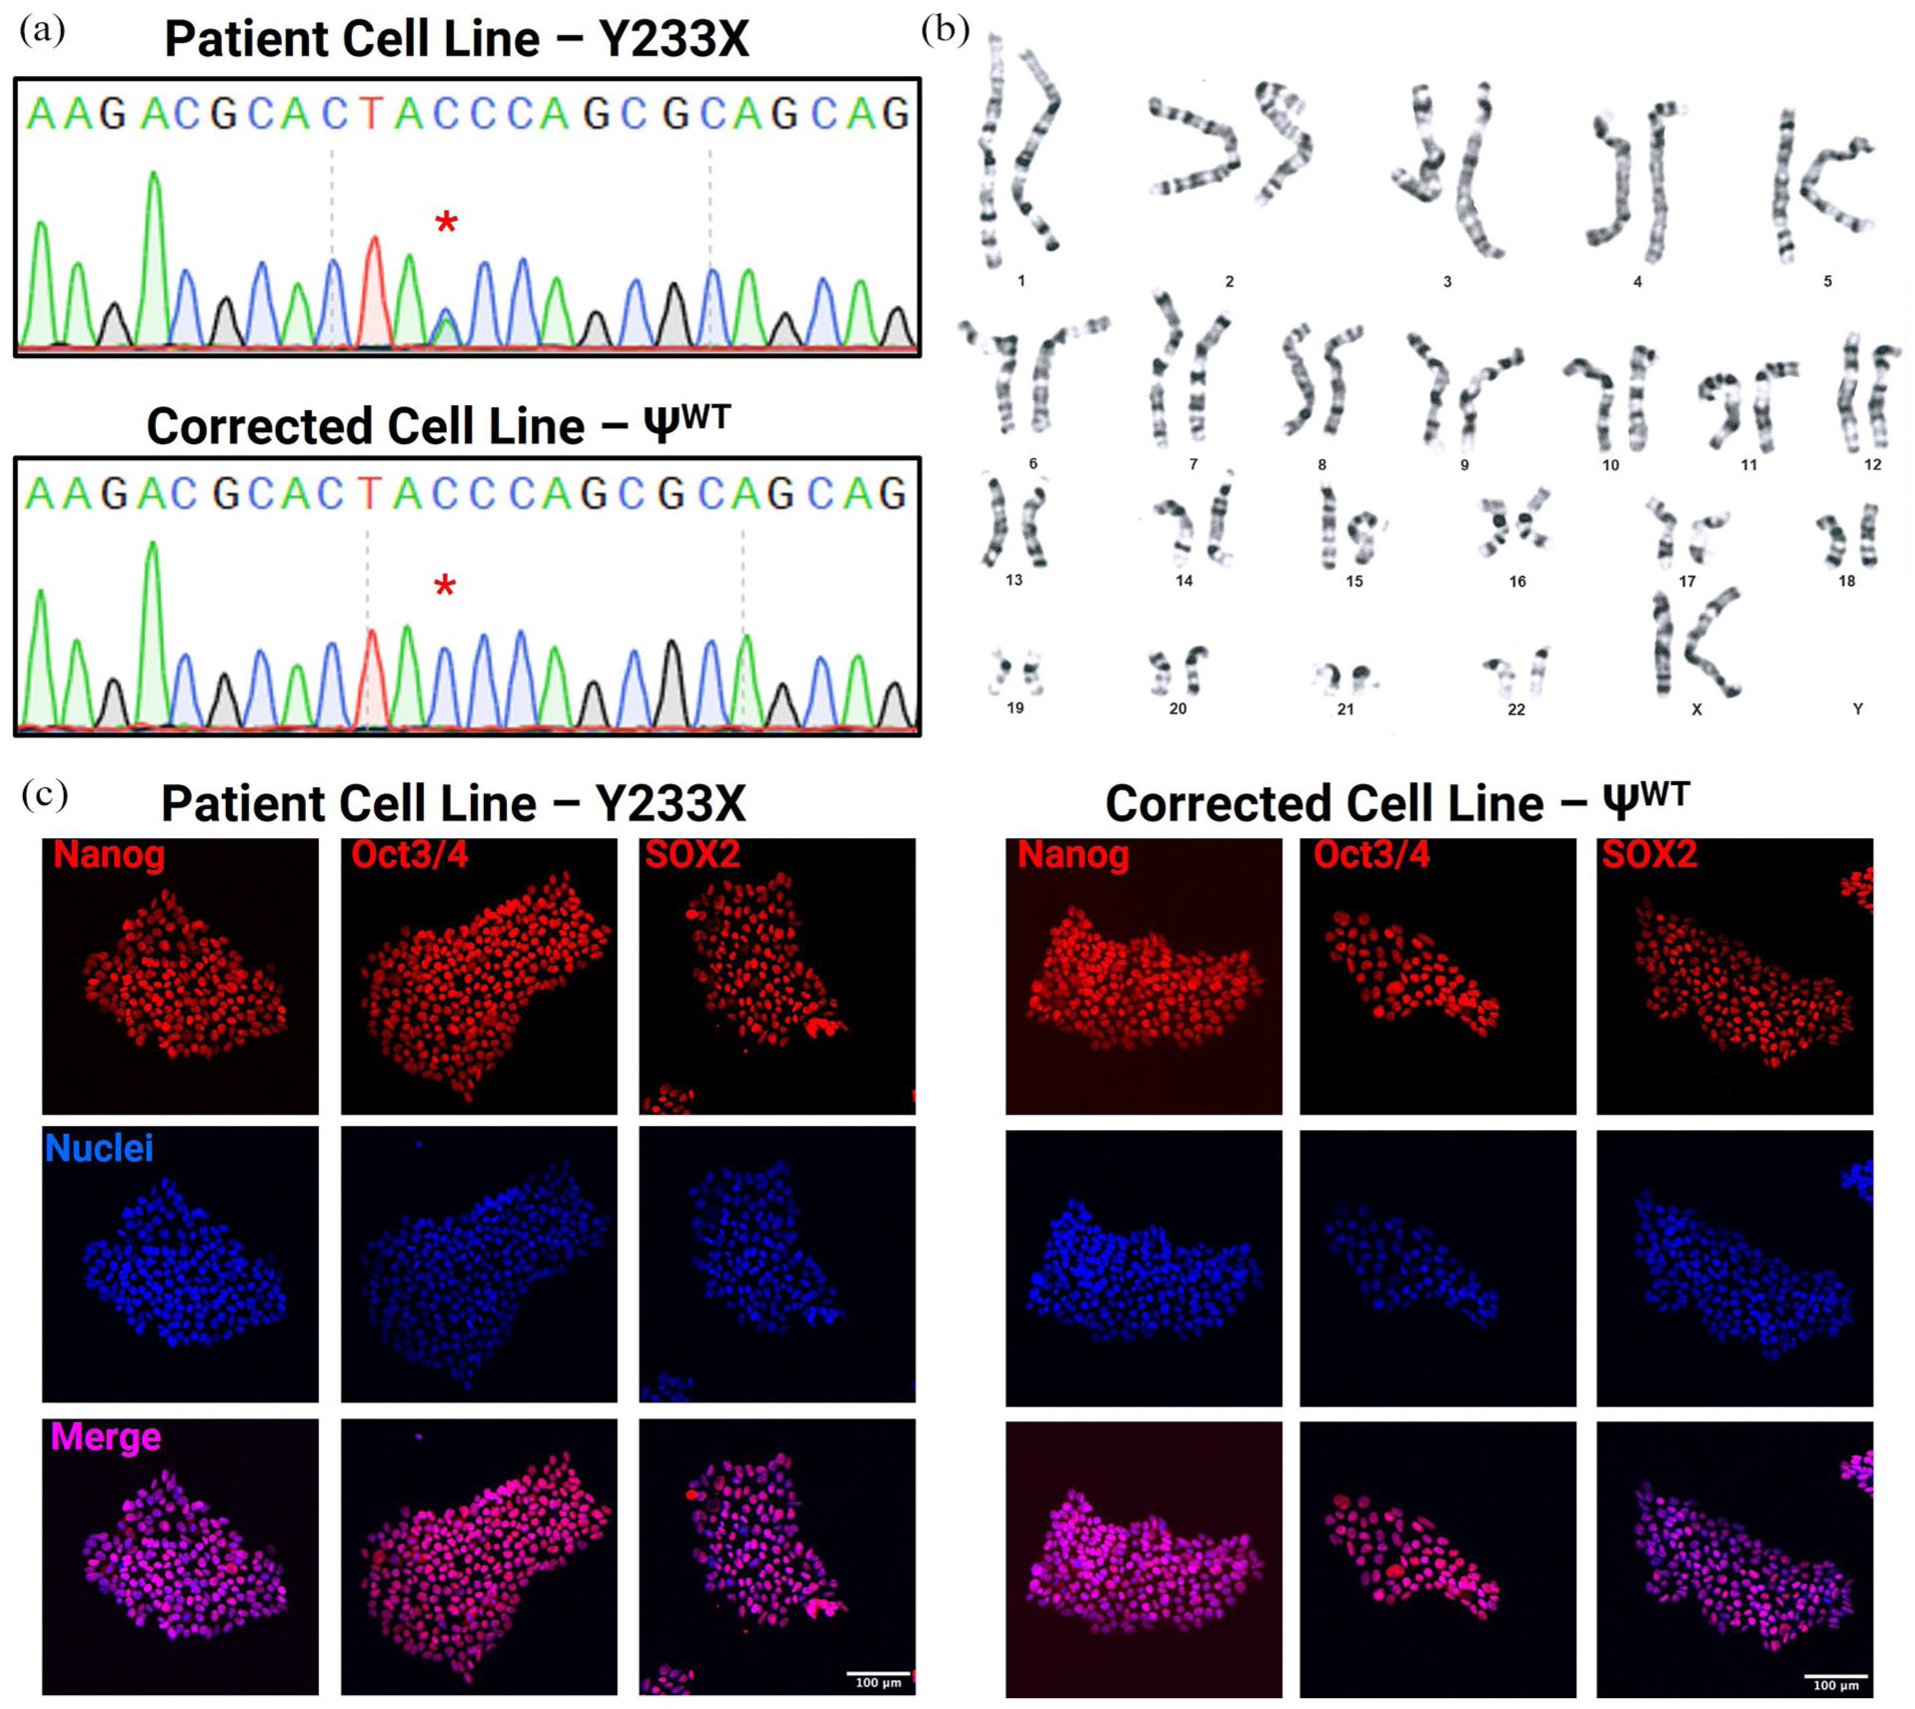
Generation and characterization of CRISPR/Cas9-corrected ΨWT for the Y233X mutation in BAG3: (a) Sanger-sequencing analysis confirms correction of the Y233X mutation from TAA (stop codon) to a TAC (tyrosine), resulting in a homozygous TAC codon, (b) ΨWT iPSC line exhibits normal karyotype, and (c) Immunofluorescence staining demonstrates expression of pluripotency markers Nanog, Oct3/4, and Sox2 in both cell lines. Scale bar represents 100 µm.
Gene correction rescues BAG3 expression in iPSCs and iPSC-derived cardiomyocytes
Although BAG3 is a ubiquitously expressed protein, it is highly expressed in skeletal muscle cells and CMs. Given that our patient presented with cardiomyopathy, we sought to investigate the impact of the BAG3 mutation in CMs. To this end, we differentiated the patient-derived Y233X and ΨWT iPSCs toward iCMs, as confirmed by the expression of cardiac-lineage and cardiomyocyte-specific markers by qPCR (Figure 3(a)–(c)). We further validated the increased expression of BAG3 in iCMs compared to iPSCs by Western Blot (Figure 3(d) and (e)). Genetic correction of the Y233X variant restored full-length BAG3 protein and increased the global expression of BAG3 in both iPSCs and iCMs. Loss of BAG3 has previously been shown to lower endogenous levels of HSPB8 by decreasing its stability, a finding which we observed in our isogenic pair of cells. 33 Notably, this effect was only observed in iCMs, but not in iPSCs, likely due to the lower basal expression of both BAG3 and HSPB8 in pluripotent cells (Figure 3(d) and (f)).
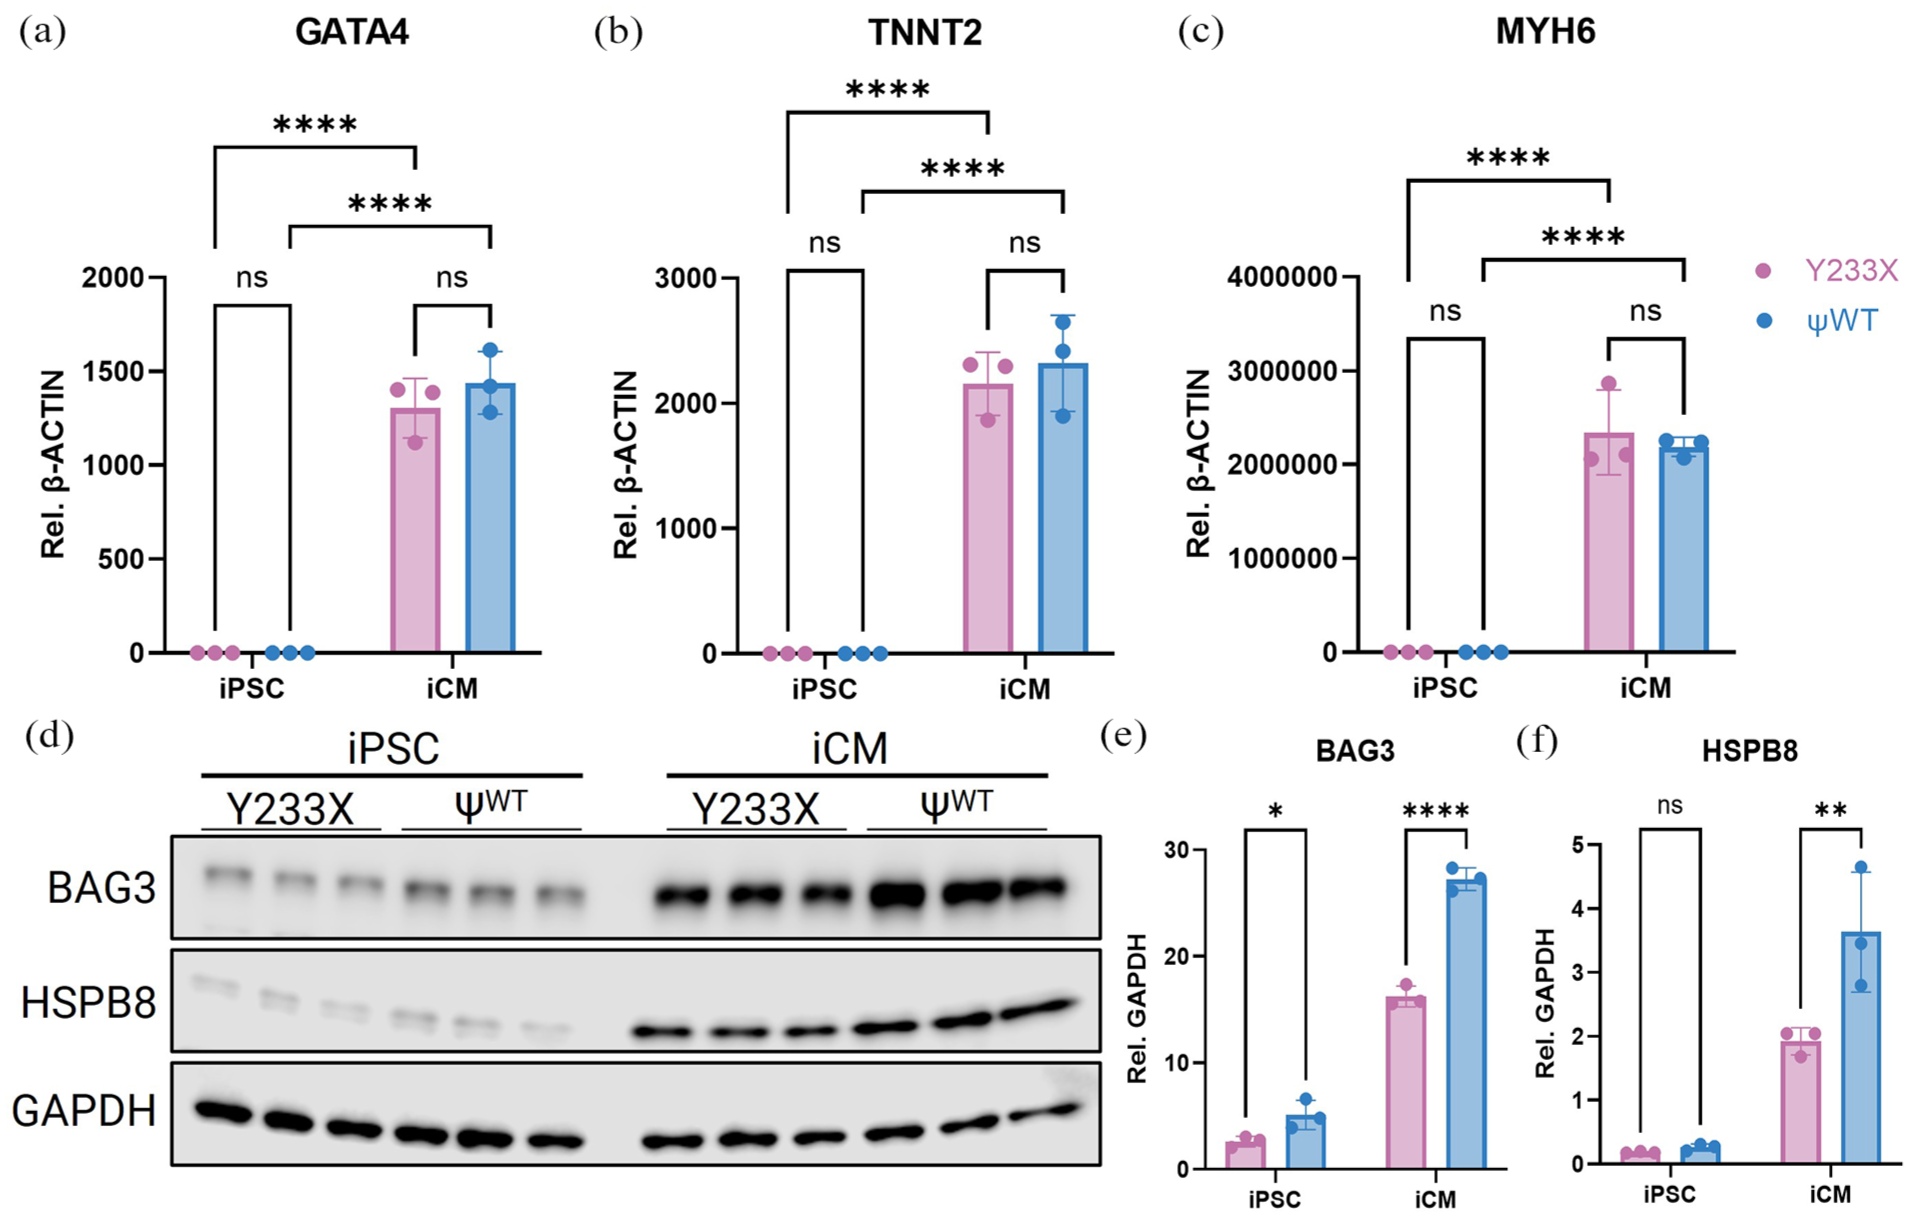
Generation of Y233X and ΨWT in iPSCs and iCMs: (a–c) RT-qPCR of cardiac lineage and cardiomyocyte specific markers GATA4, TNNT2, and MYH6 in iPSCs and iCMs from both lines. (d) Western Blot of BAG3, HSPB8, and housekeeping gene GAPDH, (e) densitometry quantification of BAG3, and (f) HSPB8 normalized to GAPDH. Data represent mean ± SD, n = 3. *p < 0.05, **p < 0.01, ****p < 0.0001 as assessed by two-way ANOVA with post hoc Sidak’s.
Assessment of autophagy, mitochondrial function, and sarcomeric organization in cardiomyocytes
Subsequently, we sought to investigate whether these iCMs could recapitulate the established functions of BAG3. Loss of BAG3 has been shown to perturb autophagy pathways, 34 impair mitochondrial function, 35 and disrupt degradation of sarcomeric proteins in CMs.9,16 Using the patient-derived Y233X and ΨWT iCMs, we observed decreased autophagy by reduced levels of p62/SQSTM1 in the Y233X iCMs by Western Blot (Figure 4(a) and (b)). Consistently, we observed a reduction in mitochondrial membrane potential (ΔΨM) in the patient-derived iCMs, as measured by Tetramethylrhodamine (TMRM), without changes in total mitochondrial count as measured by MitoTracker Green (Figure 4(c) and (d)). These results closely align with previous reports of both homozygous and heterozygous BAG3 KO in CMs.34,35

Evaluation of autophagy, mitochondrial health, and sarcomere structures in Y233X and ΨWT iCMs: (a) Western blot of BAG3, p62/SQSTM, and housekeeping gene β-actin, (b) densitometry quantification of p62 normalized to β-actin, (c) mitochondrial membrane potential measured by the mean fluorescent intensity of TRMR staining, (d) mitochondrial count measured by the mean fluorescent intensity of MitoTracker Green. Data represent mean ± SD, n = 3. *p < 0.05, **p < 0.01 as assessed by Student’s t-test, (e) representative images of α-actinin staining in Y233X and ΨWT iCMs. Scale bar represents 25 µm. (F) mean sarcomere scores per cell, calculated by averaging the integer scores (1–5) assigned in a blinded fashion by seven independent experts. Data represent mean ± SD, n = 60-61. Statistical significance was evaluated by Student’s t-test. (g) Distribution of the mode (most frequently assigned score) of sarcomere scores per cell, based on blinded assessments by the same seven experts, used for categorical analysis. Statistical significance was evaluated by Fisher’s exact test, n = 60–61.
Beyond molecular changes, we aimed to assess differences in sarcomeric organization and alignment by staining the iCMs for Z-disk protein sarcomeric α-actinin (Figure 4(e)). Therefore, we assembled a group of experts from our group to rank the sarcomeres of both cell types in a blinded and randomized fashion, where score of 1 indicated a completely disintegrated sarcomere and a score of 5 signified a perfectly aligned cardiomyocyte structure (Supplemental Figure 3), based on a previously outlined scale by Judge et al. 16 Interestingly, we found no difference in the myofilament structures between the patient’s iCMs and ΨWT iCMs, by either Student’s t-test on the average sarcomere score per cell or by Fisher’s exact test when categorizing the mode ranking per cell (Figure 4(f) and (g)). This was surprising, given the previously published reports on BAG3 KO in iCMs showed decreased sarcomere integrity. 16 However, these previous studies were conducted on homozygous and heterozygous KO of BAG3, whereas this study utilized a clinically relevant patient-derived heterozygous mutation, possibly presenting with a milder phenotype.
Engineered heart tissues harboring a BAG3 mutation exhibit impaired contractility
As BAG3-mediated DCM typically presents in adulthood, we hypothesized that the immature iCMs were not able to recapitulate the phenotype observed in human adults. Therefore, we leveraged our previously published protocols for deriving mature EHTs22,25 to investigate the effects on force generation and sarcomeric integrity. We combined 85% iCMs from the patient cell line and the corrected ΨWT line with 15% primary human cardiac fibroblasts. We selected this initial cell ratio based on both physiological relevance, as evidenced by datasets from human hearts and lineage tracing studies in mice reporting approximately 15% cardiac fibroblasts,36–39 as well as our own optimization experiments previously described. 22 The tissues were matured for 4 weeks by ramped electromechanical conditioning. 21 Both tissues compacted similarly, demonstrating equal cross-sectional areas (Figure 5(a) and (b)).

Characterization of engineered heart tissues derived from Y233X and ΨWT iCMs: (a) representative images of engineered heart tissues of both cell types. Scale bar represents 500 µm, (b) cross-sectional area of both tissues, (c) passive tension generated by both tissues, (d) active force generated by both tissues, (e) active stress generated by both tissues, normalizing the active force to the cross-sectional area, (f) work produced by both tissues, which normalized the active force to the passive tension, and (g) LDH secretion from both tissues. Data represent mean ± SD, n = 11/12. *p < 0.05, ****p < 0.0001 by Student’s t-test.
To assess the functional differences between the tissues after maturation, we measured the pillar deflection by stimulating the tissues at 1 Hz to evaluate the passive tension and active force generated by the tissues (Figure 5(c) and (d)). We found that the passive tension did not change between healthy and patient-derived EHTs, while the active force produced by the tissues was greatly improved following genetic correction of the BAG3 mutation. This was further evidenced by the improvements in active stress, which quantifies the active force normalized to the cross-sectional area, and in work, which is defined as the total force integrated over the pillar deflection distance, thereby normalizing the active force to the passive tension (Figure 5(e) and (f)). Taken together, the unchanged passive tension and decreased force production suggest a contractile dysfunction that is reflective of a DCM phenotype, rather than a relaxation dysfunction observed in restrictive cardiomyopathies. 23
We also observed increased lactate dehydrogenase (LDH) secretion in the patient-derived EHTs (Figure 5(g)). Although LDH secretion is widely used to evaluate cytotoxicity in vitro, 40 elevated levels of LDH have been observed in hearts in response to hemodynamic stress or hypertrophy in mice, rats, and humans41–43 and in EHTs with a loss of BAG3 in cardiac fibroblasts. 22 Furthermore, increased LDH-A has been implicated as mediator of cardiac fibrosis, 44 a hallmark of BAG3-mediated DCM.7,11,22 Therefore, the elevated LDH levels may reflect a combination of increased cytotoxicity and a maladaptive remodeling stress response, while clearly showing a difference in phenotype between the two cell lines.
To further assess the contractile dysfunction, we stained the patient and ΨWT iCM myofilament structures in our whole-mounted EHTs for sarcomeric α-actinin and revealed a clear structural difference between tissues derived from the two cell types (Figure 6(a)). The patient-derived EHTs exhibited severe disintegration of the sarcomere, whereas the ΨWT tissue showed intact and aligned sarcomeric structures, a significant difference as quantified by the assessment of blinded experts (Figure 6(b), Supplemental Figure 4). Further, the modes of these sarcomere scores were 1, 1, and 2 for the patient-derived EHTs and 4, 4, and 4 for the ΨWT tissues (p = 0.1 by Fisher’s exact). This observation was accompanied by deficits in contraction and relaxation. The time to contract and relax to 90% of the maximal pillar displacement was significantly lower in the ΨWT tissue, which was accompanied by an increase in contraction and relaxation speed (Figure 6(c)–(f)). Altogether, these results demonstrate that EHTs from patient-derived iPSCs recapitulate key clinical features of BAG3-mediated DCM in vitro with decreased contractile function and disarrayed sarcomeres.
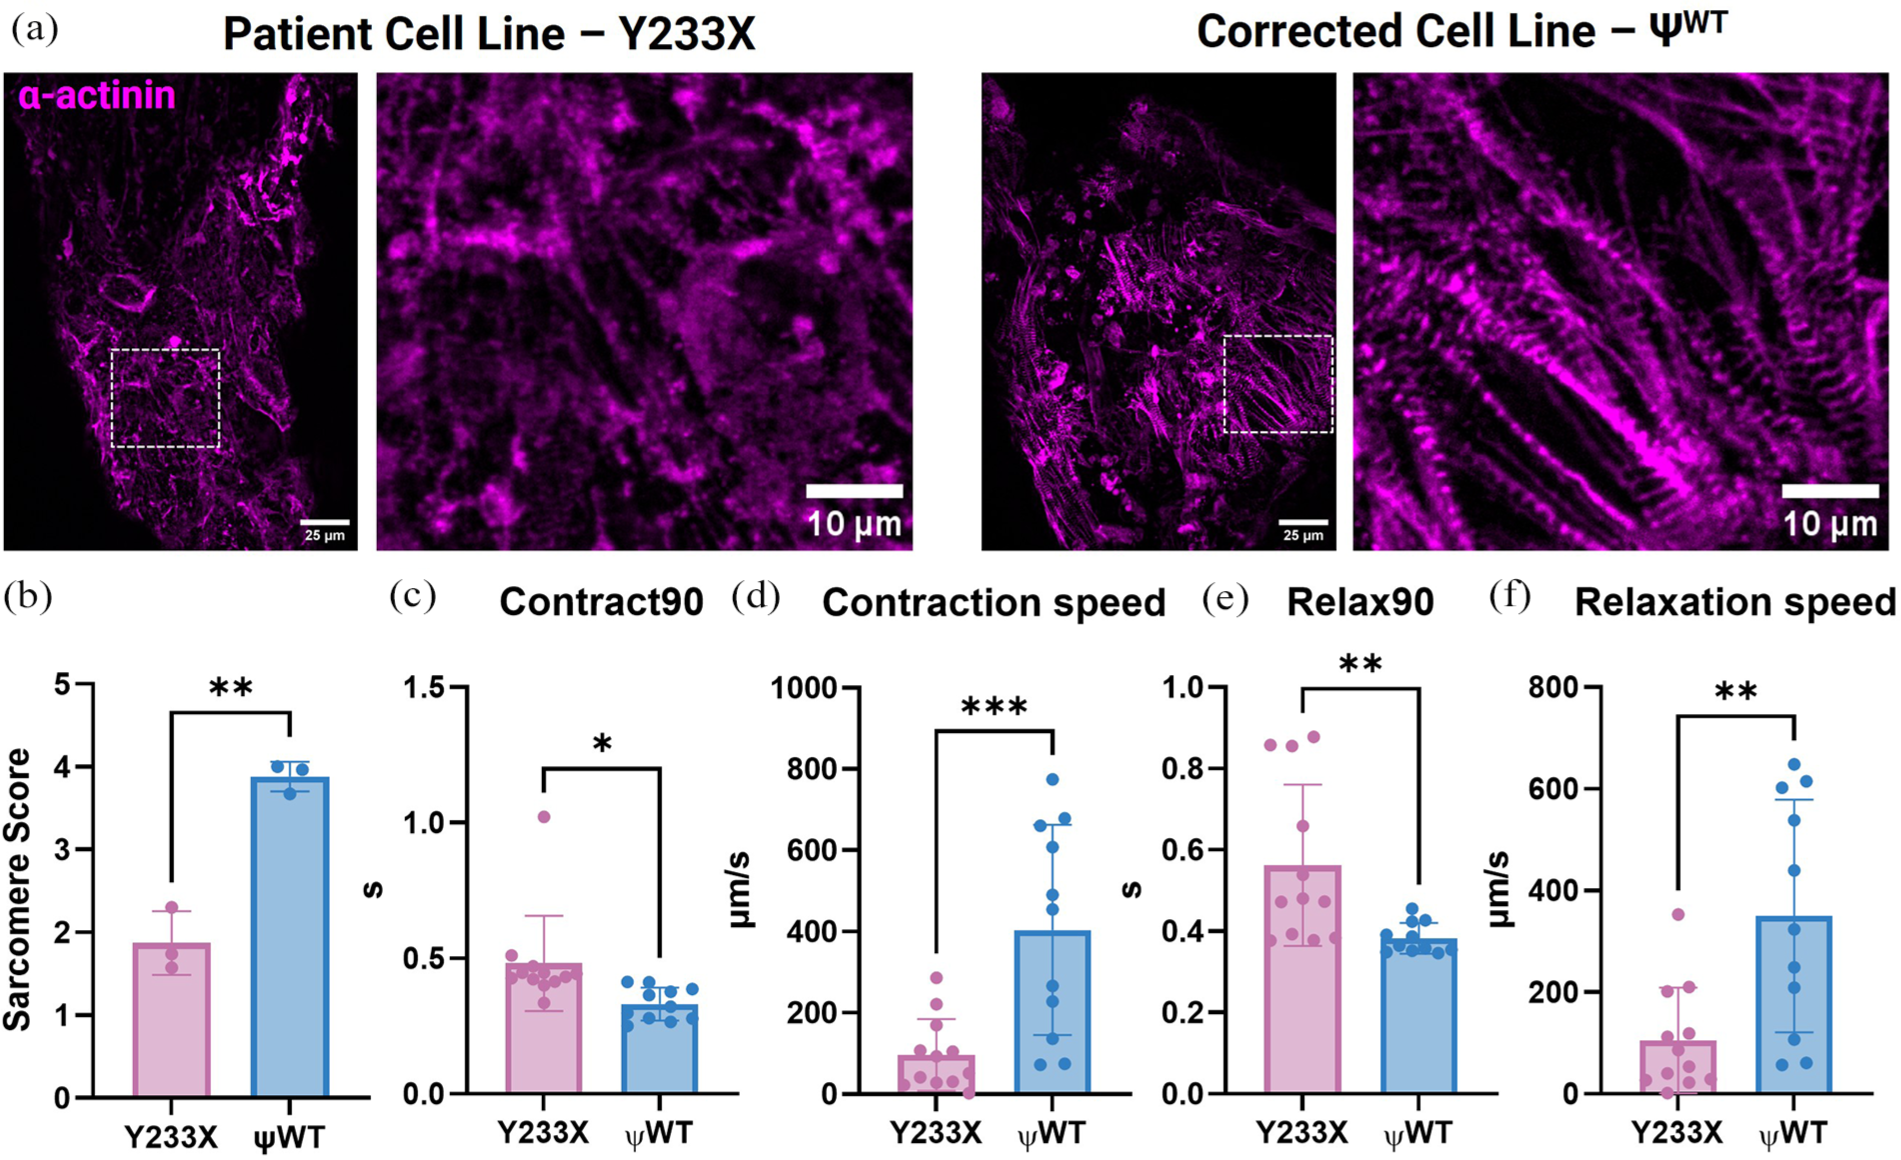
Characterization of contractile metrics in Y233X and ΨWT EHTs: (a) representative images of sarcomeric α-actinin staining in Y233X and ΨWT EHTs. Scale bar represents 25 µm in the overview image and 10 µm in the magnified view image, (b) averaged sarcomere score per tissue as scored by seven blinded experts, n = 3, (c) time in seconds required to contract 90% of full contraction, (d) contraction speed of both tissues, (e) time in seconds required for the tissues to achieve 90% of relaxation, and (f) relaxation speed of both tissues. Data represent mean ± SD, n = 11/12. *p < 0.05, **p < 0.01, ***p < 0.001 by Student’s t-test.
Discussion and conclusion
BAG3 levels are diminished in HF and several mutations have been identified to cause DCM and myopathies.3,4,45 Its binding domains (WW, IPV, PxxP, and BAG) are critical to BAG3’s function to facilitate proteostasis. 46 BAG3’s role has been extensively studied in CMs, both in vitro and in vivo. Mechanistically, BAG3 aids sarcomere protein turnover through chaperone-assisted selective autophagy, in which BAG3’s complex with HSP70, HSPB8, and E3 ligase CHIP facilitates ubiquitination and degradation of sarcomeric proteins at the Z-disk.9,13 Here, we report an engineered heart tissue model of a pathogenic variant of BAG3 and its isogenic control that exhibit hallmarks of DCM in vitro, evidenced by the disintegration of the myofilament structures, with corresponding deficits in force generation measurements. These in vitro phenotypes closely mirror the clinical presentation of the patient, who was diagnosed with non-ischemic cardiomyopathy.
Our investigation into this specific pathogenic variant matches our previously published study of homozygous BAG3KO in iPSC-derived EHTs. 22 Here, we showed a 3.1-fold improvement in active force production of a Full WT tissue compared to Full KO tissues, whereas the model presented here shows a smaller, 2.6-fold improvement. This could highlight that the patient-derived EHT model shows a milder, more clinically relevant phenotype compared to a homozygous KO model.
Contrasting our in vitro model, studies of genetic heart diseases often rely on mouse models, focusing on the effects of gene loss at the whole-organism or whole-organ level. Cardiomyocyte-specific homozygous knock-out of BAG3 in mice results in DCM by 12–16 weeks of age. 11 However, since homozygous mutations are extremely rare in humans, models of haploinsufficiency more accurately reflect human pathology. Myers et al. developed a haploinsufficiency model of cardiomyocyte BAG3 in mice, demonstrating reduced left ventricular function at 10 weeks of age, 47 while Wang et al. observed a marked reduction in cardiac output at 18 weeks. 35 These studies demonstrate that the heterozygous knock-out of BAG3 in CMs mimics the human haploinsufficiency phenotype that is distinct from the more severe phenotype observed in homozygous models, 47 which manifests phenotypes earlier, highlighting the need for haploinsufficient models of BAG3.
While murine models are valuable for studying whole-organism physiology, they require extensive time to develop and several months to manifest the DCM phenotype. In contrast, our engineered heart tissue model requires 2–3 weeks to generate iCMs and 4 weeks of culture to form and mature cardiac tissues that generate the phenotype, which offers a more rapid and high-throughput approach to drug screening and disease modeling. This is further supported by tissue-engineered models of other cardiomyopathies that are phenotype specific, including restrictive cardiomyopathy (RCM) and hypertrophic cardiomyopathy (HCM).
Along with the Fine lab, we have previously published an EHT model of RCM caused by a de novo in-frame deletion of the filamin-C gene, classified as a pathogenic variant by GeneDx. 23 In that study, tissues displayed key characteristics of the restrictive phenotype by the increased passive tension, as opposed to no changes in passive tension seen in our BAG3-mediated DCM tissues, and we further demonstrated the platforms’ effectiveness for drug screening. 23 In addition, other groups have modeled HCM in EHTs with pathogenic R403Q 48 and R719Q 49 mutations in Z-disk protein β-myosin heavy chain (MYH7). They showed increased active force and contraction speed, contrasting the DCM phenotype. Similarly, BRAF mutations recapitulate HCM in a 3D EHT model with similar characteristics. 50 DCM has been recapitulated in EHTs with titin (TTN) mutations with clear deficits in active force generation, 51 similar to the decrease in active force generation in our BAG3 patient-derived EHTs. Both TTN and BAG3 mutant EHTs exhibited dysfunctional sarcomere structures that result in the reduced force production. Interestingly, the patient cell line used in this study harbors an additional variant in the TTN gene, classified as a variant of unknown significance by GeneDx, which may contribute to the observed clinical cardiomyopathy phenotype. The TTN gene is the most common locus of genetic DCM, and since we did not correct this mutation, additional research is required to understand its contribution to the development of cardiomyopathy. In future work, the TTN mutation’s contribution to the tissue phenotype could be assessed by correcting both lines for the TTN mutation using gene editing. Altogether, these models highlight the potential of engineered heart tissues for disease modeling and drug screening. 52
While EHTs provide a more complex, three-dimensional environment that closely mimics human physiology, they can also introduce challenges in terms of scalability. In contrast, simpler monolayer models of cardiomyocytes offer a more accessible and high-throughput approach, allowing for more straightforward analysis. Previous studies on primary BAG3 KO mouse CMs have shown decreased small heat shock protein levels, such as HSPB8, upon BAG3 loss; 11 a result also recapitulated in our system. This highlights the possibility of our cell line assessing differences in the interactome of BAG3. Furthermore, decreased autophagy and mitochondrial health have been reported using murine CMs with homozygous and heterozygous BAG3 KO,34,35 closely resembling the phenotype of the patient-derived iCMs. However, iPSC-derived BAG3KO CMs exhibited disintegration of sarcomeric myofilament structures at baseline, 16 which contrasts with our monolayer findings. This difference may reflect that a more mature system is required for patient-derived models of haploinsufficiency, which better mimic human physiology and phenotype, highlighting the use of matured iCMs for disease modeling.
While our model presents a mature EHT after a ramped electrical stimulation maturation regimen of 4 weeks, this relatively short time poses a limitation to modeling progressive disease. In humans, DCM and associated cardiac fibrosis develop over years to even decades. Future studies can examine the changes in active force production over an extended culture time, as well as examine the development and progression of cardiac fibrosis in vitro. Our platform would also lend itself well to studying various stress responses, as BAG3 is a stress-responsive protein. While it incorporates the ramped electrical stimulation that mimics the mechanical strain associated with continued and increasing heart rate during development, the effects of proteasomal stress, 53 ischemia and reperfusion, 54 heat or fever, and nutrient deprivation 55 can be investigated. Similarly, our model can be used to assess plasma BAG3 levels that have been shown to be increased in heart failure patients.56,57
Another limitation of our study is the use of a single iPSC clone for the corrected pseudo–wild-type line. While this isogenic control shares the same genetic background as the patient line, which allows us to attribute observed differences specifically to the BAG3 mutation, validating these findings across additional corrected clones would strengthen the conclusions.
In conclusion, we highlight the concerted use of iPSCs, CRISPR/Cas9, and tissue engineering to develop a clinically relevant model of BAG3-mediated DCM. This approach positions EHTs as robust platform for further investigation of the disease mechanisms and pharmacological testing, paving the way for personalized medicine and patient-specific therapeutic strategies for genetic diseases.
Supplemental Material
sj-docx-1-tej-10.1177_20417314251371296 – Supplemental material for A patient-specific engineered tissue model of BAG3-mediated cardiomyopathy
Supplemental material, sj-docx-1-tej-10.1177_20417314251371296 for A patient-specific engineered tissue model of BAG3-mediated cardiomyopathy by Margaretha A. J. Morsink, Bryan Z. Wang, Josephine M. Watkins, Richard Z. Zhuang, Xiaokan Zhang, Francois Chesnais, Connie Chen, Roberta I. Lock, Barry M. Fine and Gordana Vunjak-Novakovic in Journal of Tissue Engineering
Footnotes
Acknowledgements
We also gratefully acknowledge the expert support of the core facilities for Confocal Microscopy, Flow Cytometry, and Stem Cells at Columbia University. We thank Dr. Joseph Wu (Stanford University) for his generous sharing of reagents. Graphical figures were created using BioRender.com.
Ethical considerations
No ethical approval was required for this study.
Author contributions
MAJM conceptualized this study. MAJM, BZW, JMW, and XZ designed experiments. MAJM, BZW, JMW, RZZ, FC, CC, and RIL conducted experiments. MAJM analyzed data and wrote the initial draft. MAJM, BZW, JMW, BMF, and GVN edited the manuscript. GVN supervised the study.
Funding
The authors disclosed receipt of the following financial support for the research, authorship, and/or publication of this article: We gratefully acknowledge the funding support of NIH (grants P41EB027062 and R01HL076485 to GVN) and the American Heart Association (Predoctoral Fellowship 1018398 to MAJM; ![]() ).
).
Declaration of conflicting interests
The authors declared no potential conflicts of interest with respect to the research, authorship, and/or publication of this article.
Data availability statement
Supplemental material
Supplemental material for this article is available online.
References
Supplementary Material
Please find the following supplemental material available below.
For Open Access articles published under a Creative Commons License, all supplemental material carries the same license as the article it is associated with.
For non-Open Access articles published, all supplemental material carries a non-exclusive license, and permission requests for re-use of supplemental material or any part of supplemental material shall be sent directly to the copyright owner as specified in the copyright notice associated with the article.