
Abstract
Ameloblastoma is a rare, odontogenic neoplasm with benign histopathology, but extensive, local infiltrative capacity through the bone tissue it originates in. While the mechanisms of ameloblastoma invasion through the bone and bone absorption are largely unknown, recent investigations have indicated a role of the osteoprotegerin/receptor activator of nuclear factor kappa-B ligand regulatory mechanisms. Here, we present results obtained using a novel in vitro organotypic tumour model, which we have developed using tissue engineering techniques. Using this model, we analysed the expression of genes involved in bone turnover and detected a 700-fold increase in receptor activator of nuclear factor kappa-B ligand levels in the co-culture models with ameloblastoma cells cultured with bone cells. The model described here can be used for gene expression studies, as a basis for drug testing or for a more tailored platform for testing of the behaviour of different ameloblastoma tumours in vitro.
Introduction
Ameloblastoma (AM) is a rare benign neoplasm of the jawbones and surrounding tissues that originate from the epithelium of the tooth-forming apparatus. 1 Although benign, it is characterised by locally aggressive behaviour and consequent high rate of recurrences.1,2 The risk of disease recurrence can be minimised by removing the tumour with wide margins of surrounding bone tissue (resection surgery), at the cost of permanent functional and cosmetic consequences. 1 Incomplete removal of the tumour can be life threatening due to disease progression into vital structures of the head and neck, including the brain. 2
Currently, therapeutic agents are not widely used to treat the tumour, with some recent exceptions. 3 Very little is known about the mechanisms controlling AM growth, its interactions with the surrounding cellular and extracellular microenvironment and the associated extensive bone resorption. To this end, a co-culture scaffold has been developed to model the growth of the tumour, which in the future could be used to test tailored therapeutic agents on AM cells. 4 A recent paper revealed a potential molecular background to the location of AM in jawbones and therapeutic targets. 5
Bone formation in vivo is well understood, with the osteoprotegerin (OPG)/receptor activator of nuclear factor kappa-B ligand (RANKL) pathway and bone morphogenic proteins (BMPs) central to it. 6 Some recent molecular investigations and reviews support the osteoclast-upregulating theory that RANKL is responsible for activating osteoclasts and thus triggering bone resorption in both healthy and diseased tissues.6,7 OPG is a decoy receptor for the RANKL, and therefore, an increase in OPG decreases RANKL and nuclear factor kappa-light-chain-enhancer of activated B cells (NF-κB) activity and corresponding bone resorption. 8
The OPG/RANKL pathway has clearly been shown as fundamental in bone remodelling in oral squamous cell carcinoma (OSCC) cases. 9 Genes involved in bone turnover have also been previously implicated in AM, with studies showing increasing or variable levels of RANKL, 10 BMPs 11 and OPG. 12 Therefore, it was decided to further investigate the relationship between AM and genes involved in bone regulation.
Tissue engineering has recently been used for tumour modelling to great effect, both in basic tumour cell research and for testing therapeutic agents.13–15 Constructs created using tissue engineering techniques can be tumour site specific, relatively cheap, used for high-throughput analyses and both refine and reduce the use of animals in research.
This article details a process by which an organotypic co-culture model of AM has been created using tissue engineering techniques. This model was thus used to perform gene expression experiments to further detail the pathways involved in bone turnover in AM tumours, as well as to look at AM growth on a cellular level in these models. This model can further be used for in vitro experiments to detail invasion processes, cell-to-cell behaviour and even screening for therapeutic compounds.
Aim
The aim of this study was to incorporate AM tumour cells into an in vitro, bone-like model and assess the effect of a co-culture environment on AM-1 cells and their expression of genes involved in bone turnover. Furthermore, the interactions of the two cell types in the in vitro model were also assessed.
Materials and methods
Three-dimensional organotypic models
Plastic compressed 16 collagen type I (First Link, UK) gels formed the basis of the three-dimensional (3D) cellularised models. Bone-like scaffolds were constructed from human osteosarcoma (HOS) cell line (ATCC, UK), which were added to neutralised collagen gels at 300,000 cells/mL. Bio-Oss granules (Geistlich, Switzerland) were added to the collagen prior to compression. The Bio-Oss granules are made from decellularised bone and thus provide additional mineral and mechanical cues. The final percentage of these two components in the constructs was approximately 70% collagen and 30% Bio-Oss granules. The bone-like constructs were incubated in mineralising media made from Dulbecco’s modified Eagle’s medium (DMEM; Invitrogen, UK) with 10 nM beta-glycerophosphate, 50 µM ascorbate-2-phosphate and 10 nM dexamethasone (all from Sigma–Aldrich, UK) for up to 14 days.
Analysis of scaffold mineralisation
Scaffold mineral content was measured using Von Kossa histological staining of formalin-fixed paraffin-embedded samples. Briefly, the samples on slides were brought to water, the sections incubated in 0.5% aqueous silver nitrate under ultraviolet (UV) light for 1 h, washed and fixed in 5% sodium thiosulphate. Cell nuclei were counterstained with 1% neutral red solution.
An alkaline phosphatase (ALP) assay SensoLyte pNPP ALP kit (AnaSpec, USA) was used to quantify the production of ALP, which is indicative of mineralisation. The manufacturer’s protocol for ‘tissue extract preparation’ was followed.
AM-1 organotypic co-cultures
AM-1 cells 17 were added to a separate collagen type I gel once the bone part of the model had been cultured for 14 days. The two gels were placed next to each other and combined using an acellular collagen gel as a supporting ‘glue’ layer as visualised in Figure 1, and a further application of compression. The co-culture gels were incubated up to 14 days in keratinocyte serum-free medium (KSFM; Gibco, UK) for cell expansion and scaffold remodelling.

Schematic diagram of the co-culture construct setup. The bone-like construct part was composed of Bio-Oss granules (empty shapes) and HOS cells (black) within a collagen construct, whereas the AM-1 construct was made by incorporating AM-1 cells (grey) within a collagen gel. An acellular support gel was included in order to ensure the co-culture construct joined together. The interface between the two constructs is also indicated.
Cell staining
Live/Dead staining (Life Technologies, UK) with 2 µM Calcein AM as the ‘live’ cytoplasmic stain and 4 µM ethidium homodimer-1 as the nuclear ‘dead’ stain was used to stain all cells in the constructs to ensure they remained alive throughout the culture period.
Cell behaviour and interactions in the scaffolds were analysed using immunofluorescence: bone cells were stained using a mouse anti-osteopontin primary antibody (1:500; Abcam, UK) and Alexa Fluor 488 (1:200; Life Technologies) secondary antibody on methanol-fixed and permeabilised co-cultures. All cell nuclei were stained using the ‘dead’ stain as above and viewed under a Bio-Rad confocal laser-scanning microscope (Bio-Rad, UK).
Cell proliferation
Changes in intracellular adenosine triphosphate (ATP) levels in the co-culture constructs were used to indicate cell proliferation. For this, the CellTiter-Glo luminescent cell proliferation assay (Promega, USA) was used. This assay reagent was specifically developed to be used with 3D cellularised models. The reagent was added in a 1:1 ratio with KSFM to the constructs on a 96-well plate and incubated at room temperature for 30 min to allow for cell lysis and reagent stabilisation. The luminescence signal was then read using a BioTek FLx800 (BioTek, UK) plate reader.
Prior to cell seeding, 3 µM Transwell inserts (Corning, UK) were coated with 70 µL of collagen type I. The wells at the bottom were seeded with HOS cells in a monolayer. Foetal bovine serum (Gibco) was used as a chemoattractant in half of the wells. AM-1 cells seeded on top of the collagen insert were allowed to migrate through for 72 h before cell counting.
Gene expression analysis
RNA was extracted from the collagen gels using a fibrous tissue RNeasy kit (Qiagen, UK), cDNA was synthesised using the high-capacity cDNA-to-RNA kit (Applied Biosystems, UK). Relative mRNA levels were quantified with quantitative real-time polymerase chain reaction (qRT-PCR) using TaqMan gene expression Master Mix and TaqMan gene expression assay primers for RANKL, OPG, tumour necrosis factor-related apoptosis-inducing ligand (TRAIL) and NF-κB (all from Applied Biosystems). Glyceraldehyde 3-phosphate dehydrogenase (GAPDH) mRNA was used as an endogenous control. Values showing a fold change in the mRNA levels compared to day 0 ‘no co-culture’ calibrator sample values were plotted.
Statistical analysis
Graphs were plotted and statistical analysis, analysis of variance (ANOVA) was carried out using GraphPad Prism 6 (GraphPad, USA). The error bars on all graphs indicate the 95% confidence interval. N = 3 unless otherwise stated.
Results and discussions
The decellularised Bio-Oss bone particles provided the HOS-cellularised bone-like constructs with additional mineral, which is visible using Von Kossa staining from day 1 (Figure 2(a)). The cells within the constructs then produced more mineral, as is evident from the increased staining seen in the samples with increasing culture time (Figure 2(b) and (c)). Cellularised collagen gels without the added bone particles are slow to mineralise, with only cell nuclei present early on in culture (Figure 2(d)).
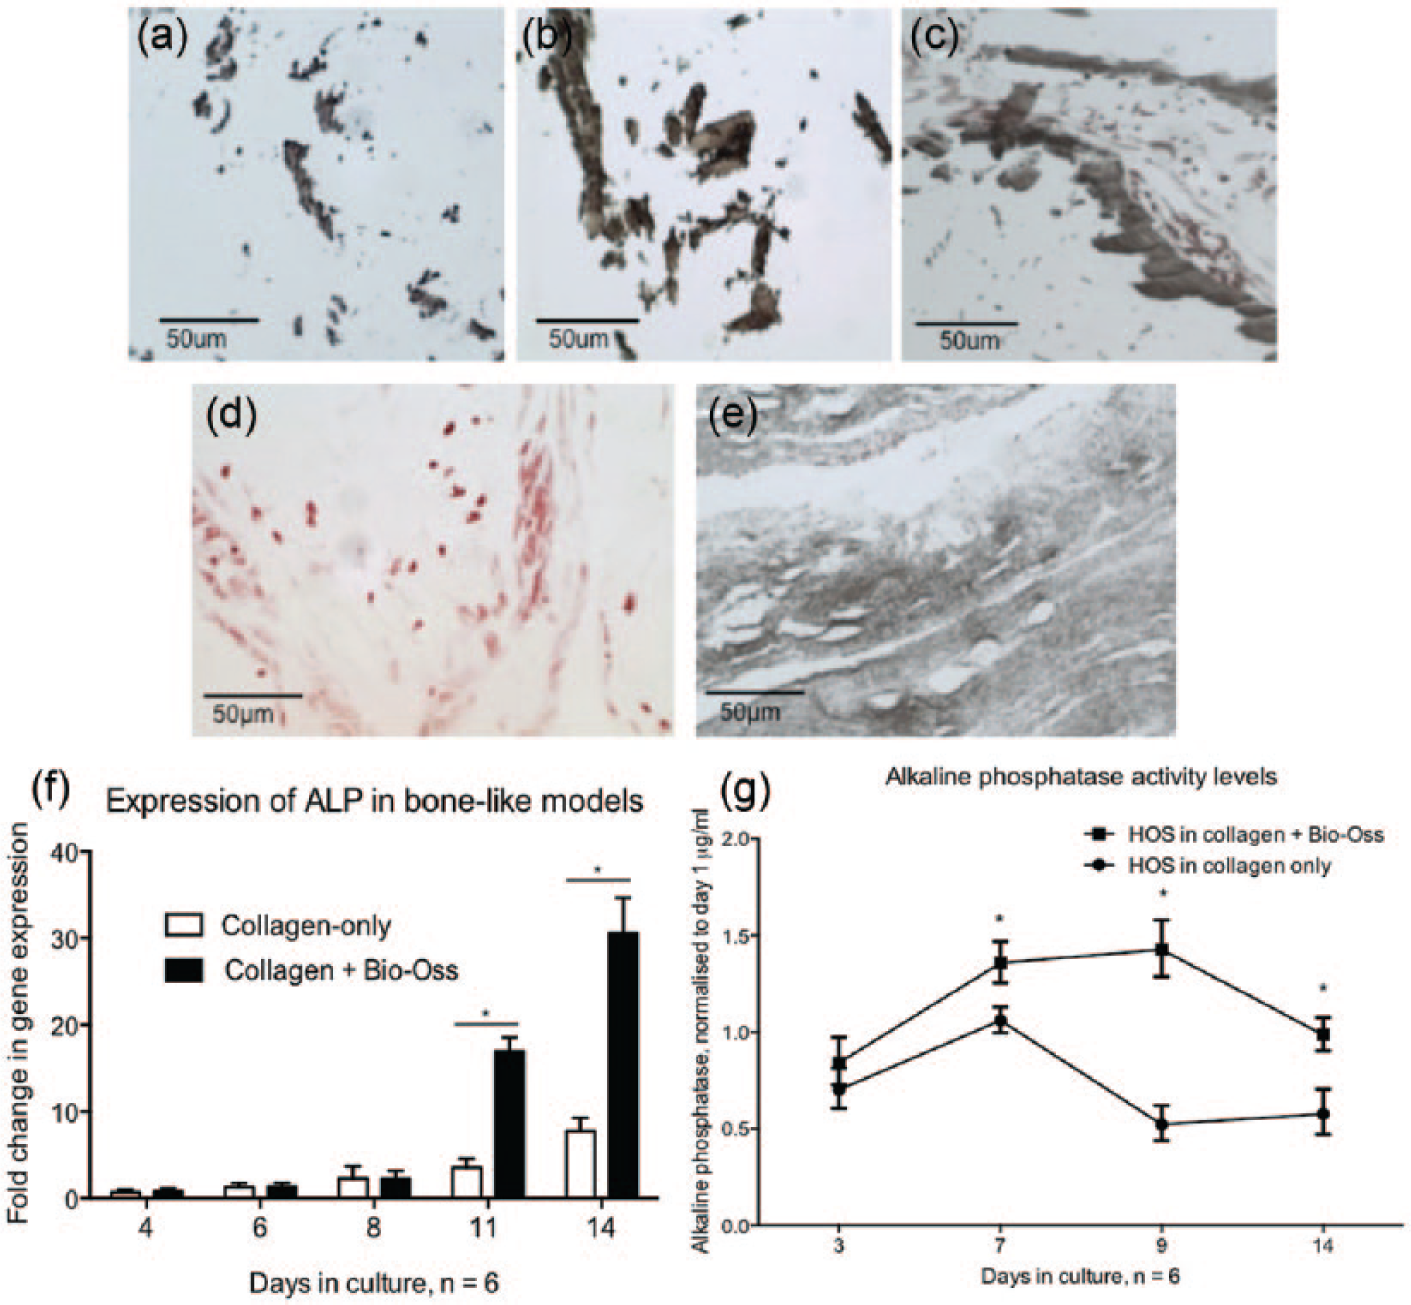
Mineralisation of single-cell-type bone-like collagen and Bio-Oss constructs. In (a)–(e), the mineral within the scaffolds was stained dark brown and cell nuclei were counterstained red. (a) HOS + Bio-Oss gel on day 1 stained for mineral using the Von Kossa histological stain, as expected with the addition of the bone particles. (b) Mineral in constructs appeared increased by day 7 in culture. (c) A further increase in staining is seen by day 14 in the HOS + Bio-Oss gels. (d) A HOS-only collagen gel is shown, where cell nuclei are clearly visible on day 7 of culture, but no staining for minerals present. (e) However, abundant Von Kossa staining for minerals in the construct is apparent by 35 days in culture, with the entire constructs appearing mineralised. (f) Expression of alkaline phosphatase mRNA levels in the constructs increases in the HOS + Bio-Oss constructs with increasing culture time, whereas a slower increase was seen in collagen-only HOS-cellularised constructs, indicating slower construct mineralisation. (g) Alkaline phosphatase activity levels as measured using a colorimetric, quantifiable assay showed a larger increase in the constructs with added Bio-Oss than in the collagen-only constructs. Scale bars from (a)–(e) = 50 µm. An asterisk (*) indicates statistically significant results, p < 0.05.
The addition of Bio-Oss bone particles provided the constructs with minerals, as well as a bone-like microstructure with pores and an improved bone-like mechanical environment.18–20 As the final ratio of particles used was 70% collagen to 30% Bio-Oss, we were still able to examine the constructs using light and fluorescence microscopy to provide indications of cell health, migration, interactions and invasion.
ALP activity was used as a measure of bone formation and an indicator of the presence of osteoblasts in the single-cell-type bone-like constructs to ensure an organotypic environment prior to the addition of AM-1 cells.
The levels of ALP increased in the constructs during the first week when measured using a quantitative protein-based assay (Figure 2(g)). This indicated the presence of active osteoblasts in the constructs. After the first week, the level of ALP plateaus gradually declines, which is due to cells in the constructs reaching confluence, hypoxia-caused cell death in parts of the construct or cells migrating deep inside these particles and thus not included in the analysis. Using gene expression data, we were able to show an increase in ALP mRNA levels in the constructs throughout the culture period of 14 days (Figure 2(f)).
Similar to another study on a comparable bone-like tissue engineered construct, we found that bone cells are able to mineralise a plastic compressed collagen scaffold on their own in long-term culture. 21 Our results show that cultures go on to mineralise the construct by day 35 (Figure 2(e)), which indicated there were viable, active osteoblasts present in the constructs. However, as this was the first step in a long co-culture model synthesis, the addition of bone mineral to the scaffolds was deemed a suitable step to accelerate the process.
Based on this data, subsequent experiments with the bone-like scaffold alone were limited to 14 days and the co-culture models were set up at this point.
Cells in the bone-like scaffold proliferate at a higher rate during the first week in culture, after which proliferation plateaus off (Figure 3(a)). This may be due to the cells reaching confluence earlier within the constructs, difficulty with reagent penetration to cells which may have migrated to within the Bio-Oss particles or cell death caused by nutrient deficiencies deeper inside the constructs.

Cell proliferation as measured using the CellTiter-Glo ATP assay during 14 days in co-culture scaffolds in (a) HOS cells and (b) AM-1 cells. Cell numbers were normalised to values obtained on day 0 of co-culture to show co-culture proliferation levels. An increase is seen in both cell types. The rate of proliferation appears to slow down in HOS cells after the first week in co-culture, and the subsequent differences are not statistically significant. (c)–(f) Composite images of typical Live (green)/Dead (red) staining of both cell types in the scaffolds (40× magnification). (c) HOS day 7. (d) Day 14. All HOS cells appear alive on day 7 of culture, and only a few dead cells were seen in the constructs on day 14, by which point the collagen models were approaching confluency. AM-1 cells exhibit a characteristic clustering behaviour, with the size of these clusters with increasing time in culture. (e) AM-1 cells in clusters on day 7. (f) AM-1 on day 14.
AM-1 cells within the collagen constructs have a slower initial proliferation rate, but adhere to an exponential rate of proliferation as expected (Figure 3(b)). Both cell types proliferate and survive within the co-culture constructs during the 14-day culture time. Cell survival was measured both quantitatively by measuring the intracellular ATP content (Figures 3(a) and 2(b)) and qualitatively using Live/Dead staining (Figure 3(c)–(f)). Both these assays showed that the cells were viable in the co-culture scaffolds and proliferating.
The interface between the two cellularised gels was examined using confocal microscopy. The white dotted line (Figure 4(a) and (b)) roughly indicates where the two different gels meet in the co-cultures, with the AM part above the line and the bone part below. In all gels examined, HOS cells were aligned in the direction of the gel edge day 7 (Figure 4(a)). Here, a cluster of AM-1 cells are visible close by. By day 14 (Figure 4(b)), AM-1 cells in some, but not all, samples had migrated through to the bone part of the scaffold; invasion in these gels was difficult to quantify.

The interface region of the co-culture models and invasion as examined using immunocytochemistry and Transwell inserts. (a, b) The HOS cells were stained for the osteoblast marker OPN (green). Both HOS and AM-1 cells were counterstained with nuclear EthD1 (red). AM-1 cells (white arrows) were seen in clusters close to the interface). The white line indicates the two different constructs’ interface in the co-cultures. (a) In the first week of culture, HOS cells (lower half of the image) line up along the gel interface. (b) During the second week, the two cell types were seen in close proximity at the gel interface. (c) Quantification of cell migration to the other cell type through Transwell inserts. No significant differences were found in wells with or without added chemoattractant when AM-1 cell migration was measured. There is, however, a difference between wells where a HOS monolayer was used on the bottom of the inserts (first and second columns) and where no cells were used (third column; p < 0.05), indicating that AM-1 cell migration is caused by the presence of bone cells in the wells.
Migration of AM-1 cells to the bone-like part of the construct was quantified using Transwell inserts (Figure 4(c)). Approximately 10% of AM-1 cells seeded onto the top of a Transwell insert migrated through the collagen gel and porous membrane without chemoattractant (Figure 4(c)). There was no significant difference in AM-1 cell numbers migrated through Transwell inserts towards a HOS monolayer with or without a chemoattractant. However, as very little migration was seen when HOS cells were omitted, there was a significant difference in AM-1 migration with and without HOS cells. These results indicated that the presence of bone cells at the bottom of the inserts was required for AM-1 cell migration. However, in both cases only a small number of cells migrated, which is consistent with the slow invasion of AM tumour cells in vivo. 22
To further examine the behaviour of AM cells in the scaffolds and assess the interactions between the tumour and the bone cells, gene expression analysis was carried out on selected genes, which have previously been found to be important in AM bone turnover regulation in tumours.
RANKL and OPG are, as discussed above, integral to bone turnover regulation in both healthy and diseased bones. Previous studies have shown variable levels of the protein products of these genes in a variety of AM tumours.10,23 These genes were chosen as examples in order to probe the organotypic environment in which the AM cells are seeded in and proliferated in.
An approximately 700-fold increase in RANKL expression in the AM co-culture models was seen (Figure 5(a)) when compared with single-cell-type cultures. This increase was seen in both the bone part of the model, with a gradual increase in the interface part of the two different gels. The level of RANKL in the AM-1 part of the co-culture construct was constant throughout the first 11 days of culture, rising significantly to around a 600-fold increase by 2 weeks of culture (p < 0.05). This indicates that the presence of bone cells in the co-culture model caused AM-1 cells to increase RANKL to potentially upregulate bone resorption and to enable the tumour to further grow into the bone-like tissue. However, this model would further benefit from a co-culture with a non-cancerous bone cell line, as this unexpectedly large increase in RANKL levels may have been caused by the cancerous properties of the HOS cells in the co-cultures.

Gene expression of the bone regulating genes RANKL, OPG and NF-κB in co-culture models. (a) Gene expression of RANKL increased significantly over the culture time in the bone part of the co-culture models. There was also an increase in the interface part of the models, whereas the levels stay relatively constant in both the AM-1 part of the models as well as the bone-like construct alone. (b) OPG expression in the co-culture models did not vary significantly for the first 10 days in culture. However, there is a significant downregulation of OPG in the bone part of the co-culture scaffolds by day 14 of co-culture. (c) NF-κB expression is slightly upregulated in the bone part of the scaffolds and downregulated in the AM-1 part of the scaffolds for the first 10 days in co-culture. However, by day 14, there is a significant downregulation of NF-κB also in the bone part of the scaffolds. As no such change is seen in the bone-only control, this change is due to the presence of AM-1 cells in the model. HOS ctrl – HOS cells only in a single-cell-type culture gel. IF – interface region between the bone and AM-1 parts of the co-culture gels. Two-way ANOVA comparing the co-cultures to the corresponding parts of the single-cell culture constructs. ***p < 0.001; ****p < 0.0001; (a, b) N = 6; (c) N = 3.
OPG gene expression levels remained approximately constant throughout the culture time (Figure 5(b)). By day 14, however, there is a significant downregulation of OPG in the bone part of the model (p < 0.05). This downregulation of OPG would further increase the rate of bone resorption in an in vivo tumour; as discussed before, OPG is a decoy RANKL receptor and an increase in OPG reduces bone resorption. OPG expression in AM tumours and RANKL expression have been detected in all ex vivo tumours examined.12,23 RANKL has been shown upregulated in OSCC, and OPG expression has also been shown dysregulated in OSCC.9,24
As NF-κB is a downstream factor of RANKL, the gene expression of NF-κB was also examined. NF-κB levels in the models remained constant for the first 10 days in culture (Figure 5(c)). By day 14, there was a significant downregulation of NF-κB seen in the bone part of the co-culture model (p < 0.05). This was due to the presence of AM-1 cells in the co-culture, as no such increase was seen in the bone-only controls. Immunohistochemical analysis into NF-κB in AM tumours has shown a lower expression of this gene in ex vivo tumours.12,25
Protein patched homolog 1 (PTCH1), which is a member of the sonic hedgehog (SHH) pathway and is often implicated in AM tumours, increased steadily throughout the culture time in all parts of the construct, but were not found statistically significant when compared to controls (data not shown).
Further work to improve the model includes using osteoblasts from a non-cancerous cell line to improve the co-culture models and to validate results shown here. A further study, such as that by Sandra et al., 26 using an osteoclast model, could be carried out to assess whether this change in gene expression translates to an increase in the bone-invading capacity of the tumour cells.
Additionally, it would be interesting to incorporate AM cells from other cells lines or ex vivo tumours in the model to assess their growth and invasion in this organotypic environment. Recent studies have indicated BRAF V600E and other epidermal growth factor receptor (EGFR) pathway genes5,27 – these would be interesting to investigate in our model to further characterise these tumours. This way, therapeutic compounds could also be tested and tailored to patient needs prior to clinical use.
Conclusion
We describe a process by which we have developed an in vitro cellularised, organotypic model of AM. Collagen, as used as the basis for this model, is an abundant extracellular matrix protein throughout the body, including bone, and has previously been used for similar bone scaffolds. 28 This bone-like model enables close characterisation of the AM tumour pathogenesis, growth and gene expression, as presented here. AM cells in the scaffolds provided an organotypic model for the tumour in an in vitro setting and exhibited characteristics typical of this tumour.
The results shown here provide indications towards the bone absorption mechanism of AM as we have shown a large increase in the osteoclast-activating gene RANKL in the AM co-cultures, both in the HOS part of the co-cultures and the AM-1 part. This was due to the presence of HOS cells in the co-cultures, which appeared to increase RANKL expression in AM-1 cells, but further studies are needed to pin-point a specific mechanism. Additionally, this model was used for analysing the levels of other genes in the co-cultures, which have been implicated either in AMs or in other similar tumours.
This model can also be used as a supplementary method for high-throughput screening of potential therapeutic agents prior to clinical studies, and the model could pave way for further treatments as it can easily be adapted for screening of various therapeutic compounds. The cells in the model are in a tissue-like state and the therapeutic agents used would, therefore, have a tissue-like effect on the cells.
Furthermore, AM behaviour with other cells in the surrounding native environment, such as fibroblasts, could be studied, as well as the tumours’ invasive behaviour towards these cells and tissues. This model can also be easily adapted for use with other oral tumours, such as OSCC, to provide an organotypic growth environment and easy examination of these tumours.
Footnotes
Acknowledgements
The authors are grateful to Prof. Hidemitsu Harada (Iwate Medical University, Japan), who donated the AM-1 cell line for use in this project. They also thank the Blizard Core Pathology laboratory staff (Queen Mary University London) for preparation of histology specimens.
Declaration of conflicting interests
The author(s) declared no potential conflicts of interest with respect to the research, authorship and/or publication of this article.
Funding
The author(s) disclosed receipt of the following financial support for the research, authorship, and/or publication of this article: Funding for this project was provided by the Biss-Davies charitable trust and UCL Development Office.