
Abstract
Happy and sad moods promote global and local visual processing, respectively. However, it is unclear whether mood also affects the processing level in haptics. Here, we used classical music to induce happy and sad moods in blindfolded participants before they scanned printed, flat 2D embossed configurations with their fingers. We also included a neutral group that did not listen to any music. Global shapes were triangles, circles, or squares (33 mm) composed of smaller local relief shapes (3 mm): either triangles, circles, or squares. Participants explored a probe stimulus with identical local and global shapes, and two comparison stimuli, matching the probe in local or global shape. They reported which comparison stimulus appeared more similar to the probe. In the “sad” group, participants chose the locally matching comparison more frequently than in the “happy” and “neutral” groups, suggesting that unpleasant mood can influence spatial preferences in haptic shape matching. Overall, participants tended to prefer global matches, indicating that under these specific conditions, global-level information may be relatively more prominent in touch.
How to cite this article
Cavdan, M., Kapucu, A., Doerschner, K., & Drewing, K. (2025). Unpleasant mood is linked to local processing in haptics. i-Perception, 16(6), 1–14. https://doi.org/10.1177/20416695251403885
Introduction
Feelings are associated with differences in how we perceive and interact with the world. Mood has been linked to cognitive processes and social behavior, for example, happy feelings are associated with greater reliance on accessible general information such as stereotypes (Isen et al., 1992; Isen & Daubman, 1984) and scripts (Bless et al., 1996) while sad feelings have been associated with focusing on details, avoiding stereotypes, which often leads to an improved accuracy of judgments (Bodenhausen et al., 1994). One explanation for this shift of focus is offered by the affect-as-information hypothesis (Clore, 1992; Clore & Palmer, 2009; Schwarz & Clore, 1983). According to this theory, mood is a signal that can be used to guide behavior: happy mood signals a low-threat situation that affords global processing, whereas sad mood may signal that a situation is potentially threatening and therefore requires more detailed processing. An alternative explanation for the association between mood and level of processing—that is, whether attention is directed toward the overall/global configuration or toward specific/local elements—suggests that motivation may act as a mediator. According to this idea, detailed processing is effortful and may result in a reduction of mood (Clore et al., 2001). Consequently, when happy, people may be less motivated to perform effortful, detailed processing, in order to maintain their positive mood.
Interestingly, this shift from general, global to detailed, local processing as the mood shifts from happy to sad, has not only been observed in social and cognitive studies (Clore & Palmer, 2009) but also emerges robustly in visual shape perception (Bless et al., 1996; Gasper, 2004; Gasper & Clore, 2002; see Stefanucci et al., 2011 for a review). For example, in an experiment by Gasper and Clore (Gasper & Clore, 2002), “happy” and “sad” participants indicated the similarity of a given shape (triangle or square) that consisted of local elements (triangle or square, also see Kimchi & Palmer, 1982) to two figures that either matched the global or the local shape of the stimulus. Their results showed that individuals in the sad mood condition more often classified shapes based on local features compared to “happy.” In line with this, Curby et al. (2011) showed that negative mood decreased the holistic processing of faces. The attentional narrowing of attention when mood is low (Derryberry & Tucker, 1994; Easterbrook, 1959; Fredrickson, 1998; Gasper, 2004; Hartikainen et al., 2010; Von Mühlenen et al., 2018) is interesting, as it appears to “override” the default holistic processing in visual shape and scene perception (Navon, 1977; Schyns & Oliva, 1994).
Whether mood exerts a similar influence in other sensory modalities, such as touch, is less clear. This question is particularly intriguing because, unlike vision, the haptic modality appears to not show a natural preference for global structure (global precedence in Navon, 1977); instead, it seems to prioritize local features. For instance, seminal work by Lakatos and Marks (1999) has shown that individuals were more accurate and faster in identifying shapes through local cues than by identifying them according to their overall configuration, suggesting that local features are more salient or accessible through touch. Similarly, Heller and Clyburn (1993) found a general tendency toward local responses in haptic experiments; however, with an overall mixed pattern of global and local processing. More recently, Tortelli et al. (2023) explored the development of local–global preference across vision and haptics. Their results revealed that while visual processing shifts from a local to global preference with age, haptic processing maintains a stronger bias towards local features throughout development. Taken together, this evidence points to the idea that, unlike vision, haptic perception may inherently favor local information. And this preference may be potentially due to the sequential and exploratory nature of touch (Klatzky et al., 1985). At the same time, however, this local bias may not be fixed and may vary depending on specific stimulus parameters such as the size of the global forms (Kinchla & Wolfe, 1979; Tortelli et al., 2023), local forms and their spatial density (Blanca & López-Montiel, 2009; Kinchla & Wolfe, 1979; Tortelli et al., 2023), as well as the properties of the whole spatial arrangement (Pinna et al., 2025). Evidently, the “local bias” in haptic shape processing is not yet fully understood, and further research is needed in order to better understand what factors contribute to local and global shape processing in touch.
Given the robust effects of mood on visual processing style (local/global), and the just-mentioned local–global modulations of haptic perception, an important question yet to be answered is whether mood also modulates local and global processing in haptics. Specifically, does happy mood facilitate more global haptic processing, while sad mood enhances attention to local features? To address these questions, we investigated how positive and negative mood influences the level of haptic shape processing. Upon mood induction, blindfolded participants scanned a haptic shape stimulus with their fingers and indicated which of the two comparison stimuli was more similar to the probe. The probe always matched both global and local structure—for instance, a large triangle (33 mm) composed of small triangles (3 mm). Each comparison stimulus matched the probe at only one level: either the global or local shape. A neutral condition with no mood induction (i.e., no music) was included to assess baseline haptic processing. Our working hypothesis was that happy mood would promote global processing (i.e., preference for matching based on the overall configuration) while sad mood would promote a focus on local shape features (i.e., the small constituent elements). Our results demonstrate that mood-induced changes in spatial focus extend to haptic perception, supporting the idea that affective states affect perceptual processing beyond the visual domain.
Methods
Participants
The required sample size was calculated based on a large effect (Cohen's d = 0.8), a power of 80%, and an alpha 5%. The projected sample size was 42 for one-tailed between-subjects t-test (G*Power; Faul et al., 2007). Accordingly, 42 participants (nine males, Mage = 22.8, age range: 18–30) were randomly assigned to one of the two mood conditions (happy or sad). An additional 21 participants were recruited to the control condition (seven males, Mage = 24.14, age range: 20–34). Eligibility criteria for the study required that participants have no diagnosed mental disorders, as such conditions might influence processing levels (De Fockert & Cooper, 2014) and introduce potential confounds in the experiment. They were recruited through the university email system and compensated with 8€/hr or course credit. None of the participants reported sensory, motor, or cutaneous impairments. The two-point discrimination threshold at the index finger of the dominant hand was 3 mm or better. None of the participants gave a wrong response for distances above 2 mm (see Procedure for details). The study was ethically approved by a local ethics committee, LEK FB06 (2017-0034), in accordance with the Declaration of Helsinki (“World Medical Association Declaration of Helsinki,” 2013), excluding the preregistration. Informed consents were obtained prior to the experiment.
Stimuli and Materials
Pilot experiment for haptic stimuli design. To determine the suitable local shape sizes that would balance haptic recognizability with the goal of fostering global processing, we conducted a pilot experiment. Previous research has shown that the haptic system tends to weigh local shape features more heavily than global features, particularly when local shapes are large, such as a 100 cm3 cube (Lakatos & Marks, 1999). This creates a risk of ceiling effects, which could obscure any mood-related influence on processing style. To mitigate this, we sought a local shape size that would reduce feature saliency without making identification impossible.
Haptic stimuli were modeled using the OpenSCAD software and printed (Objet30Pro, Stratasys Ltd., United States) with model photopolymer material (VeroClear) at a resolution of 600 × 600 × 1.600 dpi (x-, y-, and z-axes, respectively). In a pilot experiment, we investigated the detection thresholds of a small triangle, a circle, and a square in order to determine the shape size that would allow us to reduce the natural saliency of the local features relative to the global ones in the main experiment. Stimuli were two-dimensional (2D) embossed triangles, squares, and circles ranging from 1 mm to 10 mm (size: diameter of a circle, one side of a square, and triangle base; shapes embossed with a height of 1 mm on a 112 mm × 65 mm plane plate). 20 blindfolded participants (three males, Mage = 23.2, SDage = 2.44) were asked to touch each shape with their index finger using lateral motion (Lederman & Klatzky, 1987). Upon exploration, they named the shape they perceived. The order of the shapes and sizes was randomized.
From this data, for each shape, we identified the shape recognition threshold—the smallest size at which participants correctly identified the shape with at least 75% accuracy. Based on this, the average recognition thresholds were: square = 3.05, cylinder = 2.95, triangle = 3.05 mm. These values indicated that 3 mm was the smallest size at which the majority of the participants could reliably identify all three shapes. Accordingly, we adopted 3 mm as the standardized local shape for all stimuli in the main experiment.
Main experiment haptic stimuli. Nine Navon-like stimuli consisting of local and global features modeled using OpenSCAD software and printed at a high resolution, as in the pilot experiment. The stimuli were mounted on a plate which has three gaps. This ensured that the stimuli remained fixed on the table during the exploration. Local shape sizes were 3 mm (in both x- and y-dimensions). For the polygonal stimuli (triangle and square), each side contained seven local elements, producing six uniform gaps with a fixed edge-to-edge spacing of 2 mm (i.e., 5 mm center-to-center). For the circular stimulus, the number of local elements (18) was chosen so that the arc distance between adjacent items matched this same 5 mm center-to-center spacing, ensuring equivalent contour sampling across all global shapes. All global shapes occupied approximately the same overall spatial area (roughly 30 × 30 mm), ensuring that differences in global geometry did not introduce disparities.
The shapes consisted of a circle of circles, a triangle of triangles, and a square of squares as probes, while comparison stimuli were a circle of triangles, a square of triangles, a triangle of squares, a circle of squares, a square of circles, and a triangle of circles.
Triadic design. The stimuli were combined with each other to make triads (six triads in total). Each triad consisted of one probe (i.e., standard) and two comparison stimuli (see Figure 1 for an example). Probes had the same global and local shapes, such as square of squares. Comparison stimuli, on the other hand, matched either local or global shape of the probe, such as a square of circles (global match) and a circle of squares (local match).

Illustration of an example triad and the plate used in the experiment. Probe: square of squares, global match: circle of squares, local match: squares of circle. The three squares on which the stimuli are placed illustrate the layout of the plate.
Mood induction stimuli. Classical music pieces from Ackerley et al. (2017) were tested in a pilot experiment in order to affirm their effectiveness in our population. 1 The pieces that evoked strongest happiness and sadness were selected for mood induction in the current study. Kol Nidrei by Max Bruch (1838–1920) and Carmen Suite Nr. 1: Les Toréadors by Georges Bizet (1838–1875) were used to induce sad and happy moods, respectively.
Manipulation check. Mood induction via music listening is a well-established paradigm in psychology research (Ackerley et al., 2017; Khalfa et al., 2005; Mitterschiffthaler et al., 2007; Taruffi et al., 2017). In order to measure the efficacy of mood induction, two different scales were used before and after the mood induction: the Self-Assessment Manikin (SAM; Bradley & Lang, 1994) and the Differential Emotion Scale (DES; Izard, 1977; Renaud & Unz, 2006). The SAM measured participants’ valence and arousal levels on a 9-point pictorial depiction (valence: 1 = very negative to 9 = very positive; arousal: 1 = very calm to 9 = very excited). Participants were asked to rate the SAM based on their emotional state. The DES is widely used in psychological research and is a reliable method to assess emotions. It consists of several subscales with various adjectives. We selected the sadness and happiness subscales with their corresponding three adjectives per subscale; happiness: happy, joyful, amused; sadness: sad, downhearted, and blue (happiness: glücklich, freudvoll, erfreut; sadness: traurig, niedergeschlagen, betrübt, respectively in German). The adjectives were presented with a 9-point scale (0: not at all, 8: extremely). Participants rated these adjectives based on how much they felt each emotion.
Procedure
A between-subjects design with two moods—happy and sad—and a neutral condition (no mood manipulation) was used. Participants were randomly assigned to the happy, the sad mood, or neutral conditions. Upon arrival at the lab, participants received information about the experiment and signed informed consent. To minimize potential demand characteristics, participants were informed that they would complete multiple unrelated tasks, so that they would not perceive the tasks as connected. This was followed by a two-point touch discrimination threshold test to screen for any tactile deficiencies (Johnson & Phillips, 1981). A two-point discrimination was conducted using a discriminator consisting of two plastic disks with rounded-tip patterns. The patterns included a single tip and paired tips with intertip distances ranging from 2 to 8 mm. For our purposes, only a single-tip and two-tip patterns with distances ranging from 2 to 4 mm were used, as a discrimination threshold of 4 mm or better was desired. Each pattern was applied three times in a random order, and participants were asked to indicate whether they felt one or two points.
Next, participants completed mood assessments using SAM and DES, presented on a monitor screen. Responses were recorded using a numpad, and the presentation order of the questionnaires was randomized. Participants in the happy and sad conditions then listened to a classical music piece corresponding to their assigned mood. No music was played in the neutral condition. Following the music, participants in the mood induction conditions completed the SAM and DES questionnaires a second time. All participants then performed the Kimchi–Palmer task (Kimchi & Palmer, 1982), as described next. In the neutral condition, participants completed the SAM and DES questionnaires a second time after approximately 15–20 min had passed.
In the Kimchi–Palmer task (Kimchi & Palmer, 1982), on each trial, a probe (i.e., same global and local shape) was always presented in the first gap of the mounted plate (Figure 1). The two comparison shapes (one matching the global shape of the probe and the other matching the local shape) were presented in the next two gaps of the mounted plate. Participant's task was to indicate which of the two comparison stimuli was more similar to the probe. The presentation order of the second and third gaps was counterbalanced. For each trial, blindfolded participants were asked to explore each stimulus in the triad sequentially (from the first gap to the third) using lateral movements with the index finger of the dominant hand, as is common in similar haptic perception studies (Drewing & Lezkan, 2021; Vardar et al., 2019). This was also the finger on which we measured two-point discrimination threshold. Participants were allowed to explore the probe and comparison stimuli at their own pace and could re-explore as needed before responding. No time limits were imposed, in line with previous work (Heller & Clyburn, 1993; Navon, 1977), where naturalistic exploration is essential.
Each of the six triads was repeated six times, which resulted in 36 trials in total. The overall procedure lasted 30–45 min in happy and sad music conditions, while it lasted 20–30 min in the neutral condition. Following completion of all tasks, participants were debriefed, and none of those in the mood induction conditions reported believing that the tasks were related.
Data Analysis
All analyses were conducted in SPSS 25 software (SPSS Inc.), and figures are plotted in MATLAB R2022b (MathWorks Inc.).
Cronbach's alpha was calculated to assess the reliability of happiness and sadness subscales (DES) separately for the pre- and post-induction in happy and sad conditions, and for the pre- and post-Kimchi–Palmer task phases in the neutral condition. All eight analyses showed good to excellent consistency (Cronbach's α = .70–.96), allowing for averaging across adjectives. Next, we calculated the average values across the three adjectives per mood (i.e., happiness: happy, joy, and amused; sadness: sad, downhearted, and blue) for the ANOVAs. To assess the effectiveness of the mood induction, we conducted four 2 (condition: happy and sad) × 2 (time point: pre- and post-induction) mixed-design ANOVAs, one for each dependent variable: DES sadness, DES happiness, SAM valence, and SAM arousal. Additionally, to ensure that participants in different mood conditions began the experiment with comparable baseline affective states, we conducted four one-way between-subjects ANOVAs. Specifically, because only the happy and sad conditions involved a mood induction, we analyzed participants’ pre-induction affect ratings separately for the three groups (happy, sad, and neutral). The goal was to verify that there were no significant differences between groups before the mood induction took place. Four one-way ANOVAs were conducted, each with condition (happy, sad, and neutral) as the factor, separately for arousal, valence, DES happiness, and DES sadness.
For the Kimchi–Palmer task, the frequency of selecting the local comparison shape over the global one was calculated from the raw data of each participant. From this data, the proportion of local judgments across all trials was calculated per participant, followed by an arcsine square root transformation prior to the statistical analyses (Cohen et al., 2013). This transformation allowed the data to meet the assumptions required for parametric tests. All statistical analyses related to the effect of condition on level of processing were conducted on the transformed data. The effect of condition (i.e., happy, sad, and neutral) on the level of processing was examined with a one-way between-subjects ANOVA. This was followed by Bonferroni-corrected multiple comparisons to further investigate group differences (e.g., happy vs. neutral). Greenhouse–Geisser correction was applied when the sphericity assumption was violated.
Results
Mood Manipulation Check
First of all, we tested the efficacy of mood induction using 4 mixed-design ANOVAs examining the effects of music piece (levels: happy and sad) and time point (levels: pre-induction and post-induction) on mean ratings for SAM valence, SAM arousal, DES happiness, and DES sadness (see Table 1 for the summary of the results).
Means (with standard deviations) for SAM valence and arousal and DES Happiness and Sadness for Happy and Sad moods before and after mood induction.

Note. Bold values in the post-test indicate the effect is in the expected direction. The symbol * indicates the effect was statistically significant. SAM = Self-Assessment Manikin; DES = Differential Emotion Scale.
Additionally, we tested whether the individuals in all conditions had a comparable baseline (i.e., before mood induction) mood with one-way ANOVA on SAM valence, SAM arousal, and DES happiness and sadness subscales. We expected all conditions to have a comparable baseline.
SAM. As expected, listening to the happy music piece led to more positive valence ratings, while listening to the sad music piece decreased it: The interaction between time and mood was statistically significant, F(1, 40) = 8.94, p < .01, η2p = .18, while the main effects of mood and time point were not statistically significant for valence, F(1, 40) = 2.21, p = .15, η2p = .05, F(1, 40) = .17, p = .90, η2p = 00, respectively. However, follow-up analyses showed that, in the happy mood condition, participants were more positive in the post-test compared to the pre-test, t(20) = −2.33, p = .015 (one-tailed). Also expectedly, after listening to the sad music piece, participants reported being in a more negative mood than during the pre-test phase, t(20) = 1.98, p = .03 (one-tailed; Figure 2).
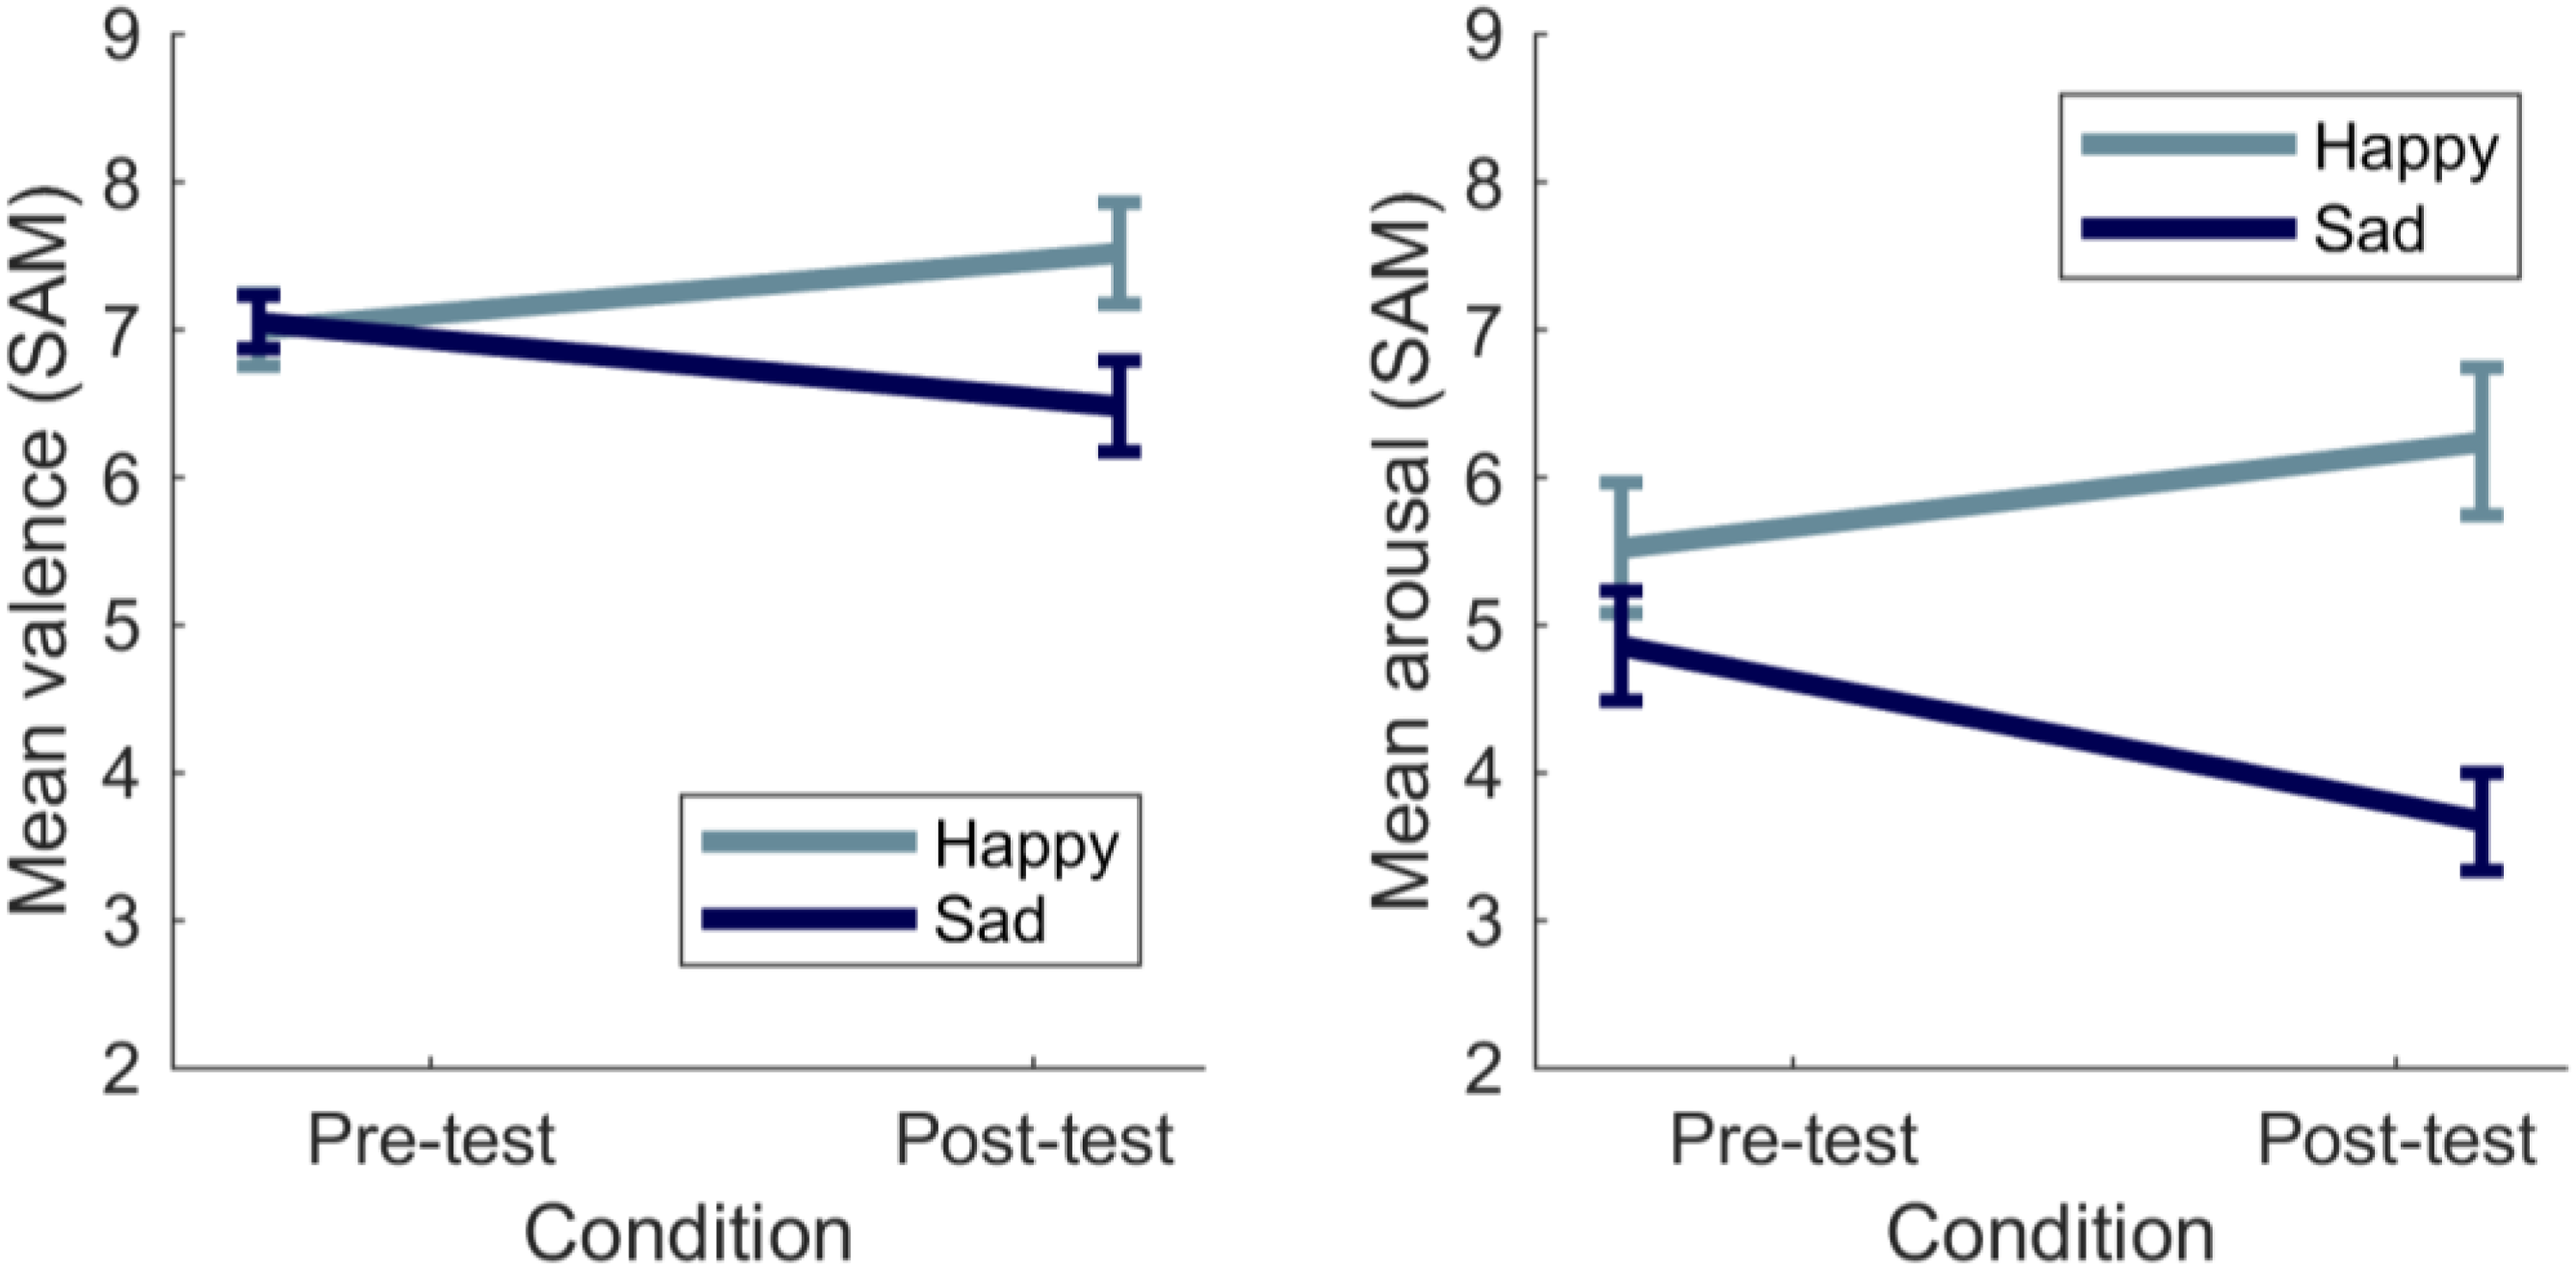
Mean valence (left panel) and arousal (right panel) during pre-test and post-test for happy and sad mood induction conditions. Error bars correspond to one standard error of the mean.
The sad music piece decreased
Finally and expectedly, there was no difference in baseline valence, F(2, 60) = .54, p = .54, η2p = .01 or arousal, F(2, 60) = 2.31, p = .11, η2p = .07 across conditions.
DES. Participants in the happy mood were happier upon mood induction. However, participants in the sad mood condition did not feel significantly sadder after manipulation which will be discussed further (Table 1).
For the happiness subscale, neither the main effect of time point, F(1, 40) = .28, η2p = .01, nor the main effect of mood, F(1, 40) = 2.34, η2p = .06, were statistically significant. However, the interaction between time point and mood was statistically significant F(1, 40) = 11.04, p < .01, η2p = .06. In the happy mood condition happiness increased between pre- and post-test, whereas in the sad mood condition happiness decreased between pre- and post-test: t(20) = −3.11, p < .01, t(20) = 1.78, p < .05 (both one-tailed).
For the sadness subscale, although people in the sad mood felt less happy and more sad, this did not reach significance: the main effect of time point: F(1, 40) = .01, η2p = .00, mood: F(1, 40) = .00, η2p = .00 and their interaction: F(1, 40) = 1.74, η2p = .04 (all ps > .05) were not statistically significant.
Additionally, individuals had comparable baseline happiness, F(2, 60) = .30, p = .75, η2p = .01, and sadness, F(2, 60) = .15, p = .86, η2p = .01 levels.
Global and Local Processing
A one-way between-subjects ANOVA showed a significant main effect of condition: F(2, 62) = 9.40, p < .001, η2p = .24. This was followed by Bonferroni-corrected post hoc comparisons across conditions. Specifically, local judgments suggesting local processing were significantly less frequent upon mood induction in the happy condition than the sad condition (Mdiff = −.157, SE = .060, p = .035, Figure 3). The neutral condition (M = .142, SE = .127) yielded similar local judgment frequencies as the happy condition (Mdiff = .103, SE = .060, p = .281). However, it resulted in significantly less frequent local judgments than the sad condition (Mdiff = .259, SE = .060, p < .001). Overall, the global match was selected six times more often than the local one (Figure 3).

Mean frequency of choosing local match. Error bars correspond to one standard error of the mean.
Next, we tested whether there was an effect of global–local shape combination in the level of processing. To this end, we conducted a repeated-measures ANOVA with the variable shape triad (6 levels). The main effect of shape triad was not statistically significant, F(4.36, 270.60) = .721, p = .61, η2p = .011, showing that the local match choice was not dependent on a specific shape-combination. Finally, to test the possible effects of presentation orders on the level of processing, six paired-samples t-tests were conducted (i.e., one per shape-combination). None of the t-tests were statistically significant, showing that there was no effect of presentation order on the local match (all ps > .05).
Discussion
When we inspect a stimulus, we can attend to individual elements or to the entire shape formed by these individual elements. Gasper and Clore (2002) suggest that whether we attend to the entire shape or the single element depends on our mood. Namely, while happy mood fosters the entire shape view (i.e., global processing), sad mood fosters the single element view (i.e., local processing). Here, we showed that this effect is not limited to vision but is also present in the haptic modality. Individuals in the sad mood condition matched the probe with the local shape more often than individuals in the happy mood condition. Interestingly, individuals, independent of the mood condition, more often matched the global target to the probe—the global match was selected overall six times more often than the local one. This overall global preference is interesting considering that typically people focus on local details when exploring objects with their hands (Lakatos & Marks, 1999; Lederman & Klatzky, 1987, 1993). However, the objects used in these earlier studies were larger than a typical hand, which might have pushed individuals to do sequential exploration, which might have resulted in increased focus on local detail. Thus, the current global precedence finding might be due to the overall size of the global form (Kinchla & Wolfe, 1979; Tortelli et al., 2023), as well as the density or the spacing between local elements (Blanca & López-Montiel, 2009; Kinchla & Wolfe, 1979; Tortelli et al., 2023) of the local features (see Rezvani et al., 2020 for a meta-analysis on the environmental factors moderating global precedence). Although local–global focus preferences did not receive the same attention in haptic perception as in vision, a recent haptic study reported a similar global preference as we observed in our experiment: the smaller the local shape, the more global processing was observed (Tortelli et al., 2023). Therefore, the level of processing seems to critically depend on the number and relative size of the elements (Kimchi, 1992; Rezvani et al., 2020). It would be interesting, in future experiments, to identify the local–global relative size relationship where the perceptual focus switches. Importantly, this suggests that what counts as local or global may not be absolute, but instead context-dependent. The distinction may vary depending on the size, complexity, and spatial organization of the stimuli.
The general observed global preference suggests that the most available or at least the most salient information was the global form of our stimuli. This preference was modulated by mood: Individuals in unpleasant mood selected the local match to the probe more frequently than individuals in pleasant mood, regardless of the presentation order or the geometrical features. This pattern aligns with previous research positing that happy mood broadens attentional processing, whereas sad mood promotes more detailed (local) processing (Gasper & Clore, 2002). Notably, no significant difference emerged between happy and neutral conditions, which may be related to the stimulus design, which strongly favored global matches and may have limited sensitivity to detect further increases in global responding under happy mood.
The mood induction produced mixed effects across subjective measures and behavioral responses. Expectedly, SAM valence and arousal ratings changed significantly in both happy and sad conditions, supporting the overall effectiveness of the manipulation. While DES happiness increased in the happy condition, DES sadness did not significantly increase in the sad condition. Nonetheless, participants in the sad condition still exhibited increased local processing than those in happy and neutral conditions, indicating cognitive-affective processing even in the absence of strong self-reported sadness (Eich & Macaulay, 2000). This limited change in sadness rating aligns with prior work showing that sadness is generally more difficult to induce reliably compared to positive affect (Rottenberg et al., 2007; Westermann et al., 1996). These results suggest that, despite weaker self-reported sadness, the unpleasant mood induced in the sad condition had a meaningful effect on level of processing. One possible explanation for weaker sadness is that the Bruch piece, being complex and potentially unfamiliar to participants, may have elicited a weaker emotional response than the happy music. Although our musical selections were based on prior validation studies (Ackerley et al., 2017), we did not assess participants’ familiarity with or preference for classical music, which may have influenced the strength of mood induction and introduced variability. However, importantly, the SAM and DES measures reflect different conceptualizations of affect. In line with the dimensional view, we interpret the reduction in SAM valence as a decrease in general pleasant mood rather than an increase in discrete sadness, suggesting that the mood induction primarily altered overall mood.
Mood can influence processing style; conversely, processing style may influence mood (Ji et al., 2019). This bidirectional relationship has been observed in face identification: global processing facilitated recognition of happy faces, whereas local processing facilitated recognition of sad ones (Srinivasan & Gupta, 2011; Srinivasan & Hanif, 2010). Future research should investigate whether such bidirectionality occurs in haptic perception. In the present study, participants were allowed to re-explore stimuli to reduce memory-related biases; this may have introduced additional variability in exploration time and strategy. Testing mood effects under more constrained, one-shot exploration conditions could help further confirm and support the current findings.
Our work might have potential clinical relevance. For example, obsessive-compulsive individuals tend to focus on details (Shapiro, 1965; Witkin et al., 1979), a cognitive style that has been associated with local interference of small details when the task was the identification of global information (Yovel et al., 2005). Future studies should test whether individuals with obsessive compulsive cognitive style use more local processing compared to a control group also in haptic tasks. Insights from such studies potentially yield the development of novel diagnostic tools for this group of patients. These findings also may have implications for designing haptic interfaces and affect-aware technologies. For example, in virtual reality and gaming contexts, tactile feedback could be modulated to enhance immersion by aligning with user's emotional states. Mood-aware adaptations could improve the performance and the experience of the user across a range of interactive technologies, for example, by stressing local versus global channels of feedback as a function of mood.
In conclusion, individuals in unpleasant mood were more likely to report the entire shape. Using a stimulus set consisting of local and global features and a haptic shape judgment task, we found that unpleasant mood was associated with local processing compared to neutral and pleasant mood. To the best of our knowledge, this is the first study that extended the levels-of-processing effect found in vision to the haptic domain. Unlike previous research in haptic perception, we also found global precedence when people perceive different geometrical shapes. Therefore, more research is needed to understand the different components of global and local processing in the human haptic sense.
Footnotes
Author Note
Katja Doerschner and Knut Drewing contributed equally to this work.
Acknowledgements
The authors thank Hatice Dokumaci for the haptic stimuli production and data collection, Yeter Nazlıcan Kara and Lale Can for the data collection, and Rochelle Ackerley for sharing the classical music pieces.
Ethical Approval and Informed Consent Statements
The study was ethically approved by a local ethics committee, LEK FB06 (2017-0034), in accordance with the Declaration of Helsinki (“World Medical Association Declaration of Helsinki,” 2013), excluding the preregistration. Informed consents were obtained prior to the experiment.
Author Contribution(s)
Funding
The authors disclosed receipt of the following financial support for the research, authorship, and/or publication of this article: This research was supported by Deutsche Forschungsgemeinschaft (DFG, German Research Foundation)—project number 222641018—SFB/TRR 135 (A5 and B8) and EU Marie Curie Initial Training Network “DyVito” (H2020-ITN, Grant Agreement: 765121). K.Dr and M.C. were supported by DFG-project no. 502774891-ORA project “UNTOUCH,” K.Do was supported by Research Cluster “The Adaptive Mind,” funded by the Excellence Program of the Hessian Ministry of Higher Education, Science, Research and the Arts, Artificial Intelligence.
Declaration of Conflicting Interests
The authors declared no potential conflicts of interest with respect to the research, authorship, and/or publication of this article.
Data and Code Availability
Data have been deposited on the Open Science Framework (Cavdan et al., 2024) and will be publicly available upon publication. Any additional information required to reanalyze the data reported in this work is available from the lead contact upon request.