
Abstract
We review Codina and Ambrosini’s articles Full-scale testing of leakage of blast waves inside a partially vented room exposed to external air blast loading (2018), and Numerical and analytical study of overpressures and impulses inside a masonry box subjected to external blast loading (2019) concerning shock ingress into a room from a façade opening. The articles report the results of a full-scale experimental series for shock ingress loading of a room’s interior walls and compare them to predictions from CFD simulations and the widely used UFC 3-340-02 method. They conclude that the UFC overpredicts the impulse on the room interior side walls by up to 685%, while underpredicting the impulse on the back wall by up to 60%. Subsequently, they recommend applying modification factors to the UFC peak pressure and positive phase duration results to better match the experimental results. In this paper, we review the scarce published research on this subject to highlight the significance of the data presented within these two papers. We then critically assess the design, execution, and analysis of the reported experiments and simulations. We present an alternative analysis of their published data which accounts for the use of non-blast gauges and compare it with our own CFD simulations. These CFD simulations closely predict the alternative analysis of the experimental results and offer amendments to the original papers’ conclusions.
Keywords
Introduction
Structures that are subjected to external blast loading are liable to experience internal structural loads due to blast ingress via façade openings. To predict this loading, Chapter 2-15.4 of UFC 3-340-02 (U.S. Department of Defense, 2014), henceforth referred to as the UFC, provides a phenomenological method (in the sense of Elaine and Boris (2000) and Cormie et al. (2019)) derived from a shock-wave theory-based approximate model to calculate the expected equivalent uniform loads on the interior walls.
This method was introduced by Ayvazyan et al. (1986) with the associated underlying mathematical model developed by Kaplan (1979) using observations from previous experiments (Coulter, 1969; Wilton et al., 1978). A detailed review of this methodology and its limitations was presented by Eytan et al. (2024). The UFC method is widely used to determine the loading on interior walls in a structure, predominantly when retrofitting interior partitions (ASCE 59-22, 2022; FEMA, 2006) or in the construction of interior safe havens as part of a national civil defence strategy (IDF, 2010; Singapore, 1997; Swiss Ministry of Defense, 2021).
Equivalent uniform loading on surfaces was first suggested by Bleakney et al. (1952) in a study of a shock traversing a cuboid roof slab. They represented the slab overpressure at any given time by the spatial integral of the overpressure over the surface. Their work influenced the equivalent uniform loading calculation on internal/external side walls/roofs of the “Design of Structures to Resist the Effects of Atomic Weapons” manual (U.S. Army CoE, 1959). A simplified method was later included in the 1969 version of the UFC (US Department of Commerce, 1969) which remains unchanged in subsequent revisions.
Blast ingress into and through tunnel structures is a parallel area of research to that considered by the UFC (Clark and Taylor, 1960; Coulter, 1966). The shock behaviour as it propagates through the tunnel is a complex phenomenon due to multiple reflections and diffraction effects. Little (1984) recorded the behaviour of shock ingress as a function of tunnel diameter and length, as well as its subsequent expansion into a larger volume. Using experimental data from various government programs, Britt and Drake (1984) devised an empirical model for shock ingress behaviour. The model utilized the Low Altitude Multiple Burst (LAMB) shock-addition ray-tracing framework introduced by Needham (2018). Mercx (1990a, 1990b, 1991) investigated pressure ingress into a room, using shock tube experiments, seeking to quantify interior loading to reduce the net-sum pressure on exterior walls. We can find no further directly related significant work from 1991 until 2018 when Codina and Ambrosini (2018, 2019) reported their study of overpressures and impulses inside a masonry box subjected to external blast loading. Based on limited experimental and numerical results, they concluded that the UFC underestimates the back wall impulse by up to 60% and overestimates the side wall impulse by up to 685%.
Data from recent work (Eytan et al., 2024) supports Codina and Ambrosini’s conclusion that the UFC method is overly conservative for the side wall loadings, whilst noting that parts of the UFC methodology remain unvalidated. It further notes that its original authors, Ayvazyan et al. (1986), referenced work by Kaplan (1979) which questioned the validity of the underlying mathematical model and stated the need for its experimental validation.
Due to the limited past research on blast ingress, Codina and Ambrosini’s (2018, 2019) articles are important in revisiting this topic. In this paper we critically assess these articles’ methodology and conclusions. We begin with the articles’ experimental methodology and UFC calculations. We then discuss their experimental results and present an alternative analysis of the published data. We further assess the validity of the articles’ comparison of individual pressure gauge data to the UFC predictions. We then present our conclusions.
Review of the experimental setup, UFC calculations and data reporting
Experimental setup and target layout
Codina and Ambrosini (2018, 2019) investigated the internal loading of the cuboid structure of Figure 1 subjected to two blast loads. Test 1 consisting of charge mass Experimental layout of Codina and Ambrosini (2018, 2019) all dimensions are in mm; (a) and (b).
Comparison between the experimental parameters of Codina and Ambrosini (2018, 2019) and the stated range of validity of the UFC (those outside the UFC range marked in bold).
The reasons for these choices of out-of-bound parameters are neither noted nor explained, despite the UFC comparison being a stated primary research outcome. The associated UFC predictions for these parameters in the articles were presumably extrapolated. This is neither acknowledged nor the extrapolation methodology stated. While the UFC advises interpolation of its predictions (UFC Section 2-15-4), extrapolation is not suggested. The potential inaccuracy of numerical extrapolation is well-known (Chapra and Canale, 2020; Conte and De Boor, 1980). In the few cases the UFC relies on extrapolated experimental data, it is clearly indicated (UFC Sections 2-13.1,2-14.3.1,2-14.4.4), or when extrapolation is advisable, its method is clearly specified (UFC Section 2-13.3). It can be assumed that by including a clear applicable parameter range, the UFC implies that extrapolation is not advised. Furthermore, extrapolating this UFC data is challenging because it extends into regions where the behaviour of some intermediate loading parameters becomes inconsistent with their values in other regions. One representative example of this inconsistency is shown in Figure 2. Example use of UFC Figure 232A to determine the time of arrival (T1) of the shock at the side wall for Test 1. Linear extrapolation beyond the UFC parameter range at 
UFC calculations
Comparison of UFC solutions between Codina and Ambrosini’s (2018,2019) results (labelled C&A) and our proposed values.
Data reporting
Codina and Ambrosini (2019) compare their experimental results against numerical simulations using Ansys Autodyn, stating that overall, the differences do not exceed 23%. Closer inspection of this analysis reveals significant irregularities. For example, it is reported that for the 1 kg at 15 m test, the experiment interior side wall peak pressure differs by only 16.3% from the simulation. However, the pressure peaks used for comparison are from two different phases, as shown in Figure 3. No explanation is offered to account for the inability of the model to capture the initial pressure rise, warranting the further investigation presented in the subsequent section. Comparison of pressure-time histories for the side wall for 1 kg at 15 m standoff test from Codina and Ambrosini’s (2018, 2019) experiment and their Autodyn simulations. The peak pressure values these authors used for comparison are indicated.
As for the impulse, the complex internal reflections are seen to result in prolonged positive phase loading. The negative phase is less apparent due to interior reflections and the inability of the reflecting interior shocks to rapidly exit through the relatively small façade opening. In such cases, reporting the overall maximum impulse might not accurately reflect the shock characteristics for comparison purposes. For example, the reported maximum impulse for the side wall in the 1 kg at 15 m test occurs during the 5th positive phase, and is compared with the simulation impulse, recorded at the end of the simulation runtime (as depicted in Figure 4). The simulation impulse diverges from the experimental results with time; this can result from errors accumulating as the simulation proceeds. Ensuring comparisons are made “like for like” is fundamental for proper conclusions to be drawn, as will be further discussed. To facilitate a proper comparison, initial peak pressures and first phase impulse values are used throughout the subsequent sections. Test 1 gauge 4 (side wall) pressure and impulse histories compared with the article simulation.
Analysis of experimental data
In each of Codina and Ambrosini’s tests a free-field gauge (gauge 5) was located at a standoff distance equal to that from the explosive to the cubicle’s centre. Its standoff is higher than that of the façade reflected pressure gauge (gauge 3), located on the cubicle front wall. The data from both gauges is depicted in Figure 5. The reported peak overpressure of both gauges is nearly identical, whereas the façade reflected gauge is expected to experience significantly higher peak overpressure due to its smaller range and the reflection off the façade wall. Additionally, the free-field signal should be comparable with Kingery and Bulmash (1984) predictions of peak overpressure and positive phase duration, including a typical exponential decay over time (Brode, 1957, 1958) (also included in Figure 5). Instead, it is characterised by harmonic resonance, commonly referred to as gauge ringing (Shelley, 2022). This harmonic resonance is also visible, though to a lesser extent, in the signal recorded by gauge 3 at the façade. Experimental pressure-time histories for gauges 3 and 5 and comparison with Kingery-Bulmash prediction. (a) and (b).
Gauge ringing can be due to external physical sources such as the gauge’s mounting (Du and Zu, 2010; Skotak et al., 2018) or an electromagnetic source interfering with the gauge signal transfer to the recording equipment (Li et al., 2000). Ringing can also arise from resonant effects with a gauge’s membrane or other internal components (Crocker and Sutherland, 1968; Yu et al., 1990). Ringing effects could be caused by the shock’s high frequency dynamic loading paired with sampling via a low response rate gauge. The response rate of the Honeywell 180PC gauge (Honeywell, n.d.) used in the experiments is determined by the 1 msec slew rate of its operational amplifier and the recording sample rate of 14 kHz. These parameters fall below the minimum required for blast testing. ISO 16933 (2007) specifies a minimum sampling frequency of 100 kHz while ASTM F1642 (2010) requires the sampling frequency to be “sufficiently high” to reliably record the peak pressure.
We suggest that the free-field gauge 5’s (and, to a lesser degree, the façade reflected gauge 3’s) recorded signal in Figure 5 is most likely affected by a combination of the phenomena discussed in the preceding paragraph. We also note that the post-shock oscillations have a consistent 1 msec period. This period corresponds to exactly 14 samples (or 1 kHz) at the data acquisition frequency used. Figure 6 reveals similar oscillations for all the gauges in the 1 kg at 15 m test. This behaviour is surely an artifact of the data collection process, as similar behaviour is also demonstrated across all gauges in the test of 5 kg at 25 m. Test 1 (1 kg at 15 m) gauges 1, 2, 4 and 5 with vertical lines at extrema and minima of the gauge 5 data, corresponding to 1 kHz of the sampling frequency.
As detailed by Shelley (2022), there are a multitude of signal processing techniques to reduce the effects of gauge ringing in the experimental data. Most manipulate the signal using a low-pass filter, which attenuates frequencies above a specified frequency threshold.
Using MATLAB’s low-pass filter (MathWorks, 2024) a minimum passband of 200 Hz was found to remove the oscillations present in the original experimental data. In Figure 7, the low-pass filtered data of Test 1 (1 kg at 15 m) is compared with the original data for four gauges and with the Kingery and Bulmash (1984) prediction for the free-field gauge 5. A similar comparison for Test 2 (5 kg at 25 m) is included in Figure 8. Codina and Ambrosini (2018) Test 1 original and filtered data using a 200 Hz passband frequency; a. (left) – Exterior gauges 1 and 5, b. (right) – Interior gauges 1 (middle of the room), 2 (centre of back wall) and 4 (centre of side wall). Codina and Ambrosini (2018) Test 2 original and filtered data using a 200 Hz passband frequency; a. (left) – Exterior gauges 1 and 5, b. (right) – Interior gauges 1 (middle of the room), 2 (centre of back wall) and 4 (centre of side wall).
Apart from the façade reflected pressure (gauge 1), the filtered signals of the interior gauges exhibit a significant reduction in peak overpressure, the elimination of oscillatory disturbances, and an extended positive phase duration compared to the external free-field shock (gauge 5). This outcome aligns with expectations due to multiple interior reflections. The façade’s reflected overpressure (gauge 3) is now approximately twice that of the free-field gauge (gauge 5). Additionally, the filtered free-field signal more closely resembles the loading function predicted by Kingery and Bulmash, albeit with a lower peak pressure. This discrepancy is likely attributed to the relatively low cut-off frequency of the filter, which would have the effect of rounding the initial shock peak.
In the second paper (Codina and Ambrosini, 2019) the experimental data is compared with numerical simulation using Autodyn (Ansys Inc, 2024). In a similar manner, we compared the results to CFD models using Cranfield University’s ProSAir code.
ProSAir (Propagation of Shocks in AIR) is a compressible fluid dynamics solver specialised for blast and is a reimplementation of Rose’s Air3D solver (Remennikov and Rose, 2005; Rose and Smith, 2002; Smith and Rose, 2006; Timothy, 2002). Both use a finite volume discretisation of the compressible Euler equations with ideal gas law and use second order MUSCL-Hancock time integration (Toro, 2009) and the AUSMDV hybrid flux vector/difference splitting scheme developed by Wada and Liou (Wada and Liou, 1997). ProSAir models the charge as a simple bursting sphere of ideal gas with the same energy and density as the explosive products (Brode, 1955). ProSAir has been validated for far-field external blast (Castedo et al., 2019) and its accuracy is comparable to other available software (Chester, Critchley, et al., 2024; Chester, Hazael, et al., 2024). The user guide (Forth, 2022) features several validation cases, including the use of experimental data from a geometrically complex urban environment (Brittle, 2004).
ProSAir parameters used to simulate the masonry cuboid structure.
A mesh refinement exercise in the 3D domain using 100, 50 and 25 mm mesh cells was performed. The 100 mm mesh had insufficient resolution to accurately capture the peak pressures. The 50 mm mesh results were sufficient to capture the shock behaviour inside the cubicle. The 25 mm mesh used in this study matches that used by Codina and Ambrosini (Codina and Ambrosini, 2019). For this mesh, the relative discretization errors upper limit for the gauge’s first-phase peak pressures and impulse are less than 5%. Similarly, sensitivity studies to determine the optimal domain size were performed until the blast parameters of the first positive phase converged.
Figure 9 presents a comparison of the experimental and simulation results with our filtered experimental data and ProSAir simulation. The figure focuses on Test 1 (1 kg at 15 m) interior gauges. For gauge 1 (Figure 9(a)), the experimental and Autodyn simulation data exhibit a closely matched first phase peak pressure at approximately 40.4 msec, which is significantly higher than both the filtered experimental signal and the ProSAir simulation results. Following this, both datasets show a peak under-pressure at 40.7 msec, which is absent in the filtered signal and ProSAir data. Beyond this point, the Autodyn simulation aligns more closely with the ProSAir simulation and filtered data than with the unfiltered experimental data. A similar pattern is observed across all gauges and test conditions, as detailed in Figure 9(b). Experimental data and simulation results compared with the filtered data using a 200 Hz passband frequency and the ProSAir CFD simulation for Test 1 (1 kg at 15m); a. (top left) Gauge 1 at room centre, b. (top right) Gauge 2 on back wall, c. (bottom left) Gauge 4 on side wall.
For gauge 4 (Figure 9(c)), neither simulation captures the oscillations present in the unfiltered experimental data. However, both simulations exhibit reasonable agreement with the proposed filtered signal. A similar pattern is observed across all gauges in Test 2, as detailed in Figure 10. Experimental data and simulation results compared with the filtered data using a 200 Hz passband frequency and the ProSAir CFD simulation for Test 2 (5 kg at 25 m); a. (top left) Gauge 1 at room centre, b. (top right) Gauge 2 on back wall, c. (bottom left) Gauge 4 on side wall.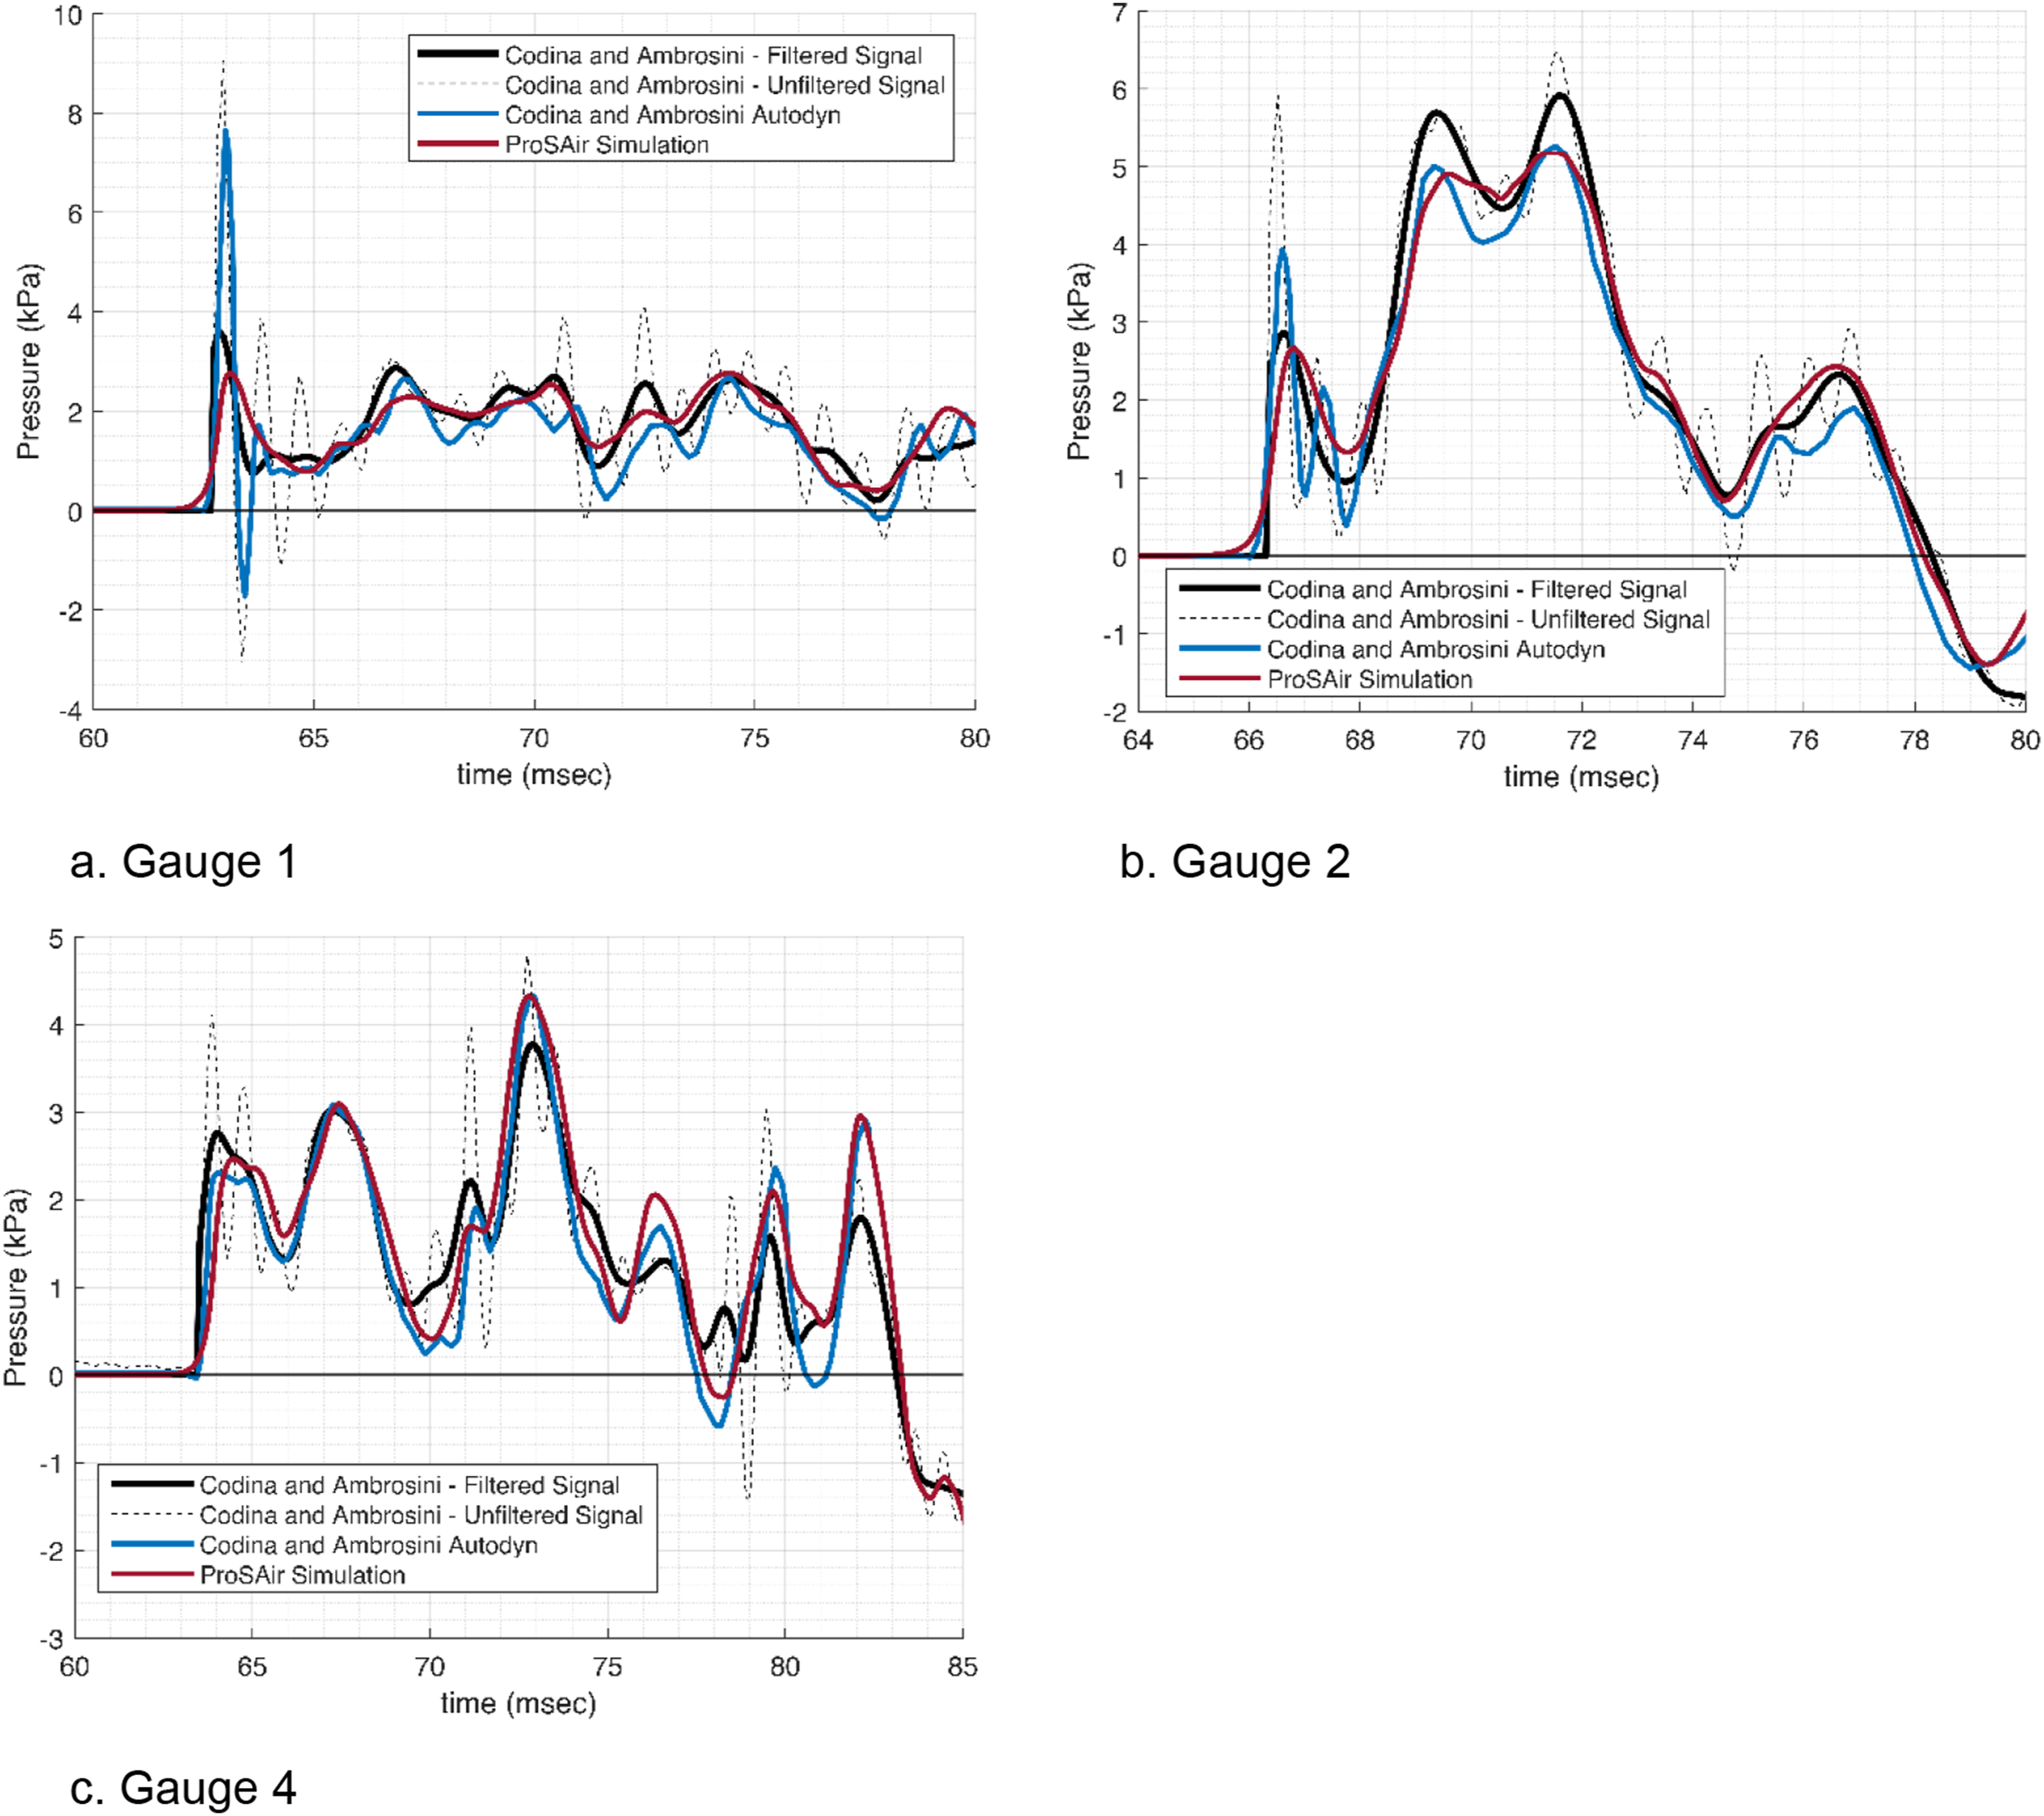
Applying an appropriate low-pass filter to the experimental data has resulted in pressure plots that (1) are more typical of those expected in blast loading; (2) give good agreement with results for an established numerical simulation tool; and (3) align with the expected Kingery-Bulmash results at the free-field gauge.
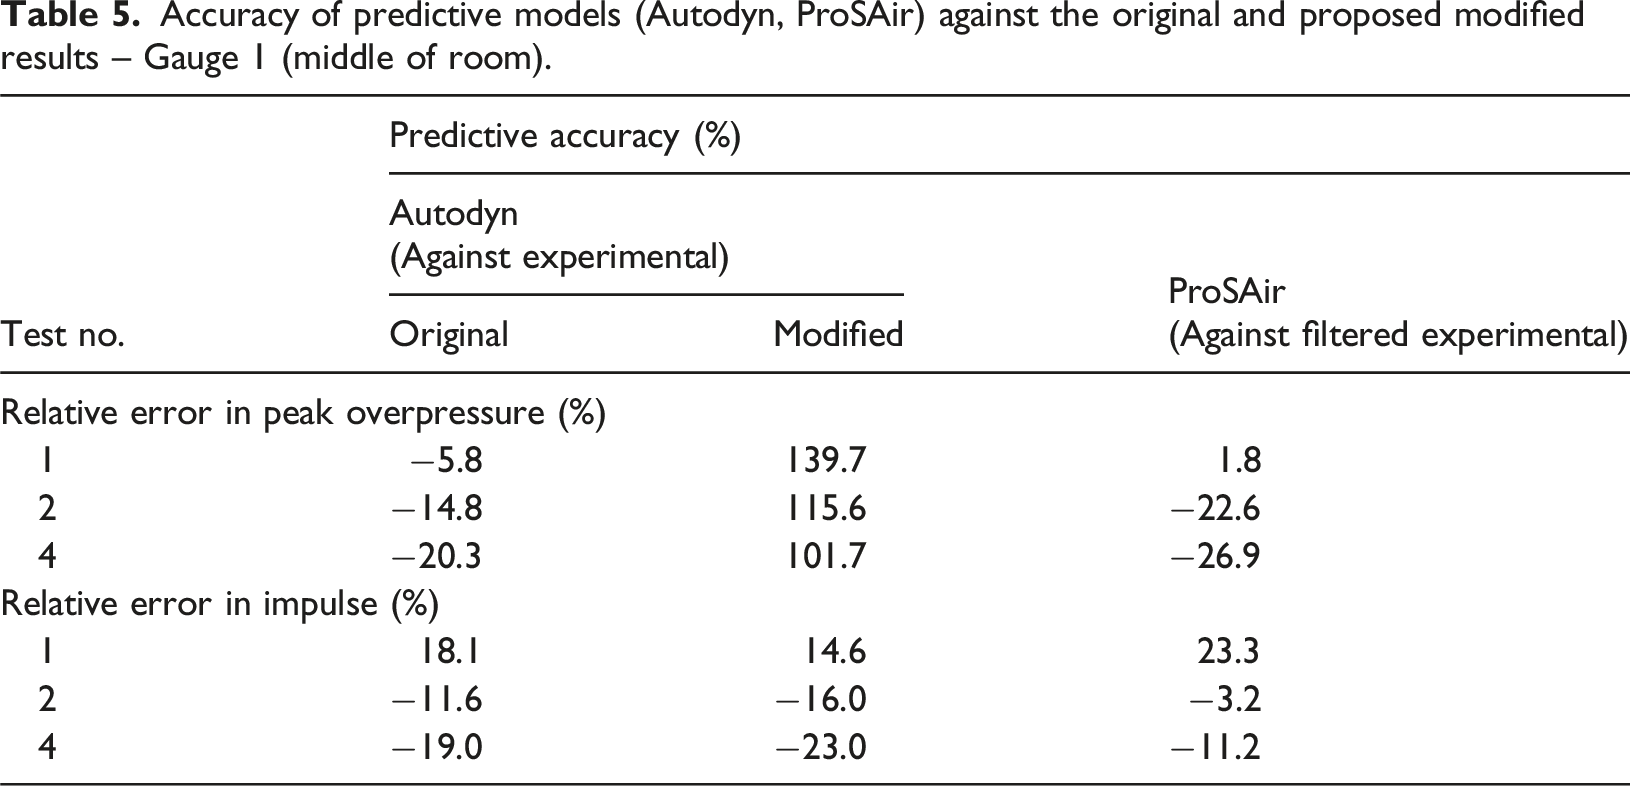
Original experimental and Autodyn simulation results against proposed modified blast parameters - Gauge 1 (middle of room).
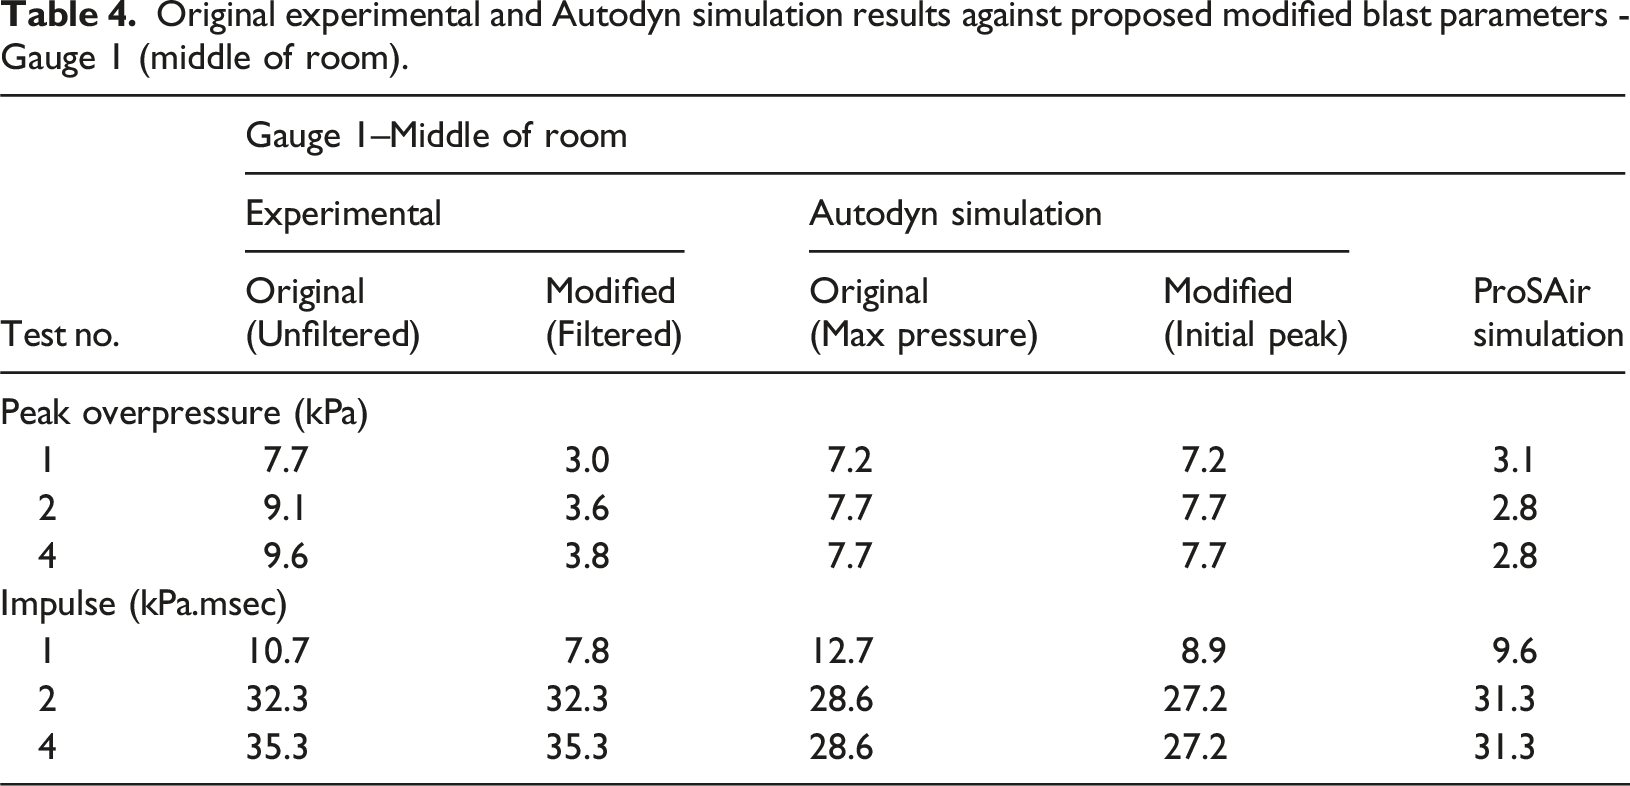
Accuracy of predictive models (Autodyn, ProSAir) against the original and proposed modified results – Gauge 1 (middle of room).
Original experimental and Autodyn simulation results against proposed modified blast parameters - Gauge 2 (centre of back wall).
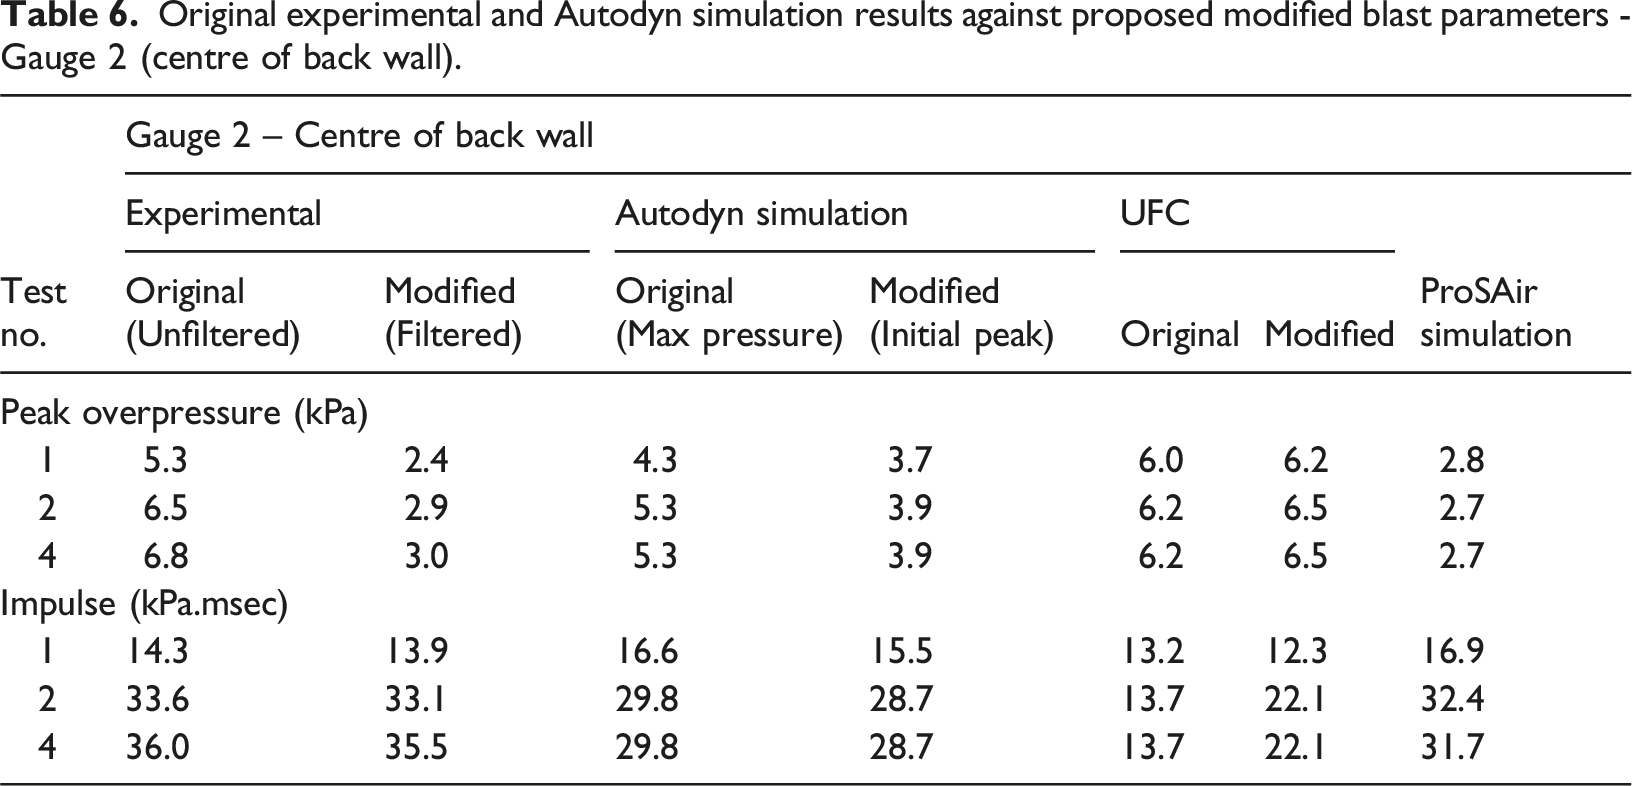
Accuracy of experimental predictive methods (Autodyn, ProSAir) against the original and proposed modified results – Gauge 2 (centre of back wall).
Original experimental and Autodyn simulation results against proposed modified blast parameters - Gauge 4 (centre of side wall).
Accuracy of predictive models (Autodyn, ProSAir) against the original and proposed modified results – Gauge 4 (centre of side wall).
Accounting for an equivalent uniform load
The UFC methodology predicts an overall equivalent (spatially) uniform load across the entire interior side or back walls. An equivalent uniform load is a simplified approach for cases where the spatial loading on an element varies with time as the shock traverses it. By contrast, the articles report the pressure values measured at the centre of each wall and compare this to the UFC-predicted equivalent uniform load for the entire wall.
Using ProSAir simulations, we recorded the overpressure across the walls at a total of 120 points, evenly distributed as a 200x200 mm grid. As an example, Figure 11 shows the point loads along the centreline in the vertical of the interior side wall for Test 1 (1 kg at 15 m), highlighting its mid-span (wall-centre) gauge, and the integrated average load across the wall. The integrated load’s peak overpressure is lower than that at any point location across the wall, including the wall centre. In fact, this will necessarily be the case – averaging the overpressure over the wall area has the effect of attenuating all peaks and troughs evident in the overpressure time series at specific locations. Test 1 ProSAir side wall pressure histories of (grey) 26 evenly spaced gauges (purple) across the side wall mid-height, their integrated average loading (purple) and the mid-span gauge (black).
We see that the wall mid-span point load is unlikely to provide an accurate estimate of the equivalent uniform load, rendering the comparison between the wall mid-point experimental data and the UFC prediction questionable.
Impact of modified analysis
Our analysis and findings significantly impact the articles’ experimental and analytical data (as summarised in Tables 4–9). Consequently, the original articles’ key conclusions are also affected, as we now discuss.
Firstly, the articles concluded that the UFC underpredicts the back wall impulse by up to 60%. As a result, the recommendation was to double the UFC load duration and increase the predicted peak overpressure by 40%. However, the justification relied on an arithmetic error in the calculation of the UFC impulse and the use of extrapolation. Recently, Eytan et al. (2024) have demonstrated that the UFC both over and under-predicts the back wall impulse, as a function of the scaled distance and façade opening size. Therefore, applying Codina and Ambrosini’s recommended correction may lead to overestimation of 180%.
Secondly, Codina and Ambrosini reported that the UFC overpredicts the side wall impulse by up to 685%. Eytan et al. (2024) reveals even greater discrepancies, with overpredictions of up to 1136% in some cases. Additionally, considering the filtered signal results, the UFC peak pressure overprediction, previously reported as 21% on average, is now found to be 122% on average.
Thirdly, the articles’ comparison of the wall mid-span experimental data to the UFC’s predictions is not appropriate, as the UFC predictions are for an equivalent uniform load on the entire wall, rather than localized measurements.
Fourthly, after accounting for the gauge ringing effect, our signal filtering has reduced the peak experimental overpressure by ∼50%. The reported close agreement with the corresponding Autodyn simulations is called into question. This is most notable at the room centre gauge where the previously reported small 13.6% underprediction of the simulation is now an overprediction of 119%.
Conclusions
In this paper we reviewed the results, analysis and conclusions of two papers by Codina and Ambrosini (Codina and Ambrosini, 2018, 2019) concerning blast ingress and estimating the resulting loading using UFC 3-340-02 (U.S. Department of Defense, 2014) and further compared their results to those from ProSAir (Forth, 2022) CFD simulations.
Our review of Codina and Ambrosini’s experimental configuration demonstrated that the façade opening ratio and the façade overpressures used are outside of the parameter ranges specified in the UFC. Consequently, extrapolation must be employed to apply the UFC to their experiments, leading to potential errors as the UFC does not provide guidance on extrapolation.
Furthermore, the gauges used in the experiments are not suited to blast loading due to their relatively low sampling frequency and high slew rate. The results obtained are subject to significant gauge-ringing effects. We used a simple low-pass filtering technique to remove the oscillations from the experimental data and this filtered data agrees well with results from our numerical modelling. These filtered results affect the article’s original conclusions. The UFC over-prediction of side wall loadings nearly doubled while back wall loading under-estimation nearly halved. Additionally, further review of the Autodyn simulation accuracy is warranted.
We used numerical modelling to demonstrate that the pressure signal at the mid-span gauge on an interior side wall does not approximate the equivalent uniform load, and will necessarily be an overestimate. This renders any evaluation of the UFC against a single gauge point erroneous.
Finally, Codina and Ambrosini’s proposal to introduce correction factors to the UFC methodology must be carefully considered. The UFC’s predictions are reliant on multiple parameters relating to charge mass, scaled distance and building dimensions. Codina and Ambrosini’s two experiments differ only in charge mass, which affects only the
Consequently, we suggest that the UFC method’s accuracy should be researched across all its blast and building parameter ranges before conclusions on its accuracy be drawn, and revisions suggested.
Supplemental material
Supplemental Material - Discussion and re-evaluation of recent research on pressure ingress into a room from an opening
Supplemental Material for Discussion and re-evaluation of recent research on pressure ingress into a room from an opening by Alex Eytan, Stephanie J Burrows, Erik G Pickering, Shaun A Forth in International Journal of Protective Structures.
Footnotes
Funding
The authors received no financial support for the research, authorship, and/or publication of this article.
Declaration of conflicting interests
The authors declared no potential conflicts of interest with respect to the research, authorship, and/or publication of this article.
Data Availability Statement
The datasets generated and/or analysed during the current study are available in the Supplementary Information files associated with this paper.
Supplemental material
Supplemental material for this article is available online.
References
Supplementary Material
Please find the following supplemental material available below.
For Open Access articles published under a Creative Commons License, all supplemental material carries the same license as the article it is associated with.
For non-Open Access articles published, all supplemental material carries a non-exclusive license, and permission requests for re-use of supplemental material or any part of supplemental material shall be sent directly to the copyright owner as specified in the copyright notice associated with the article.