
Abstract
Fragments, for instance generated by a blast or vehicle collision, can impact a nearby structure with significant damage potential. Such fragments can have varying sizes, shapes and velocities. It is thus important to understand how these fragments will influence the structure, and how fragment size and shape affect the damage potential in various protective structures. In this study, we fired three different projectile types to study fragment impact on 50 mm thick plain C35 concrete slabs. We used material tests and literature data to calibrate a concrete constitutive relation for finite element modelling in LS-DYNA. An axisymmetric numerical model reproduced the results to a satisfactory degree, both in terms of ballistic limit velocities, residual projectile velocity and mass loss. The results showed that despite having similar ballistic limit velocities, the three projectiles gave significantly different response for higher initial velocities.
Keywords
Highlights
• 32 ballistic impact tests with three different fragments were performed. • Material characterisation using data from tests, literature and curve fitting. • Accurate numerical modelling of residual velocities and mass loss in LS-DYNA.
Introduction
Concrete is the most commonly used building material in the world due to its availability, low cost, high strength, and abundance. The material is much used in both critical infrastructure and protective structures, and had a global annual consumption in 2014 of approximately 25 Gt (Petek Gursel et al., 2014). Due to both intentional threats and accidents, concrete structures are constantly at risk to extreme loads such as blasts and ballistic impacts. This has led to a rich literature on ballistic loads on concrete materials, where authors have investigated a range of factors, including projectile shape and size (Ben-Dor et al., 2009; Dong et al., 2020), target thickness (Li et al., 2020), material strength (Hanchak et al., 1992; Kristoffersen et al., 2021), and reinforcement (Dancygier, 1997; Jacobsen et al., 2023; Rajput et al., 2018). However, the response of finite concrete targets when impacted by small projectiles with different shapes is not extensively covered in the existing literature.
It is known that the combined effects on a structure from ballistic impact and blast loading is more severe than any of the loads alone (Del Linz et al., 2020; Elveli et al., 2023; Goswami et al., 2022; Grisaro and Dancygier, 2018; Nyström and Gylltoft, 2009). In addition to a blast wave, a nearby explosion is likely to cause fragment impact on a structure. It is thus important to have knowledge on how these fragments affect the structure. Such fragments can vary in terms of geometry and velocity, depending on a range of factors, such as the detonation origin, materials involved and debris around the detonation (Brown et al., 2019). By studying the impact of small projectiles on concrete targets, we can get a better understanding of the effect of fragment shape and mass on the damage potential.
Sauer et al. (2023) performed 28 experiments on 30 mm thick ultra-high performance concrete (UHPC) slabs with 13.5 mm spherical projectiles. They found that the percentage mass loss in the impact experiments increased with a linear trend from 2.0 to 3.5% when increasing the impact velocity from 600 to 1500 m/s. Their results did not include any experiments where the projectile was completely stopped. Brown et al. (2021) fired 12.7 mm ball bearings and 20 mm fragment simulating projectiles (FSPs) at concrete targets with thicknesses from 50 to 360 mm to study the effect of fragment impact on penetration depth and perforation. FSPs are STANAG (NATO Standarization Agency, 2003) certified projectiles that are used to represent fragments that could stem from an explosion. These chisel-nosed projectiles are commonly used by NATO, and come in a variety of calibres and masses. Brown et al. (2021) concluded that the hazard associated with penetration depth increases as fragment aspect ratio (defined by them as the diameter-to-length ratio) decreases and the impactor nose becomes increasingly convex in shape. The authors concluded that perforation is of greater concern when protective structural elements are impacted with lower-aspect-ratio fragments. Concurrent with previous studies (Brown et al., 2019; Kristoffersen et al., 2021), they observed that the mass loss from the concrete targets increased with the unconfined compressive strength, and tied this effect to the commonly observed increased brittleness of higher strength concrete compared to low-strength concrete. Li et al. (2020) studied the impact resistance of concrete targets with thicknesses from 60 to 140 mm subjected to 7.62 mm armour piercing bullets to find the perforation limit. They stated that thicker targets will have better perforation resistance due to the increased confinement on the projectile and that the projectile has to penetrate more concrete. Increased tensile strength was reported to give better cracking resistance.
Finite element modelling is commonly used to study the ballistic performance of concrete targets (Antoniou et al., 2023; Jacobsen et al., 2023, 2025; Kristoffersen et al., 2021; Pavlovic et al., 2017). The penetration and perforation process during a ballistic impact on concrete involves brittle cracking, and the inherent heterogeneity of the material makes it challenging to model. Accurate modelling of micro-cracks requires small element sizes, which is computationally expensive. One approach is to model the aggregates and matrix as two separate materials with different material characteristics (Xu et al., 2022; Zhou et al., 2017). However, such material data is rarely available in the design stage, and a detailed modelling approach like this is not likely to be necessary in early stages. For this reason, it is both common and reasonable to assume the material to be a homogeneous solid, rather than a porous, composite material (Jacobsen et al., 2023). Less complex models that are faster and easier to calibrate might thus be a better option in the design phase. Of course, the simplifications and assumptions have to be justified and reasonable.
Ballistic impact on concrete is a complex process that involves large strains, high strain rates and high pressures (Holmquist et al., 1993). It is thus important to have detailed knowledge of the material behaviour in these regimes. However, such material data is difficult and expensive to obtain, and practically infeasible to produce for every concrete. For this reason, several concrete material models in commercially available non-linear finite element codes like LS-DYNA are equipped with automatic parameter generation, where the material input from the user usually is limited to the unconfined compressive strength of the concrete. Antoniou et al. (2023) investigated the automated parameter generation, and showed that three commonly used parameter generators gave diverging results for ballistic impacts on 50 mm concrete slabs when only using one parameter input. However, by calibrating the material models using available quasi-static material data, the authors obtained reasonable agreements with experiment results. The authors thus recommended simplified calibration as a minimum when using concrete constitutive models to get reliable results when designing protective structures.
In this study, we investigated the ballistic performance of 50 mm thick concrete slabs subjected to ballistic impact from three small projectiles: 15 mm ball bearings, 12.7 mm fragment simulating projectiles (FSP) and 7.62 mm APM2 cores. The APM2 cores were assumed to serve as a worst-case fragment scenario, while the ball bearings and FSPs were assumed to have lower damage potential. The ballistic experiments ranged over an entire order of magnitude in terms of initial kinetic energy. We cast cube and cylinder specimens of a commercially available C35 concrete to track the strength development of the material over time and to characterise the material. Material data from standardised tests (The European Committee for Standardization (CEN), 2018) was extracted using digital image correlation that served as a basis for the calibration of a modified version of the Holmquist-Johnson-Cook model (Polanco-Loria et al., 2008), together with material data found in the open literature and reasonable assumptions. We proposed a curve fitting procedure of the pressure-hardening relation in the material model based on extensive literature data, and we suggested an erosion criterion that is relatively robust. Numerical simulations with an efficient axisymmetric ballistic model in LS-DYNA reproduced the results from the experiments to a satisfactory degree for all three projectiles in terms of ballistic limit velocity, residual projectile velocity and mass loss.
Concrete material
Concrete casting and fresh testing
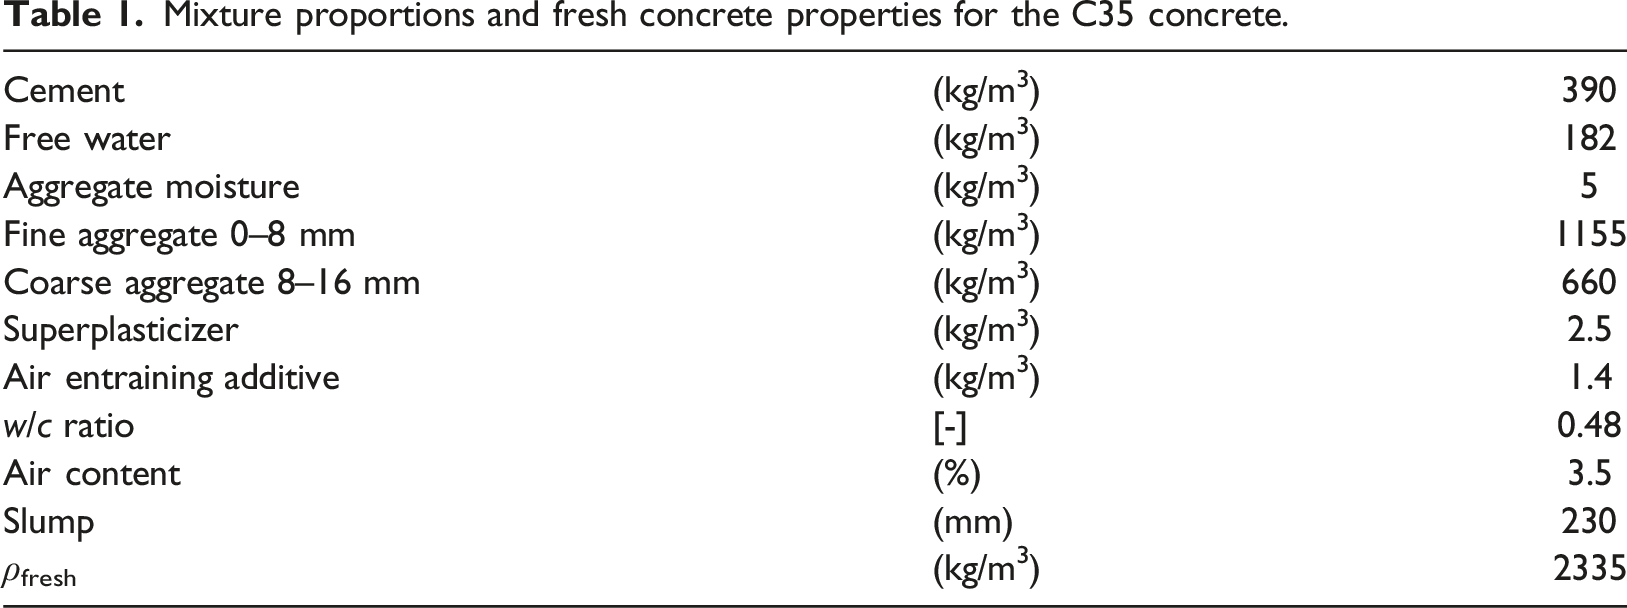
Mixture proportions and fresh concrete properties for the C35 concrete.
Material test results
Figure 1 shows the development of the cube compressive strength fcc (a) as well as the tensile splitting strength ft (b). These results were found from material tests performed in a Toni Technik 3000 kN load controlled rig with a loading rate of 0.8 MPa/s for the compression tests, and 0.08 MPa/s for the tensile splitting tests. Note that in the tensile splitting tests, there was a wooden strip on each side of the concrete cylinder, separating it from the steel platens of the test rig. Table 2 summarises the average results from 27 material tests performed 28, 57 and 90 days post casting. The unconfined compressive strength, fc, was found from cylinder compression tests. Concrete strength development with curve fits to strength development equation in (The European Committee for Standardization (CEN), 2018). (a) Cube compressive strength fcc. (b) Tensile splitting strength ft. Material strength parameters found from standardised tests.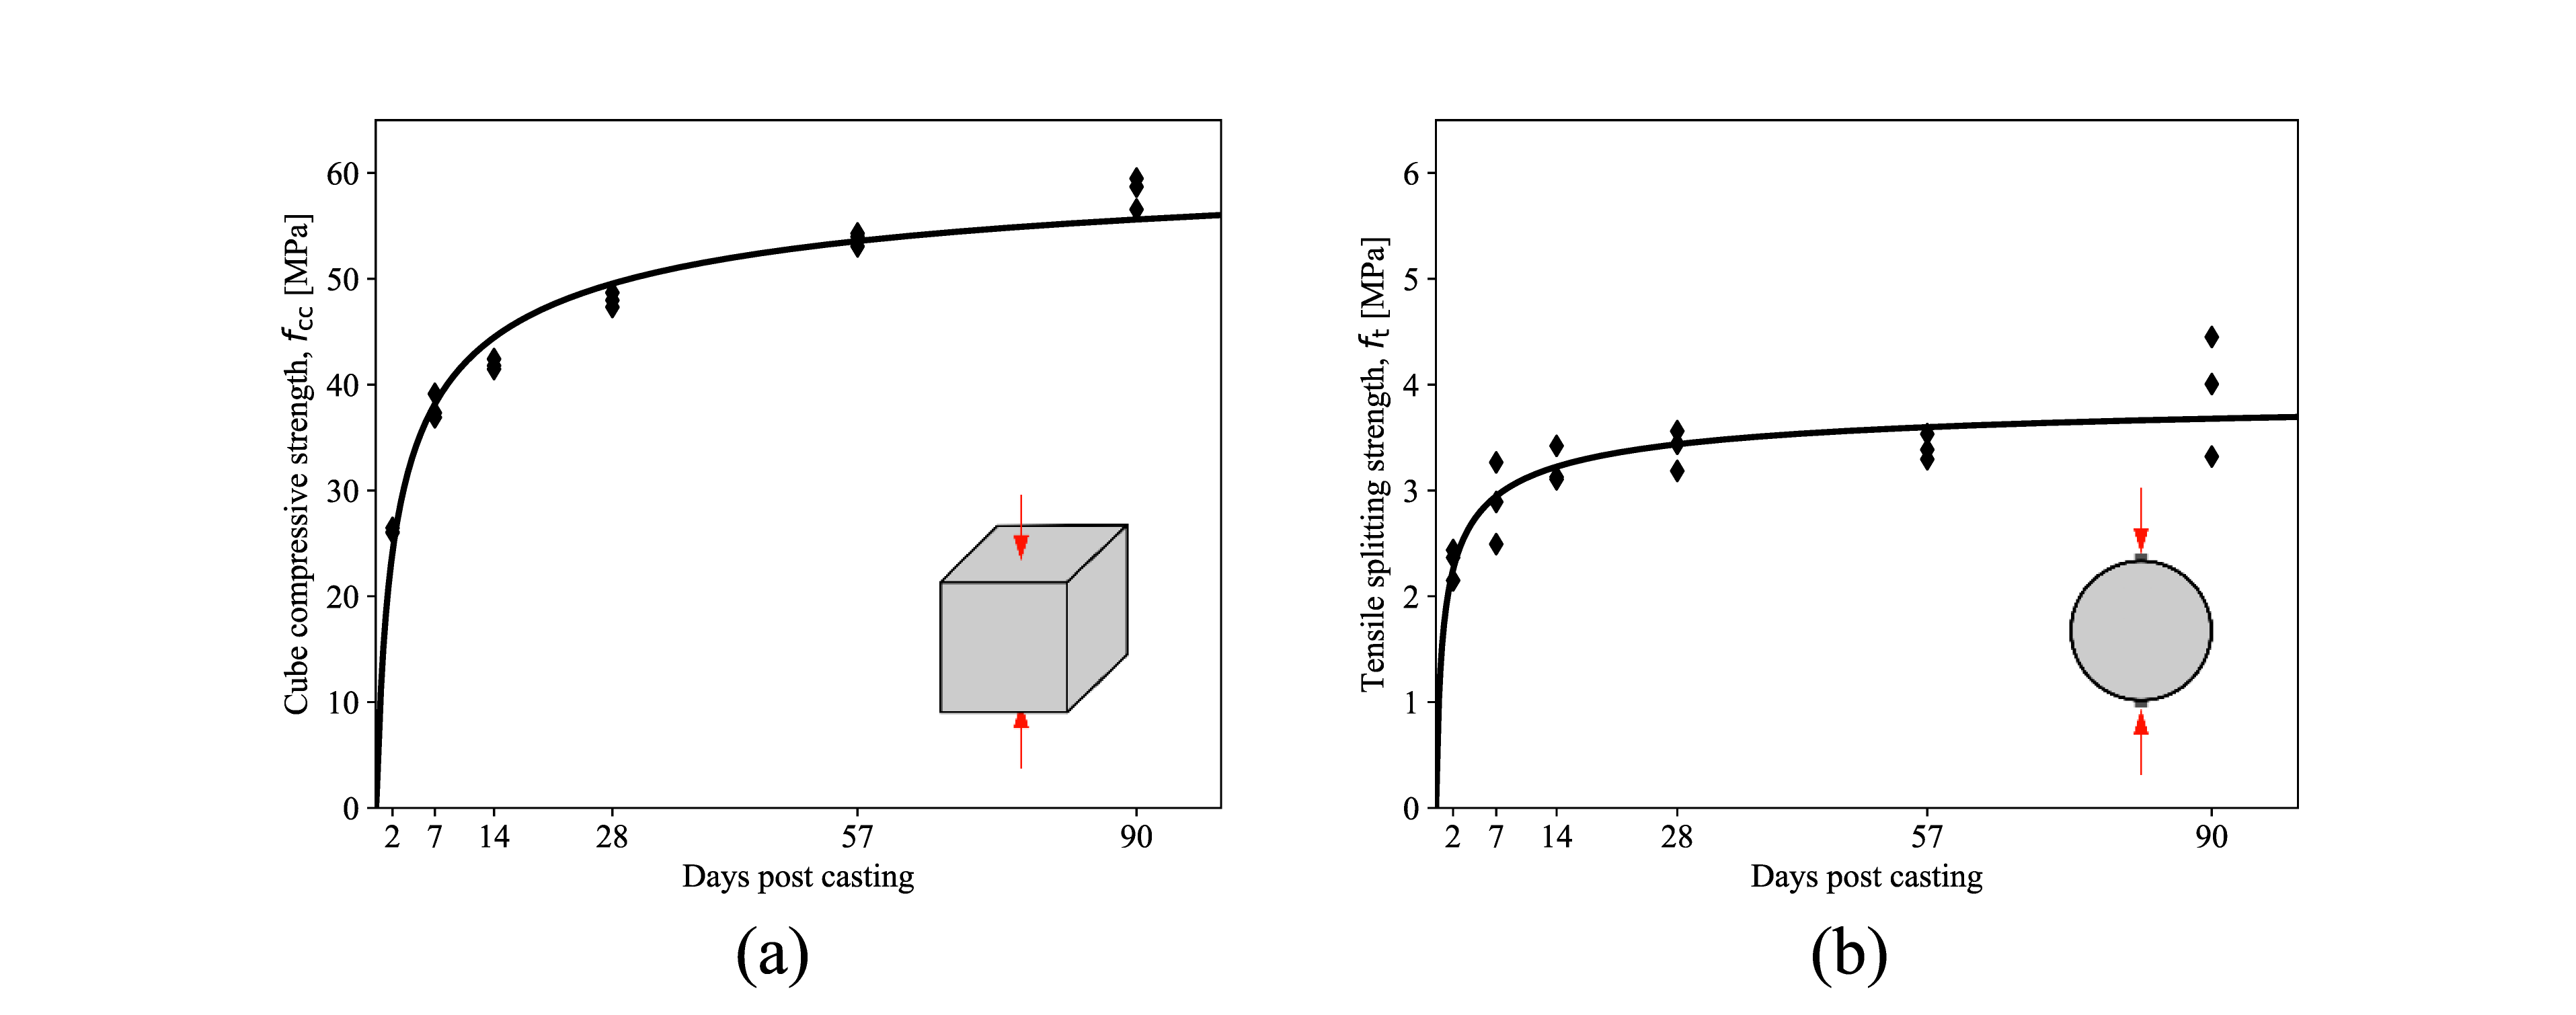
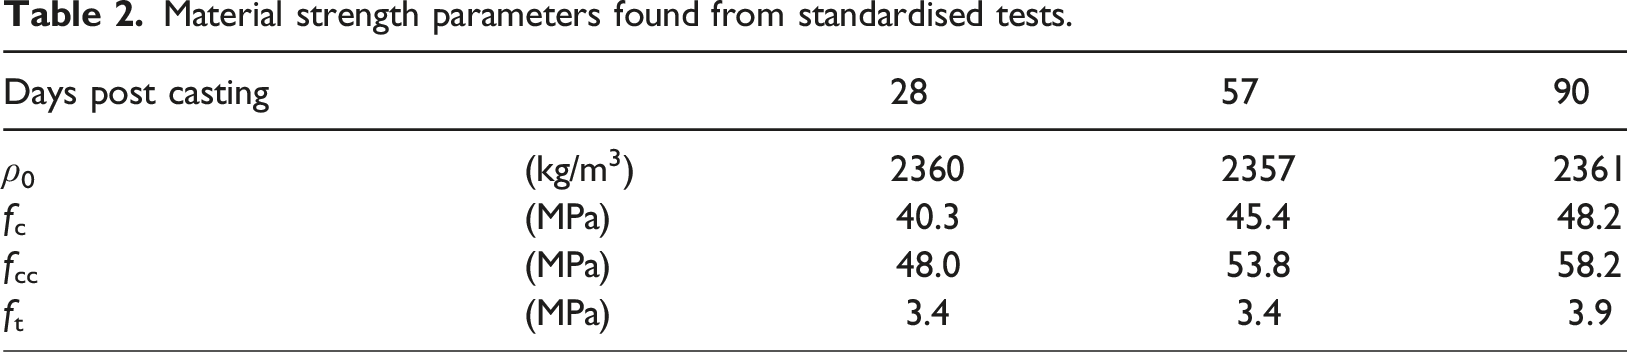
Figure 2 shows engineering stress-strain curves from material tests performed 28, 57 and 90 days post casting. The engineering stress σeng,c in the compressive tests was found from σeng,c = F/A0, where F is the measured force during testing and A0 is the initial cross-section area of the specimen. The engineering stress σeng,t in the tensile splitting tests was found from σeng,t = 2 F/(πLD), where L and D are the initial height and diameter of the cylinder, respectively. We sprayed speckles on the specimens, recorded the tests using a Basler 12 MP camera synchronised with the load cell, and post-processed the data with digital image correlation (DIC). We used subset pairs in the DIC software eCorr (Fagerholt, 2017) to find the engineering strain and the corresponding engineering stress. The axial engineering strain was found using (l − l0)/l0, where l and l0 are the current and initial distance between the two subsets in each subset pair, respectively. The transverse engineering strain in the tensile splitting tests was found using (b − b0)/b0, where b and b0 are the current and initial distance between the two subsets in each subset pair on the concrete surface facing the camera. This method is the same as the one used by Kristoffersen et al. (2021). By averaging 10 subset pairs per specimen, we got a representative engineering strain for each specimen. As expected, there was some strength and stiffness development in the material from day 28 through day 90. Figures 1 and 2 show that there is more scatter in the tensile splitting tests compared to the compression tests. There is also a notable plateau around 0.5 MPa in the tensile splitting tests when contact between the steel platens and the concrete specimen is established, seen in Figure 2(c). Engineering stress-strain curves from material tests performed 28, 57 and 90 days post casting. (a) Cylinder compression fc, (b) cube compression fcc, and (c) tensile splitting ft.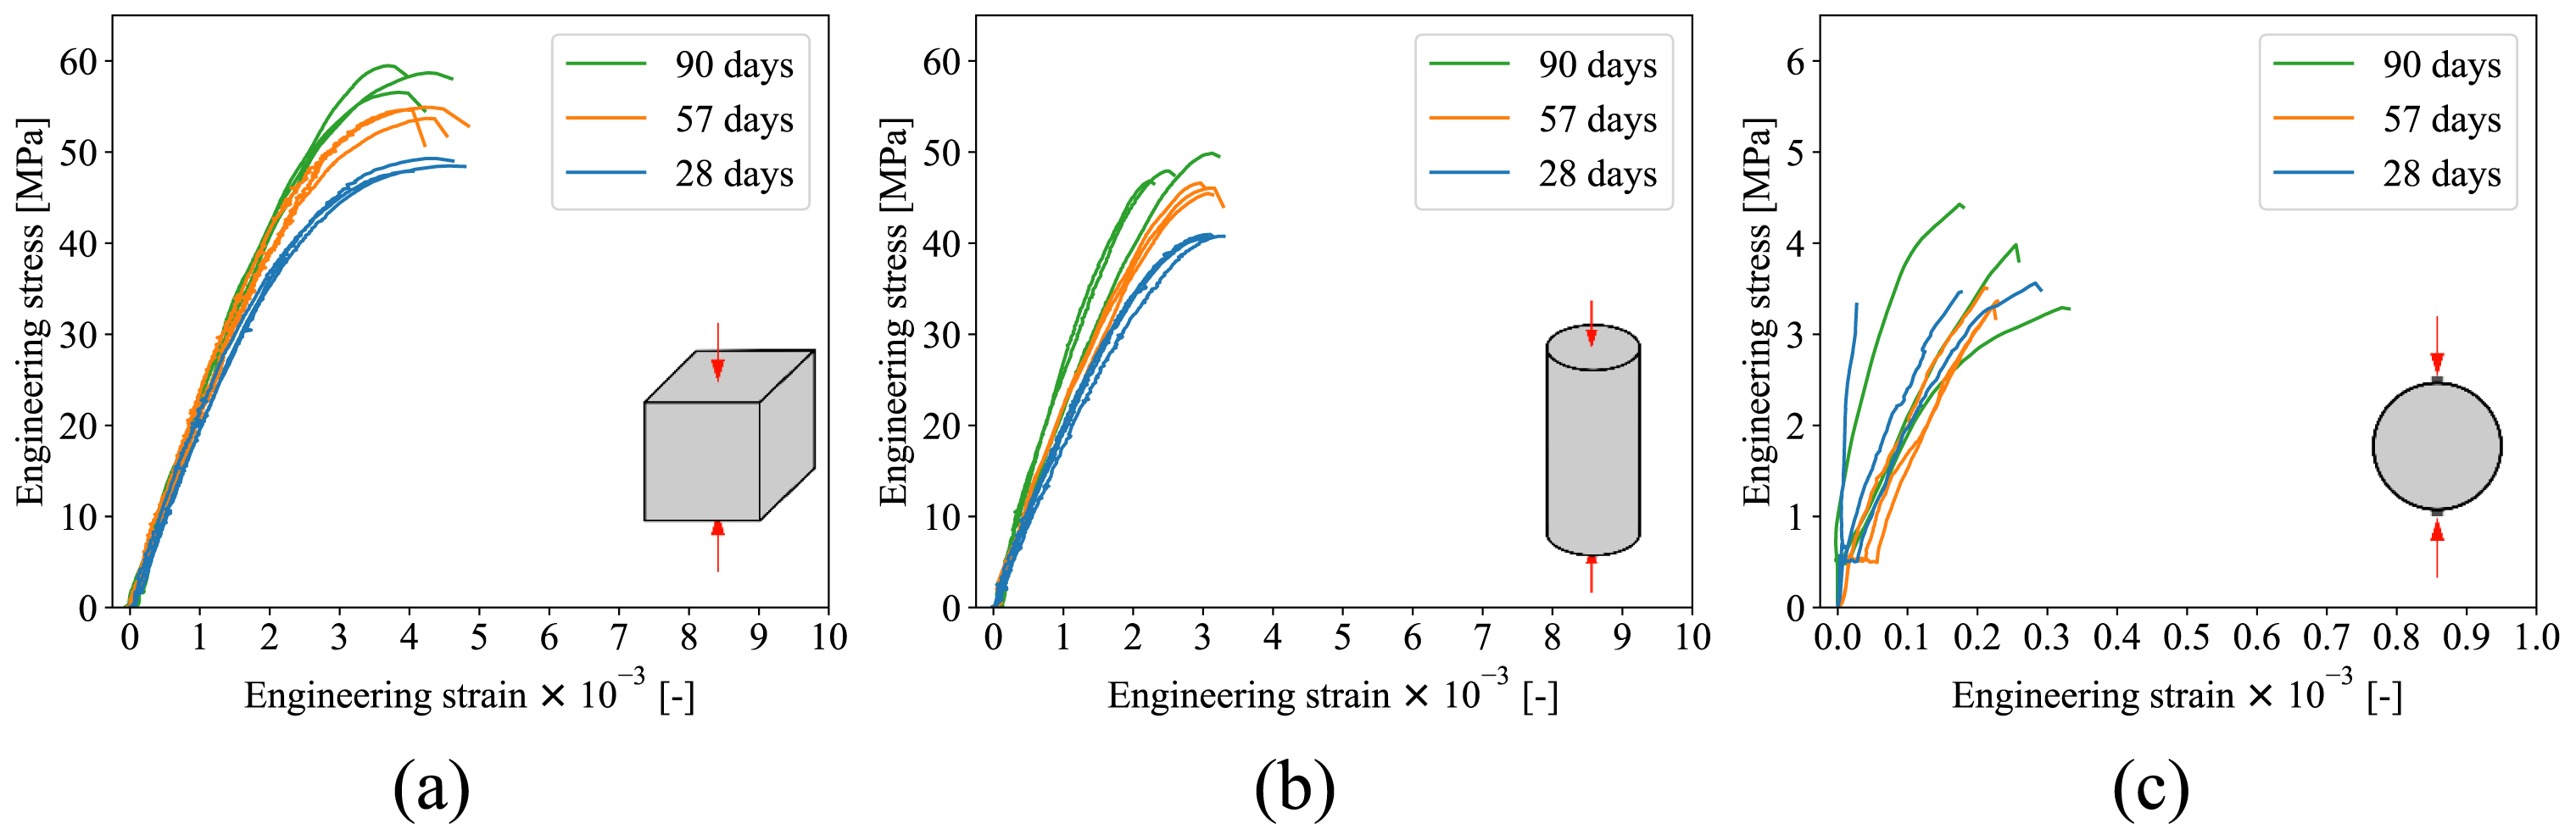
Ballistic impact tests
Experiment setup
We performed 20 out of 32 ballistic impact tests in a gas-gun facility thoroughly described by Børvik et al. (1999) at NTNU in Trondheim, Norway. The standard setup in the one-stage gas-gun uses air as the driver, which gives a maximum velocity around 360 m/s, limited by the speed of sound in air. From previous in-house experiments, we expected that significantly higher initial velocities were necessary to cause perforation in the 50 mm thick concrete slabs. For this reason, we employed helium as the driver, where the speed of sound is around three times higher than in air. The gas-gun with helium as driver was used for 10 tests with ball bearings, while we used a smooth-bored Mauser gun with a barrel length of 1 m for the 10 tests with the 7.62 mm APM2 cores. The APM2 cores were placed in a sabot, and we varied the initial velocity by changing the amount of gunpowder in the casing. We used two synchronised Phantom v2512 cameras with a frame-rate of 100 000 fps to capture the impacts; one on the frontside and one on the backside of the slabs. These 20 tests were performed 28–30 days post casting. The slabs were clamped horizontally at the top and bottom in the impact chamber and positioned for centre impact. Figure 3 shows schematics of the projectiles (a) and the slab (b) with nominal dimensions. The average initial masses of the ball bearings, FSPs, and APM2 cores were 13.8 g, 13.4 g, and 5.0 g, respectively. Note that the mass of the APM2 cores is less than half of the mass of the other projectiles. The diameter of the main part of the FSP is 12.6 mm, while the 12.7 mm diameter includes the lip on the back of the projectile. The lip allows the FSP to be fired without a sabot. The diameter of the APM2 core is 6.1 mm, but it is denoted as 7.62 mm APM2 core herein for standardisation purposes. Projectiles (a) and slab (b) with dimensions in mm. The red dot indicates the impact (centre) point of the slab. The FSP is rotated 90◦ between the two illustrations since it is not axisymmetric. The cover distance of the Ø10 mm rebar was 30 mm in both directions measured from the centre of the rebar.
The final 12 ballistic impact tests using the 12.7 mm FSPs were performed at the Norwegian Defence Estates Agency’s (NDEA) test facility in Horten, Norway. Due to procurement issues, these tests were performed 46-47 days post casting. We used a STZA 20 firing rig with a barrel length of 1.2 m to fire the FSPs with initial velocities between 450 and 1116 m/s, and two synchronised Phantom v2012 at 54 000 fps captured the impacts. These slabs were clamped at three corner points to a steel frame.
In all tests, we used Phantom’s Cine Viewer software to determine the projectile initial and residual velocities. A mounted magnetic nozzle velocity tool also measured the initial velocities in the FSP tests. The nozzle velocities differed 0-2% from the software measurements, supporting the use of the camera software to measure velocities.
Experiment results
Main results from the ballistic impact tests.
aMeasurement unavailable, projectile not recovered
Figures 4 and 5 show timelapses of three experiments each. It seems that initial velocities close to the ballistic limit velocity (Figure 4) cause larger fragments than velocities well above the ballistic limit (Figure 5), where the scabbing is dominated by dust and smaller fragments. Timelapses of three experiments with initial velocities close to the ballistic limit; (a) ball-bearing test 3 with vi = 522.6 m/s, (b) FSP test 12 with vi = 492.8 m/s, and (c) APM2 core test 3 with vi = 513.9 m/s. Timelapses of three experiments with initial velocities well above the ballistic limit; (a) ball-bearing test 4 with vi = 719.1 m/s, (b) FSP test 10 with vi = 1115.6 m/s, and (c) APM2 core test 8 with vi = 957.3 m/s.
Figure 6 shows the spalling and scabbing in three representative tests with approximately the same initial velocity. Figure 7 shows graphical representation of the spalling and scabbing for all the concrete slabs, with a heat map that shows the initial velocity. It is evident that the APM2 cores caused less surface damage than both the ball bearings and the FSPs. Generally, and concurrent with previous studies (Jacobsen et al., 2024; Kristoffersen et al., 2021), the scabbing is larger than the spalling. However, Figure 7 also shows that there is a significant amount of scatter in the surface damage. Spalling (top row) and scabbing (bottom row) for three slabs with approximately the same initial velocity. (a, d) Ball bearing at 641 m/s, (b, e) FSP at 634 m/s, and (c, f) APM2 core at 676 m/s. Spalling (top row) and scabbing (bottom row) measurements for all three projectiles. (a, d) 15 mm ball bearing. (b, e) 12.7 mm FSP. (c, f) 7.62 mm APM2 core.
Ballistic limit velocities and curves
In 1960, Recht and Ipson (Recht and Ipson, 1960) proposed an analytical model to compare ballistic resistance across target geometry, material characteristics and projectile characteristics. Through conservation of energy and momentum, the model defines a relation between the initial and the residual velocities, viz. Ballistic limit curves for all three projectiles. (a) 15 mm ball bearing. (b) 12.7 mm FSP. (c) 7.62 mm APM2 core. Parameters fitted to the Recht-Ipson model (equation (1)).
Numerical modelling
Material model and calibration procedure
All numerical simulations in this study were performed in the non-linear finite element solver LS-DYNA R15. A modified version of the Holmquist-Johnson-Cook model (Polanco-Loria et al., 2008), denoted the MHJC model, was used as the constitutive relation for the concrete. It is implemented as a user-defined material model in LS-DYNA. The model has previously been coined a good compromise between accuracy and ease-of-calibration (Antoniou et al., 2023; Kristoffersen et al., 2021). The main features of the material model are presented in the following.
The normalised deviatoric stress, 

The volumetric strain in the model is defined as μ = ρ/ρ0 − 1, where ρ and ρ0 are the current and initial densities of the material, respectively. The pressure-volume response links the volumetric strain μ to the pressure P, and the response is divided into three zones;
(1) A linear-elastic zone, limited by a crushing pressure Pcrush = fc/3, where the incremental pressure ΔP is calculated from
(2) The pore crushing zone, where volumetric plastic strains, Δμp, occur. The incremental pressure in this zone is found as
(3) In the third zone, it is assumed that all pores have been compacted, and the material adopts a non-linear elastic behaviour where
Damage is introduced in the model through the parameter D, defined by

Element erosion on tensile volumetric strain is implemented in the material subroutine, such that if the volumetric strain in an element falls below μfail, the element is removed from the simulation. This erosion criterion was not implemented in (Polanco-Loria et al., 2008). Note that tensile volumetric strains are defined as negative.
A significant feature of the MHJC model is that the pressure-hardening response is normalised with respect to the unconfined compressive strength, fc. The normalised equivalent stress is defined as (a) Principal stresses during a confined cylinder compression test and (b) Normalised equivalent stress, 


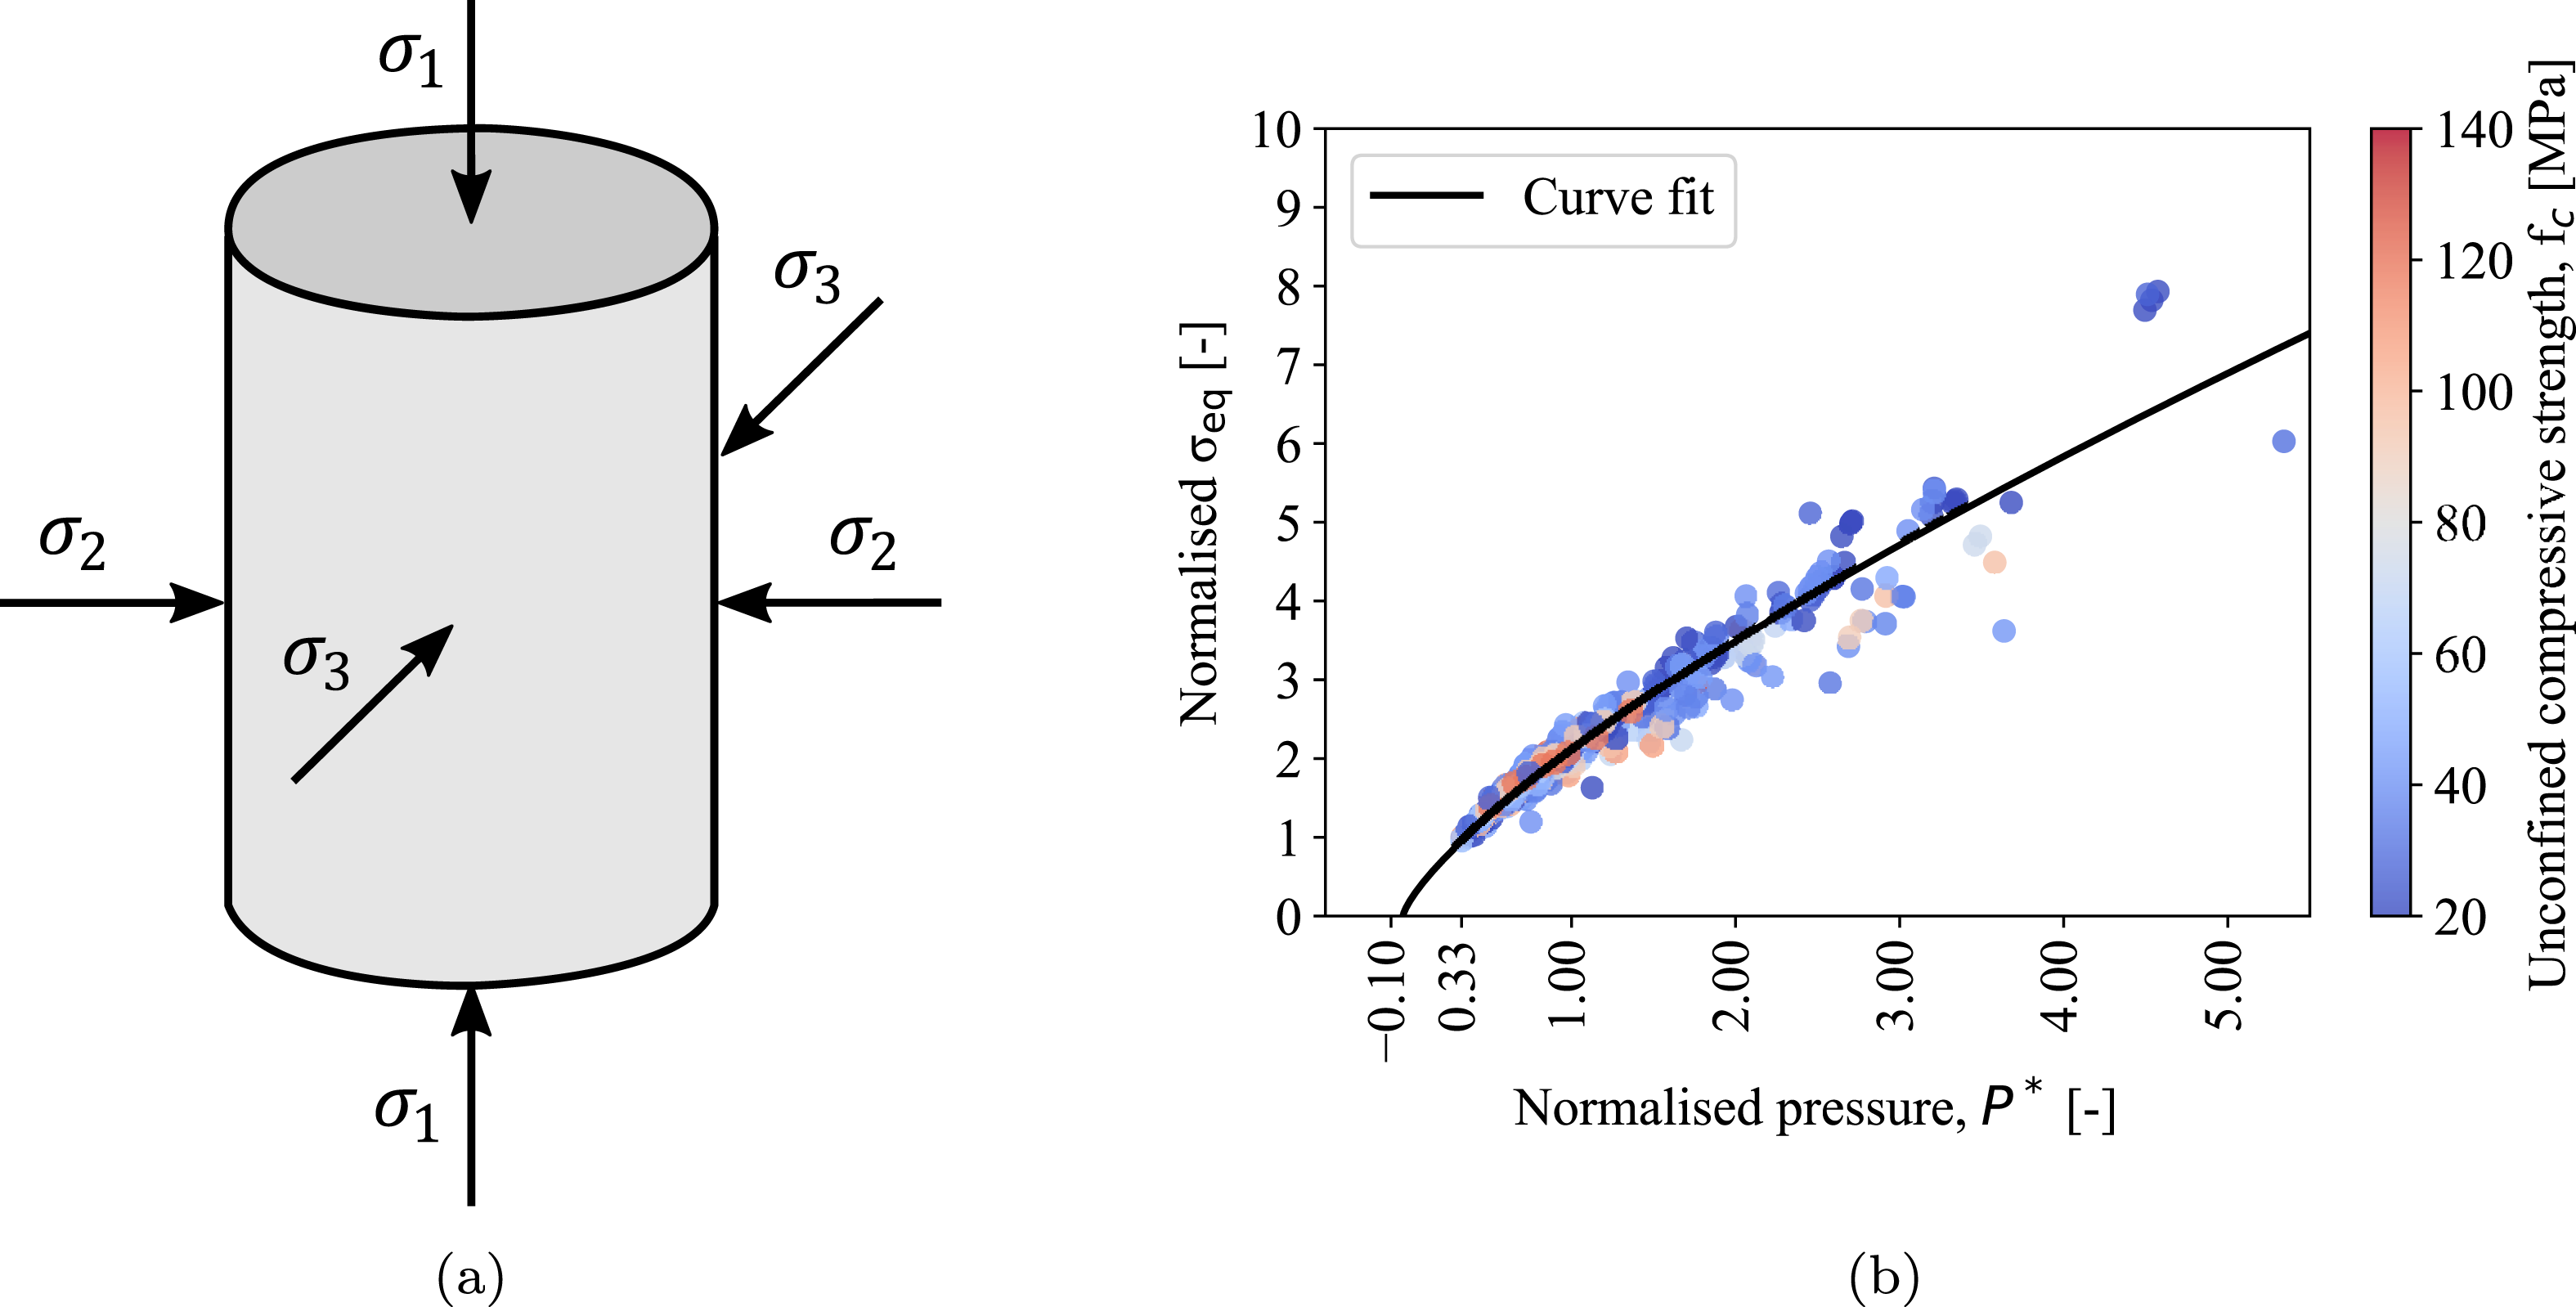
In the literature, authors regularly perform quasi-static compression tests on concrete cylinders under varying confinement pressures. To calibrate the pressure-hardening parameters B and N, we surged the literature for relevant data (Attard and Setunge, 1996; Farnam et al., 2010; Imran and Pantazopoulou, 1996; Lim Jian and Ozbakkaloglu, 2015; Lu and Hsu, 2006; Poinard et al., 2010; Ren et al., 2016; Setunge et al., 2016; Sfer et al., 2002; Taliercio et al., 1999; Wang et al., 2020; Willam and Warnke, 1975; Xie et al., 1995; Yang et al., 2022). All the collected literature data for the deviatoric response is plotted in Figure 9(b) where the colour bar indicates the unconfined compressive strength for the concretes. It seems that there is no clear distinction between low- and high-strength concretes. We used a least-squares optimisation to equation (2) to the data points in Figure 9(b). Additionally, the curve was forced through the point
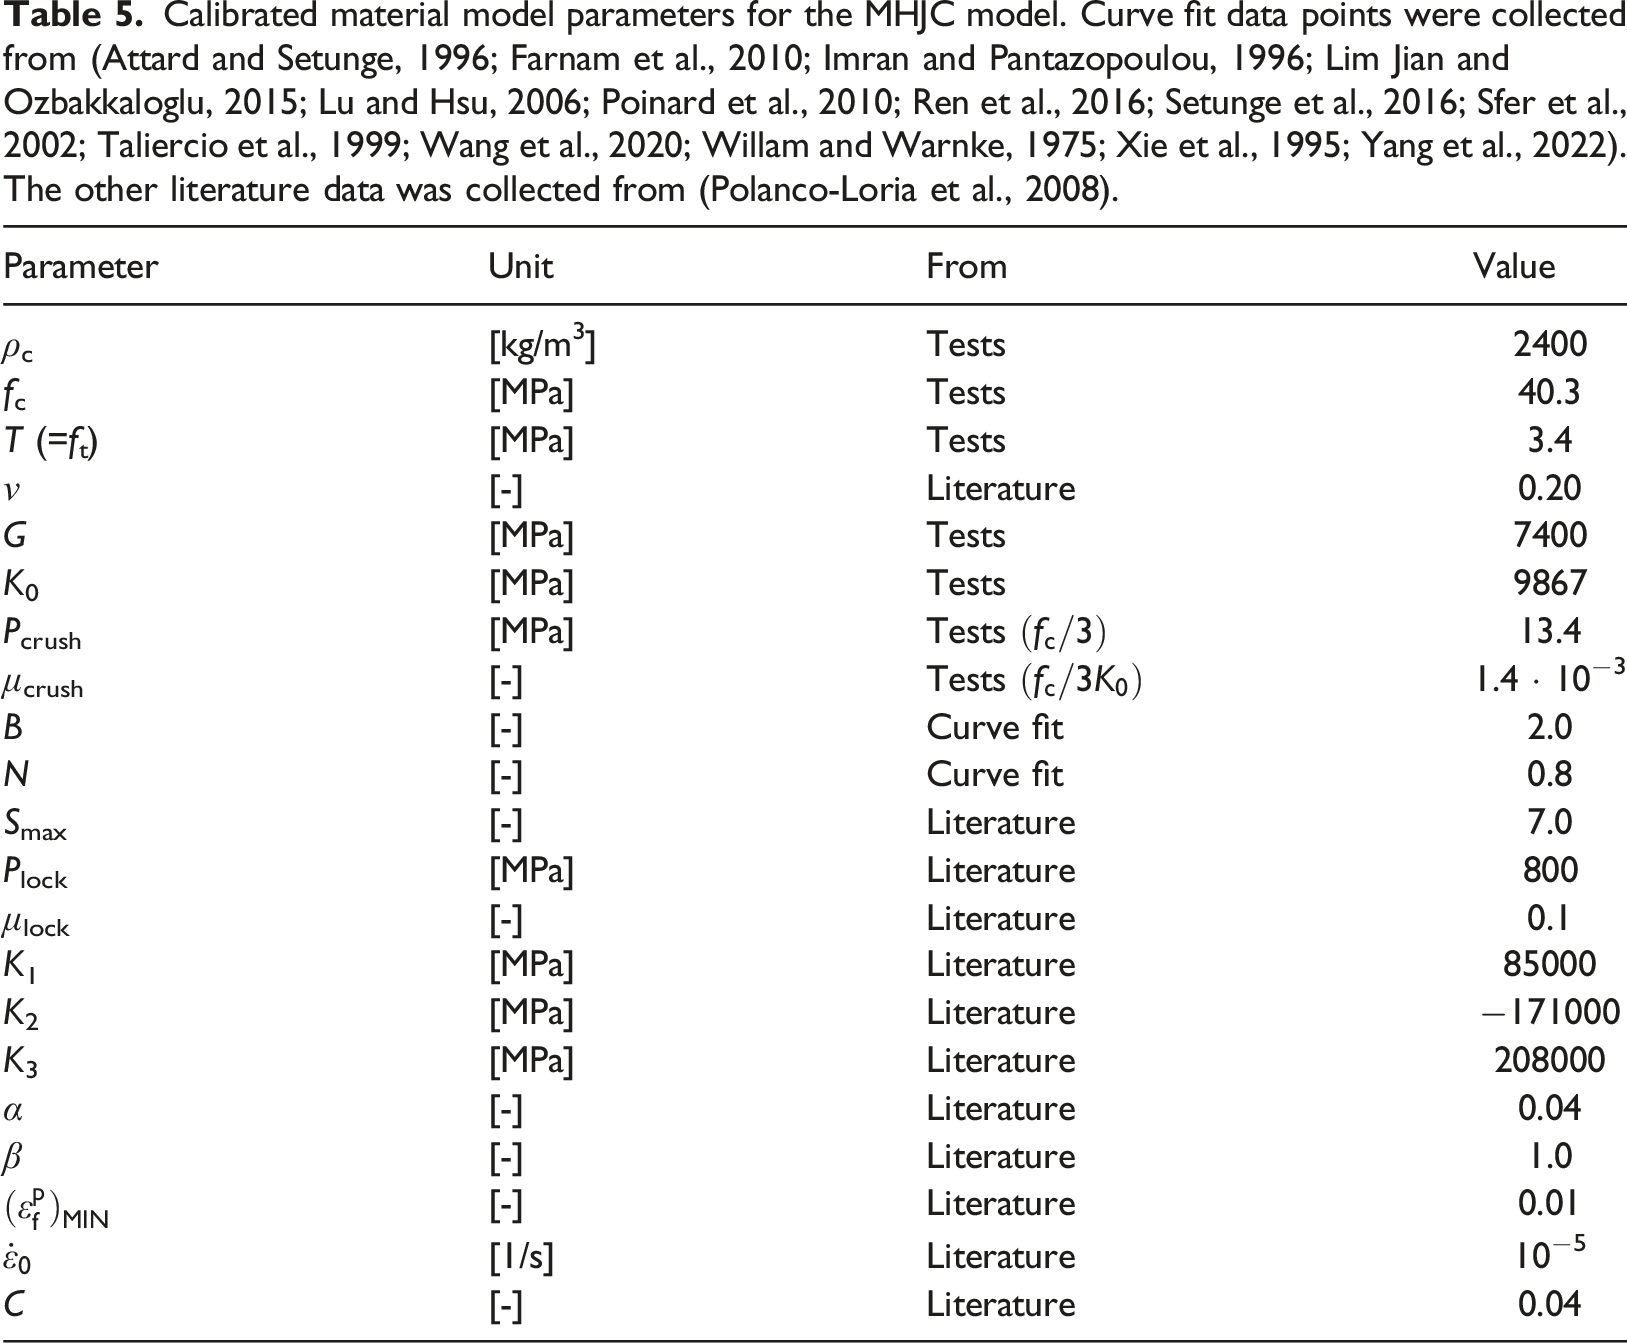
Calibrated material model parameters for the MHJC model. Curve fit data points were collected from (Attard and Setunge, 1996; Farnam et al., 2010; Imran and Pantazopoulou, 1996; Lim Jian and Ozbakkaloglu, 2015; Lu and Hsu, 2006; Poinard et al., 2010; Ren et al., 2016; Setunge et al., 2016; Sfer et al., 2002; Taliercio et al., 1999; Wang et al., 2020; Willam and Warnke, 1975; Xie et al., 1995; Yang et al., 2022). The other literature data was collected from (Polanco-Loria et al., 2008).
Validation of material parameters
We set up four models in LS-DYNA R15 to evaluate our material model calibration using data from the quasi-static material tests: an axisymmetric and a solid model of the cylinder compression test, and solid models of the cube compression test and the tensile splitting test, all of which are shown in Figure 10. The compression models consisted of a rigid steel platen, the concrete cylinder and a moving top plate, corresponding to the experiments. The engineering stress was found by tracking the force in the concrete cylinder with a planar cross-section and dividing by the initial area of concrete specimen, while the engineering strain was found by tracking the displacement of a node in the moving steel platen and dividing by the concrete specimen height. The engineering strain in the tensile splitting model was found from the transverse displacement of two nodes on one of the flat surfaces of the concrete cylinder. We used an automatic surface-to-surface contact in all four models with static and dynamic friction coefficients set to 0.4, which was inside the range of 0.2 − 0.6 proposed by Baltay and Gjelsvik (1990). A previous study showed that varying the friction coefficient within this range did not give any notable differences for similar simulations (Kristoffersen et al., 2021). Instead of using steel platens, we used two wooden strips for the tensile splitting tests, like in the experiments. The meshes are shown in Figure 10. Meshes from the material test simulations. The zoomed in parts show close-ups of the element sizes. (a) Axisymmetric cylinder compression. Element size 0.5 mm. (b) Solid cylinder compression. Element size 1.0 mm. (c) Solid cube compression. Element size 1.0 mm. (d) Solid tensile splitting. Element size 1.0 mm.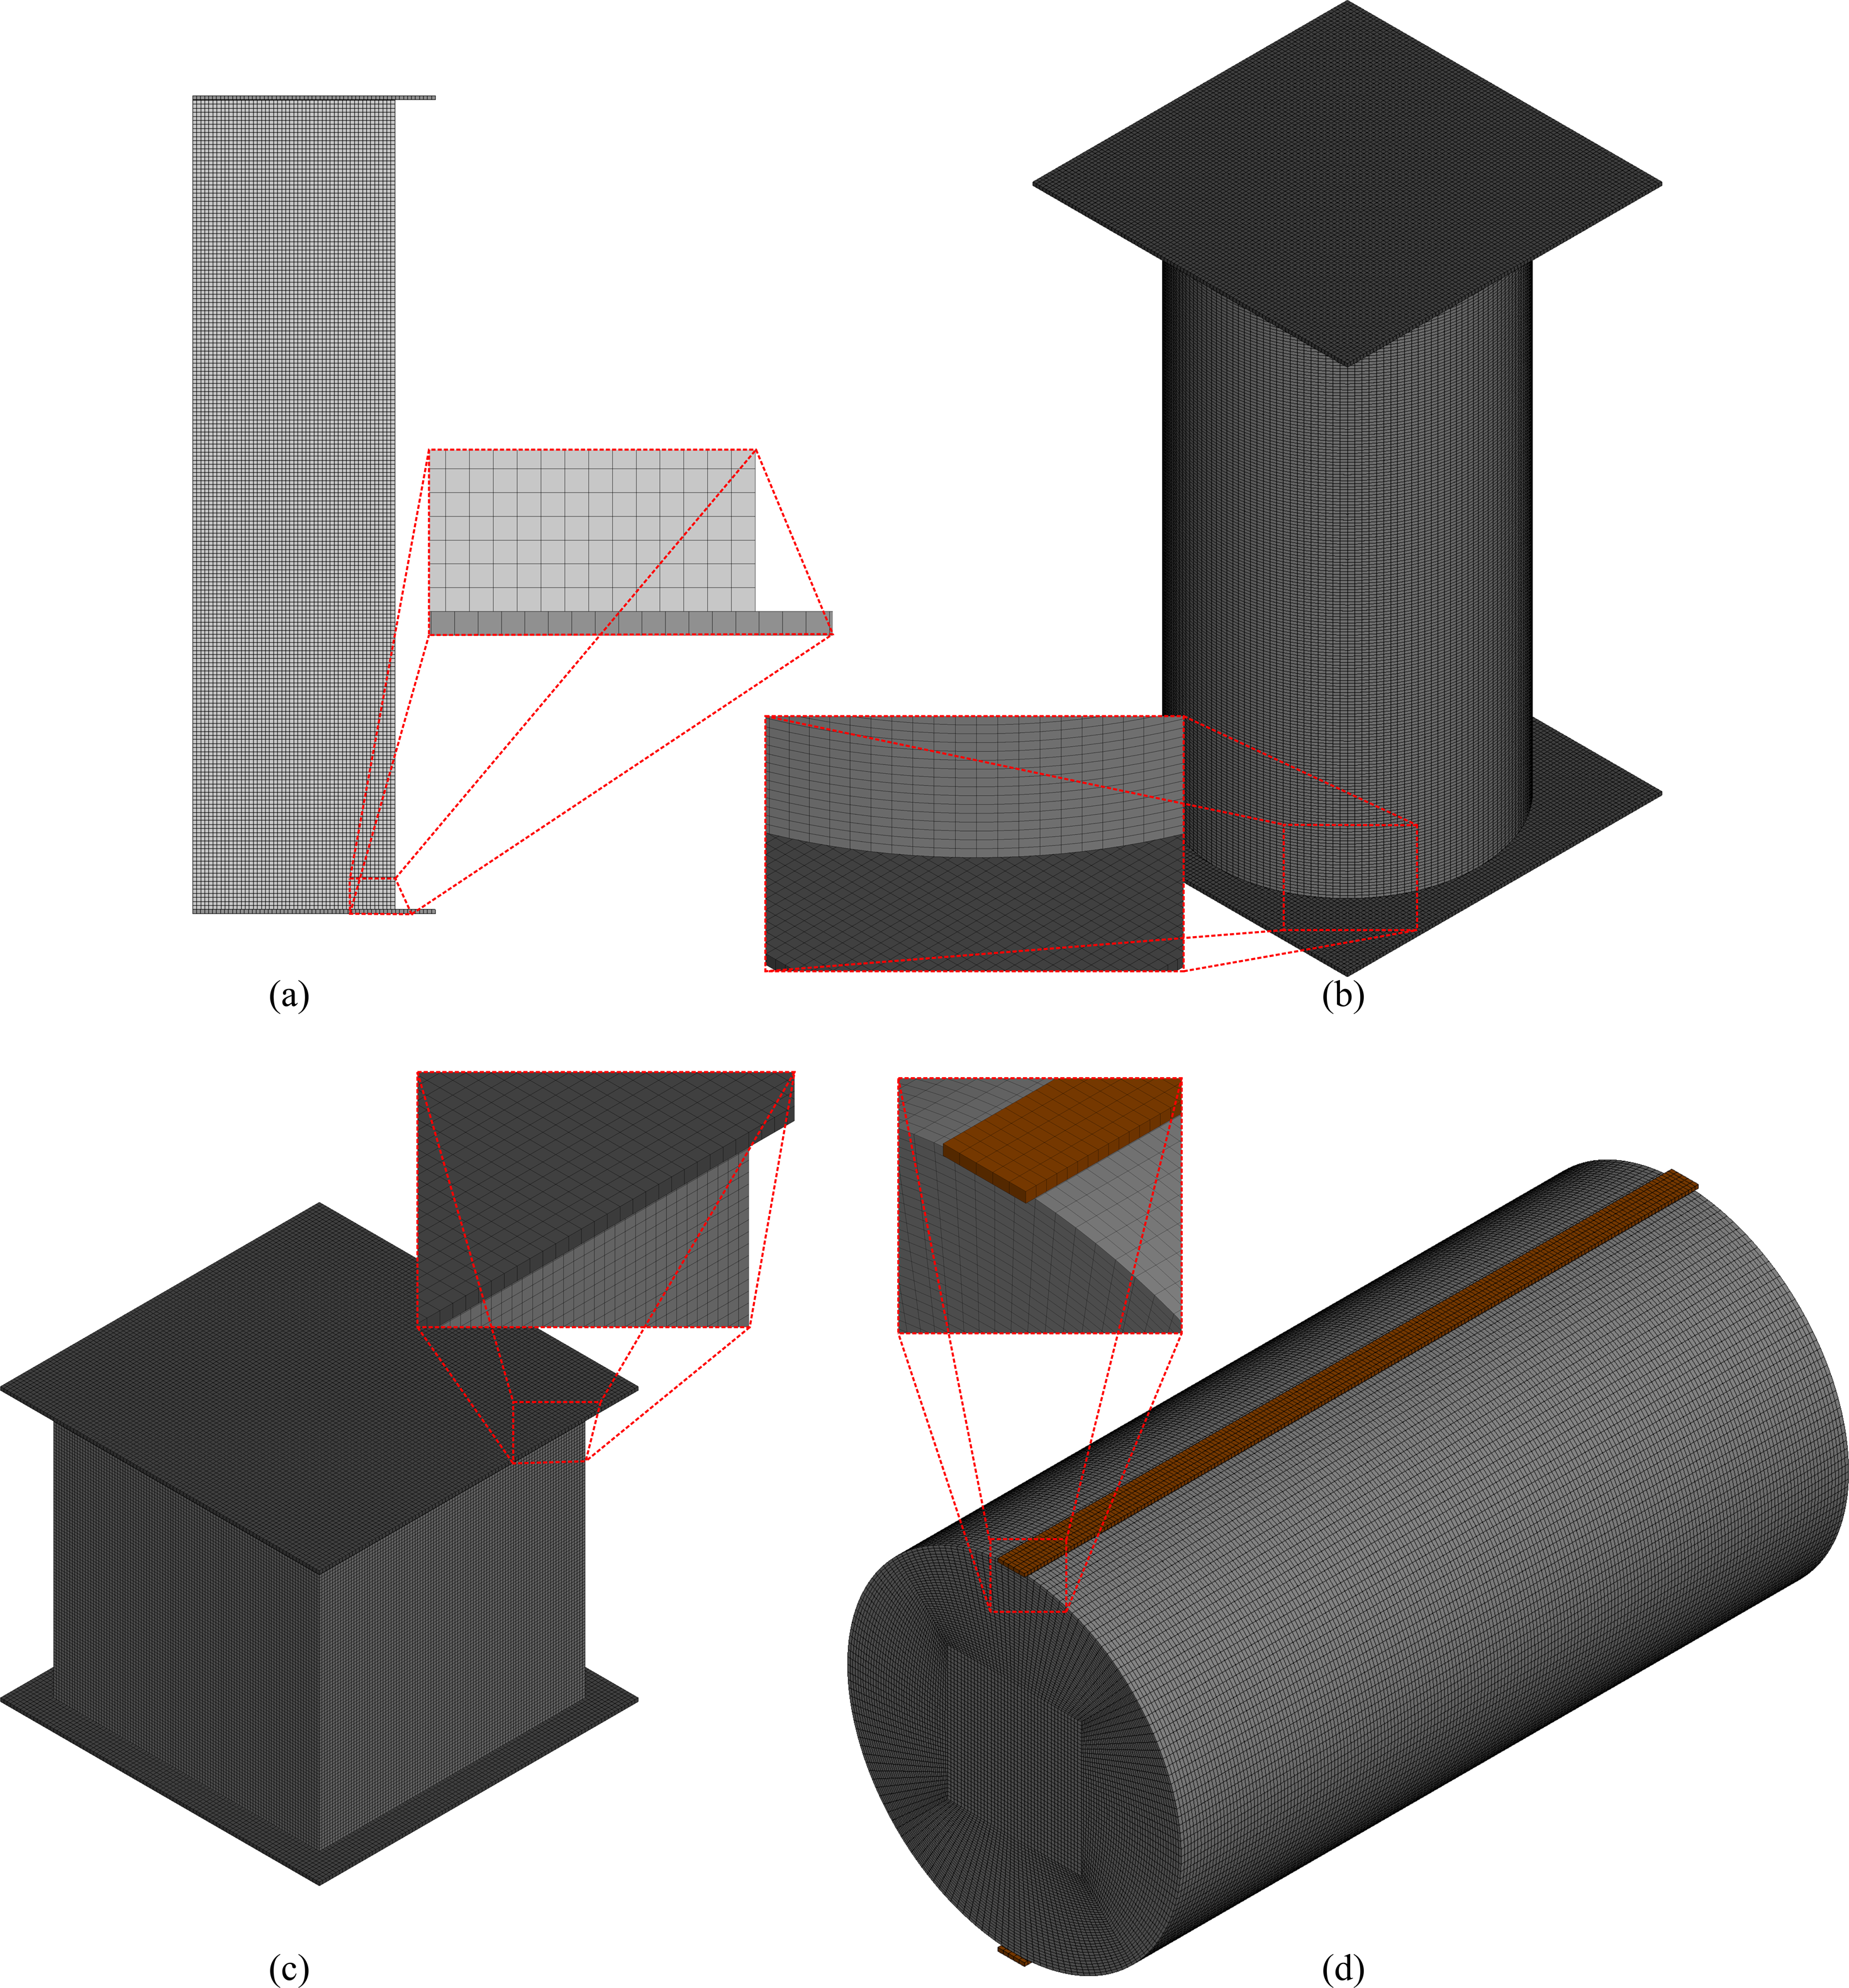
The density, Young’s modulus and Poisson’s ratio of the steel platens were set to 7800 kg/m3, 210 GPa and 0.3, respectively, and 800 kg/m3, 50 GPa and 0.3 for the wooden strips, which is standard material data for both materials. In order to time-scale the models, we set the strain-rate sensitivity parameter C to zero. The element size hel was set to 0.5 mm for the axisymmetric model, and 1 mm for the solid models. The results from the validation simulations are shown in Figure 11. The material calibration is able to capture the material behaviour quite well for all four models. Note that the stress-strain curve from the splitting simulation was cut at the maximum stress level. The setup of the axisymmetric ballistic model is shown in Figure 12. Numerical validation of material parameters using four different models. (a) Axisymmetric cylinder compression. Element size 0.5 mm. (b) Solid cylinder compression. Element size 1.0 mm. (c) Solid cube compression. Element size 1.0 mm. (d) Solid tensile splitting. Element size 1.0 mm. Setup of the axisymmetric ballistic model. (a) The projectiles with meshes and (b) ballistic impact model, shown here for the ball-bearing projectile. The side length in the x-direction has been cut for illustrative purposes. Dimensions in mm. The element size for the slab was 0.5 mm.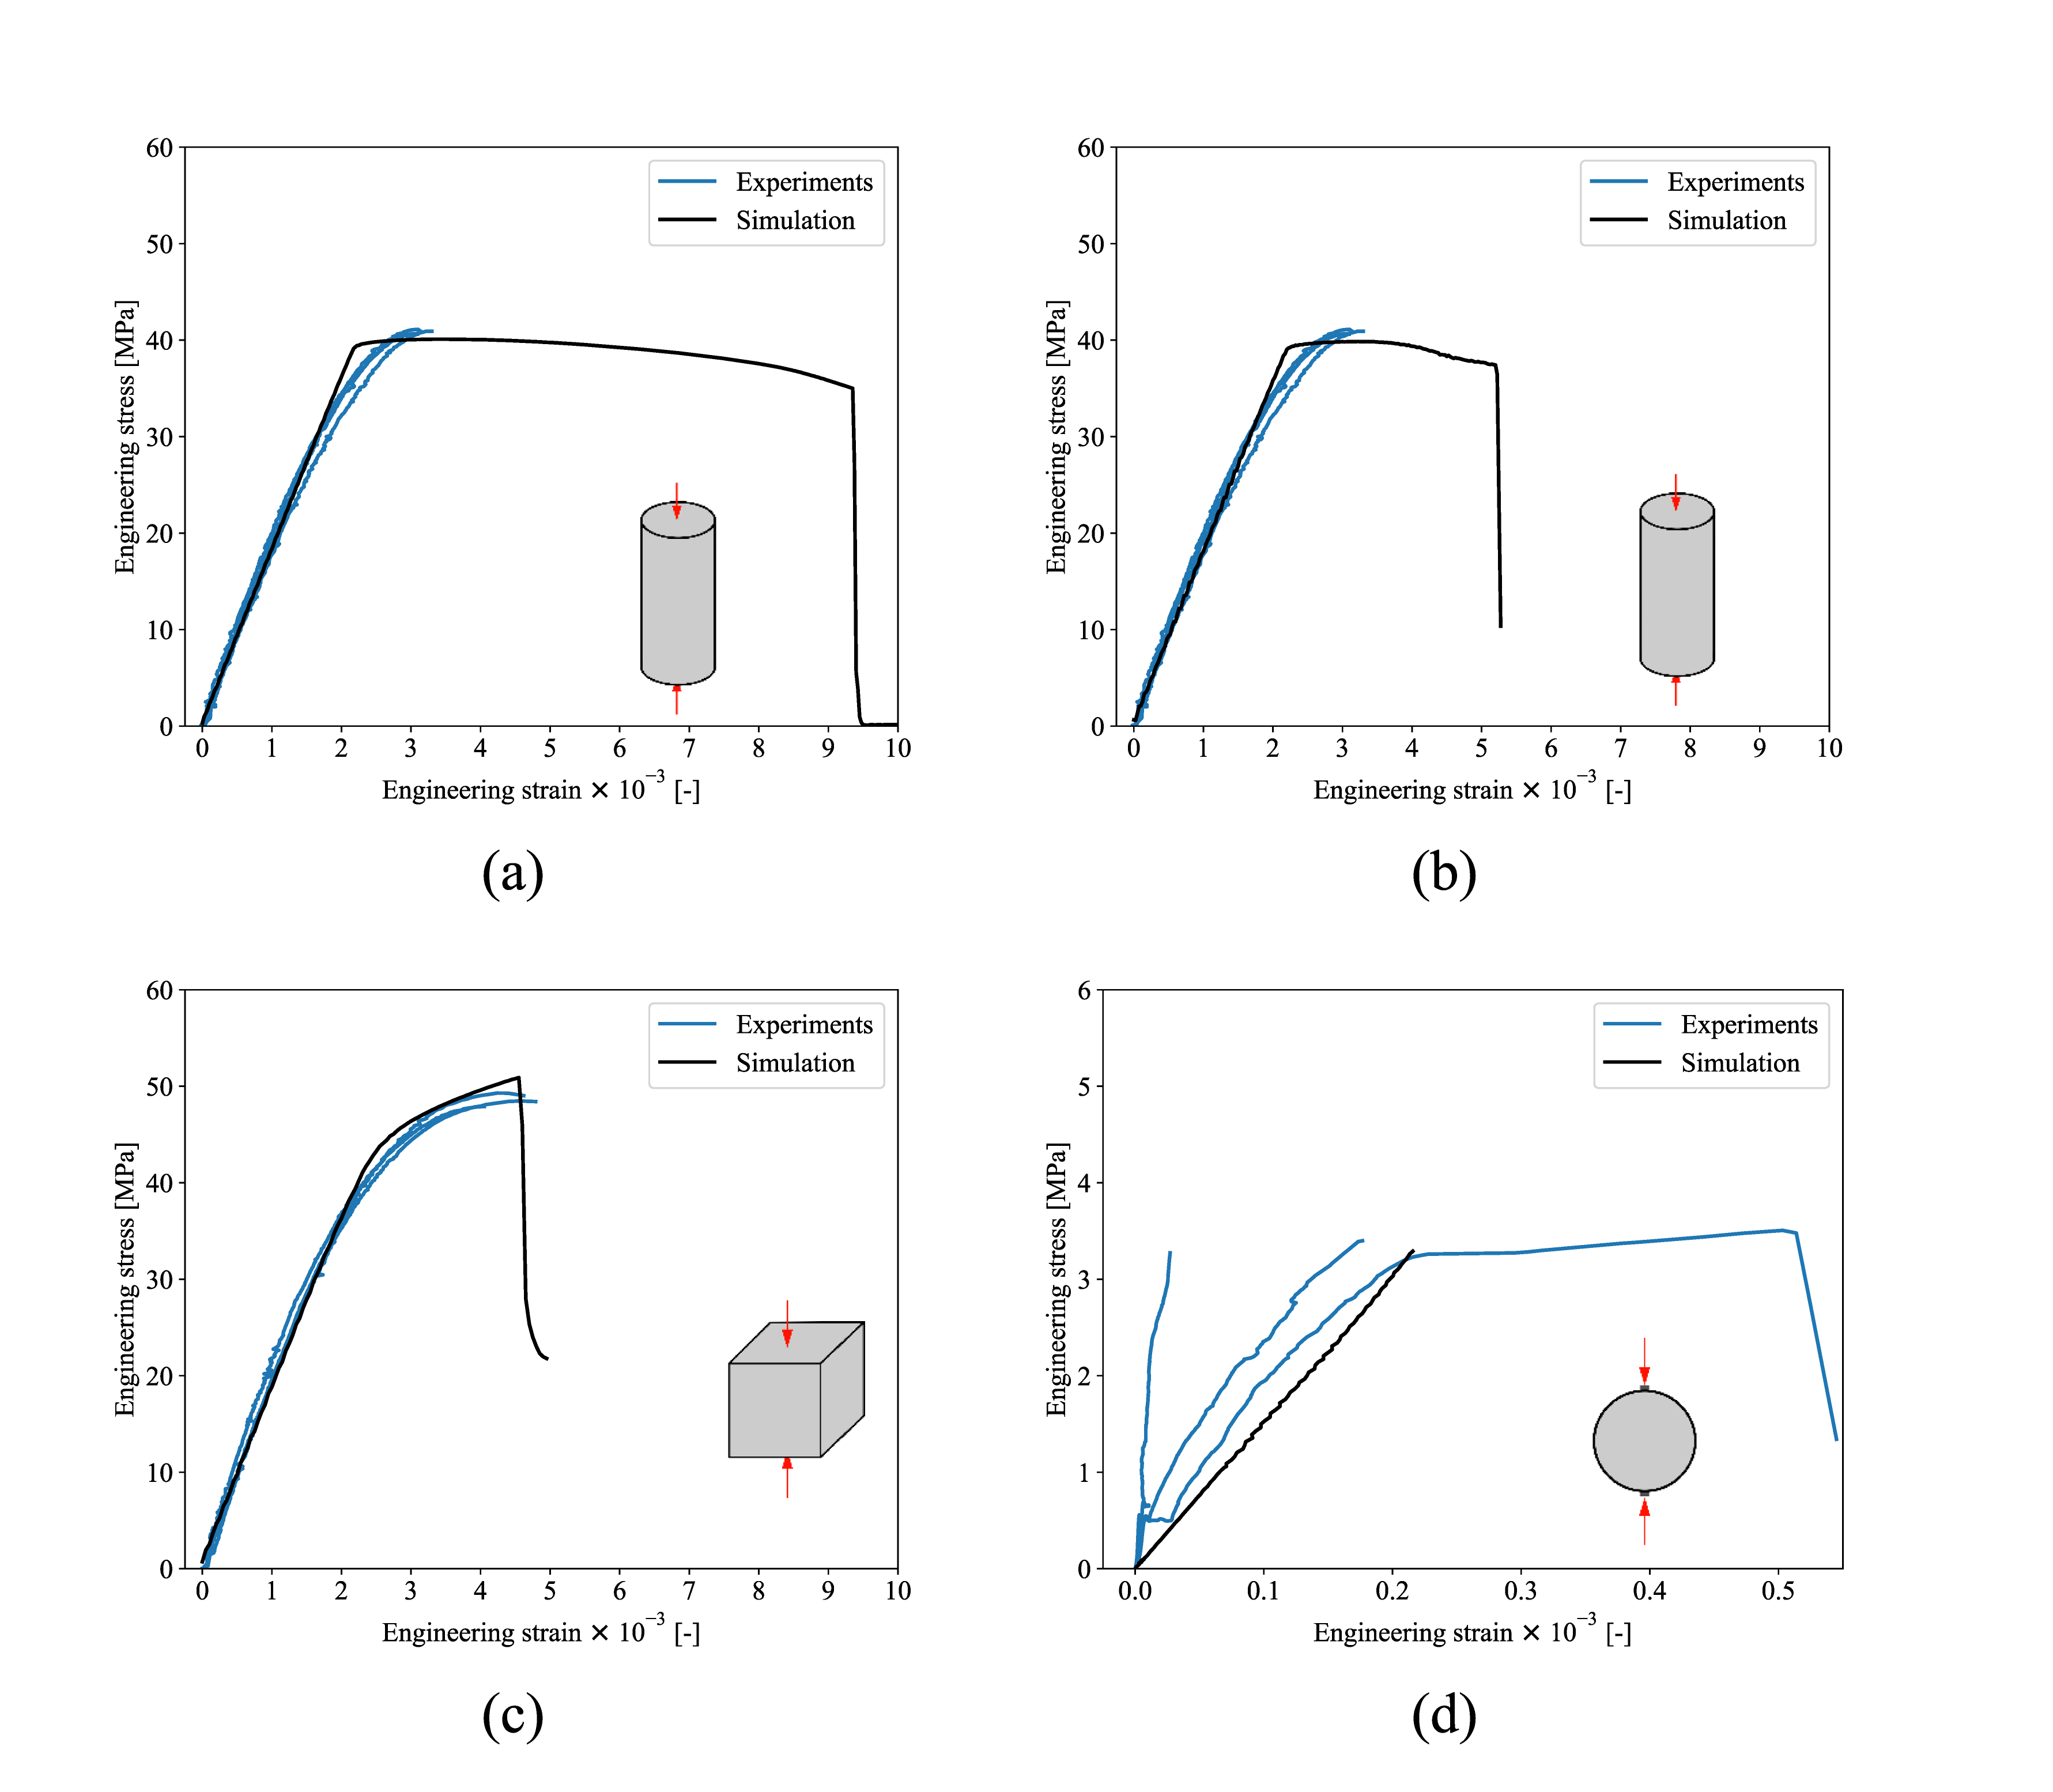
Axisymmetric ballistic model
Model description of the axisymmetric ballistic model.
The ballistic limit curves from the numerical models are compared to the experiments in Figure 13. It seems the axisymmetric numerical model is very capable of capturing the behaviour of the concrete slab. Interestingly, the ballistic curves for the two FSP configurations encapsulates the curve from the experiments. The resulting parameters from a least-squares fit of equation (1) to the data points in Figure 13 are presented in Table 7. Here, the two well-defined geometries (ball bearing and APM2 core) are both on the conservative side compared to the experiments. The simulated times were between 0.5-3 ms, resulting in CPU times between 20 and 120 minutes on 16 CPUs on a high-performance cluster. Contour plots of the total damage, D, are shown in Figures 14 and 15. Note that the contour plots have been cropped to better show the impact zone on the slabs. All three simulations with low initial velocity produce a small plug in front of the projectile, while the higher initial velocities seem to produce larger fully-damaged areas. In some of the simulations, a few elements reached a damage level of D = 1 at the support. All simulations have some damage lines propagating from the impact zone, qualitatively resembling cone-shaped cracks observed in the experiments. Ballistic limit curves for (a) 15 mm ball bearing, (b) 12.7 mm FSP with two different shapes, and (c) 7.62 mm APM2 core from axisymmetric numerical model. Parameters fitted to the Recht-Ipson model (equation (1)). Contour plots of three simulations with initial velocities close to the ballistic limit; (a) ball bearing with vi = 470 m/s, (b) sharp nosed FSP with vi = 440 m/s, and (c) APM2 core with vi = 430 m/s. Contour plots of three simulations with initial velocities well above the ballistic limit; (a) ball bearing with vi = 720 m/s, (b) sharp nosed FSP with vi = 900 m/s, and (c) APM2 core with vi = 960 m/s.
Numerical predictions of mass loss using axisymmetric model
We have also created a tool in Python that uses the data in the LS-DYNA d3plot-files to identify how much mass from the concrete slab that turns into fragments. The sum of fragment masses can be considered the mass loss of the slab. There are two main features that need to be sorted out to get a reasonable fragment mass from the numerical model; how do we identify if an element is a fragment element?, and; how do we find the mass of this element?. In this paper, we present two ways to identify if an element is a fragment element: (1) An element is part of a fragment when the damage, D, is above 0.99; or (2) An element is part of a fragment when the total displacement of the element centre is greater than 5.0 mm (10% of the slab thickness). Since the slab is axisymmetric, each element represents a hollow cylinder when rotated about the symmetry axis. Each of these hollow cylinders has an area A in the xy-plane, and a radius rmid. The radius is considered as the distance from the y-axis (the symmetry axis) to the average of the x-coordinates of the element nodes. By multiplying this volume by the initial concrete density, we get a representative mass of the element. Figure 16 shows the mass loss from the numerical model compared to the experiments, using the total damage D >0.99 as criterion for fragment identification. The figure shows that the mass loss predicted by the numerical model using the total damage criterion is significantly higher than in the experiments. Figure 17 shows the mass loss from the numerical model compared to the experiments, using the total displacement greater than 5.0 mm as criterion for fragment identification. Note that the choice of the value of 5.0 mm for fragment identification did not stem directly from any experiment, but gave decent results compared to the experiments for all projectiles. Numerical mass loss with D >0.99 as criterion compared to experiment mass loss for (a) ball bearing, (b) APM2 core, (c) flat-nosed FSP, and (d) sharp-nosed FSP. Eroded mass is included in total mass. Numerical mass loss with total displacement greater than 5.0 mm as criterion compared to experiment mass loss for (a) ball bearing, (b) APM2 core, (c) flat-nosed FSP, and (d) sharp-nosed FSP. Eroded mass is included in total mass.
Parameter study on axisymmetric ball-bearing model
To study the effect of material parameters and numerical parameters on the ballistic response in the axisymmetric model, we created two sets of full-factorial analyses (Walpole et al., 1993) for vi = 720 m/s. The first set (left column in Figure 18) is for parameters that are related to the material behaviour, namely the maximum hydrostatic tension (T), the strain-rate parameter (C), the pressure-hardening coefficient (B) and the maximum normalised deviatoric stress (Smax), while the second set (right column in Figure 18) is related to less physical, numerical parameters, namely the hydrostatic tensile strain at failure (μfail), a fracture shear strain ( Full-factorial plots for ball-bearing simulations. Initial velocity is 720 m/s. The target values are: (a, b) residual velocity vr, (c, d) number of eroded elements, and (e, f) mass loss.
The diagonal subplots in Figure 18 show the main effects of varying a single parameter, while the off-diagonal subplots quantify the interactions between pairs of parameters. A total of 60 (36 + 24) analyses are summarised in Figure 18, all using the ball bearing as projectile. The figures show how the residual velocity is affected, how many elements are deleted and how the mass loss is affected by changing the model parameters. It is interesting to see that the numerical parameters in the right column (μfail, hel and TSSFAC) that are hard to quantify experimentally affect the response. Since the numerical parameters affect the response to such an extent, the results show that one should exercise caution when using a numerical model to predict ballistic response without experiment data in the same domain as the numerical simulations.
Discussion
The results from the ballistic experiments revealed that the three projectiles produced ballistic limits with practically no difference. This is probably coincidental and should not be given too much significance in the analysis of the results. It is interesting to see that the ballistic experiments result in an exponent p from equation (1) that is closer to 1.0 than 2.0, suggesting a more linear trend in the ballistic limit curve, which is also the case for concrete slabs in studies with larger projectiles (Jacobsen et al., 2024; Kristoffersen et al., 2021). Further, and despite weighing less than half of the other two projectiles, the APM2 cores gave significantly higher residual velocities for initial velocities well above vbl due to its pointy geometry and higher length-to-diameter (Lp/Dp) ratio. The APM2 cores had Lp/Dp ≈ 4.5, while the FSPs and ball bearings had values of approximately 1.2 and exactly 1.0, respectively. This is also concurrent with previous studies (Brown et al., 2021). The difference in resistance when considering the projectile nose shape is also concurrent with previous studies (Rosenberg and Kositski, 2016; Rosenberg and Vayig, 2024). In addition, a projectile with a smaller diameter has to move away less mass during the penetration process. It is also evident when we look at the normalised residual kinetic energy (i.e., the residual kinetic energy normalised with respect to the initial kinetic energy) plotted against the initial kinetic energy in Figure 19 that the kinetic energy absorbed by the concrete slab is much lower for the APM2 cores. The figure shows that the required kinetic energy to perforate the slab is approximately 1/3 for the APM2 cores compared to the ball bearings and FSPs. Evidently, it is difficult to quantify both mass and shape of an actual fragment from an explosion. The APM2 projectile is specifically designed to perforate high-strength metal armour, which explains its superior perforating ability. Of the three projectiles investigated, the APM2 cores can certainly be considered as worst-case fragments in terms of residual velocity. Normalised residual kinetic energy plotted against the initial kinetic energy for the three projectiles. (a) Is not normalised with respect to the energy required to perforate the slab for the given projectile, while (b) is.
In this study, the pressure-hardening parameters B and N were curve fitted using material data from the literature, and we assumed that the maximum hydrostatic tensile stress was equal to the tensile splitting strength, ft. The parameter study herein shows that there is a notable effect on the residual velocity when reducing the tensile capacity to ft/3. The two pressure-hardening curves that are obtained with B = 1.5 and B = 2.3 encapsulate almost all the data points obtained from literature data (in Figure 9(a)), shown in Figure 20. Figure 18(a) showed, as expected, that varying B affects the residual velocity when the initial velocity is well above the ballistic limit. There is also a notable interaction effect between B and Smax. Ideally, one would perform a set of triaxial tests under varying confinement pressure to obtain data for the specific concrete, but this is both costly and difficult. It is evident that we can obtain decent results for the ballistic response by curve fitting the pressure-hardening response to relevant material data from the literature. Normalised equivalent stress plotted against normalised pressure for two values of B, and N = 0.8.
The value for C = 0.04 is taken directly from the paper by Polanco-Loria et al. (2008). In their paper, they identified C by inverse modelling the numerical model to a single data point in terms of residual velocity, and used this to predict the entire residual velocity diagram. It is not certain that this is the best way to calibrate this parameter. The parameter study (in Figure 18(a)) showed that alongside Smax, C had the greatest effect on the residual velocity. There is also a strong interaction between the two parameters; when increasing both C and Smax, the resistance in the material model increases significantly. Furthermore, the results are highly mesh sensitive, which is evident from Figure 18(b) and (d). It is thus advised to make conservative choices.
It is well known that high pressures are involved when concrete is subjected to ballistic impact, especially under the projectile nose. Thus, the equation-of-state (which quantifies the pressure-volume response of the material) will clearly affect the concrete response. By varying the transition from pore-crushing (equation (5)) to a fully compacted material (equation (6)), we can investigate how the equation-of-state affects the ballistic response for the numerical model. We investigated three values each for Plock and μlock, with resulting ballistic limit plots shown in Figure 21. All simulations in Figure 21 were performed using the ball-bearing projectile. Both when Plock and μlock vary, the volumetric strain hardening modulus H varies, i.e., the stiffness in the pore crushing zone changes. It transpires that reducing Plock results in greater difference between the projectiles for velocities well above vbl. Reducing μlock to 0.05 causes a decrease in vbl. The material model is defined such that only the deviatoric response is rate-dependent. It is uncertain whether rate-dependency should also apply to the equation-of-state in a dynamic problem. The influence of the volumetric strain rate on the pressure would be quite difficult to measure, as one would have to set up hydrostatic experiments under varying strain rates. Data from isotropic triaxial tests are available in the literature (Feldgun et al., 2024; Yankelevsky et al., 2023). Since the hydrostatic pressure-volumetric strain relation is related to the pore volume of the concrete, rather than the unconfined compressive strength, a normalisation scheme based on the pore volume would be interesting to consider. However, we have not tried to quantify this relation in the current study. Ballistic limit plots when changing the parameters that indicate the transition from the compaction part to the fully granular part of the pressure-volume response of the concrete. (a) Varying locking pressure, Plock. (b) Varying volumetric locking strain, μlock.
Further, we used element erosion to delete elements that had either reached a critical volumetric strain value (μfail = −0.5) or a critical timestep (Δtcrit = Δtinit/100). Commonly in the literature, elements are eroded on some arbitrary strain value, and previous studies (Baranowski et al., 2021; Jacobsen et al., 2023; Luccioni et al., 2013) have shown that varying the critical strain for the concrete will affect the numerical results, and in practice allows the user to match the numerical results to the experiments using a non-physical parameter. Figure 18(f) also shows that
Conclusions
From the experimental campaign in this study, the following conclusions can be drawn: • Ballistic experiments with initial kinetic energy over one order of magnitude revealed similar ballistic limit velocities for three different small projectiles penetrating and perforating 50 mm thick concrete slabs. • For higher initial velocities, the results differed in terms of residual velocity and damage on the concrete slabs. The 7.62 mm APM2 cores proved to have significantly higher residual velocities than the 12.7 mm FSPs and the 15 mm ball-bearing projectiles for initial velocities well above the ballistic limit velocity.
From the numerical modelling in this study, the following conclusions can be drawn: • From material testing, relevant literature material data and reasonable modelling choices, we can reproduce the experiment results in terms of residual velocity and mass loss using an efficient axisymmetric numerical model. • The numerical models are sensitive to necessary numerical parameters that are hard to quantify from physical experiments. These should therefore be checked carefully when using numerical models to predict ballistic response of concrete and other brittle materials.
Footnotes
Acknowledgements
The work in this study has been carried out with financial support from the Centre for Advanced Structural Analysis (CASA), Centre for Research-based Innovation, at the Norwegian University of Science and Technology (NTNU), the Norwegian Defence Estates Agency (NDEA), and the Research Council of Norway through project no. 237885 (CASA). We would like to extend our gratitude towards Trond Auestad, Kåre Olsby, Runa Kierulf and Karoline Mikalsen for assistance with the experimental works. We also wish to thank Dr Benjamin Stavnar Elveli at NDEA for fruitful discussions about the material modelling.
Declaration of conflicting interests
The author(s) declared no potential conflicts of interest with respect to the research, authorship, and/or publication of this article.
Funding
The author(s) disclosed receipt of the following financial support for the research, authorship, and/or publication of this article: this work was supported by the Norges Forskningsråd; 237885