
Abstract
Concrete is used for protective structures all over the world. Accurate response estimates to a given threat is vital for designing such structures. Concrete models often require numerous input parameters for which sufficient experimental data can be challenging to obtain. Some models are accompanied by parameter generators which use the unconfined compression strength to extrapolate the remainder of the parameters based on experimental databases. This study investigates simulation of ballistic impact on high-strength concrete with 75 MPa nominal unconfined cylindrical compressive strength. The first objective is to investigate the accuracy parameter generators to produce input data for commonly used concrete material models. The second objective is to establish and evaluate a simplified parameter calibration procedure based on standard material experiments and data from the literature. The results employing parameter generators varied notably between the models while still giving decent ballpark estimates. The parameters obtained from inverse modelling of standardized material tests improved the results significantly. The findings of this study recommend caution when using automatic parameter generators. Although a detailed calibration of these concrete models is complicated, a simplified calibration gives reasonable predictions, making this the advisable approach for designing concrete protective structures.
Introduction
Concrete is the most used construction material in the world. When weight and space are not constraints, concrete is the preferred option for critical infrastructure, nuclear reactors, protective structures and general fortification (Corbett et al., 1996). Because of its ubiquitous use, there are numerous studies on the behaviour of concrete subjected to extreme loadings, for example, vehicle collision (Do et al., 2019; Yonten et al., 2005), explosions (Kristoffersen et al., 2021a; Silva and Lu, 2009) and ballistic impact (Frew et al., 1998; Hanchak et al., 1992). Studies of this kind are in general divided into experimental investigations, analytical/empirical models, and numerical simulations, or any combination thereof. While experimental data is still of vital importance, and analytical/empirical approaches are still used (Warren et al., 2014; Yankelevsky and Feldgun, 2020), more and more studies are nowadays utilizing numerical simulations to study the behaviour of concrete exposed to extreme loadings. Such simulations are now accepted tools for evaluating blast or impact loads against materials and structures (Abdel-Kader, 2018). They are particularly useful where experiments are not feasible, for instance due to economic, spatial or practical restraints. If the simulations are to provide useful insight into the problem at hand, the constitutive relations describing the material behaviour of the concrete must be able to accurately account for all phenomena relevant to the specific load case and structure. In addition, the material parameters and numerical setup should be validated against material tests and/or component level tests so that the model may be used to make assessments for structures of a larger scale (Kristoffersen et al., 2019).
Numerical modelling of concrete is challenging due to the brittleness, inherent heterogeneity, microcracking, and in general, complex behaviour of the material (Lu et al., 2010). Nevertheless, there are good, homogenized models which can give reasonable macroscopic predictions (Cui et al., 2017), and it is models of this kind that is the concern of this study. Such models come with different features, limitations, and levels of complexity (Tu and Lu, 2009; Yonten et al., 2005), and choosing the appropriate material model for the task at hand is not always straightforward. Some models require only a few input parameters, while other more complex models require numerous parameters. Given a thorough calibration of the material input based on appropriate test data, the accuracy should in general improve for any material model. Producing this input for the relevant concrete can be an arduous ordeal, so several concrete models come with generators for the input parameters, or they use empirical relations to generate the required input. Parameter generators typically use the unconfined compressive strength
Today, some of the most widely used concrete material models which include parameter generators are the Karagozian and Case (K&C) concrete model - Release III (Magellanes et al., 2010; Malvar et al., 1997), the continuous surface cap model (CSCM) (Murray, 2007; Zhao et al., 2021), and the Riedel–Hiermaier–Thoma (RHT) model (Grunwald et al., 2017; Riedel et al., 2009). All three models are readily available as standard models in the explicit finite element (FE) code LS-DYNA (LST, 2020). The Holmquist–Johnson–Cook (HJC) model (Holmquist et al., 1993; Johnson et al., 2018; Rajput et al., 2018) is another widely used model, and a modified version has been included due to its relative ease of calibration (Polanco-Loria et al., 2008). Numerous constitutive concrete models may be employed to simulate the ballistic impact resistance of concrete, for example, the Winfrith Concrete (WC) model (Broadhouse and Neilson, 1987), Concrete-Damage-Plasticity (CDP) (Lubliner et al., 1989) and a damage model based on effective rate-dependency proposed by Pereira et al. (2018). Alternatively, mesh-free methods are extensively used such us smoothed particle hydrodynamics (SPH) (Gingold and Monaghan, 1977), lattice discrete particle method (LDPM) (Cusatis et al., 2011) and discrete element method (DEM) (Antoniou et al., 2018).
The goal of this study is then to investigate the behaviour of commonly used concrete material models when applied to perforation of finite thickness concrete slabs by ogive-nosed steel projectiles. First, the models – those being the K&C concrete model, the CSCM and the RHT model – were used with their default (or generated) parameter sets, and FE simulations of material and component tests were carried out. Next, the material models were calibrated based on a set of standardized material tests, those being the cylinder compression test and the tensile splitting (Brazilian) test. Arguably, triaxial tests, dynamic tests, etc., should be included for a complete characterization of the material, but such tests are rare. The equipment required to complete the entire collection of tests is extensive. Thus, this work aims to investigate to which extent calibrations based on common material tests and some data from the literature can improve the numerical results compared with the default values and assess whether it is worth the effort. Several studies of similar nature are available in the literature (Abdel-Kader, 2018; Cui et al., 2017; Feldgun and Yankelevsky, 2019; Jiang and Zhao, 2015; Markovich et al., 2011; Ren et al., 2017; Tu and Lu, 2009; Wu et al., 2012; Yonten et al., 2005), but this work compares not only the different models with each other, but also the default calibration with a calibration produced on instrumented material tests and validation of the various models against ballistic impact test results. This calibration is conducted for a commercially produced concrete with a nominal unconfined compressive strength
Concrete models
The concrete models under evaluation; Modified Holmquist–Johnson–Cook (MHJC), K&C - Release III, CSCM and RHT are all isotropic and elasto-plastic, and they use a yield surface to separate the elastic and plastic domains. The yield surface follows a different expression for each model, though all are functions of the hydrostatic pressure, the equivalent shear stress and the Lode angle.
The first invariant

The second deviatoric invariant

The Lode angle
Dependency on the stress triaxiality is established by a reduction factor Lode angle and yield stress in the deviatoric plane.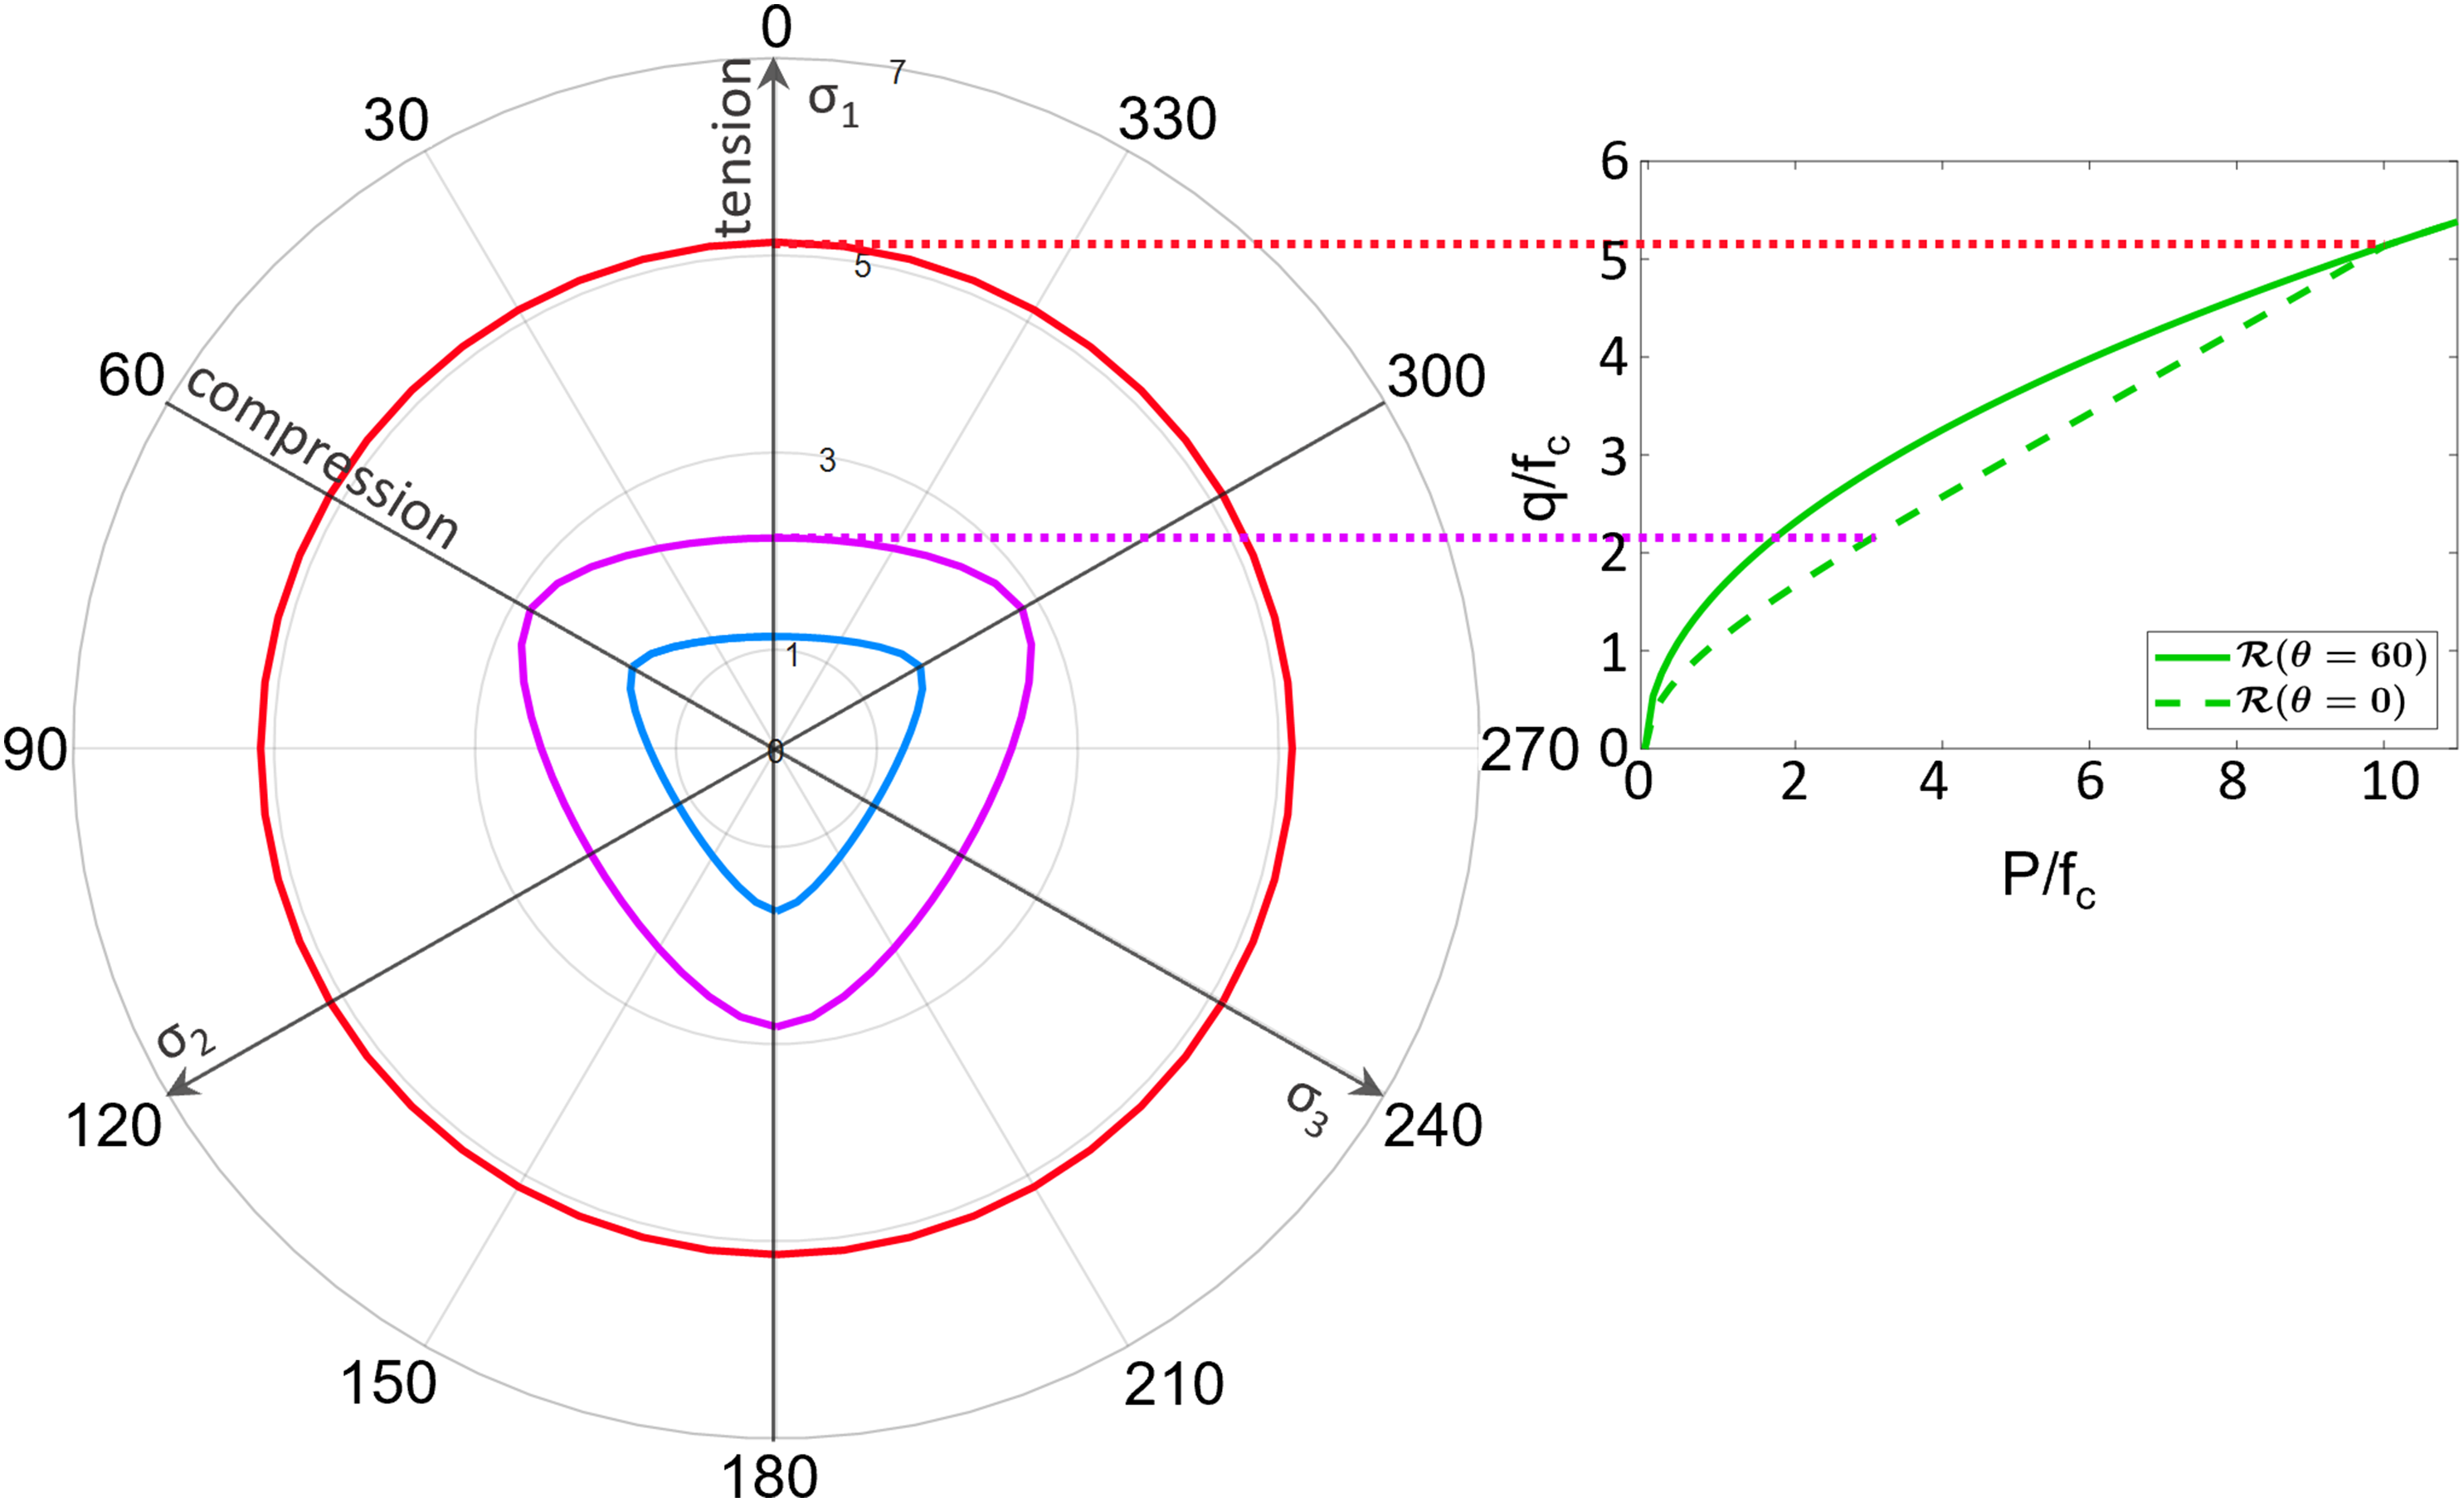
Therefore, the yield surface represents the deviatoric elastic limit in the principal stress space with a certain degree of symmetry around the hydrostatic axis as illustrated in Figure 2. The yield function for all the concrete models in the current study is expressed as a function of Yield surface in the principal stress space.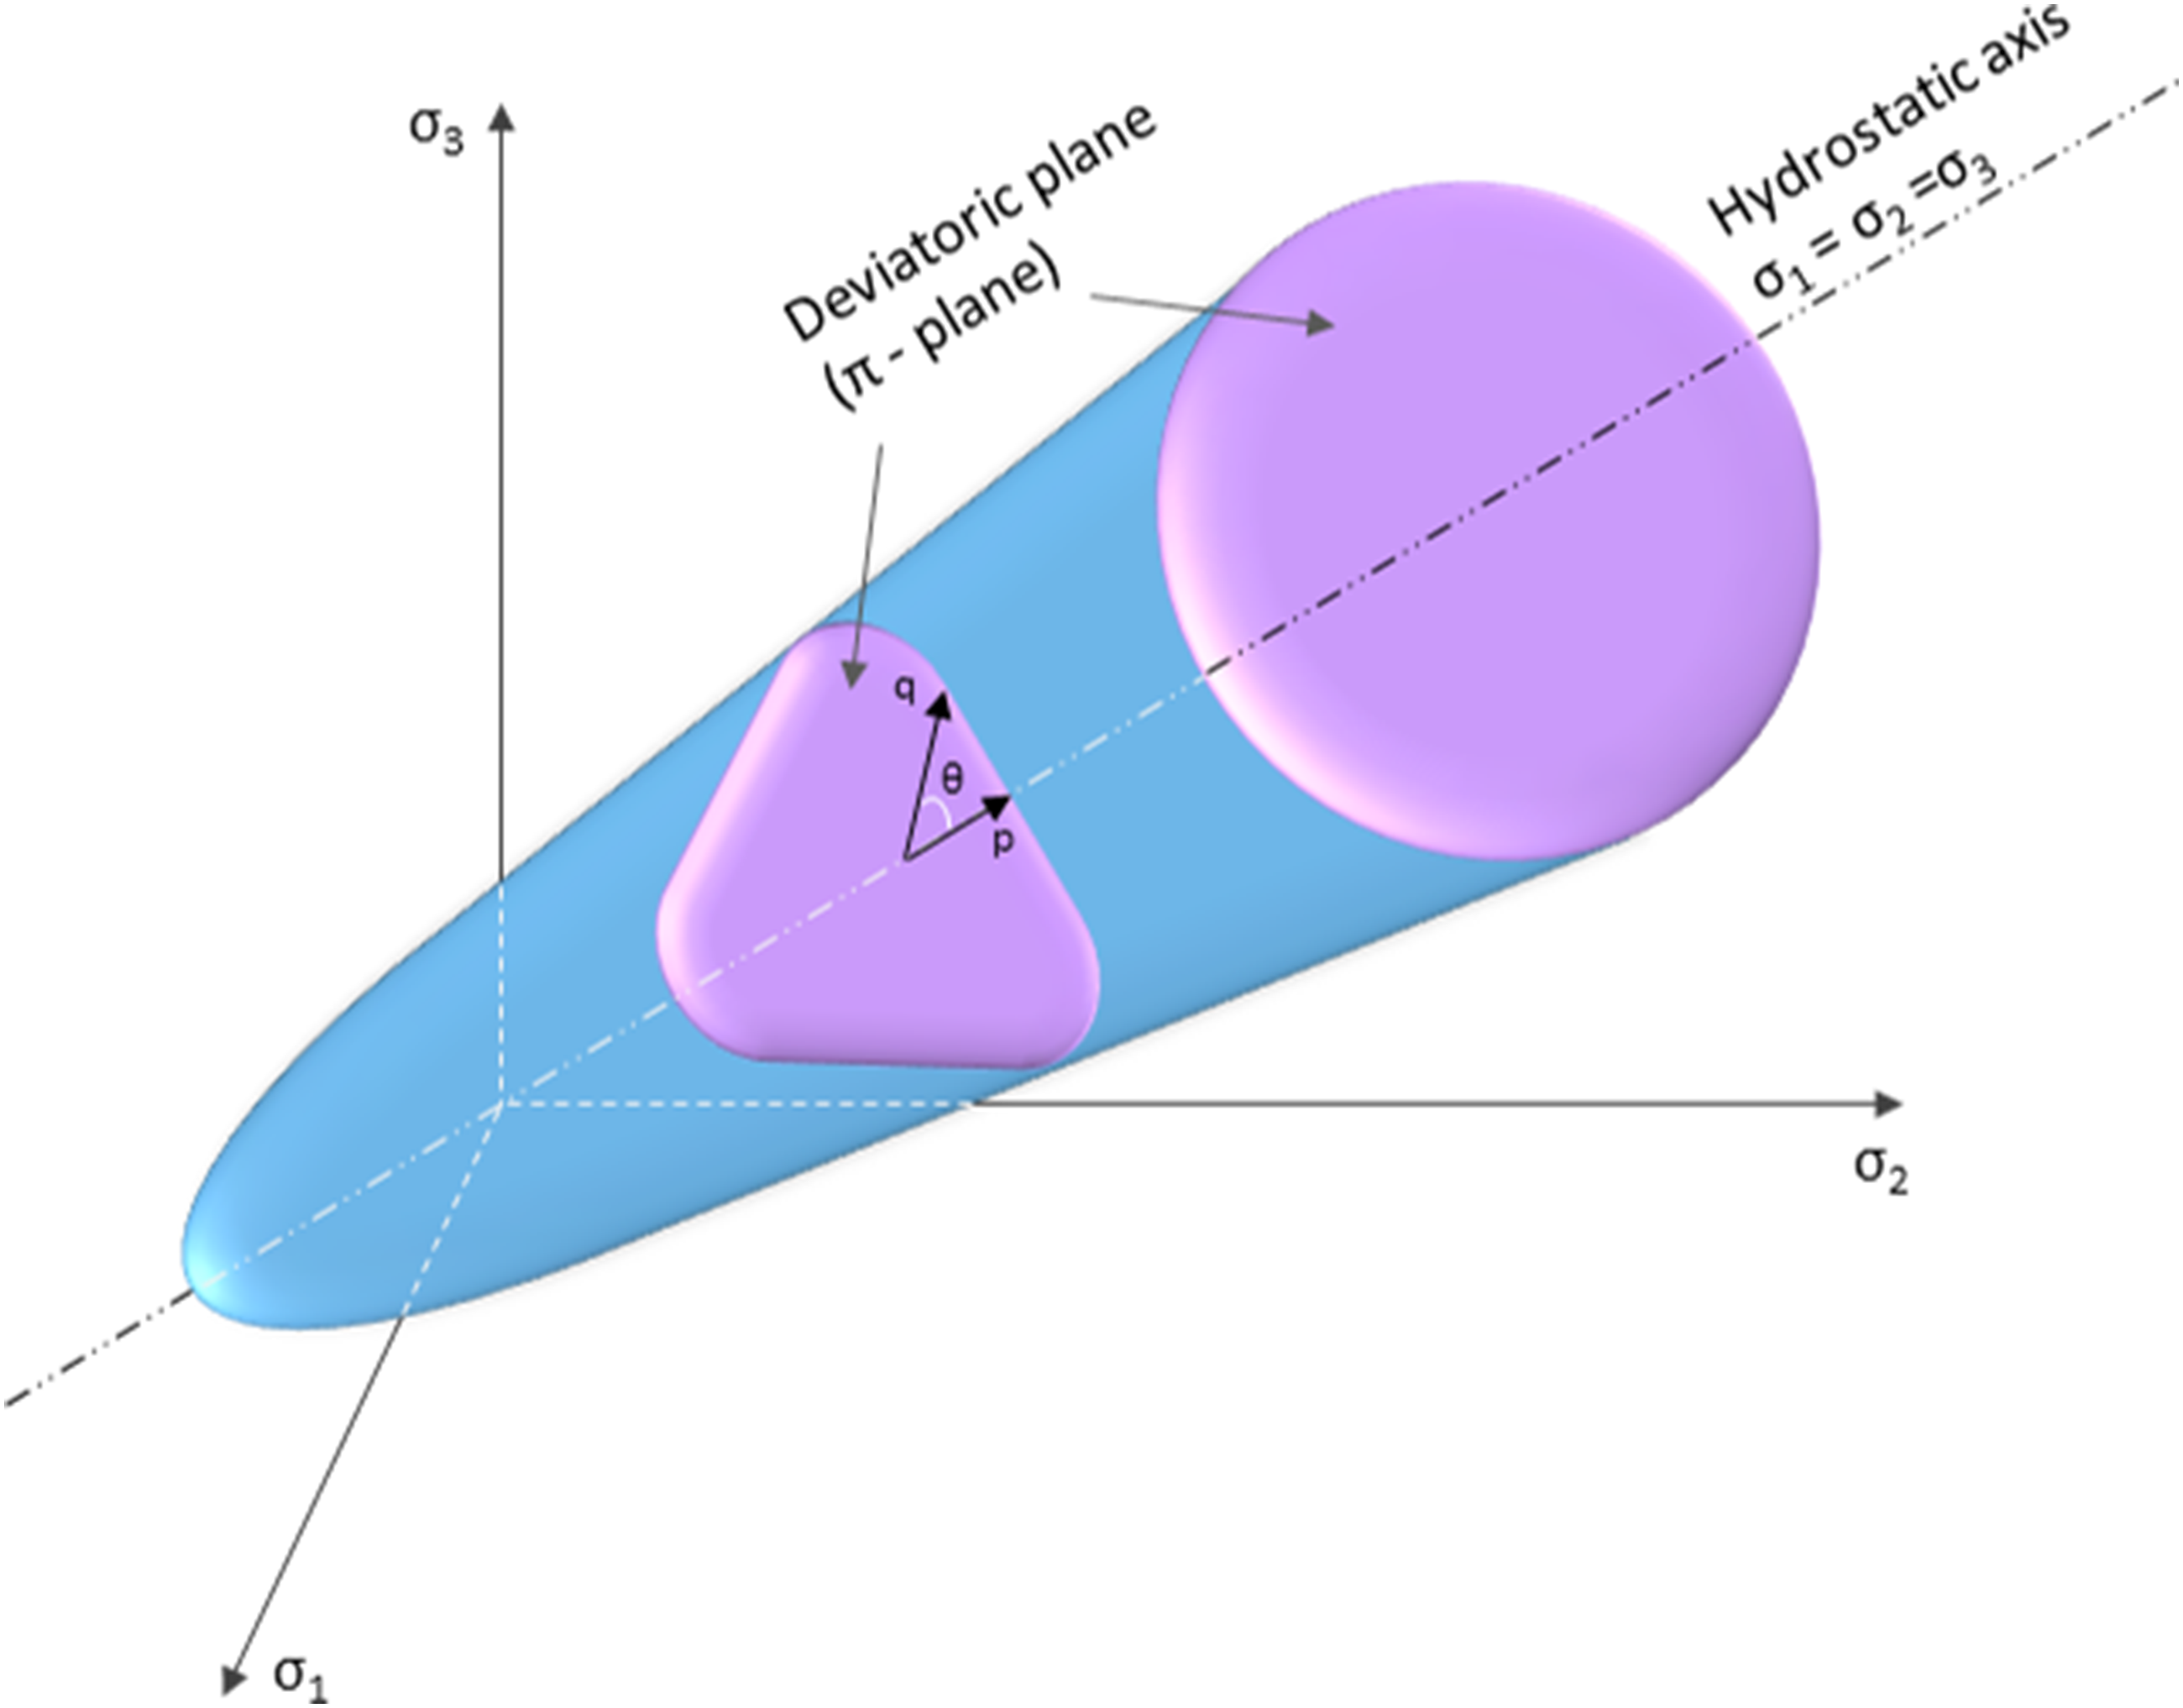

Further, the three concrete models K&C, CSCM and RHT include an additional strength limit, the maximum surface. The maximum surface involves plastic hardening after yielding until reaching the limit strength. All four models employ a residual surface for the final strength after irreversible damage.
The volumetric pore collapse evolution differs for each model in terms of hydrostatic pressure-volumetric strain equations. In general, the pressure-porosity constitutive model consists of three phases. These are as follows: (1) fully elastic behaviour, (2) compaction, that is, pores collapse with plastic deformation and (3) solidification, or fully compacted. Thus, irreversible closure of the porosity is observed at the final phase. Then, the volumetric response returns to an elastic behaviour while retaining the irreversible deformation from the second phase.
Likewise, the strain-rate sensitivity is introduced with a different expression for each model. Therefore, the strength of all the models enhances with the increase of the strain rate.
Lastly, all four concrete models include damage accumulation, which has not been evaluated in the present study for brevity. For a more detailed description of the concrete models, the readers are referred to Grunwald et al. (2017) for RHT, Murray (2007) for CSCM, Malvar et al. (1997) and Magellanes et al. (2010) for K&C, and Polanco-Loria et al. (2008) for MHJC.
Modified Holmquist–Johnson–Cook model
The MHJC yield surface is given by
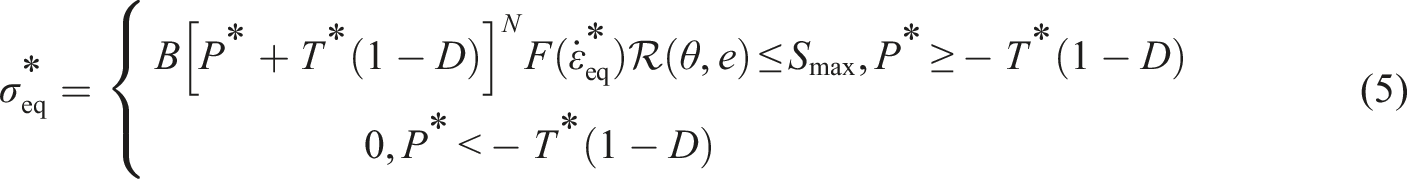
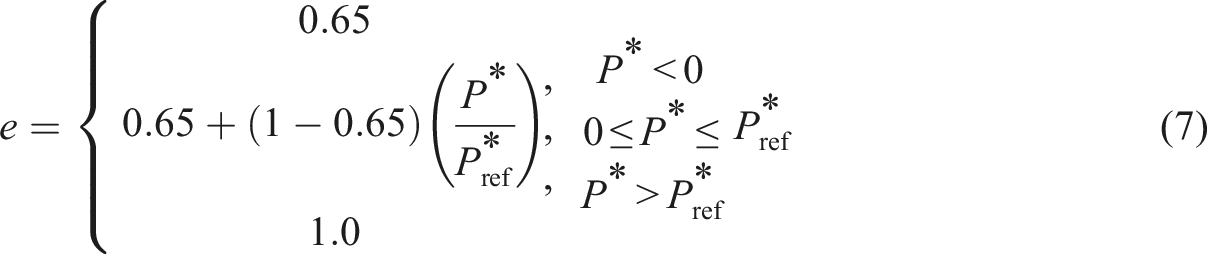
The reduction factor

The normalized shape factor
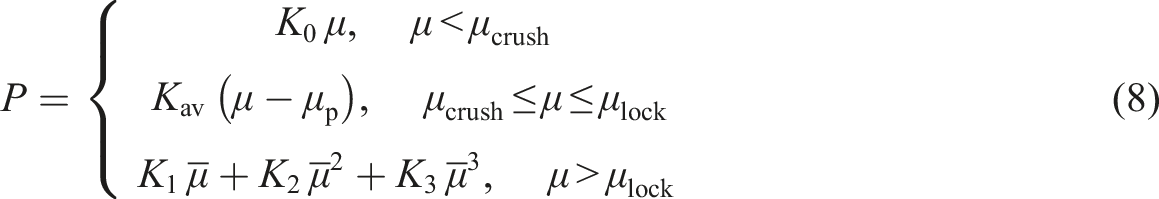
The pressure-porosity expression of the MHJC model constructs the three phases of the pore collapse evolution based on the crush volumetric strain (
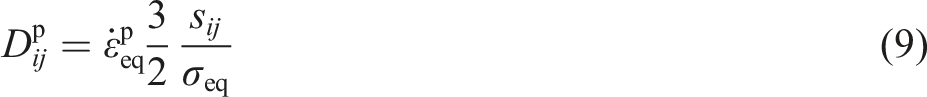
The associated plastic flow rule is employed and the plastic rate of deformation tensor
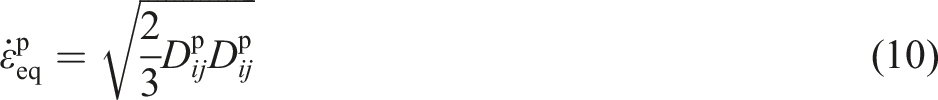
The strain-rate sensitivity is described as follows

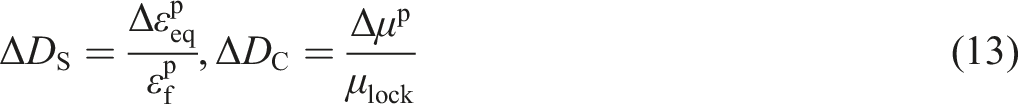
The total damage

The evolution of the shear damage
Karagozian and Case concrete model - Release III
The K&C concrete model - Release III in LS-DYNA, also known as the K&C concrete model, or simply the KCC model, is controlled by three deviatoric stress limit surfaces, that is, the initial yield surface


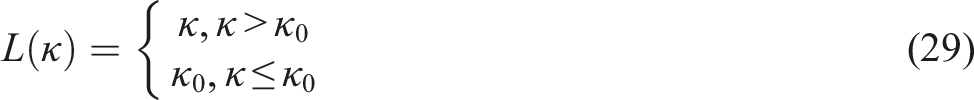
The K&C concrete model also includes the Willam and Warnke (1975) reduction factor formulation
The shape factor
The volumetric pore collapse evolution is introduced as an equation of state (EoS), which includes a set of tabulated data of the hydrostatic pressure

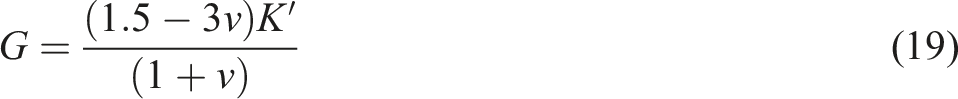
The scaled bulk modulus
The strain-rate enhancement factor
The accumulative effective plastic strain parameter
When the stress path is found along the vicinity of the triaxial tensile meridian, which is measured by the ratio of the deviatoric stress

This means that for stress triaxiality ratios above 0.1, equation (23) does not contribute to increasing
Continuous surface cap model
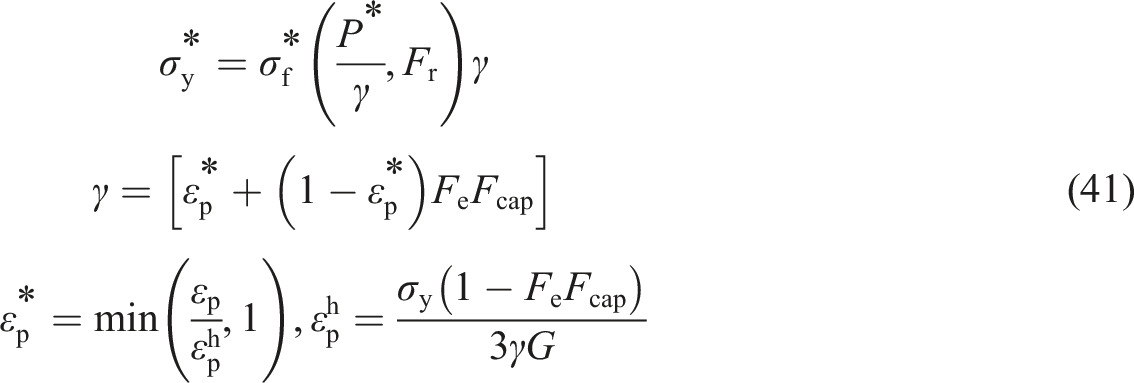
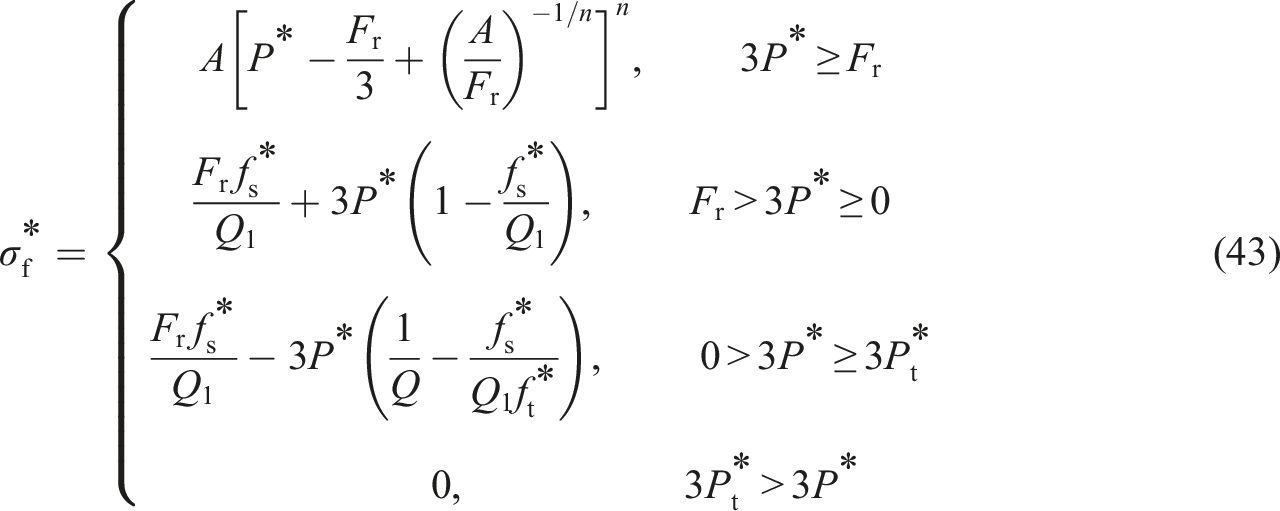
The CSCM provides a plasticity surface


The Rubin (1991) scaling function represents the reduction factor

The hardening cap
The functions

The volumetric pore collapse evolution is expressed as a hardening rule of the cap motion by the function

Further, an initial yield surface

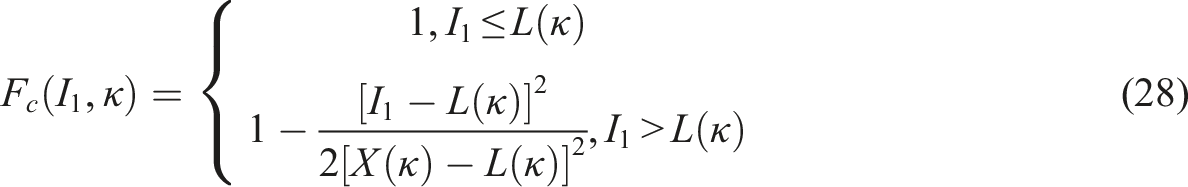
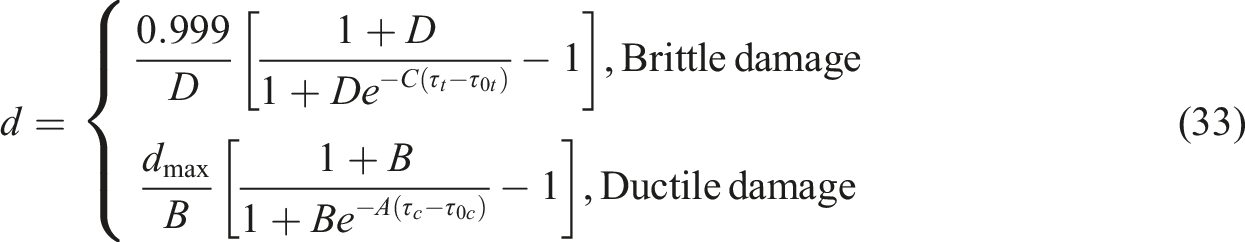
The damage accumulation due to softening is given as
The fracture energy in uniaxial tension (
The strength and the fracture energy of the model increase with increasing strain rate. The CSCM inducts strain-rate sensitivity with a viscoplastic algorithm which interpolates between the trial elastic stress

The parameter
The three fluidity coefficients are calculated from five user input parameters, where

The overstress limits in tension (

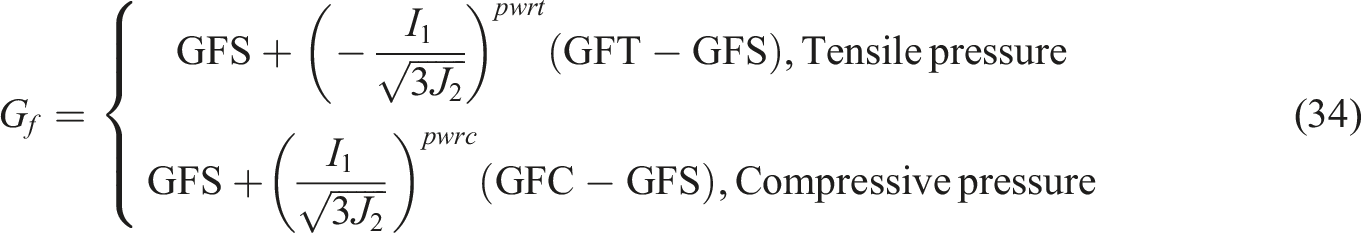
Further, the CSCM allows strain-rate sensitivity on the fracture energy as
Riedel–Hiermaier–Thoma model
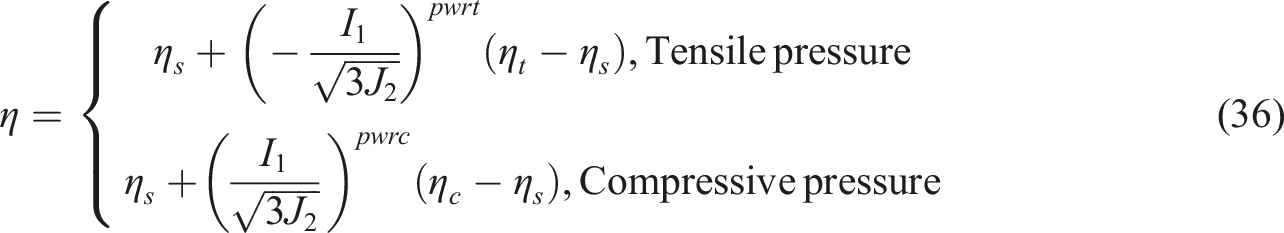
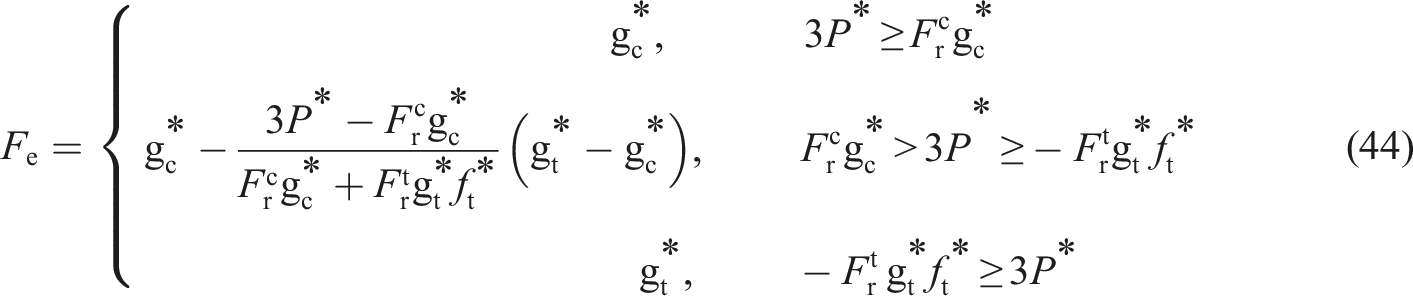
The RHT model couples a deviatoric yield surface

The RHT model also employs the Willam and Warnke (1975) formulation to determine the reduction factor

The normalized failure surface
The elastic limit
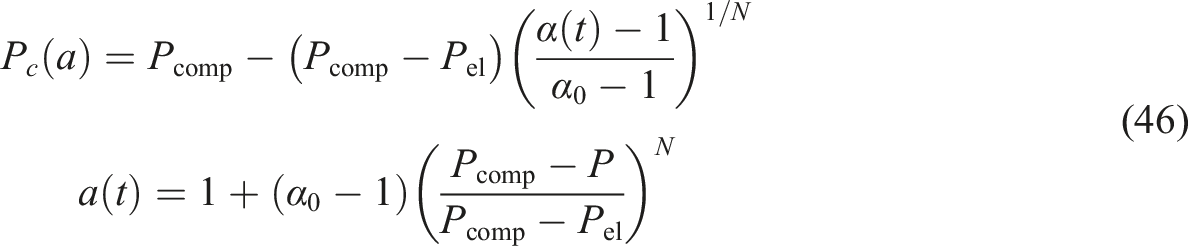
The cap function
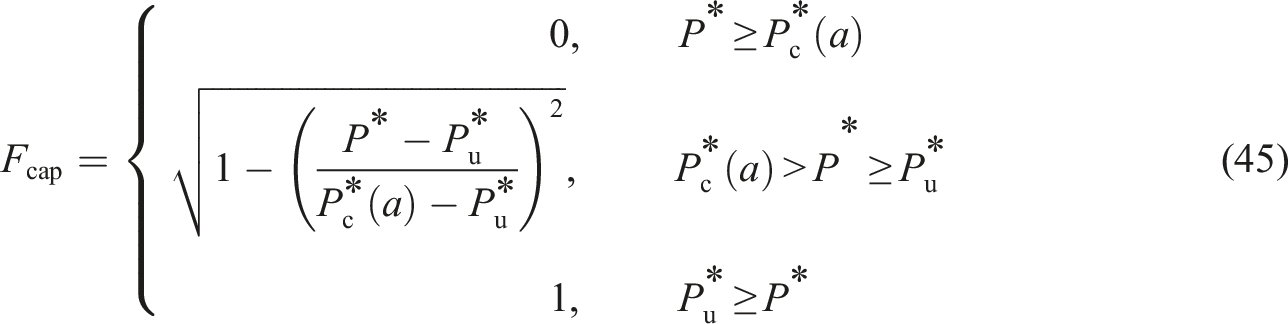
The pore crush pressure
Pore closure is characterized by a Hugoniot polynomial EoS, where
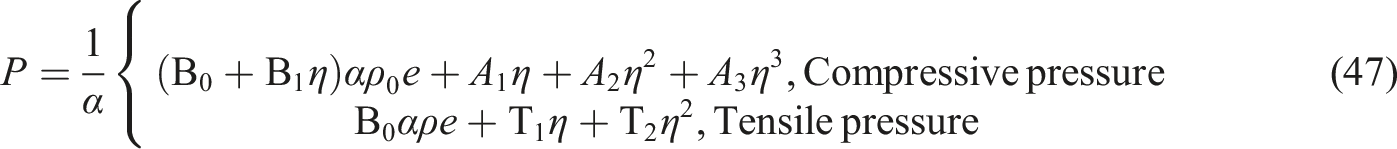
Alternatively, in case of

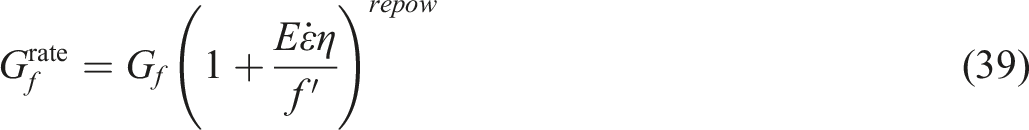
The strain-rate dependence increase factor is calculated by
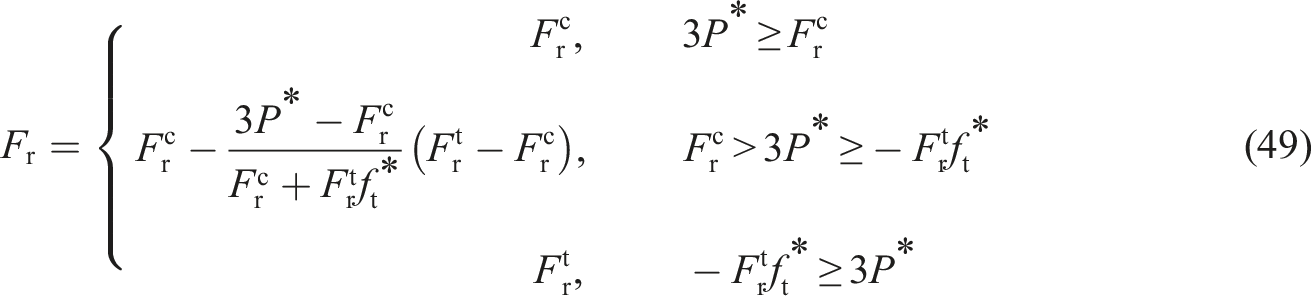
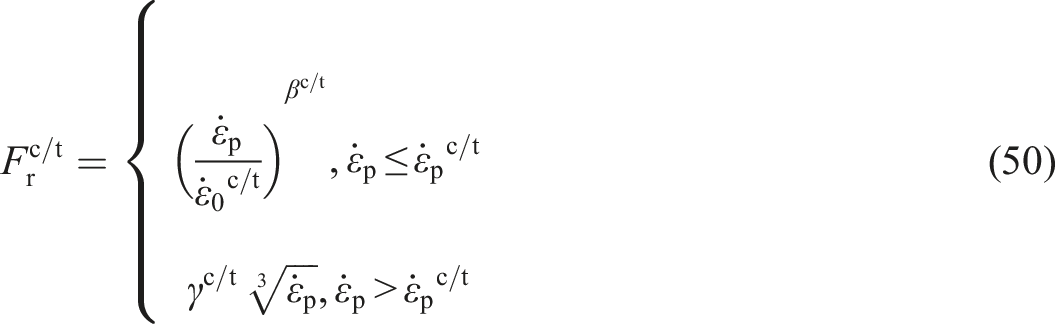
This power law is nearly identical to the CEB-FIB mode code (1990). Superscripts ‘c’ and ‘t’ denote compression and tension,
Material and ballistic impact tests
To evaluate the chosen concrete models and applied calibration methods, the experimental data presented in Kristoffersen et al. (2021b) will be utilized. In that study, the ballistic perforation resistance of 50 mm thick concrete slabs impacted by 20 mm diameter ogive-nose steel projectiles was investigated both experimentally and numerically. Three types of commercially produced concrete with nominal unconfined compressive strengths of 35, 75 and 110 MPa were used to cast material test specimens and slabs. After curing, ballistic impact tests were carried out in a compressed gas gun facility to determine the ballistic limit curve and velocity for each slab quality. In this study we will only consider data from the C75 concrete tests, and some of the main results are briefly described below for completeness. For a full description of the various material and ballistic impact tests, the reader is referred to Kristoffersen et al. (2021b).
Material tests
Composition and mechanical properties of the C75 concrete.
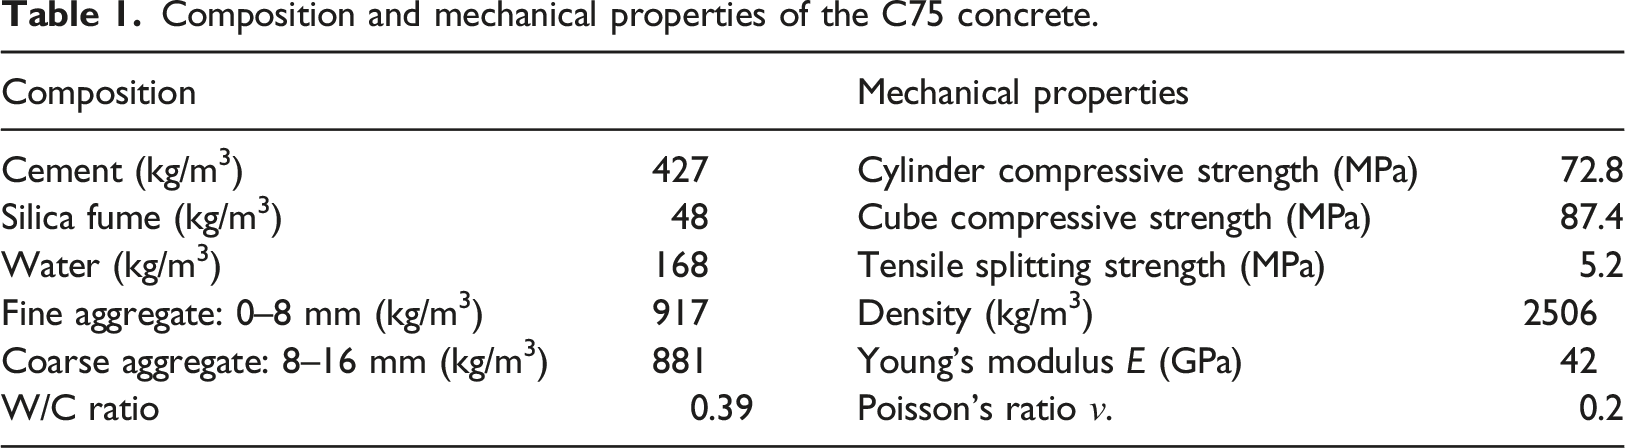
Simultaneously as the concrete slabs for the ballistic impact tests were cast in custom-made wooden moulds, many cubes and cylinders were cast in reusable steel moulds and kept submerged in water at room temperature until the day of testing. The cylinders were 100 mm in diameter and 200 mm long, while the cubes had side lengths of 100 mm. All tests were carried out in a fully automated Toni Tech 3000 kN load controlled rig at a loading rate of 0.08 MPa/s. During testing, the force was measured and synchronized with pictures from a high-resolution digital camera for two-dimensional digital image correlation (2D-DIC). Table 1 gives average values found in Kristoffersen et al. (2021b), which are based on three tests of the cylinder compressive strength
The results from the force and 2D-DIC measurements in terms of average engineering stress-strain curves from cylinder compression, cube compression and tensile splitting tests of the C75 concrete are given in Figure 3. The engineering stress-strain curves from the cylinder compression tests and the tensile splitting tests were used for the calibration of the material constants in the various models based on inverse modelling in numerical simulations. Average engineering stress-engineering strain curves from cylinder compression, cube compression, and tensile splitting tests of the C75 concrete (Kristoffersen et al., 2021b).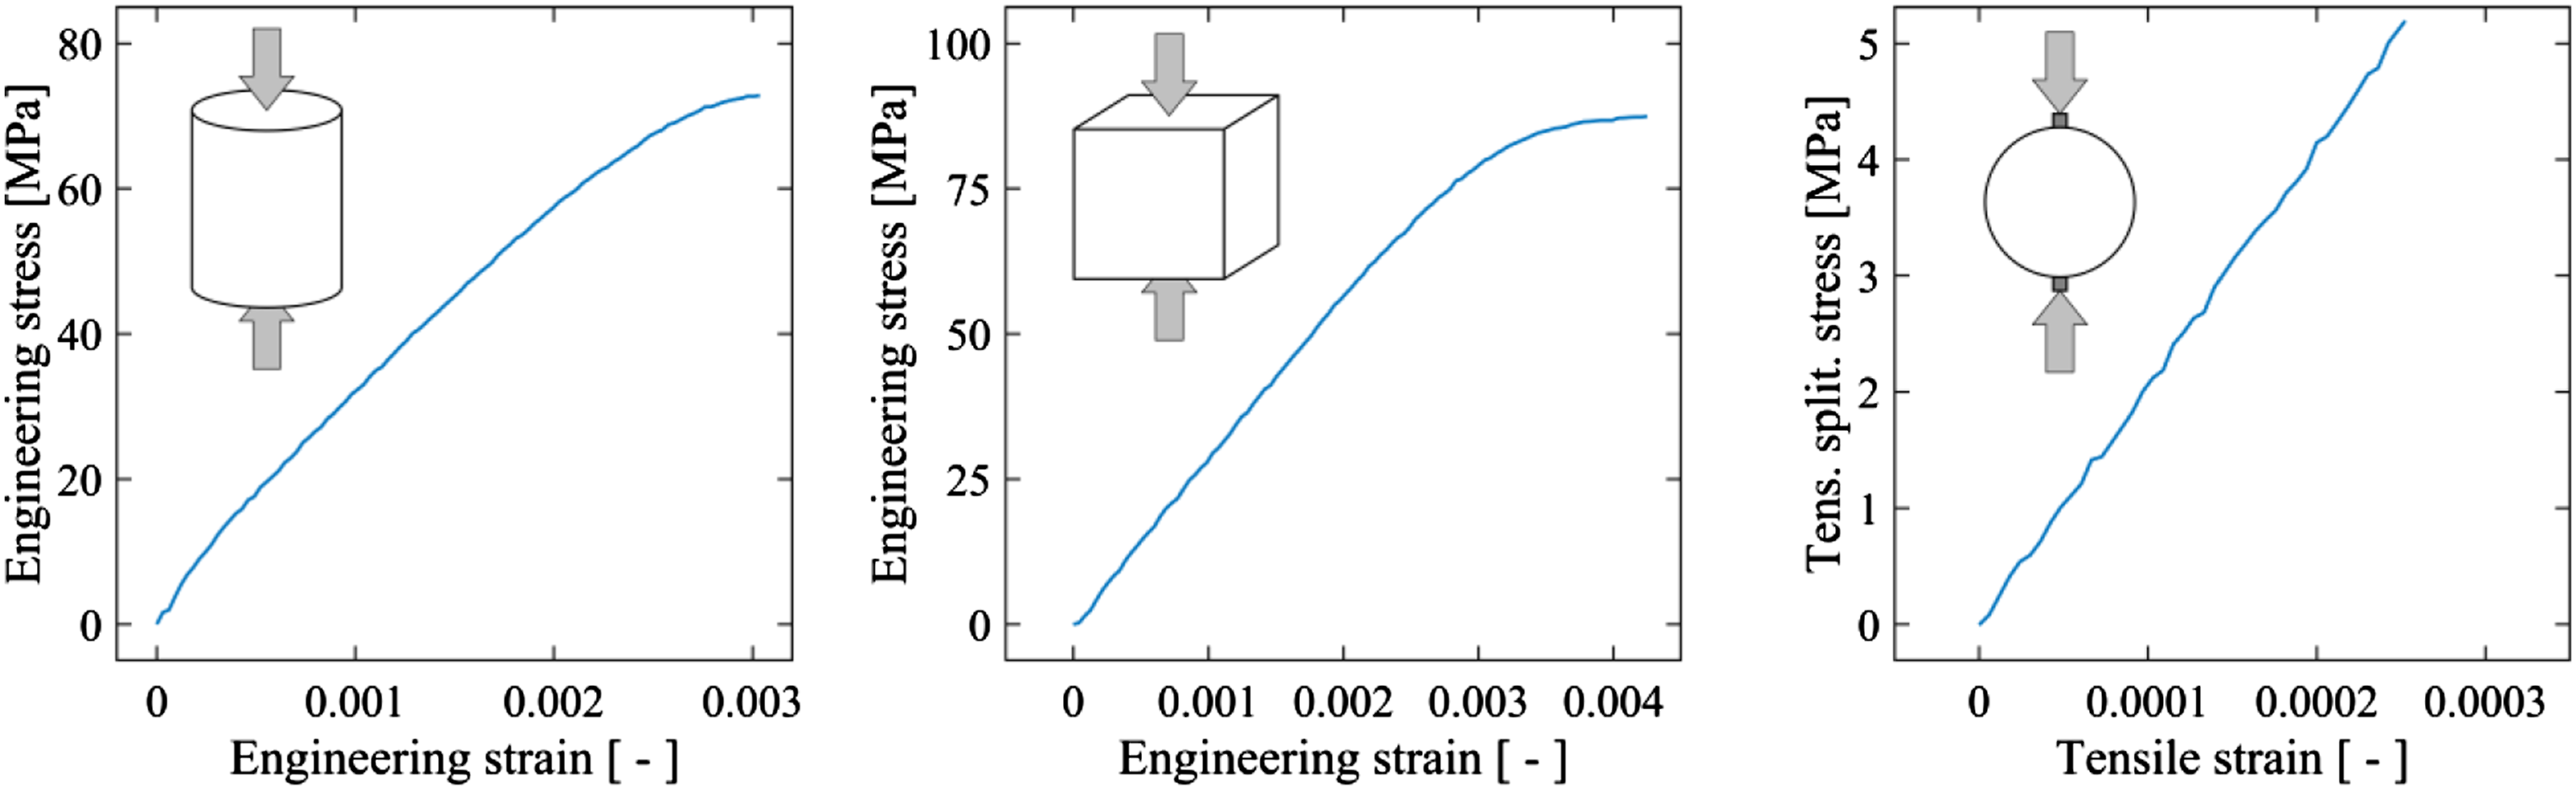
Ballistic impact tests
The ballistic impact tests in Kristoffersen et al. (2021b) were performed in a compressed gas gun facility described by Børvik et al. (1999). During testing, the ogive-nose projectiles were fired at impact velocities just below and well above the ballistic limit of the concrete slabs by using compressed air. The projectiles were manufactured from tool steel and heat treated to a Rockwell C value of 53 after machining. Nominal diameter (
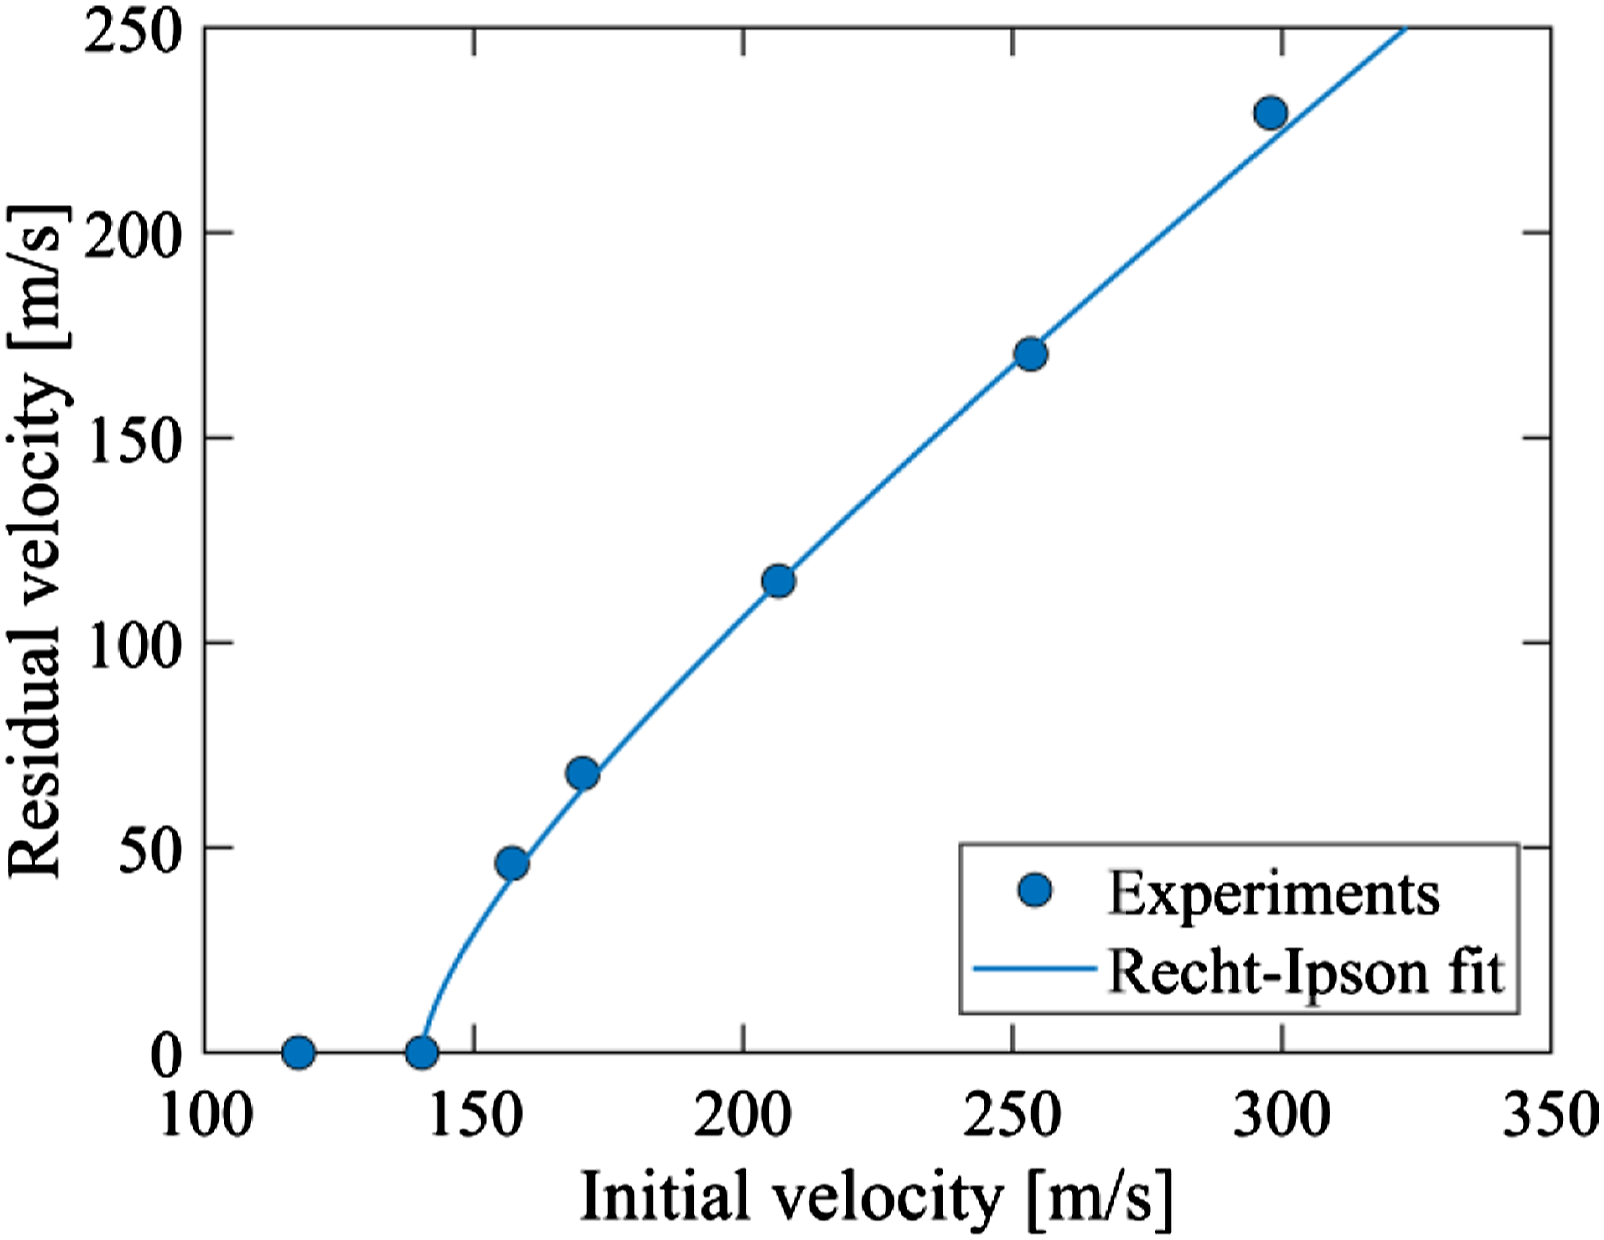
Accurate optical measurements of the initial velocity
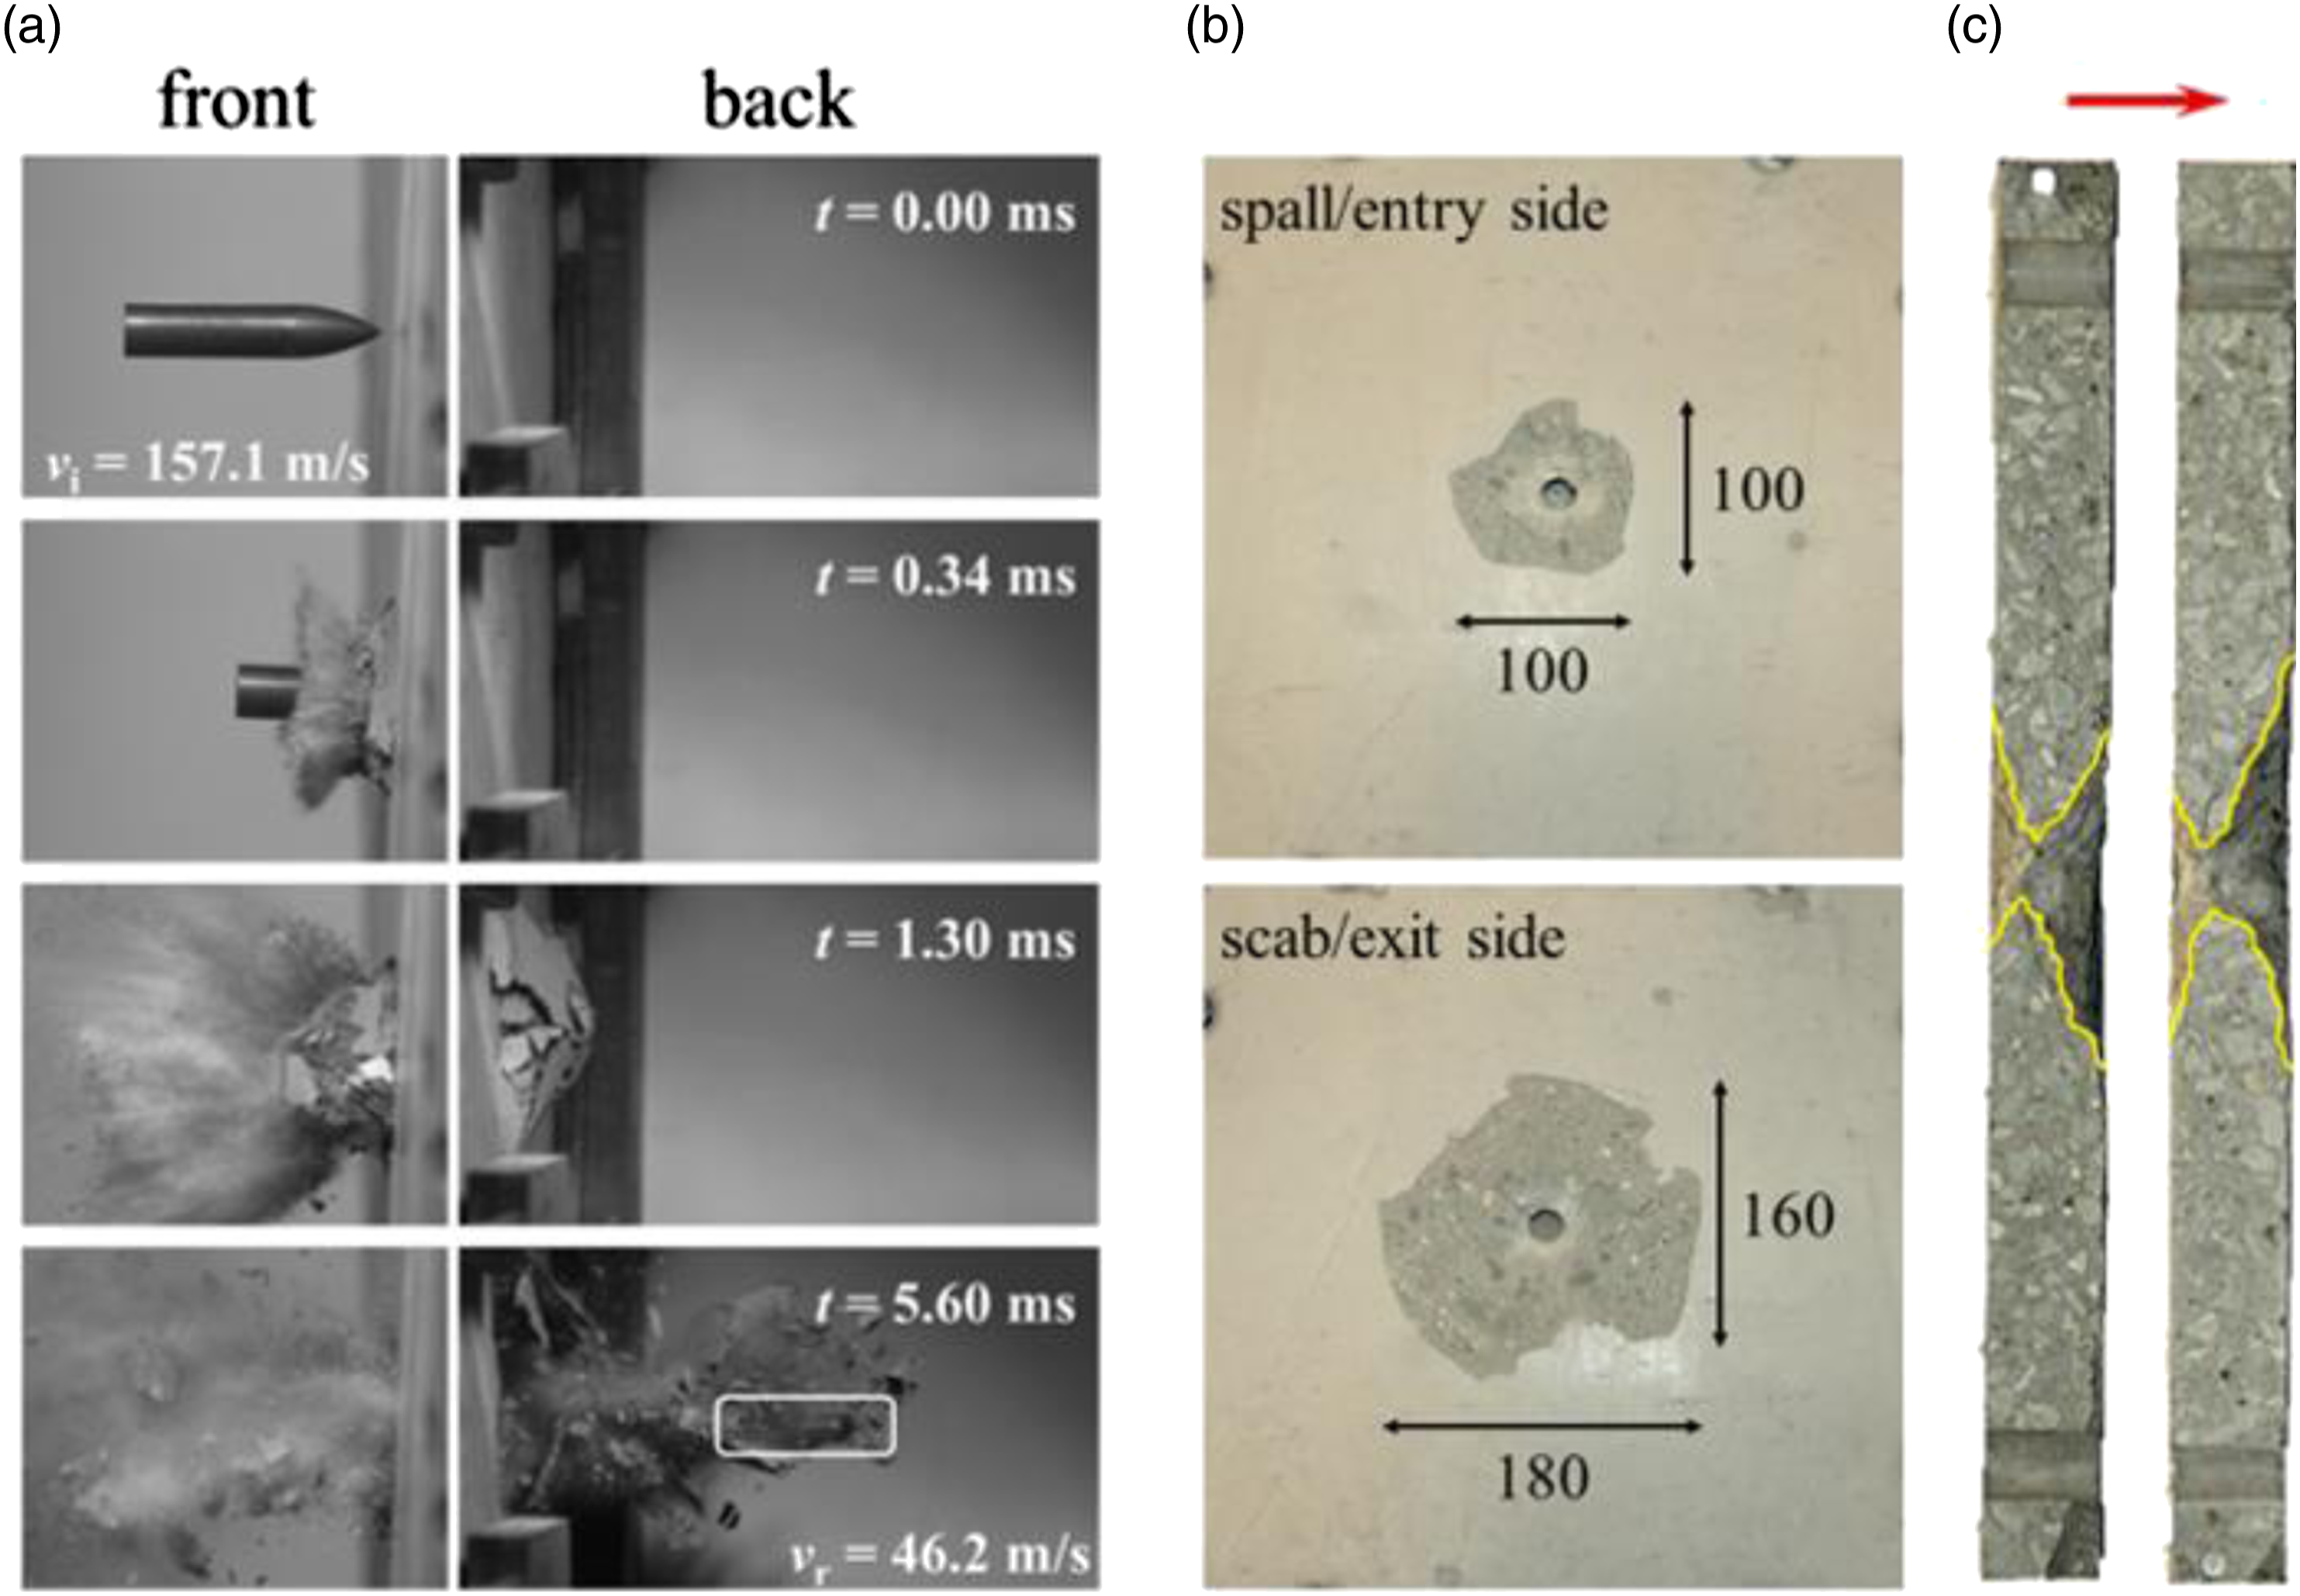
Based on the measured initial and residual projectile velocities, the ballistic limit curve and velocity of the concrete slabs were estimated. This was done by a least squares fit of the model constants in the Recht-Ipson model (Recht and Ipson, 1963) to the measured data. The model is defined as Ballistic limit curve for the C75 concrete slab. (a) Time lapse from high-speed camera images of a typical ballistic impact tests with 
Numerical simulations
The accuracy of four common concrete models is evaluated for predicting ballistic impacts on concrete structures. Three standard models (K&C
The constitutive parameters of the MHJC model are identified using material experiments (uniaxial compression, tensile splitting) and data from the literature (triaxial hydrostatic compression and Hopkinson bar tests). The accuracy of the concrete model is validated with the simulations of the perforation experiments. Additionally, the response of the K&C - RIII, CSCM and RHT concrete models with the default generated parameters is evaluated. Hence, the quasi-static and ballistic responses of the three standard LS-DYNA models are compared with the MHJC in numerical simulations. Finally, a study is conducted to readjust their constitutive parameters and re-evaluate their ballistic resistance with perforation simulations. The numerical results are compared with experimental data obtained from ballistic impact test at SIMLab (Kristoffersen et al., 2021b).
A 3D FE model mesh was used for the quasi-static compression (QSC) and tension (QST) tests. A rectangular prism with dimensions 0.1 m × 0.1 m × 0.2 m was created for the concrete specimen. A rectangular prismatic geometry offers a homogeneous mesh with the same size of FEs through the entire volume, which allow us to minimize mesh size dependency of the constitutive parameters. However, the experimental specimens are cylindrical; thus it is necessary to maintain slenderness ratio 2:1 for the specimen in Figure 6 (left). Shape effects have been shown to be negligible for the quasi-static case by Li et al. (2018). Finite element setups: 3D model for quasi-static compression test (left) and 2D axisymmetric model for ballistic impact tests.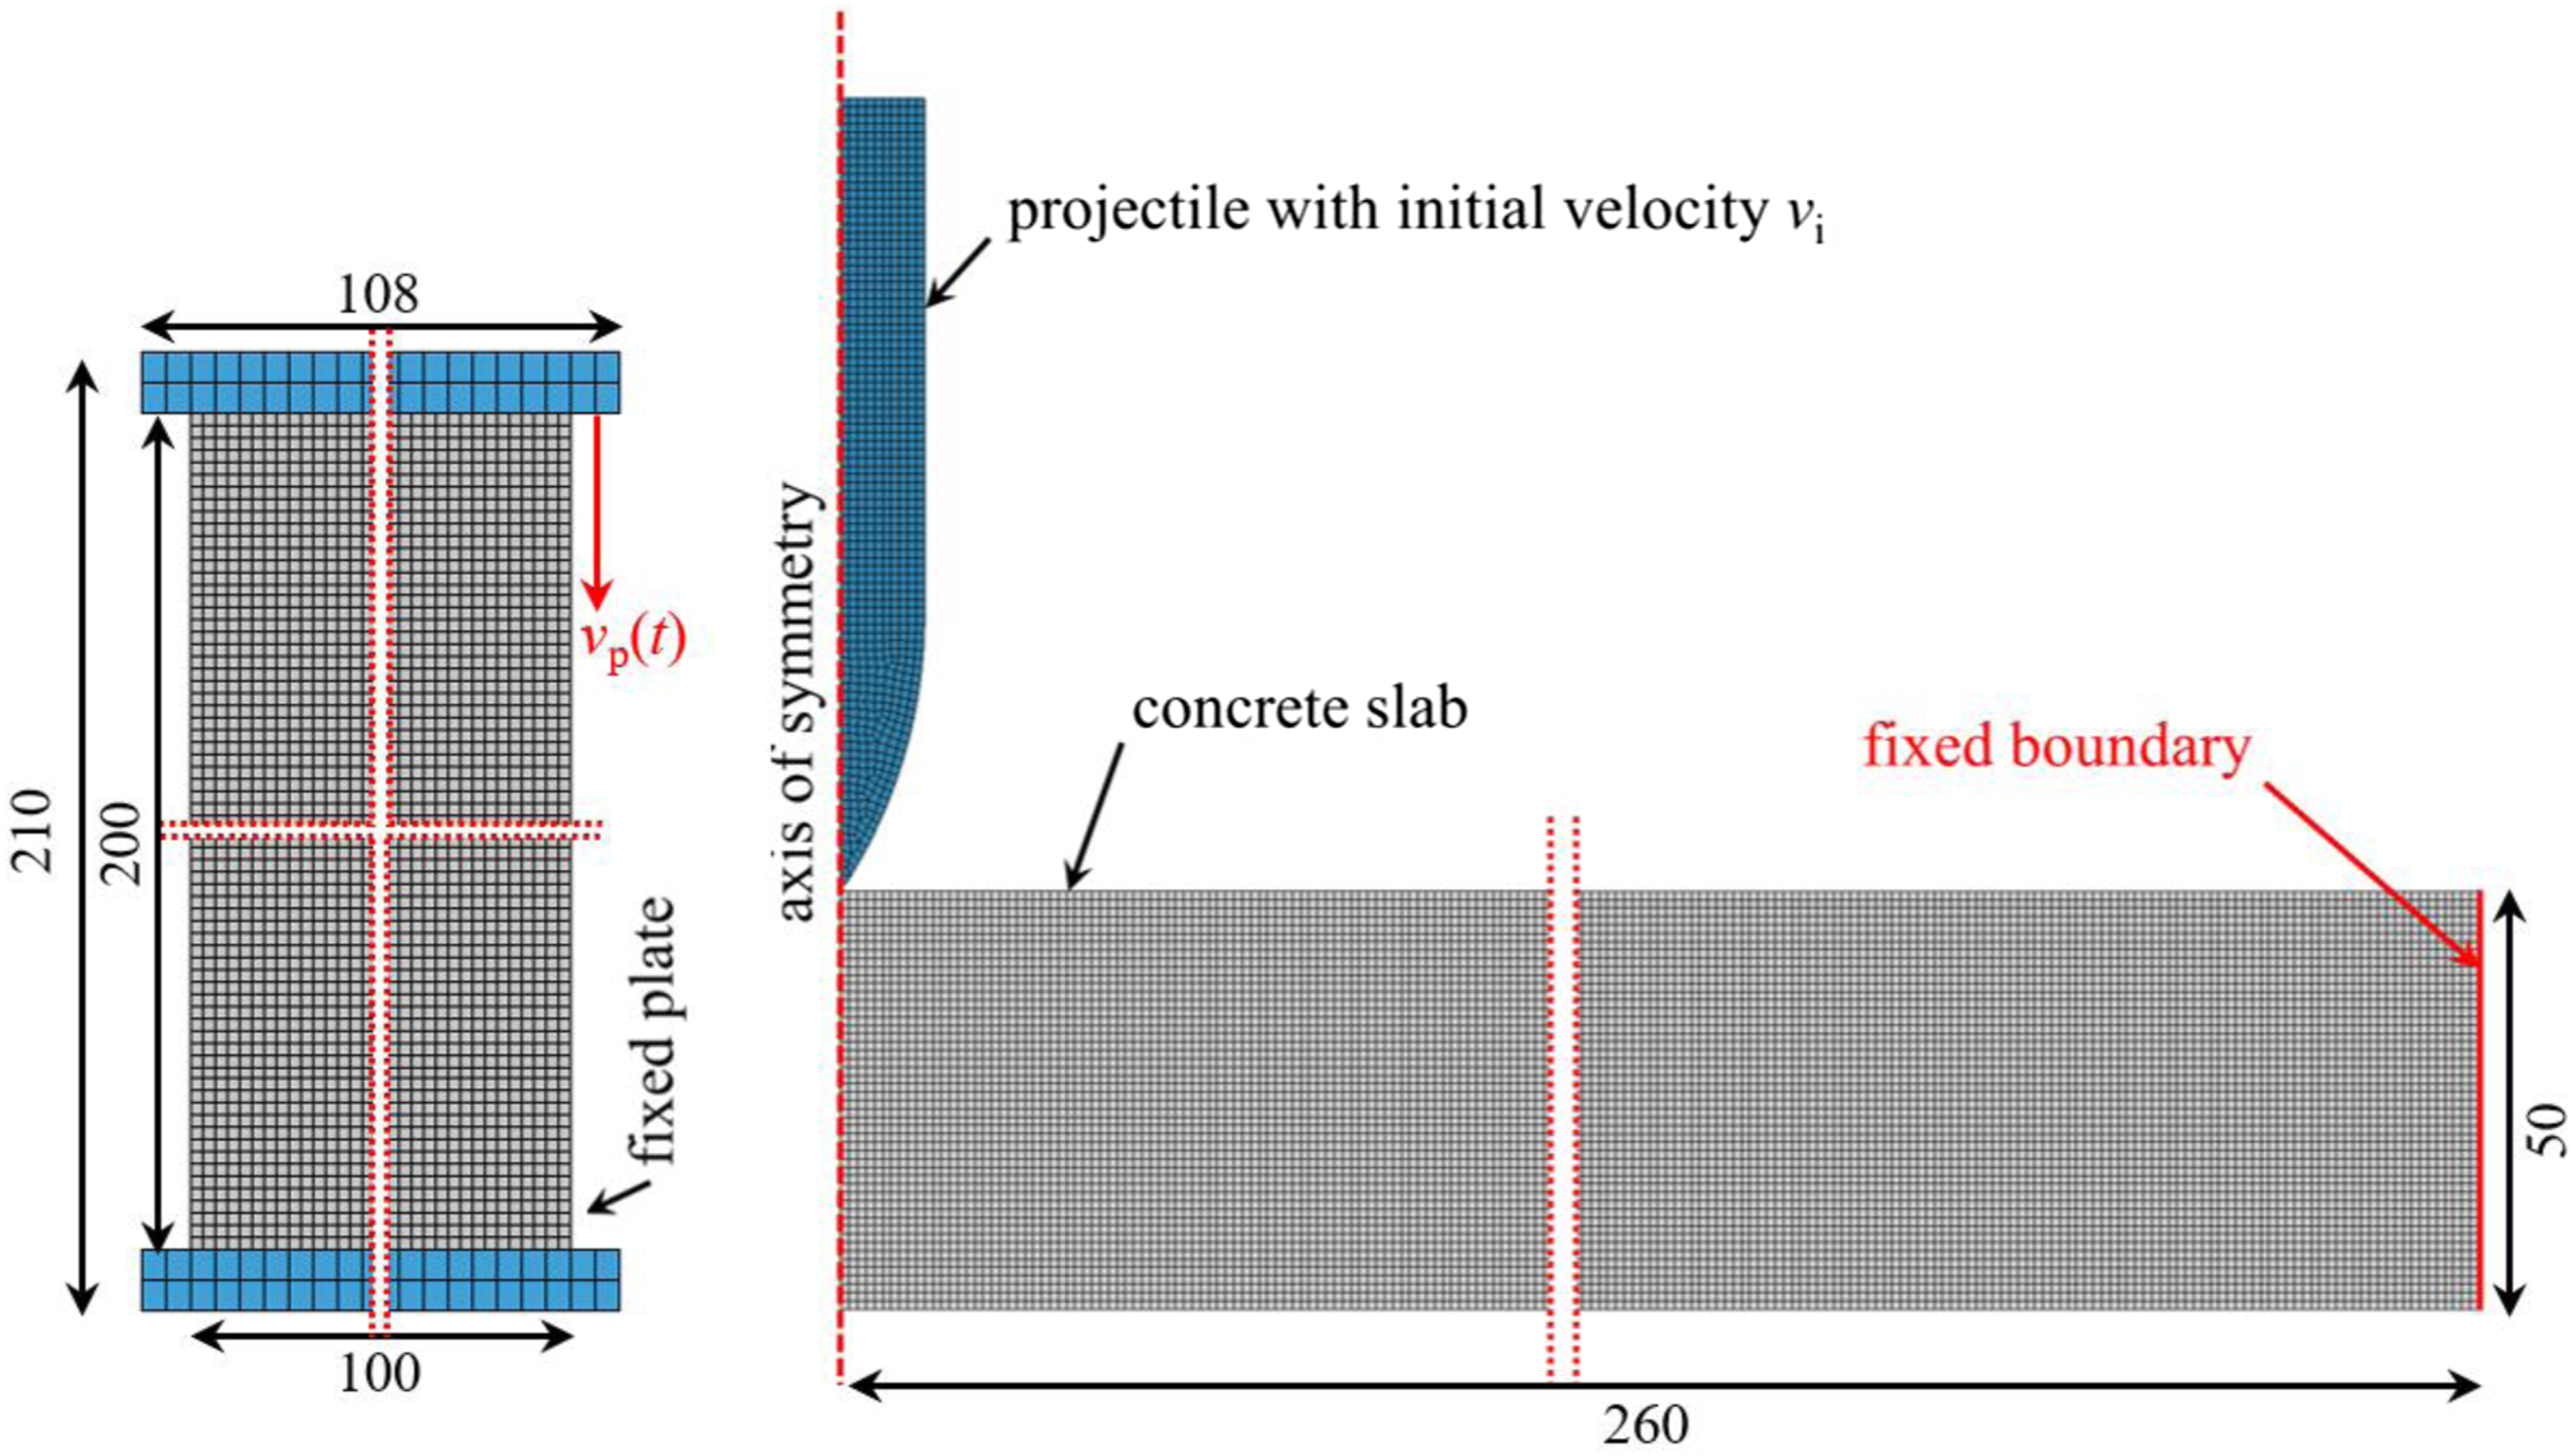
A rigid material model (*MAT_020 in LS-DYNA) was selected for the steel plates. The following material parameters for the rigid steel plates were used: Young’s modulus
Contacts between the concrete mesh and the rigid plates were imposed by the penalty method with the surface-to-surface option in LS-DYNA. Baltay and Gjelsvik (1990) suggest an average friction coefficient of 0.47 between concrete and steel under quasi-static conditions, while Burak and Tuncan (2014) consider a value of 0.55. Simulations with both friction coefficients produce indistinguishable variations; thus, a value of 0.5 was selected. Hexahedral elements with side lengths of 1 mm were chosen for the concrete mesh, which gives 100 × 100 × 200 elements. The same elements were used for the rigid plates with dimensions 2 mm × 2 mm × 2.5 mm.
The boundary conditions of the QST test were imposed by fixing the bottom surface of the concrete specimen. A velocity curve was imposed on the top surface of the specimen with axial direction along its length, which creates tensile stress. The boundary conditions of the QSC experiment were modelled using two rigid steel plates. The bottom plate is fixed using translational and rotational constrains in all directions, while the top plate is free to translate in the axial direction. A velocity curve describes the motion of the top plate which applies compressive stress to the FE concrete specimen. A time scaling factor of 0.5 × 10⁻⁴ was applied, which means that the simulated time was 10–20 ms depending on the test. The strain-rate sensitivity parameters were set to zero to prevent strain-rate effects for the calibration of the parameters under quasi-static conditions.
Similarly, a 3D FE model was generated for the triaxial hydrostatic (TXH) compression tests. A cube of side 100 mm was used for the concrete specimen. Rigid steel plates were assigned on each surface of the cubic sample to assimilate the hydrostatic pressure. The rigid material model of the QSC model was adopted for the steel plates. The plates were fixed in all degrees of freedom, except the translational direction perpendicular to the contact surface. A velocity profile was applied to the unconstrained degree of freedom of each plate. The velocity direction was towards the specimen. Contact and friction coefficients between the concrete and steel were imposed identically as to the QSC model. Hexahedral elements were used with side lengths of 1 mm, which gives 1003 elements for the concrete mesh. The FE size for the rigid plates was the same as for the QSC model, that is, 2 mm × 2 mm × 2.5 mm.
A 2D axisymmetric FE model was used for the ballistic simulation with element type 15 in LS-DYNA and a size of 1.0 mm, see Figure 6 (right). Hourglass type 6 was chosen with default values to prevent zero-energy deformation modes. The elastic-plastic model with linear isotropic hardening (*MAT_003 in LS-DYNA) was selected for the projectile. The steel material parameters of the projectile were taken as Young’s modulus
Modified Holmquist–Johnson–cook parameter calibration
A simplified parameter calibration procedure is proposed for the calibration of the MHJC constitutive parameters. The MHJC parameters were divided into categories and listed in calibration order: (1) the elastic behaviour, (2) the quasi-static strength and yield surface, (3) the pore collapse evolution and (4) the strain-rate sensitivity (see Table 3). The shear modulus
The uniaxial compressive strength parameter Engineering stress-strain curves of quasi-static compression (left) and tension (right). Normalized compression meridian yield surface-to-compression strength (left) and deviatoric plane (right). Reduction factor of tension meridian (left) and shear meridian (right).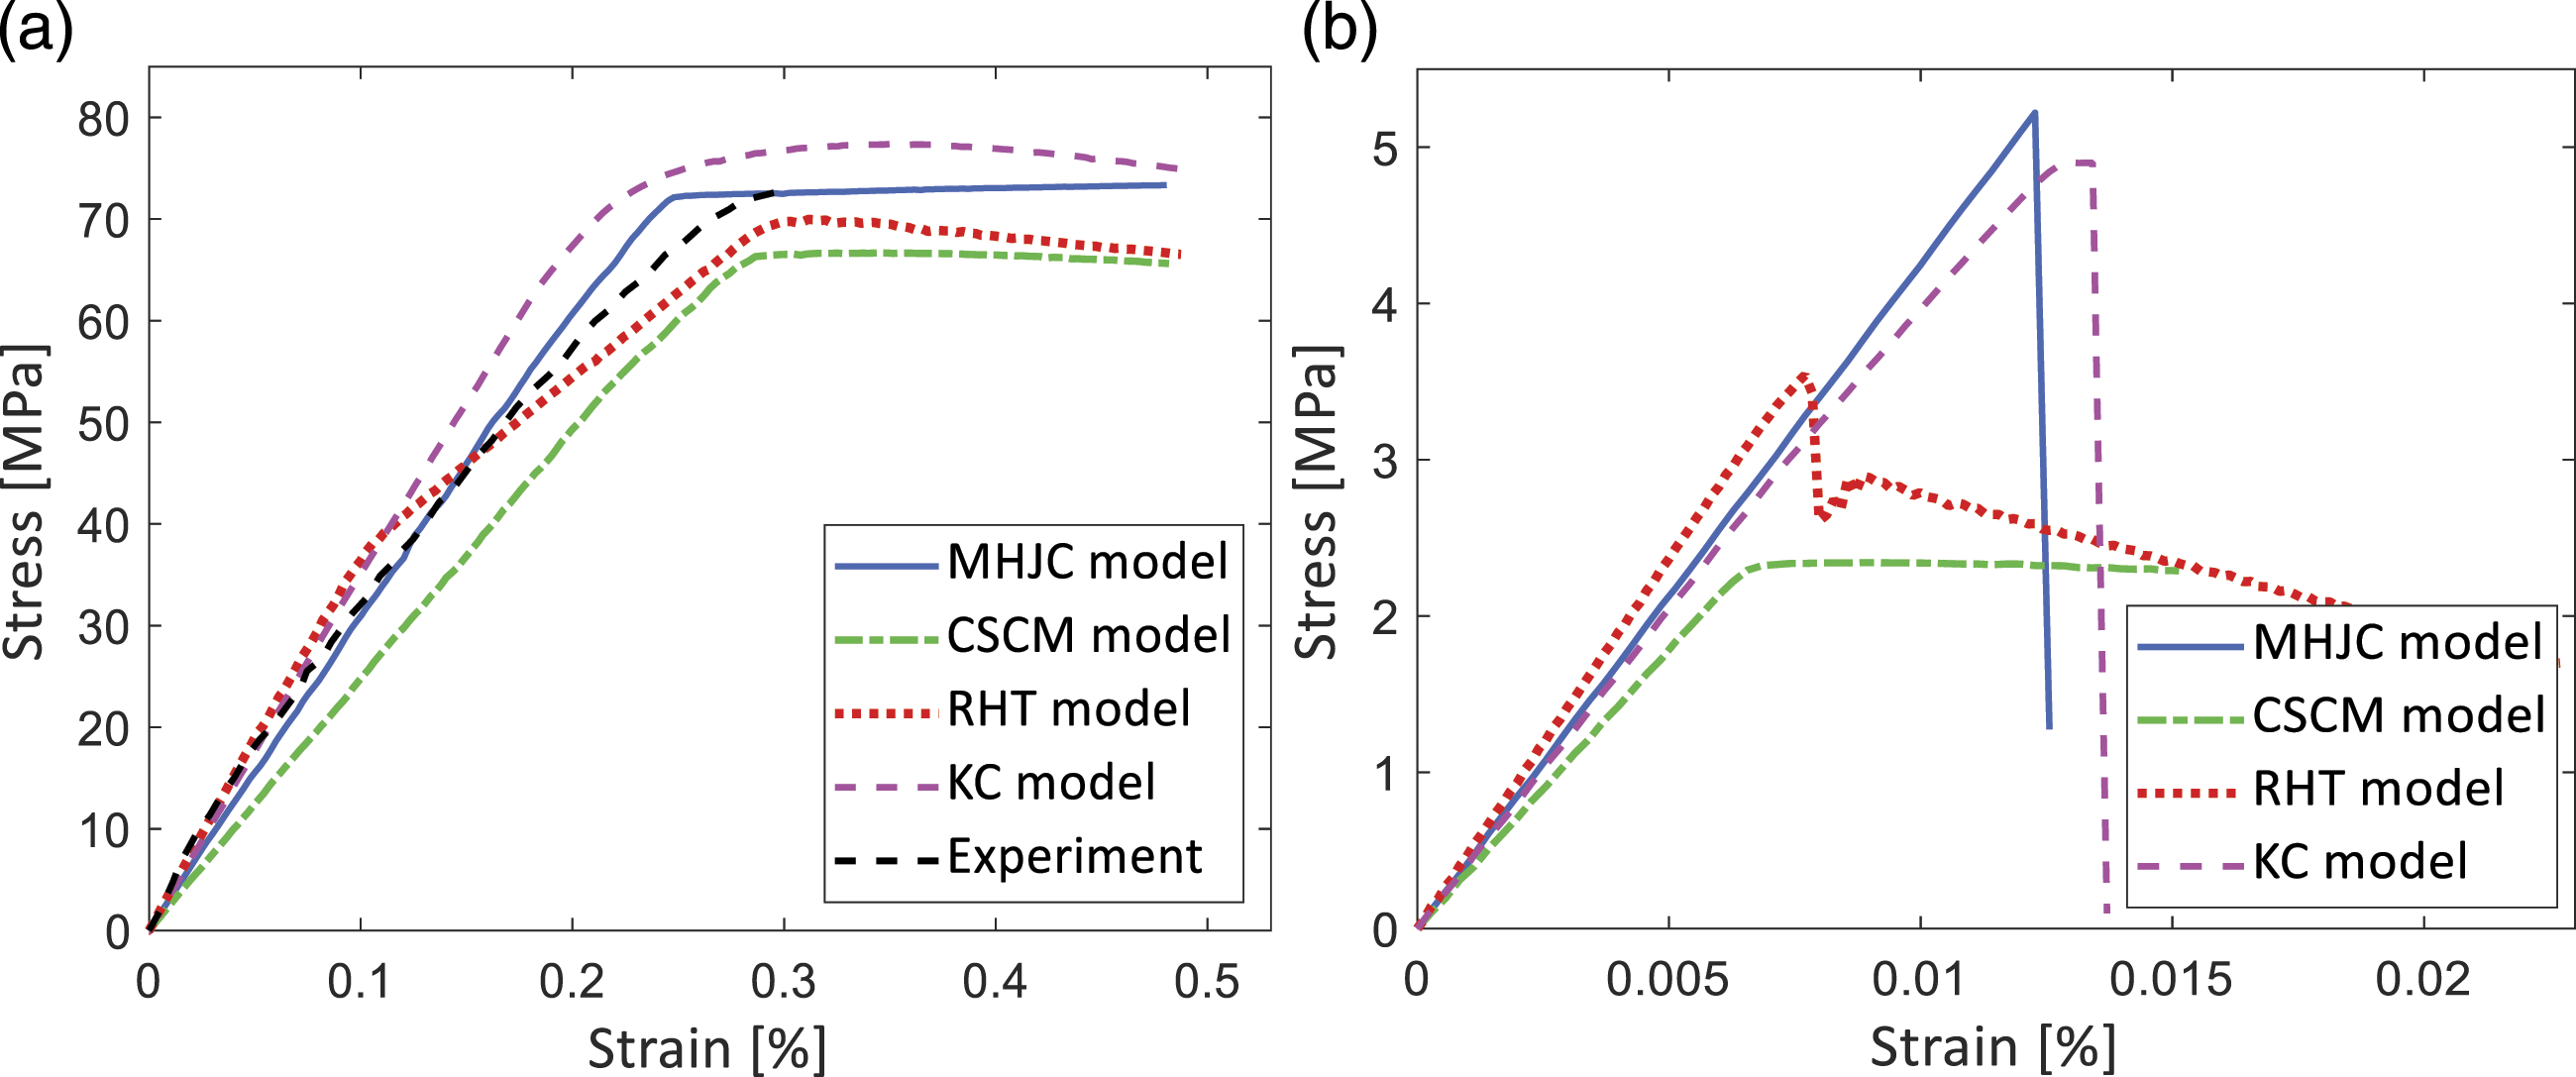
A triaxial hydrostatic experiment is essential for the determination of the pore collapse evolution parameters. Triaxial testing of concrete requires apparatus with high-pressure capacity such as a GIGA press described in Malecot et al. (2010). Consequently, the available experimental data are limited. For this reason, we estimated the pore collapse evolution parameters from data found in Malecot et al. (2010) and Magellanes et al. (2010). The pore collapse evolution parameters are the crush pressure Triaxial hydrostatic simulation (left) ballistic limit curves (right).
The dynamic mechanical properties of concrete can be obtained by, for example, split-Hopkinson bar tests at different strain rates. The absence of dynamic experimental data for the C75 concrete compels us to use stain-rate sensitivity parameters from the literature. The parameters
Material card of the MHJC model.
Automatic parameter generation option – evaluation
The default parameter generation option determines the constitutive parameters of the concrete models K&C - RIII, CSCM and RHT solely based on the cylinder compressive strength of the concrete. Their elastic response, compressive and tensile strengths are illustrated in Figure 7. The CSCM presents a lower while the RHT and K&C - RIII models give a higher Young’s modulus than the experimental value. All the models capture the peak stress well in compression, although only the K&C - RIII model gives accurate peak stress in tension. The CSCM and RHT model underestimate the tensile strength.
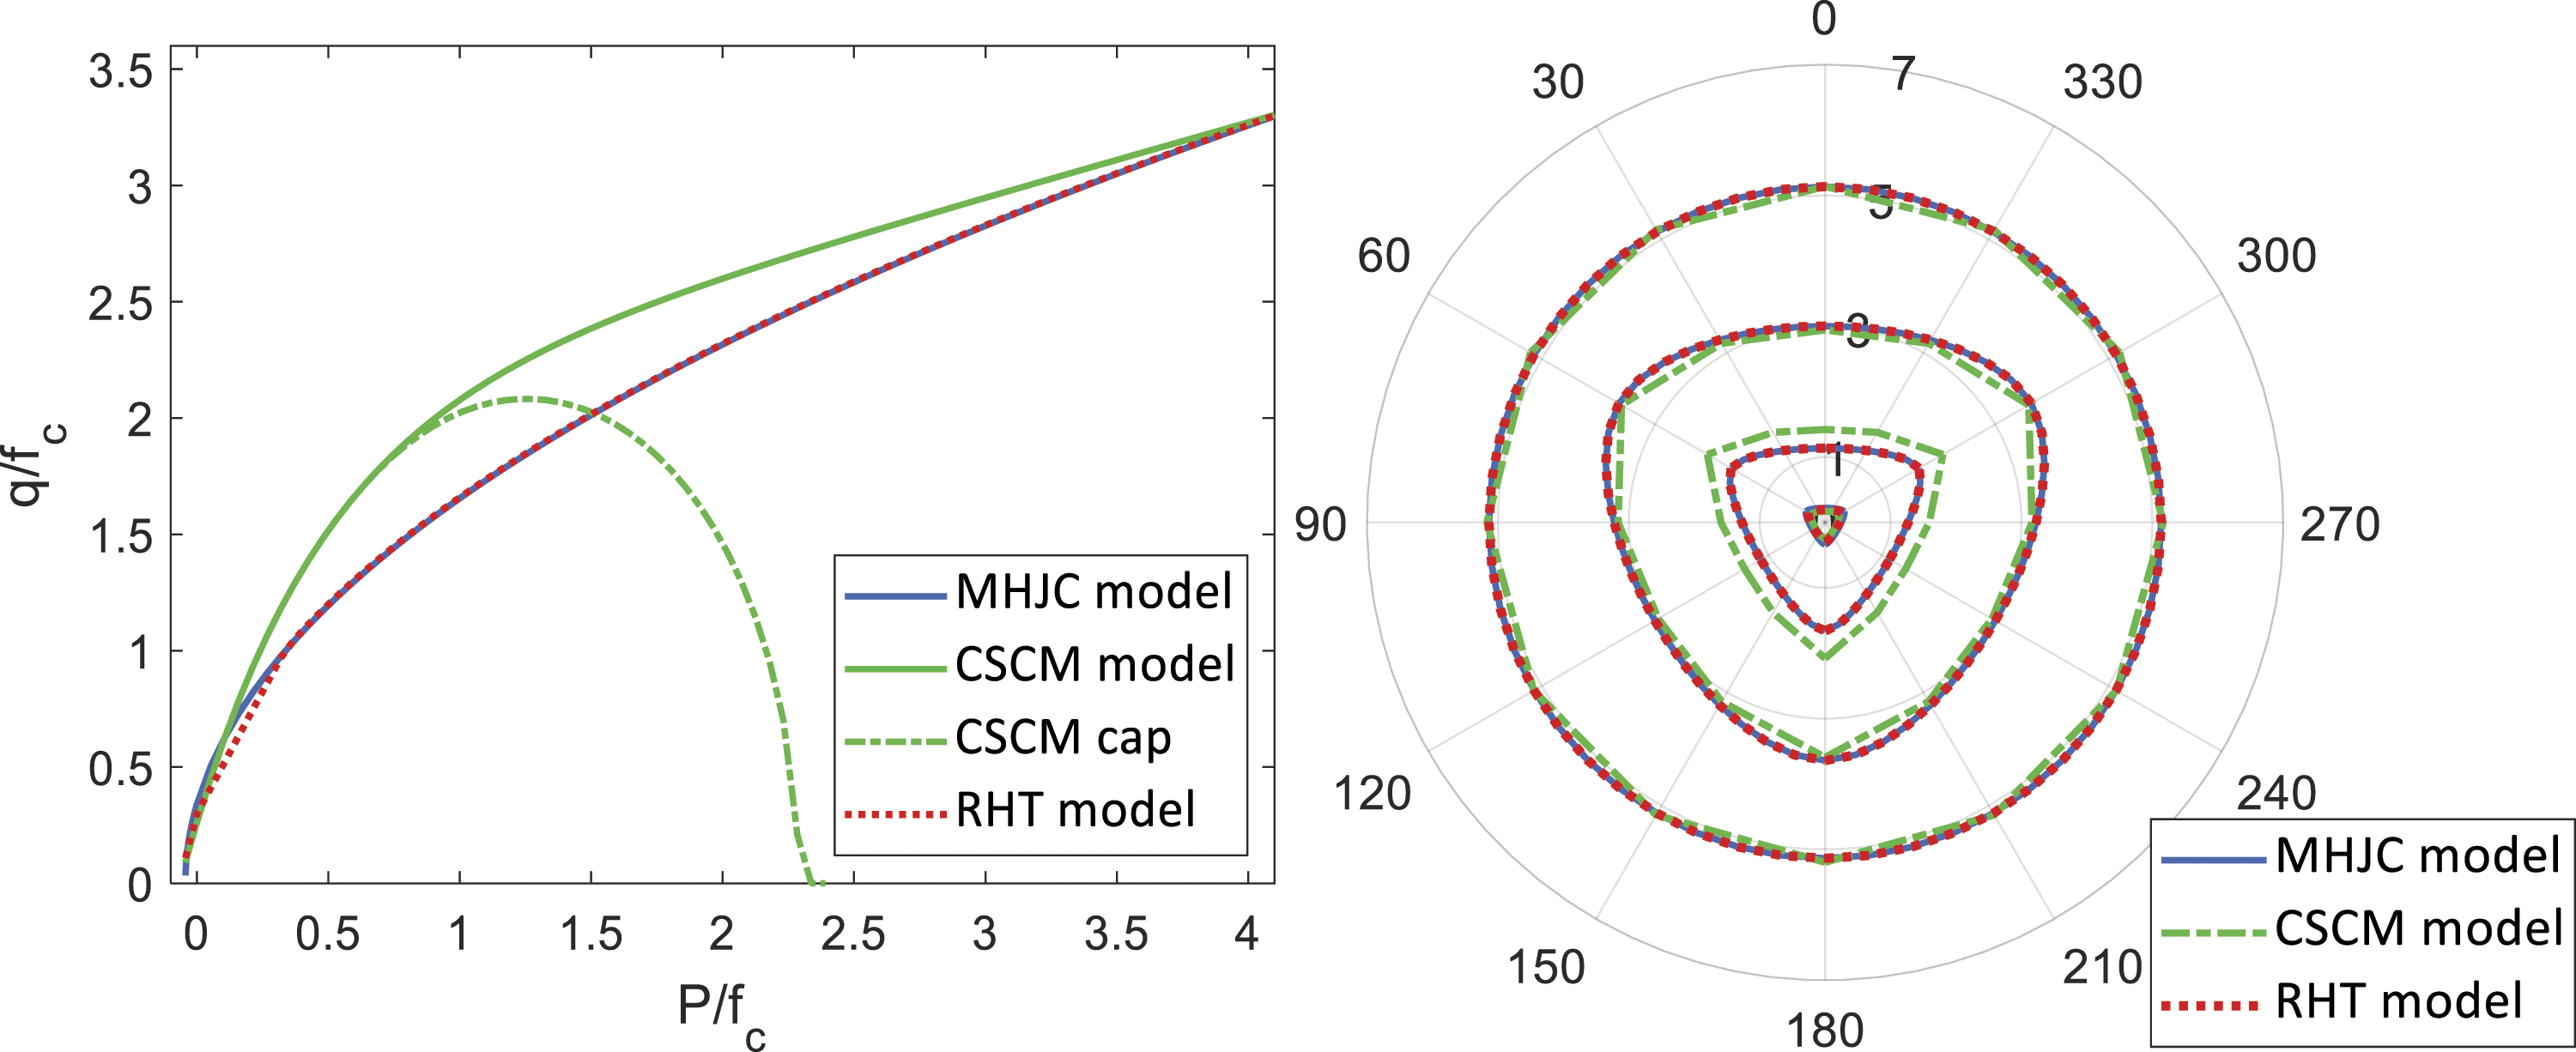
Comparing the yield surface of all the three models to the one from the MHJC (Figure 8 left), we observe that at pressures under the uniaxial compression strength, the yield limit of the three models differs from the MHJC model. The yield surface of the K&C - RIII model remains below at all pressures. However, at higher pressures, the yield surface of the CSCM raises significantly, and the RHT model is slightly increasing. There is no coherence between the deviatoric planes of any of the models (Figure 8 right). Additionally, the reduction factors of the tension and shear meridians appear to be comparatively small for the models RHT and CSCM. The reduction factors of the K&C - RIII and MHJC models are relatively close (Figure 9). It is worth mentioning that the reduction factor of the K&C - RIII model is computed internally. In contrast, constitutive equations control the reduction factors for the RHT and CSCM models.
The hydrostatic response in Figure 10 (left) of the CSCM, K&C - RIII and MHJC models are sufficiently similar until the solidification pressure limit
The broad diversity of the performance of the models in the material simulations is reflected in the different ballistic responses as shown in Figure 10 (right). The performance of the RHT model exhibits a reduced ballistic response. Despite the accuracy of the CSCM for impact velocities beyond 250 m/s, it overrates the ballistic limit for the lower impact velocities. The K&C - RIII model reveals a tendency to reliably predict the ballistic response with impact velocities higher than 160 m/s. However, low-velocity simulations undervalue the ballistic capacity.
CSCM and RHT parameter readjustment
The investigation of the response of the LS-DYNA concrete models with the default parameters permits comprehending the necessary parameter readjustments. The K&C concrete model - RIII presents adequate performance throughout all the material simulations (uniaxial compression, uniaxial tension and triaxial hydrostatic compression). Thereby the deviation of the residual velocity at impact velocities below 150 m/s is attributed to the damage constitutive formulae of the K&C concrete model. The assessment of the damage functions is excluded in the current study. Consequently, readjustments of the default parameters for the K&C concrete model - RIII are out of scope.
Readjustments for the parameters of the CSCM and RHT models are necessary because the default parameters: (1) produce weak tensile strength, (2) fail to deliver the solidification phase of the porosity evolution under hydrostatic pressure and (3) provide a considerably low reduction factor for the tension and shear meridians. Therefore, an identical procedure to the MHJC model calibration was followed for the redetermination of the CSCM and RHT parameters.
Categories of MHJC, CSCM and RHT concrete constitutive parameters.
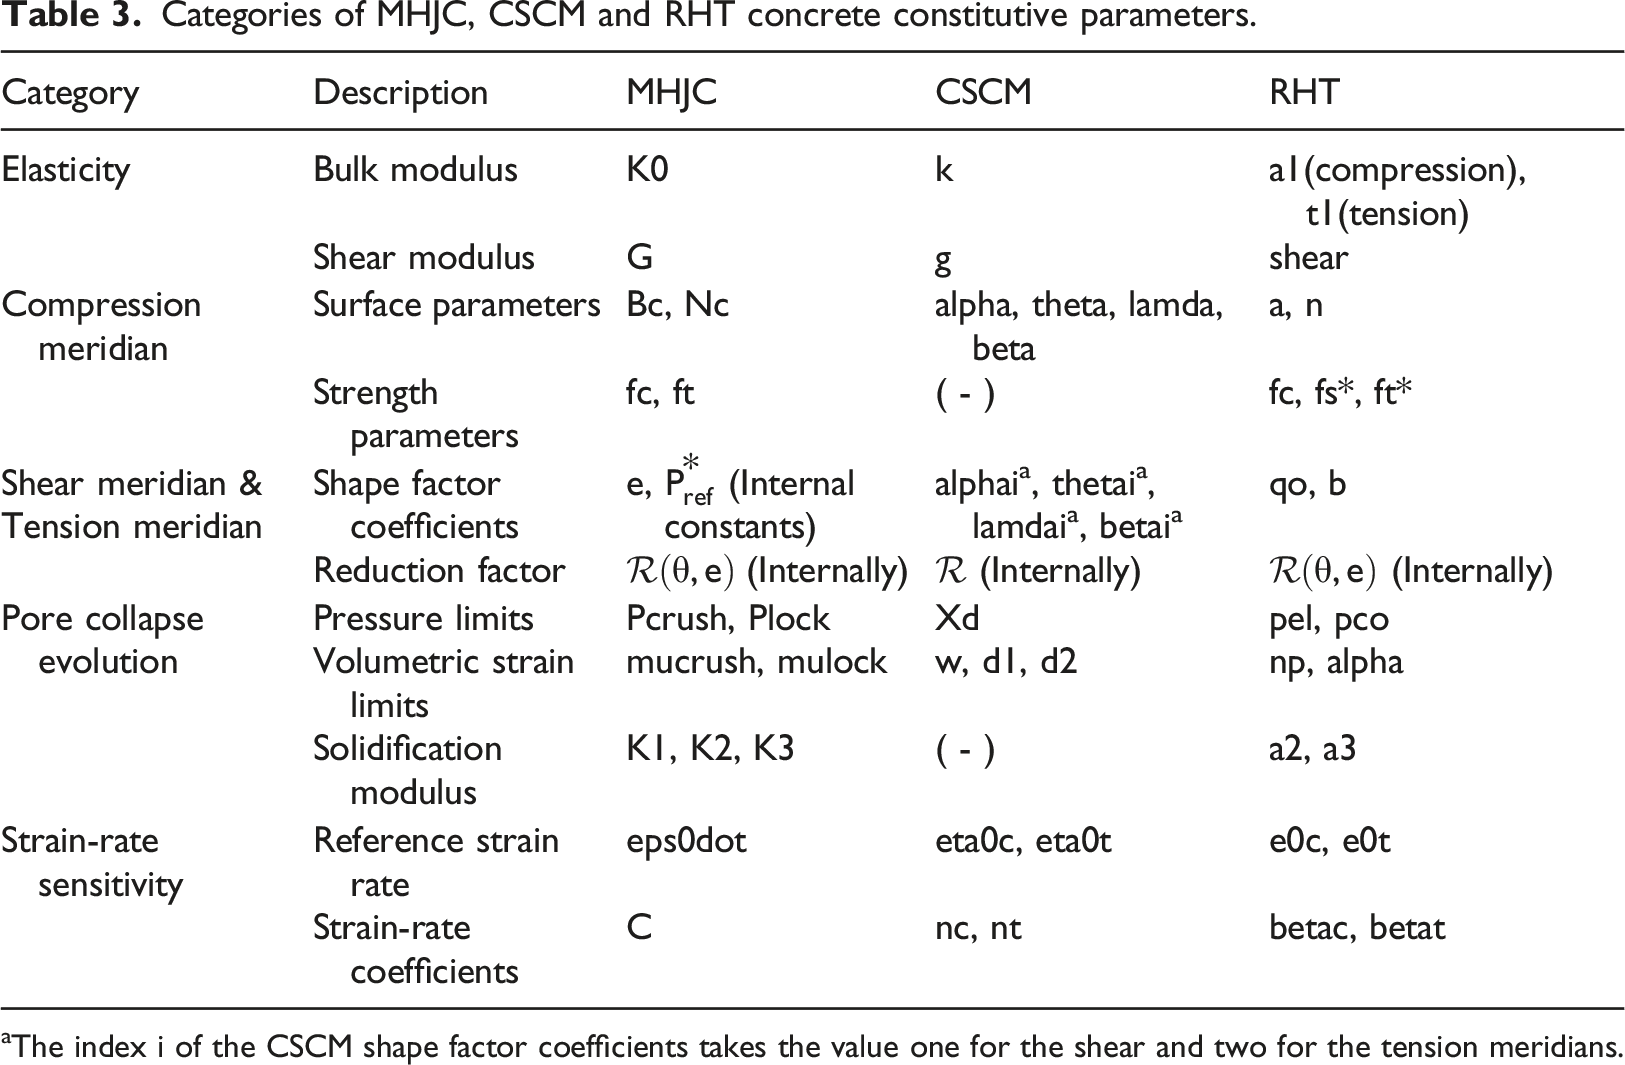
aThe index i of the CSCM shape factor coefficients takes the value one for the shear and two for the tension meridians.
The elastic parameters were taken directly from the concrete’s mechanical properties. The compressive strength Stress-strain curves of quasi-static compression (left) and tension (right). Normalized compression meridian yield surface-to-compression strength (left) and deviatoric plane (right).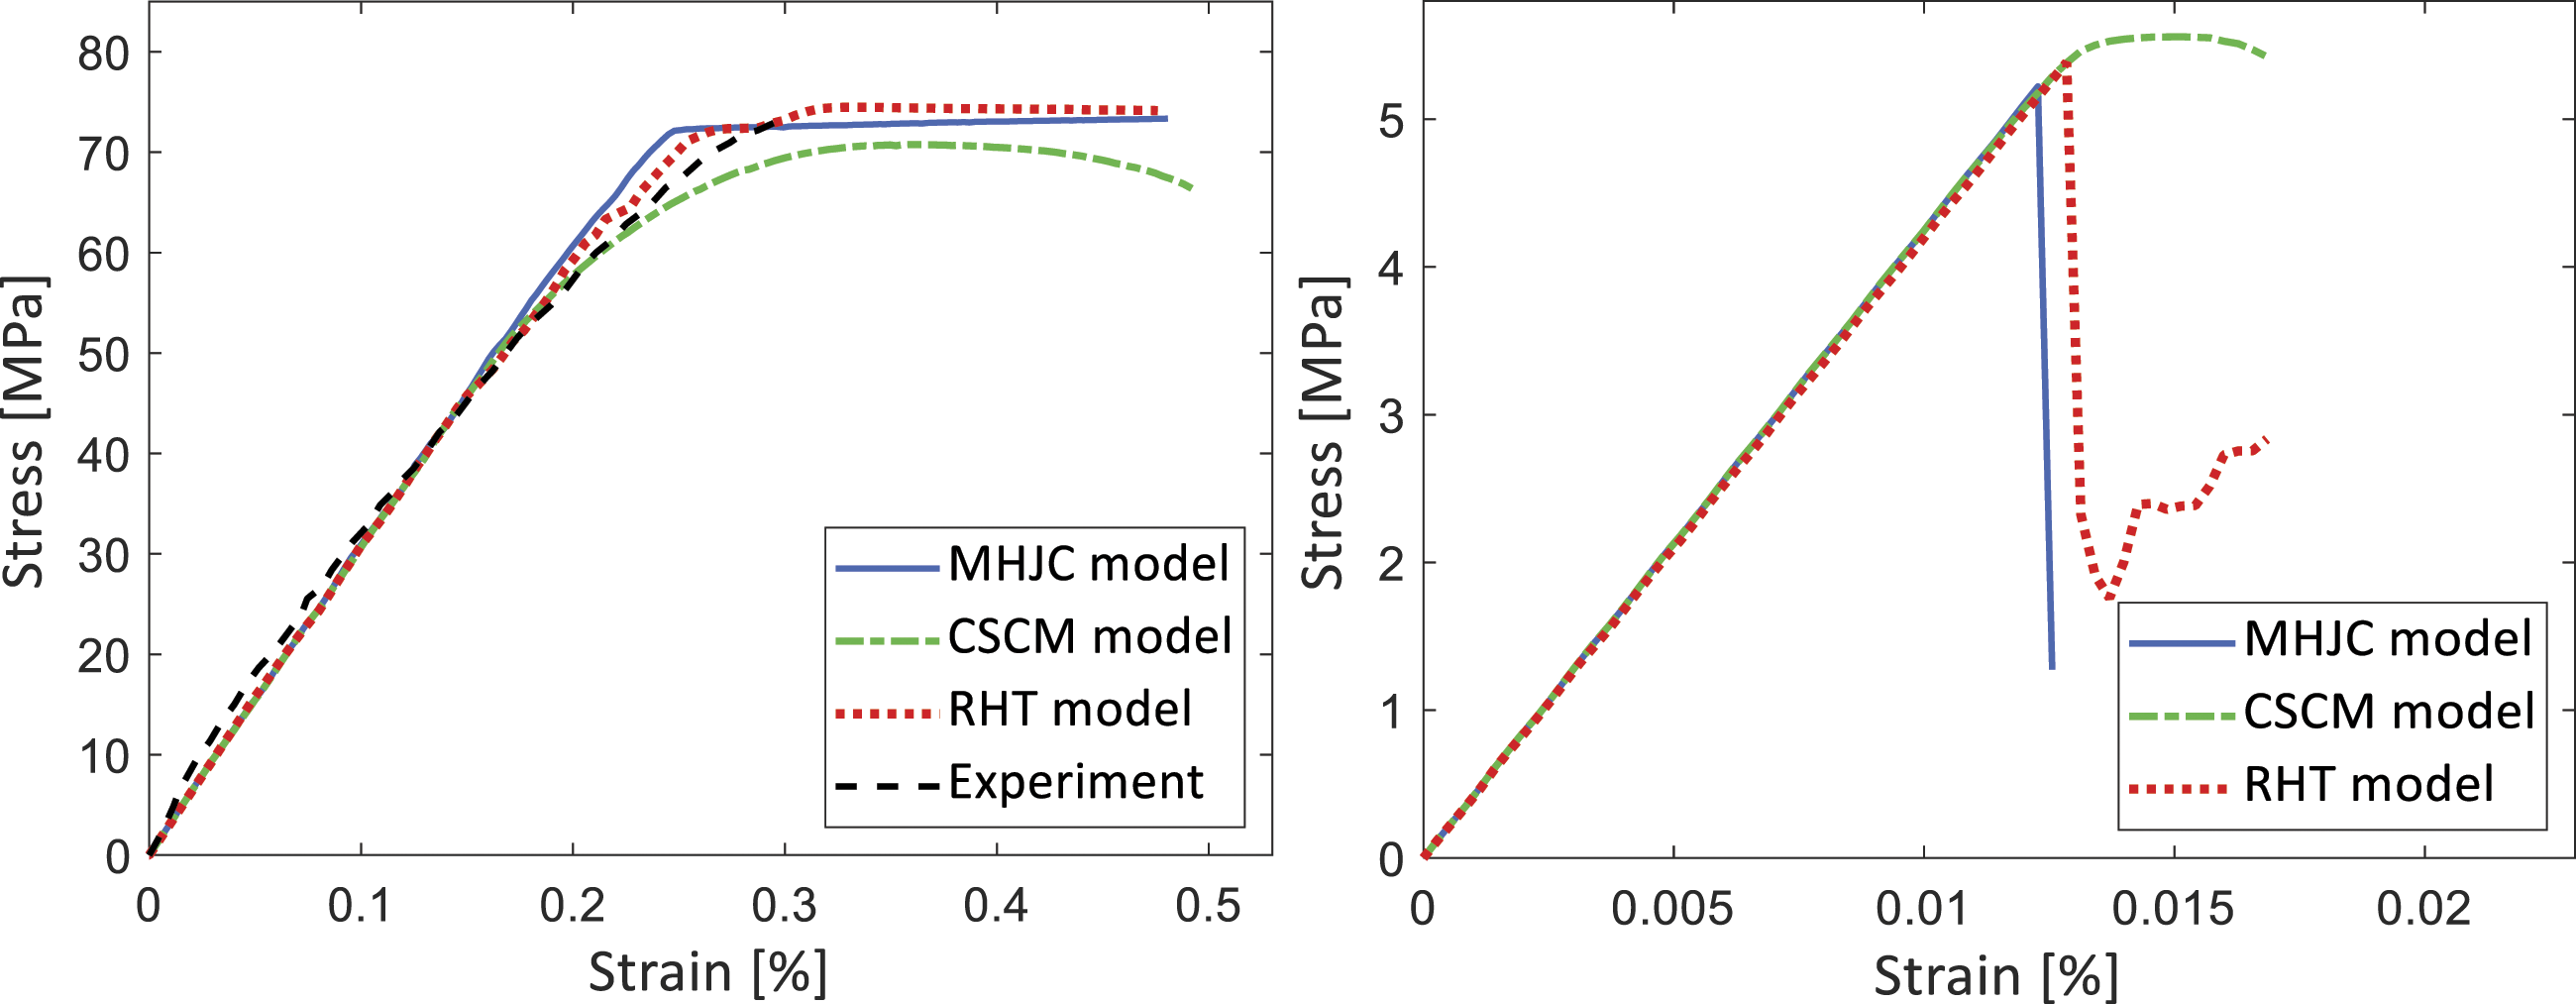
The CSCM shape factor parameters were defined from equation (6); thus Reduction factor of tension meridian (left) and shear meridian (right).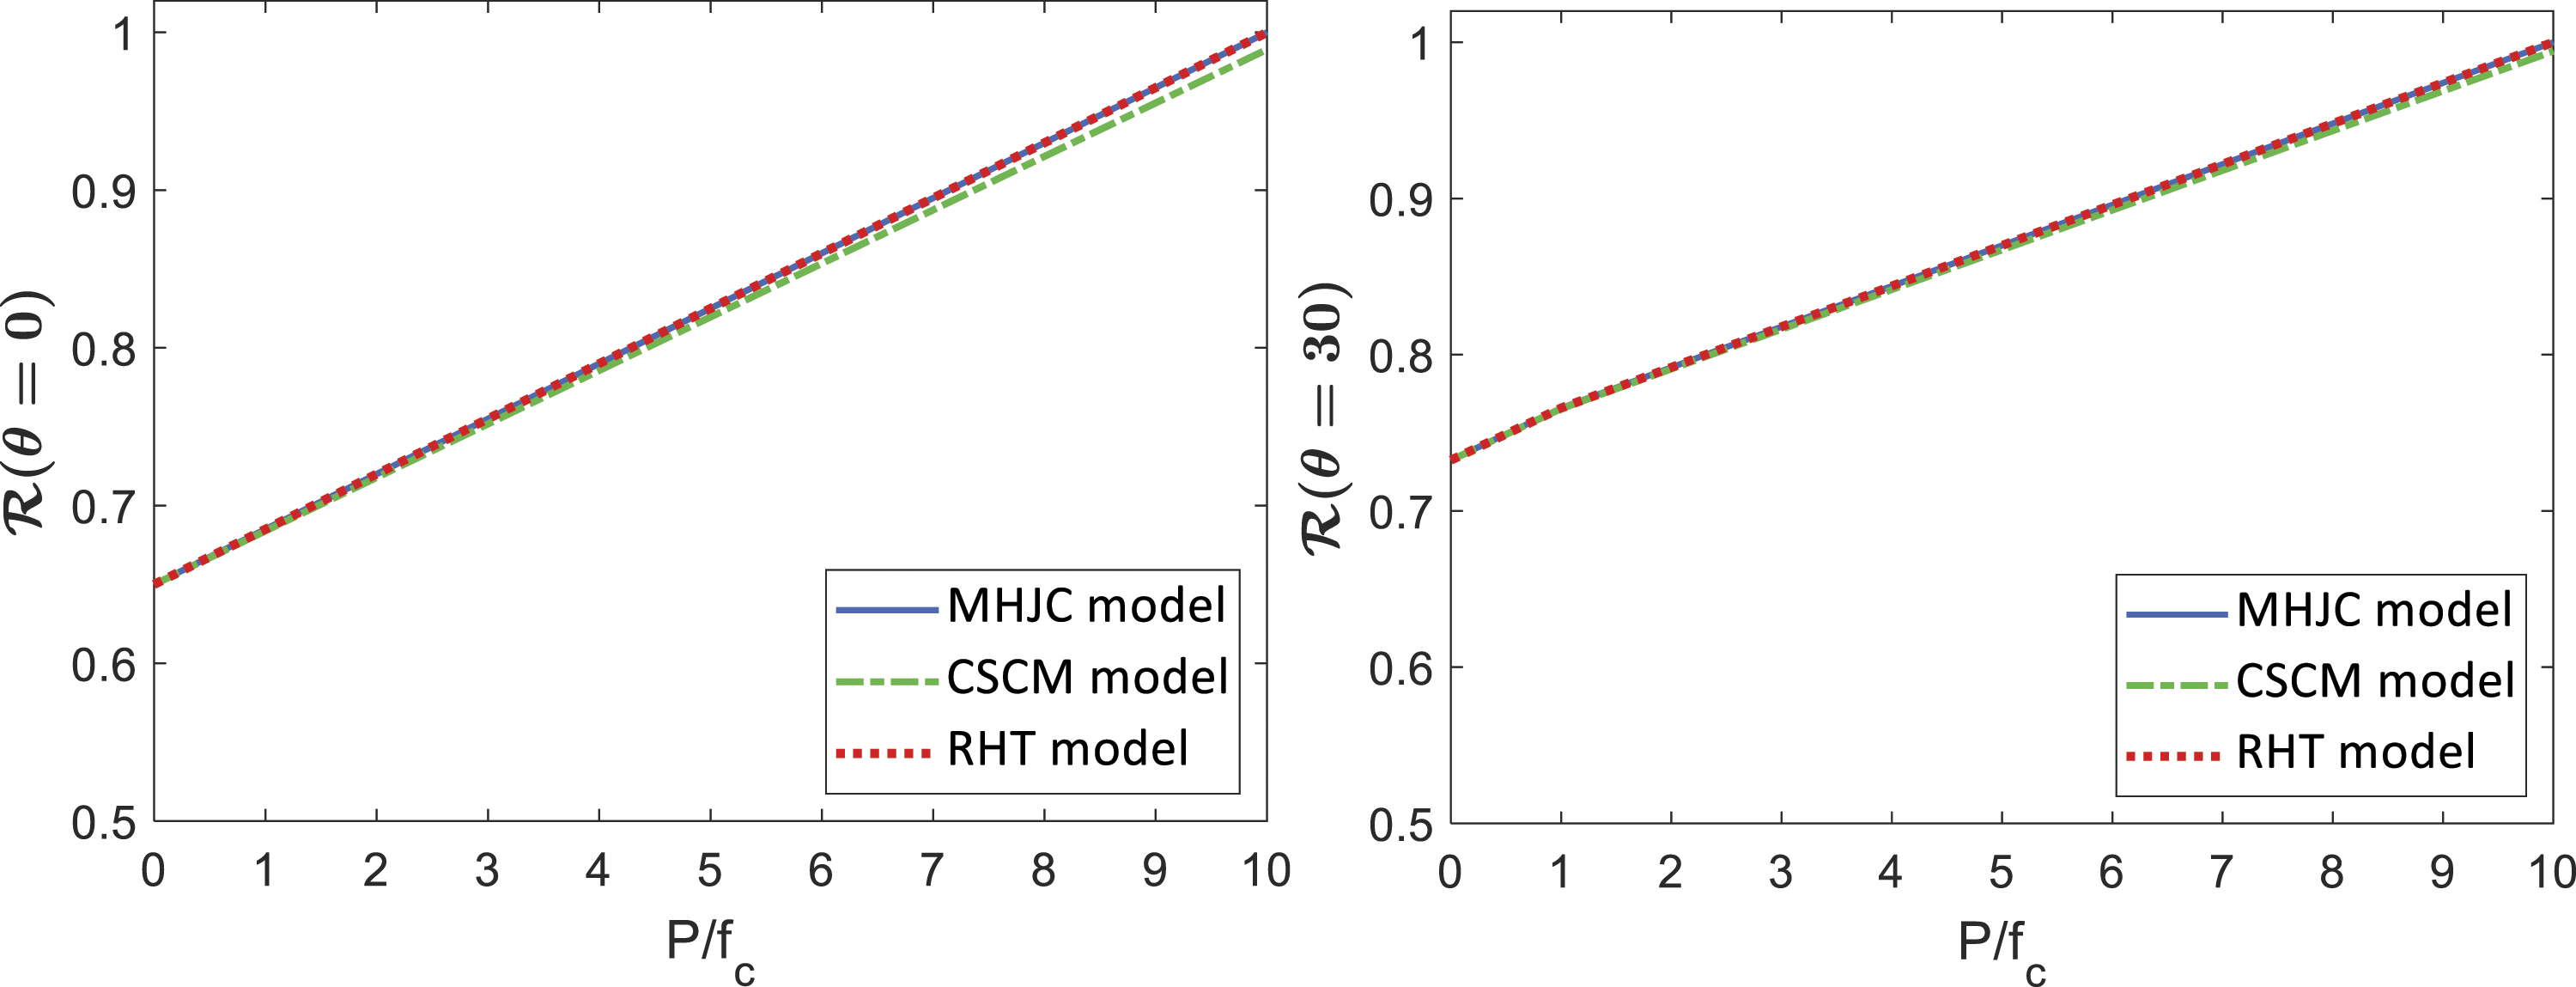
The pressure limits of all three models are equivalent, bear in mind that CSCM constitutive equations are functions of the invariant Triaxial hydrostatic simulation (left) and ballistic limit curves (right).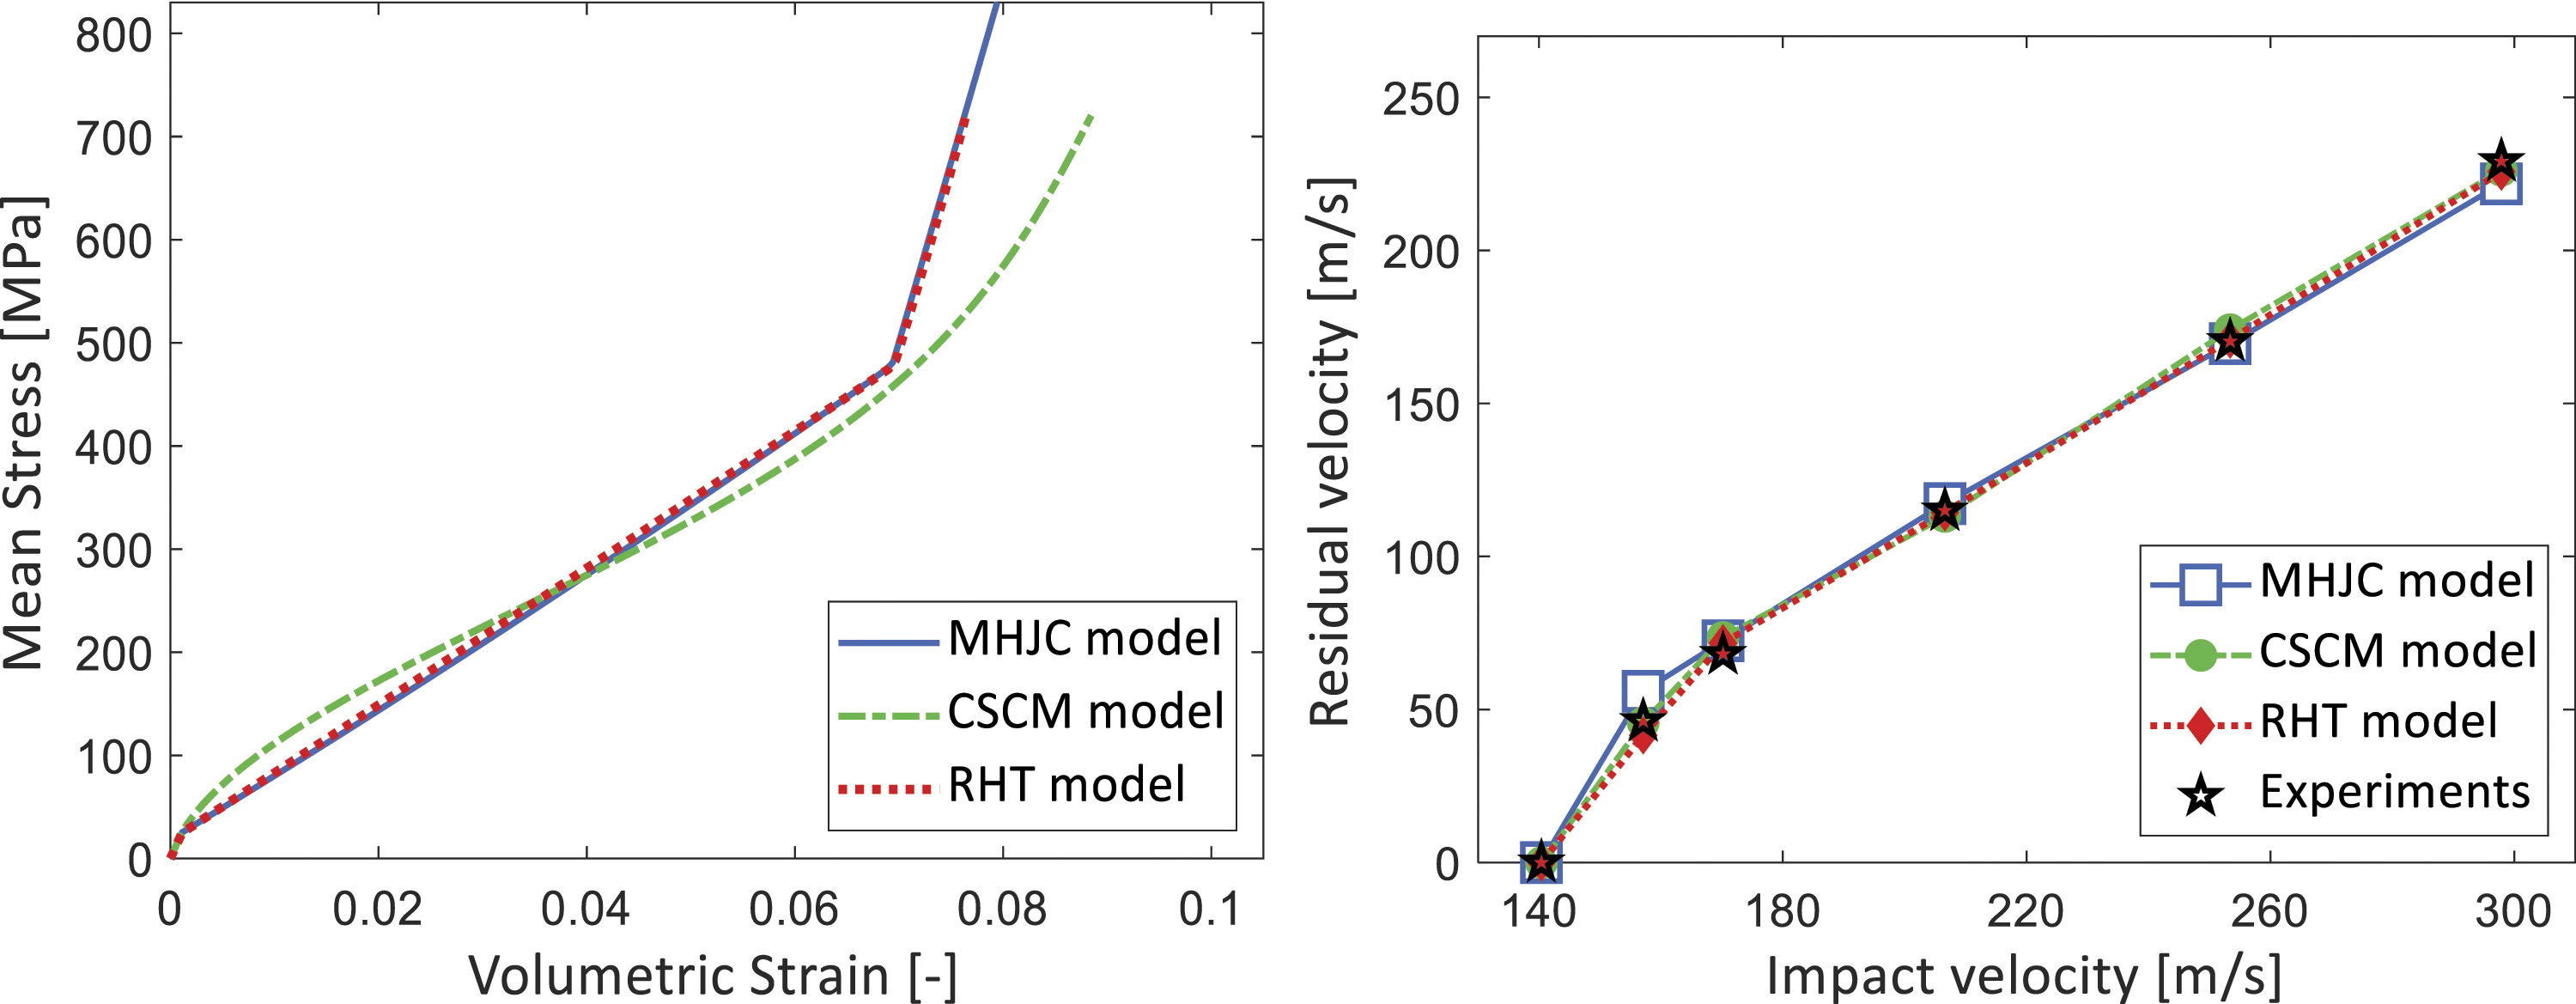
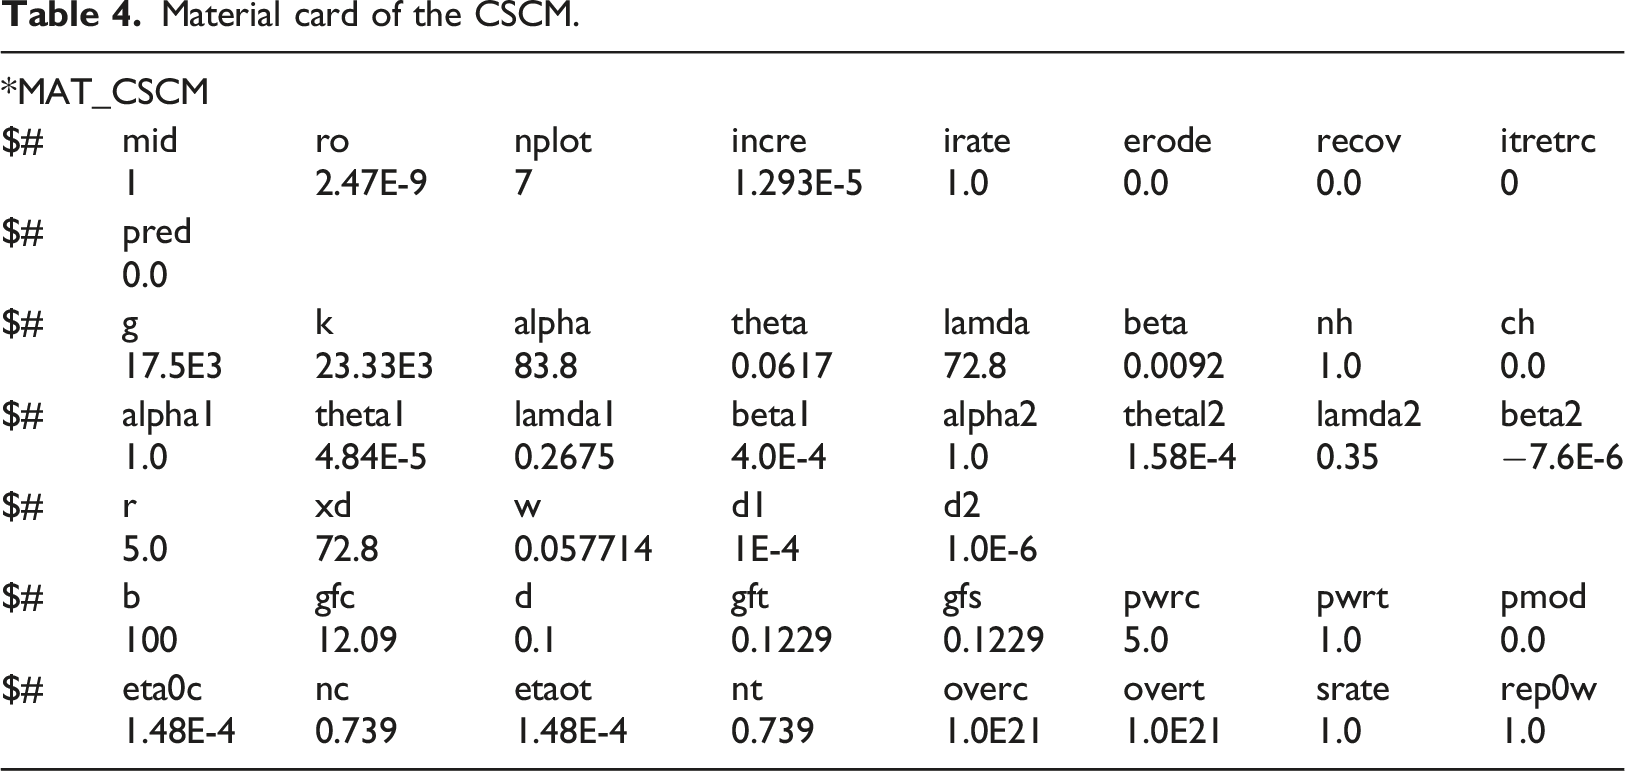
Material card of the CSCM.
Material card of the RHT model.
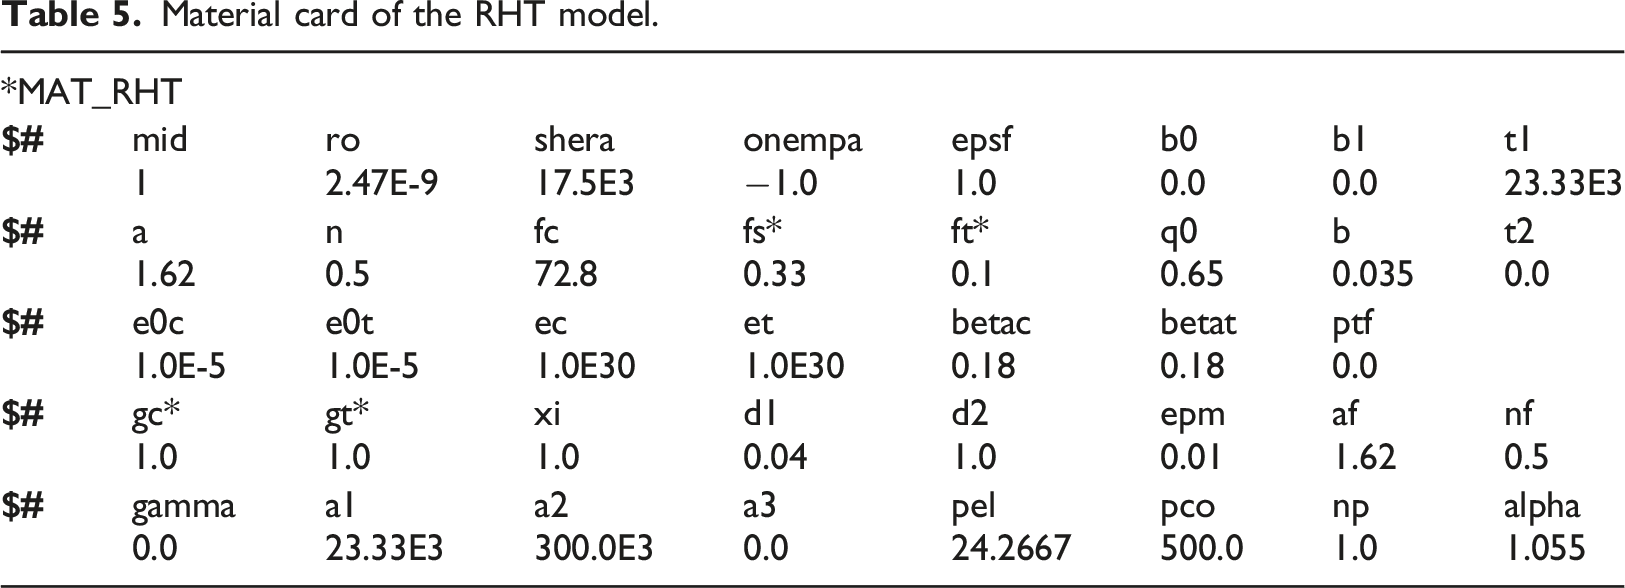
Figure 15 illustrates fringe plots of the maximum volumetric strain Fringe plot of the maximum volumetric strain 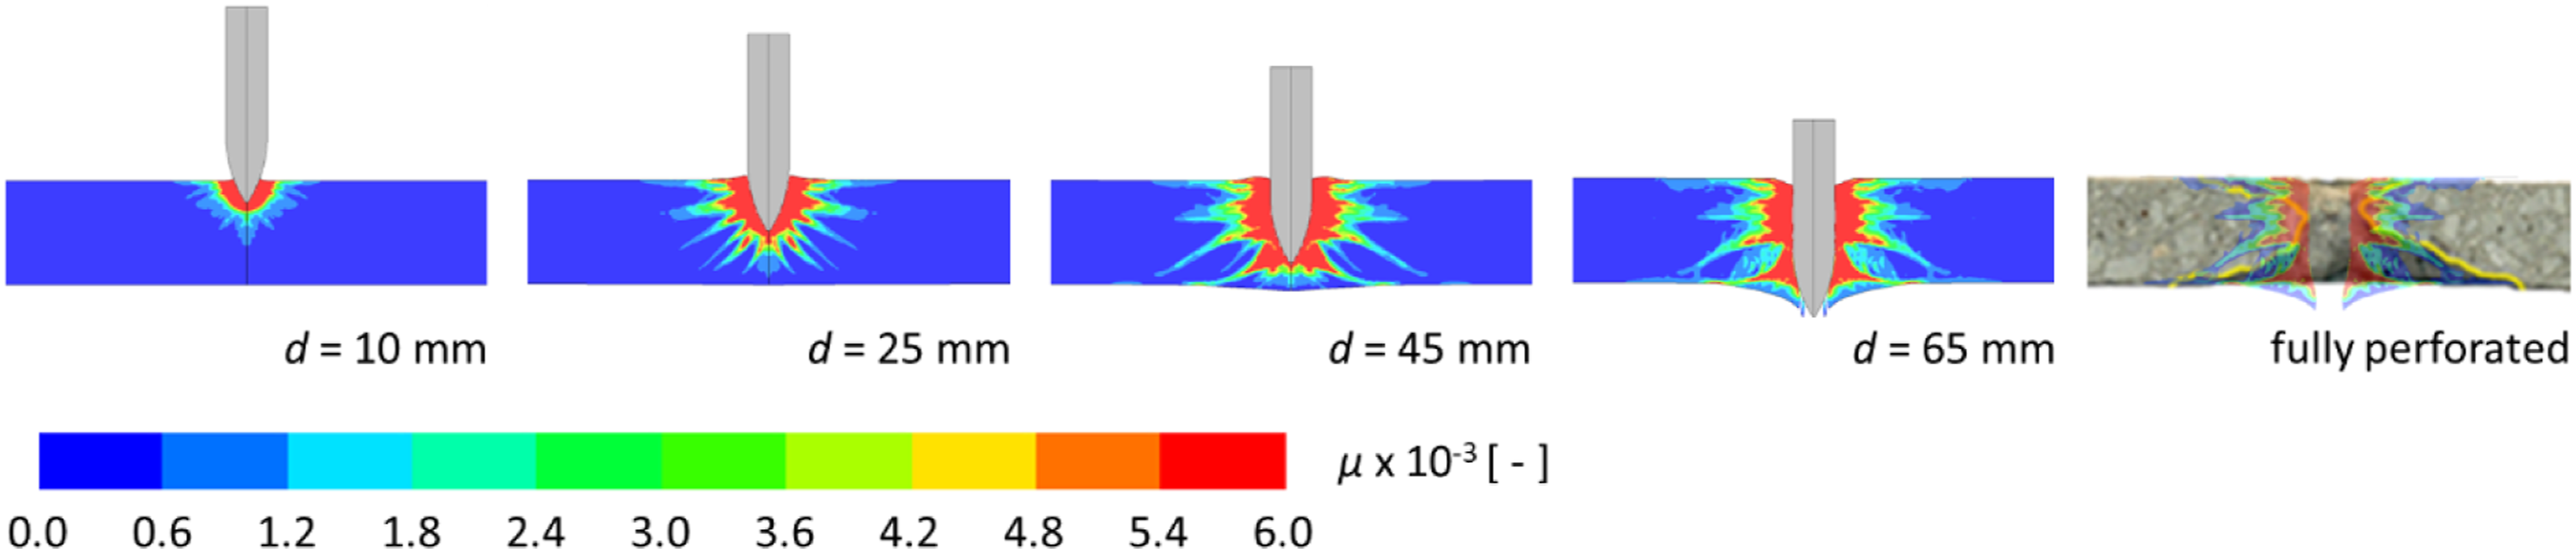
Concluding remarks
In this study we have evaluated automatic versus material test-based calibrations of concrete models for ballistic impact simulations. The first objective was to investigate the accuracy of the automatic parameter generators to produce input data for some commonly used material models. The second objective was to establish and evaluate a simplified parameter calibration procedure based on standard material experiments and data from the literature. The results employing automatic parameter generators varied notably between the models while still giving decent ballpark estimates. However, the parameters obtained from inverse modelling of standardized material tests improved the ballistic results significantly. Thus, the findings of this study recommend caution when using automatic parameter generators for ballistic impact simulations. Based on the work herein, the following main conclusions can be drawn: • The MHJC model calibrated based on experimental data gave good predictions for the quasi-static compressive engineering stress-strain curve and for predicting the residual velocity of an ogive-nose projectile perforating a 50 mm thick C75 concrete slab. • The CSCM, RHT and K&C models’ built-in parameter generators yielded reasonable results for the quasi-static engineering stress-strain curves from cylinder compression tests. There was, however, notable scatter in the estimated tensile capacity and in the residual velocity from the perforation simulations. Thus, the automatic generators should be used with caution. • Adjusting the parameters of the CSCM and RHT models based on material tests significantly improved the numerical results for all simulated cases. It is thereby recommended to use at least some experimental data for calibration of these models. • While dynamic and triaxial material tests are desirable for calibration, it is still possible to improve the accuracy of FE simulations significantly by using data from common material tests like cube compression, cylinder compression and tensile splitting.
Footnotes
Declaration of conflicting interests
The author(s) declared no potential conflicts of interest with respect to the research, authorship, and/or publication of this article.
Funding
The author(s) disclosed receipt of the following financial support for the research, authorship, and/or publication of this article: The present work has been carried out with financial support from the Centre of Advanced Structural Analysis (CASA), Centre for Research-based Innovation, at the Norwegian University of Science and Technology (NTNU) and the Research Council of Norway through project no. 237885 (CASA).