
Abstract
The present work addresses the secondary debris from concrete slabs subjected to contact detonations. The secondary debris is propelled away from the concrete structure on its protective side and can cause severe injuries to persons and damage technical installations. The analysis is based on a series of experimental tests using a newly developed test setup. This setup allows a detailed analysis of the protective side of the concrete slab regarding the spatial velocity distribution of the secondary debris and the preceding fragmentation of the concrete. Both the spatial velocity distribution of the secondary debris and the geometry of the spalling crater are approximated by rotationally symmetric descriptions to derive the kinetic energy of the secondary debris. The derived kinetic energy of the secondary debris is then used for a quantitative evaluation of steel fibers in the concrete.
Introduction
Although the total number of terrorist attacks has mostly decreased in recent years IEP (2023), their public awareness has increased significantly. This is largely due to the ongoing crises, their unpredictable nature, and the extensive media coverage of attacks Karlos and Larcher (2020). As a result, there is a growing need for countermeasures to protect people and critical infrastructure from explosive attacks.
In the past, the focus of explosive attacks on buildings has been on the lower floors, where large quantities of explosives can be transported in a vehicle. The primary countermeasure to this threat is to harden structures and add perimeter controls to create distance between the explosive attack and the target building.
Due to developments in the field of Unmanned Aircraft Systems (UAS), commonly referred to as drones, UAS are becoming commercially available at relatively low purchase cost and are capable of carrying significant amounts of explosives over long distances Karlos and Larcher (2023). This completely changes the scenario of an attack, as explosives can now be transported to locations on higher floors of a building that were previously considered safe. It also allows the explosives to be transported much closer to the target, since the airspace around a building in an urban environment is difficult to control. As a result, attacks become more focused on a specific area of a building and can cause significant damage with smaller amounts of explosives than those transported in a vehicle.
In contrast to an explosion far away from a structure, the loading from a contact detonation is much more localized. The resulting damage depends on the direct interaction of the blast wave with the material rather than on global parameters such as support conditions. As a result, concrete fragments can be propelled away from the structure on the supposedly protected side, where they become a threat to people or technical installations. Since the concrete fragments originate from the loaded structure and not from the explosive or its casing, they are referred to as secondary debris.
Test setup
In order to gain a deeper insight into the mechanics of secondary debris from reinforced concrete slabs subjected to contact detonations, a series of tests was conducted. The reinforced concrete slabs in this test series have external dimensions of 2.0 m × 2.0 m and thicknesses of 20 cm, 25 cm and 30 cm.
They are made from normal strength concrete with an average static compressive strength (cube) of 43 MPa. The reinforcement is installed crosswise on both sides using reinforcing bars with a diameter of 10 mm, a spacing of 150 mm and a concrete cover of 35 mm. The reinforcing steel is high ductility steel B500 B.
To analyze the influence of steel fibers, the 30 cm thick concrete slabs have varying steel fiber contents between 0.0 Vol % and 2.0 Vol %. The employed steel-fibers are Dramix 4D 65/35 BG from Bekaert, which are hooked steel fibers with a length of 35 mm and a diameter of 0.55 mm Bakaert (2023).
The explosive used in this series of tests is SEMTEX10. After weighing, the explosive was molded into a PVC pipe with a circular cross section and an internal diameter of 103 mm. The resulting length to diameter (L/D) ratios of the charges with masses of 1000 g, 1500 g and 2000 g are 0.7, 1.1 and 1.4 respectively. These cylindrical charges were placed so that one of their flat surfaces was flush with the surface of the reinforced concrete slabs. The charges were ignited in the center of the surface of the explosive charge facing away from the reinforced concrete slab at a depth of approximately 1.0 cm.
To observe the secondary debris, the concrete slabs were installed in an upright position during the detonation tests. High-speed (HS) cameras were used to record the protective side of the concrete slabs. The HS recordings were then analyzed to determine both the velocity of the secondary debris and the preceding fragmentation. After testing, the damaged areas of the concrete slabs were measured with 3D scans and evaluated with respect to the geometry of the spalling crater.
Figure 1 shows the layout of the experimental setup (left) and a photo of the protective side (right) of the concrete slab. More information about this test setup and the measurements performed can be found in Hupfauf and Gebbeken (2022) and Hupfauf (2024). Layout of the experimental setup (left) and a photo of the protective side (right).
The goal of this series of tests is to investigate the characteristics of the secondary debris on the protective side of a concrete slab resulting from contact detonations.
Scaled concrete slab thickness
The results of the experimental tests are described in terms of a scaled thickness of the concrete slab. This quantity has already been used by other authors such as Weerheijm et al. (1988) and Morishita et al. (2000) to describe the impact of a contact detonation on a concrete slab. The scaled thickness is defined similarly to the scaled distance, which is a common quantity used to differentiate the impact of near-field and far-field detonations. The scaled thickness allows a combined description of the concrete slab thickness T and the equivalent explosive mass Wsp,TNT by a single parameter T
W
.
The cube root of the explosive mass reflects the fact that the detonation initially propagates in all directions.
Influence of the charge geometry
To include the influence of the different L/D ratios of the explosive charges in the evaluations, an energy equivalent impulse introduced by Rigby et al. (2019) is used. In contrast to an evaluation based on the total impulse, the energy equivalent impulse I
Ek
also contains some information about the distribution of the specific impulse i on the area A it acts on.
In Rigby et al. (2021), the application of the energy equivalent impulse is restricted to thin steel plates (span-thickness ratio
For this purpose, numerical simulations of the explosive charge are performed using the commercial hydrocode LS-Dyna version R13.1.0 Lsdyna (2021). To reduce the computational cost, the symmetry of the test setup is exploited by modeling only a quarter of the setup with symmetry boundary conditions. Both the explosive charge and the airspace are described using the Structured Arbitrary Lagrangian Eulerian (S-ALE) solver as implemented in LS-Dyna.
The explosive charge is modeled inside an ALE domain with symmetric boundary conditions (Figure 2). The size of the numerical mesh of 1.25 mm is based on a convergence study for the resulting total impulse. Instead of modeling a concrete structure in contact with the explosive charge, one side of the ALE domain has reflecting boundary conditions (gray shaded in Figure 2). This removes the influence of a contact algorithm between the explosive charge and the concrete structure from the simulation and allows a separate investigation. The flat surface of the charge in contact with the concrete structure is modeled flush with this reflecting boundary. The remaining boundaries are defined with flow-out conditions to allow free propagation of the blast wave out of the simulated ALE domain. Numerical model of the explosive charge.
Material parameters for SEMTEX10.
The reflected pressure is output at 10 mm intervals in the radial direction along the reflecting boundary of the ALE domain (tracer points in Figure 2). To ensure that the results are not affected by boundary effects, the tracer points are aligned along the diagonal of the quarter-symmetric model. The resulting specific impulse histories are calculated from the pressure histories by cumulative numerical integration. The total impulse and energy equivalent impulse are then calculated by rotational integration of the specific impulse histories.
The numerical simulations are performed for cylindrical charges with an explosive mass of 1000 g and varying L/D ratios between 0.2 and 2.0. These charges are initiated at the end of the explosive charge opposite the reflecting boundary. In addition, analogous simulations are performed for centrally ignited spherical charges with explosive masses between 500 g and 3500 g.
To compare the cylindrical charges with the spherical charges, an equivalence factor EF
sp
is defined as the ratio between the masses of spherical charges W
sp
and cylindrical charges W
cy
that generate an equivalent total impulse (t) or an energy equivalent impulse (e).
Figure 3 shows both spherical equivalence factors EFsp,e/t for the inspected range. The blue solid line shows the equivalence factor based on the total impulse (t) and the orange dash-dotted line shows the equivalence factor based on the energy equivalent impulse (e). For further use, fitted equations are added with the L/D ratio as a linear variable. Spherical equivalence factor EFsp,e/t in dependence on L/D-ratio for total impulse and energy equivalent impulse.
As can be seen in Figure 3, a spherical and a cylindrical charge with the same explosive mass generate an energy equivalent impulse for L/D = 1.0 and an equivalent total impulse for L/D = 0.85. For greater L/D ratios, the cylindrical charge generates a smaller load on a structure in contact because more energy is directed in the radial direction of the cylindrical charge. For smaller L/D ratios, the cylindrical charge generates a greater load than a spherical charge of the same weight.
To compare the different equivalence factors, the maximum x-velocities measured in the test series are plotted in Figure 4 against the inverse of the scaled concrete slab thickness calculated according to equation (4). Maximum x-velocities over scaled thickness without consideration of the shape of the explosive (left), using the spherical equivalence factor with respect to the total impulse (middle) and the spherical equivalence factor with respect to the energy equivalent impulse (right).
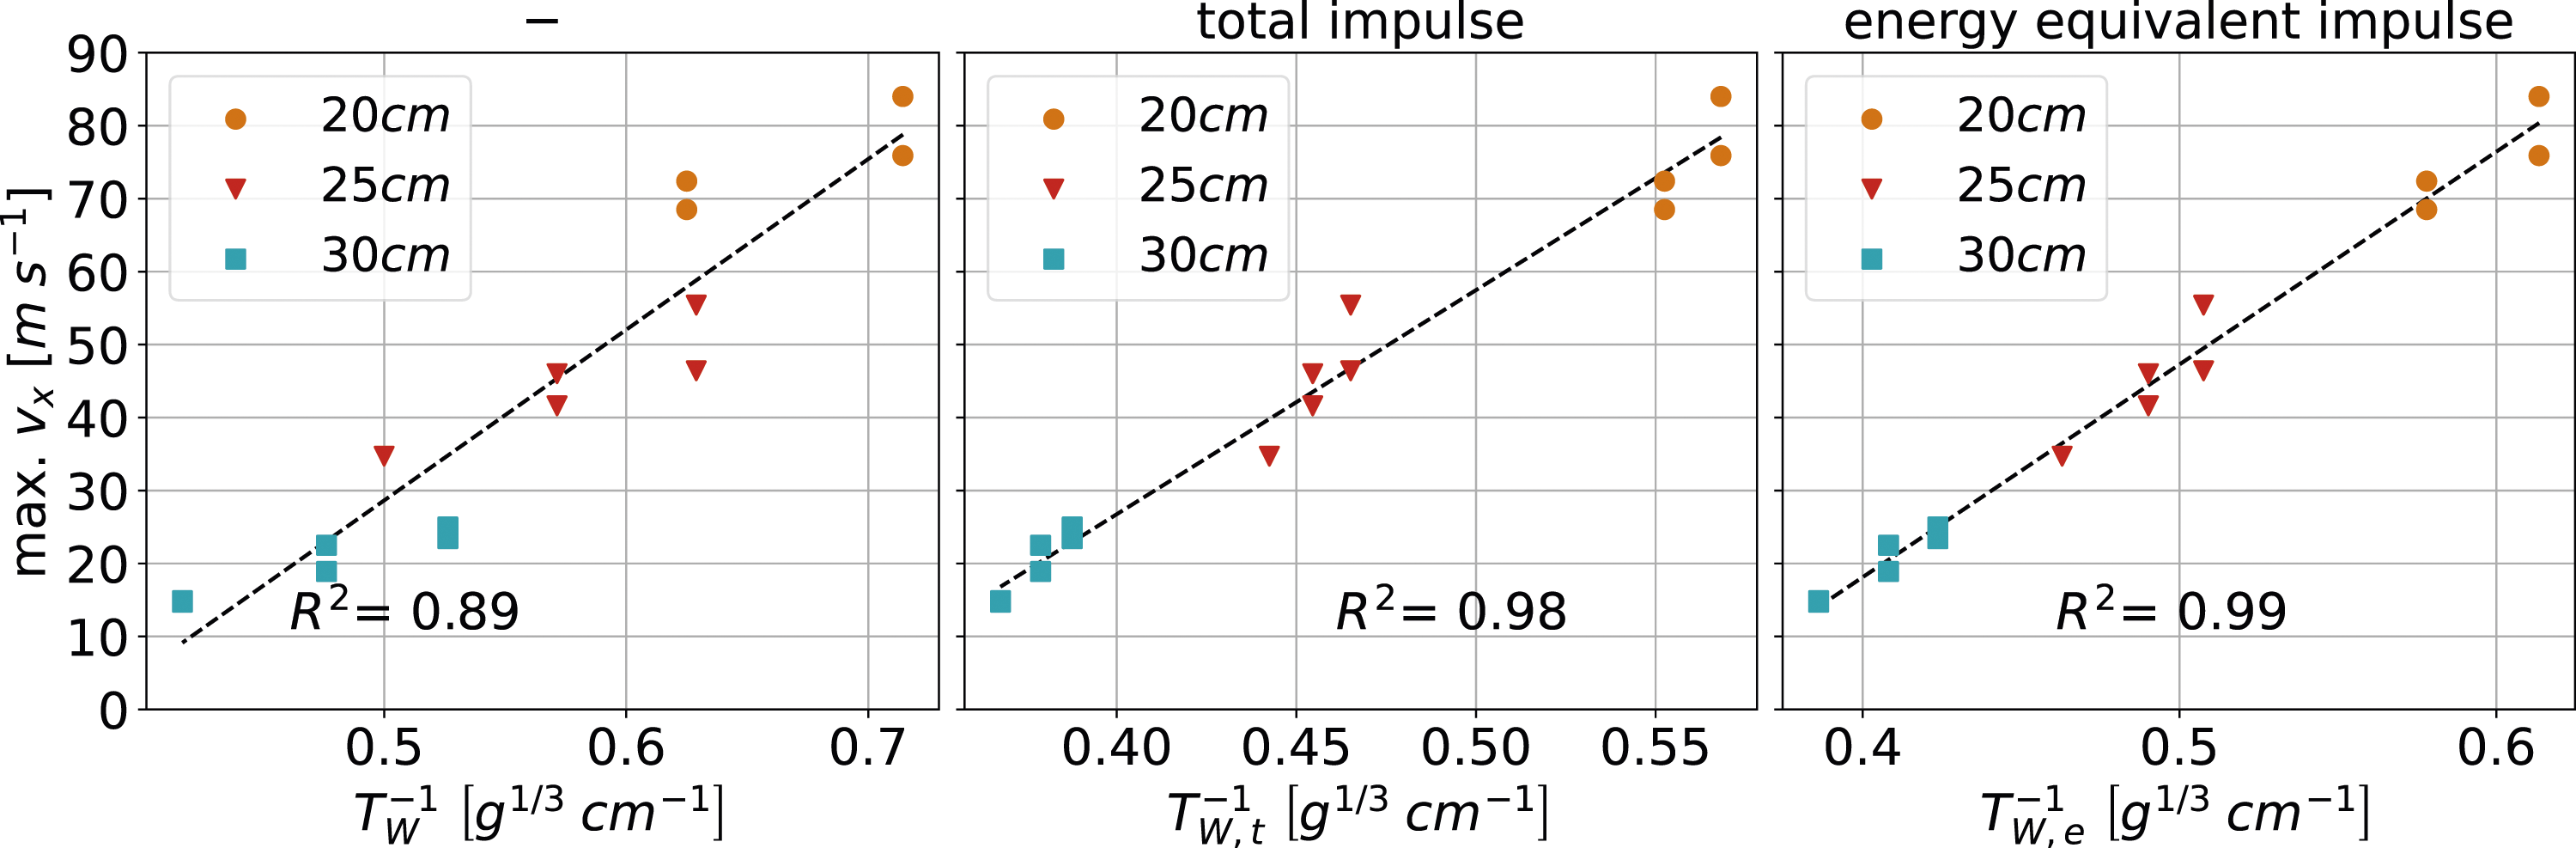
Where T is the thickness of the concrete slab in cm and W TNT,* is an equivalent explosive mass of TNT in g including the respective equivalence factor for the L/D ratio. The TNT equivalence factor for SEMTEX10 is determined by similar simulations based on the total impulse EF TNT,t = 1.17 and the energy equivalent impulse EF TNT,e = 1.24. The TNT equivalence factor based on the energy equivalent impulse is consistent with the results of Shirbhate and Goel (2021), who determined a TNT equivalence factor of 1.25 for SEMTEX10 based on the heat of detonation.
The three plots in Figure 4 show the determined maximum x-velocity of the secondary debris over the inverse of the scaled concrete slab thickness. On the left without considering the shape of the explosive, in the middle using the spherical equivalence factor with respect to the total impulse and on the right using the spherical equivalence factor with respect to the energy equivalent impulse.
The coefficients of determination R2 show a significant improvement in the linear correlation between the scaled concrete slab thickness and the maximum x-velocity due to the additional spherical equivalence factors. The main difference is that without considering the shape of the explosive (left), there is an overlap in the direction of the scaled thickness between the groups of different concrete slab thicknesses at
Between the two cases with the additional spherical equivalence factors, the correlation improves only slightly from R2 = 0.98 to R2 = 0.99. However, there is an improvement that is visually apparent especially in the region of the concrete slabs with a thickness of 25 cm. Therefore, the spherical equivalence factor in terms of the energy equivalent impulse is used for the evaluations of this test series.
For better readability, the scaled thickness based on the TNT and spherical energy equivalent impulse is referred to as T W in the following and the additional index is omitted.
Shape of the spalling crater
The mass and velocity of the secondary debris are the necessary quantities to derive its kinetic energy. The evaluation of the mass based on the geometry of the spalling crater and the measurement of the velocity have already been discussed in Hupfauf and Gebbeken (2022). Nevertheless, the basic assumptions are repeated here for better understanding.
The shapes of the spalling craters were documented using 3D scans of the damaged concrete slabs. To evaluate the resulting point clouds, their scanned coordinates are transformed into cylindrical coordinates, with the central normal vector of the concrete slab as the axis of rotation (x-axis). These coordinates are then rotated around this x-axis into a common radius-depth plane, separately for each test. The resulting cylindrical coordinates are then approximated by higher order polynomials. The endpoints of these polynomials are fixed to the determined radii of the breach and the spalling crater.
Figure 5 shows an example of the scanned coordinates projected onto a common x-z plane by gray dots. The transformation of these coordinates into cylindrical coordinates is shown by black dots and the approximation by a higher order polynomial by a red line. This procedure unifies the irregular geometry of the spalling crater and thus allows for a better comparison of different tests based on the assumption of rotational symmetry. Scanned coordinates of spalling crater from test SN144 projected into x-y plane (gray dots) transformed into cylindrical coordinates and depicted in the radius-depth plane (black dots) including an approximation by a higher order polynomial (red line) - (number of points reduced for plot).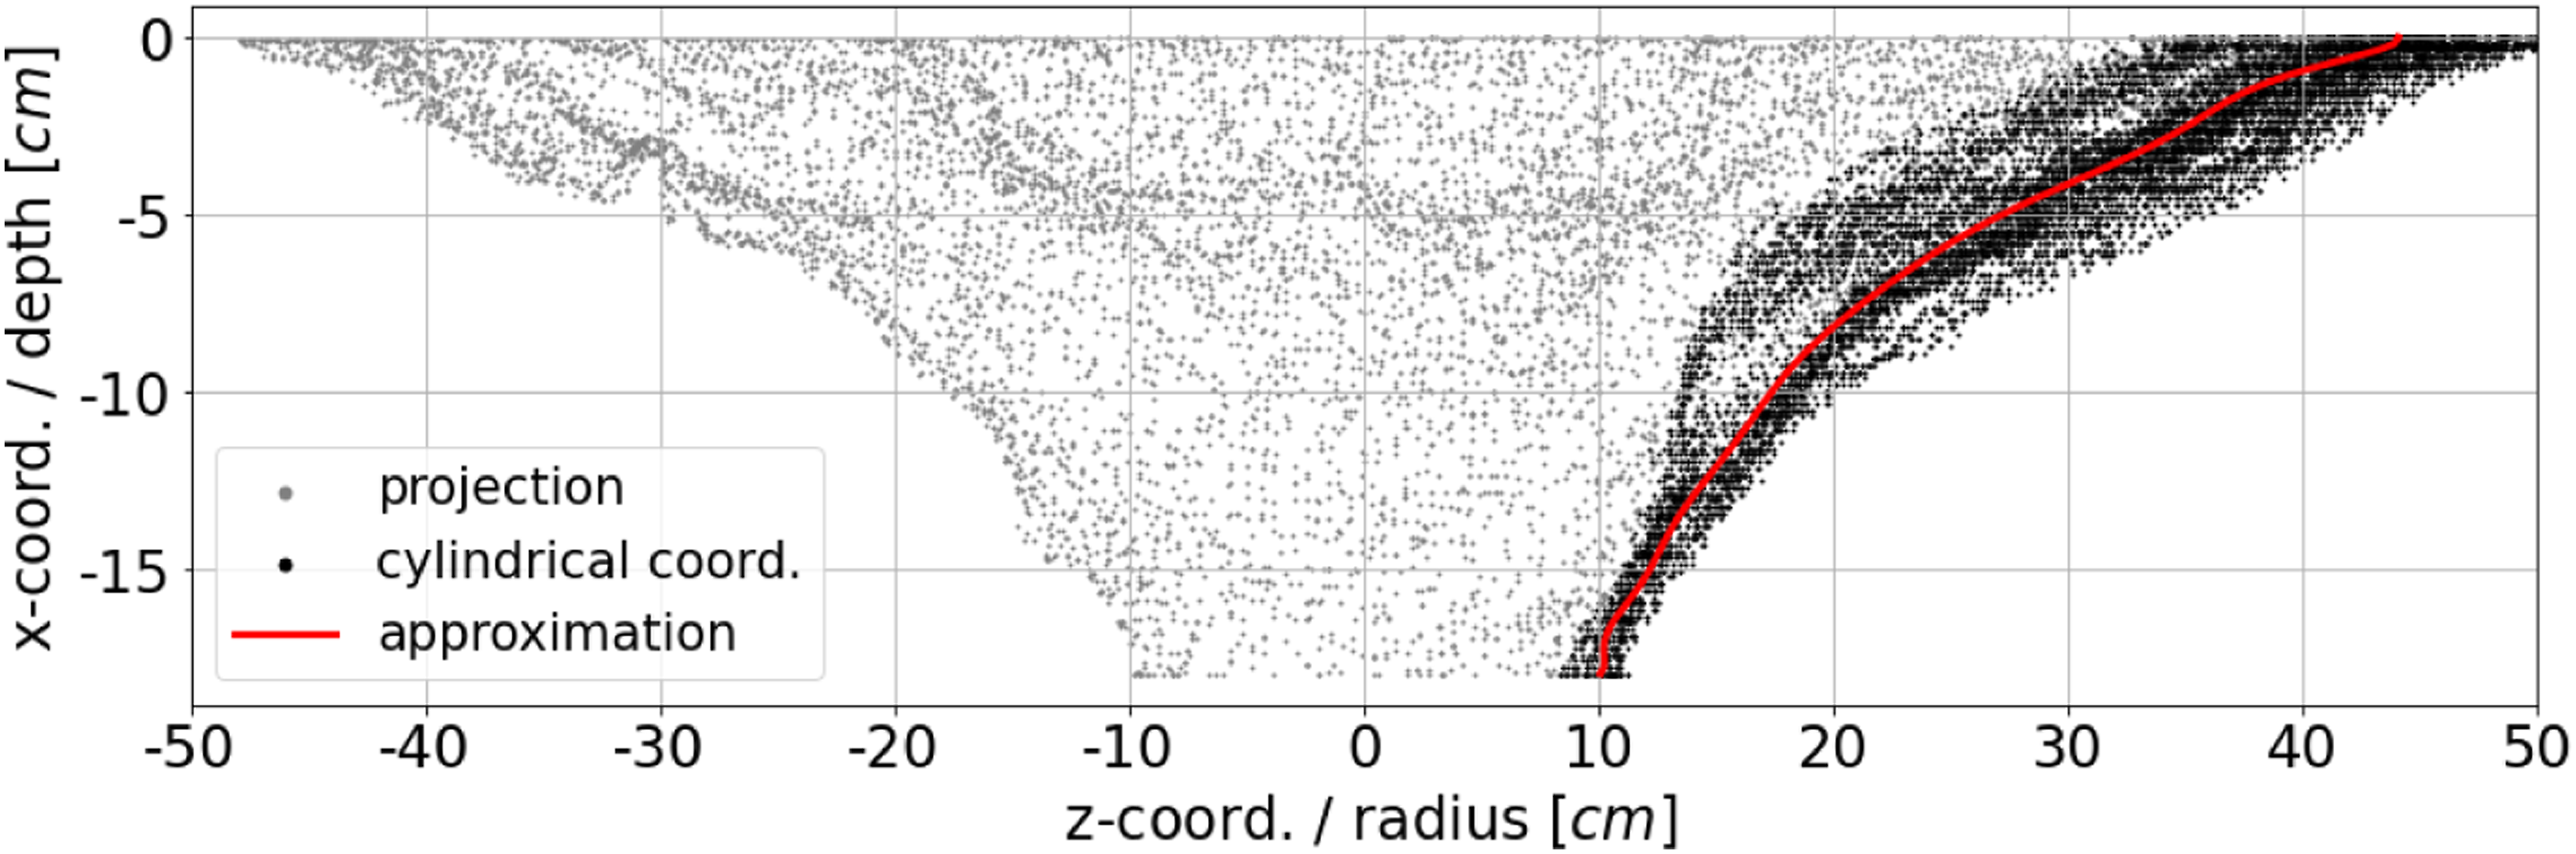
Figure 6 shows the resulting spalling craters shapes for the tests without steel fibers. At the top are the tests with a breach and at the bottom are the tests without a breach. The shapes in Figure 6 show the average values from analog tests to reduce the influence of experimental variation. Visually loose but still attached debris was removed from the concrete slabs before the 3D scans were taken. Averaged shapes of spalling craters from 3D-scans for tests without steel fibers.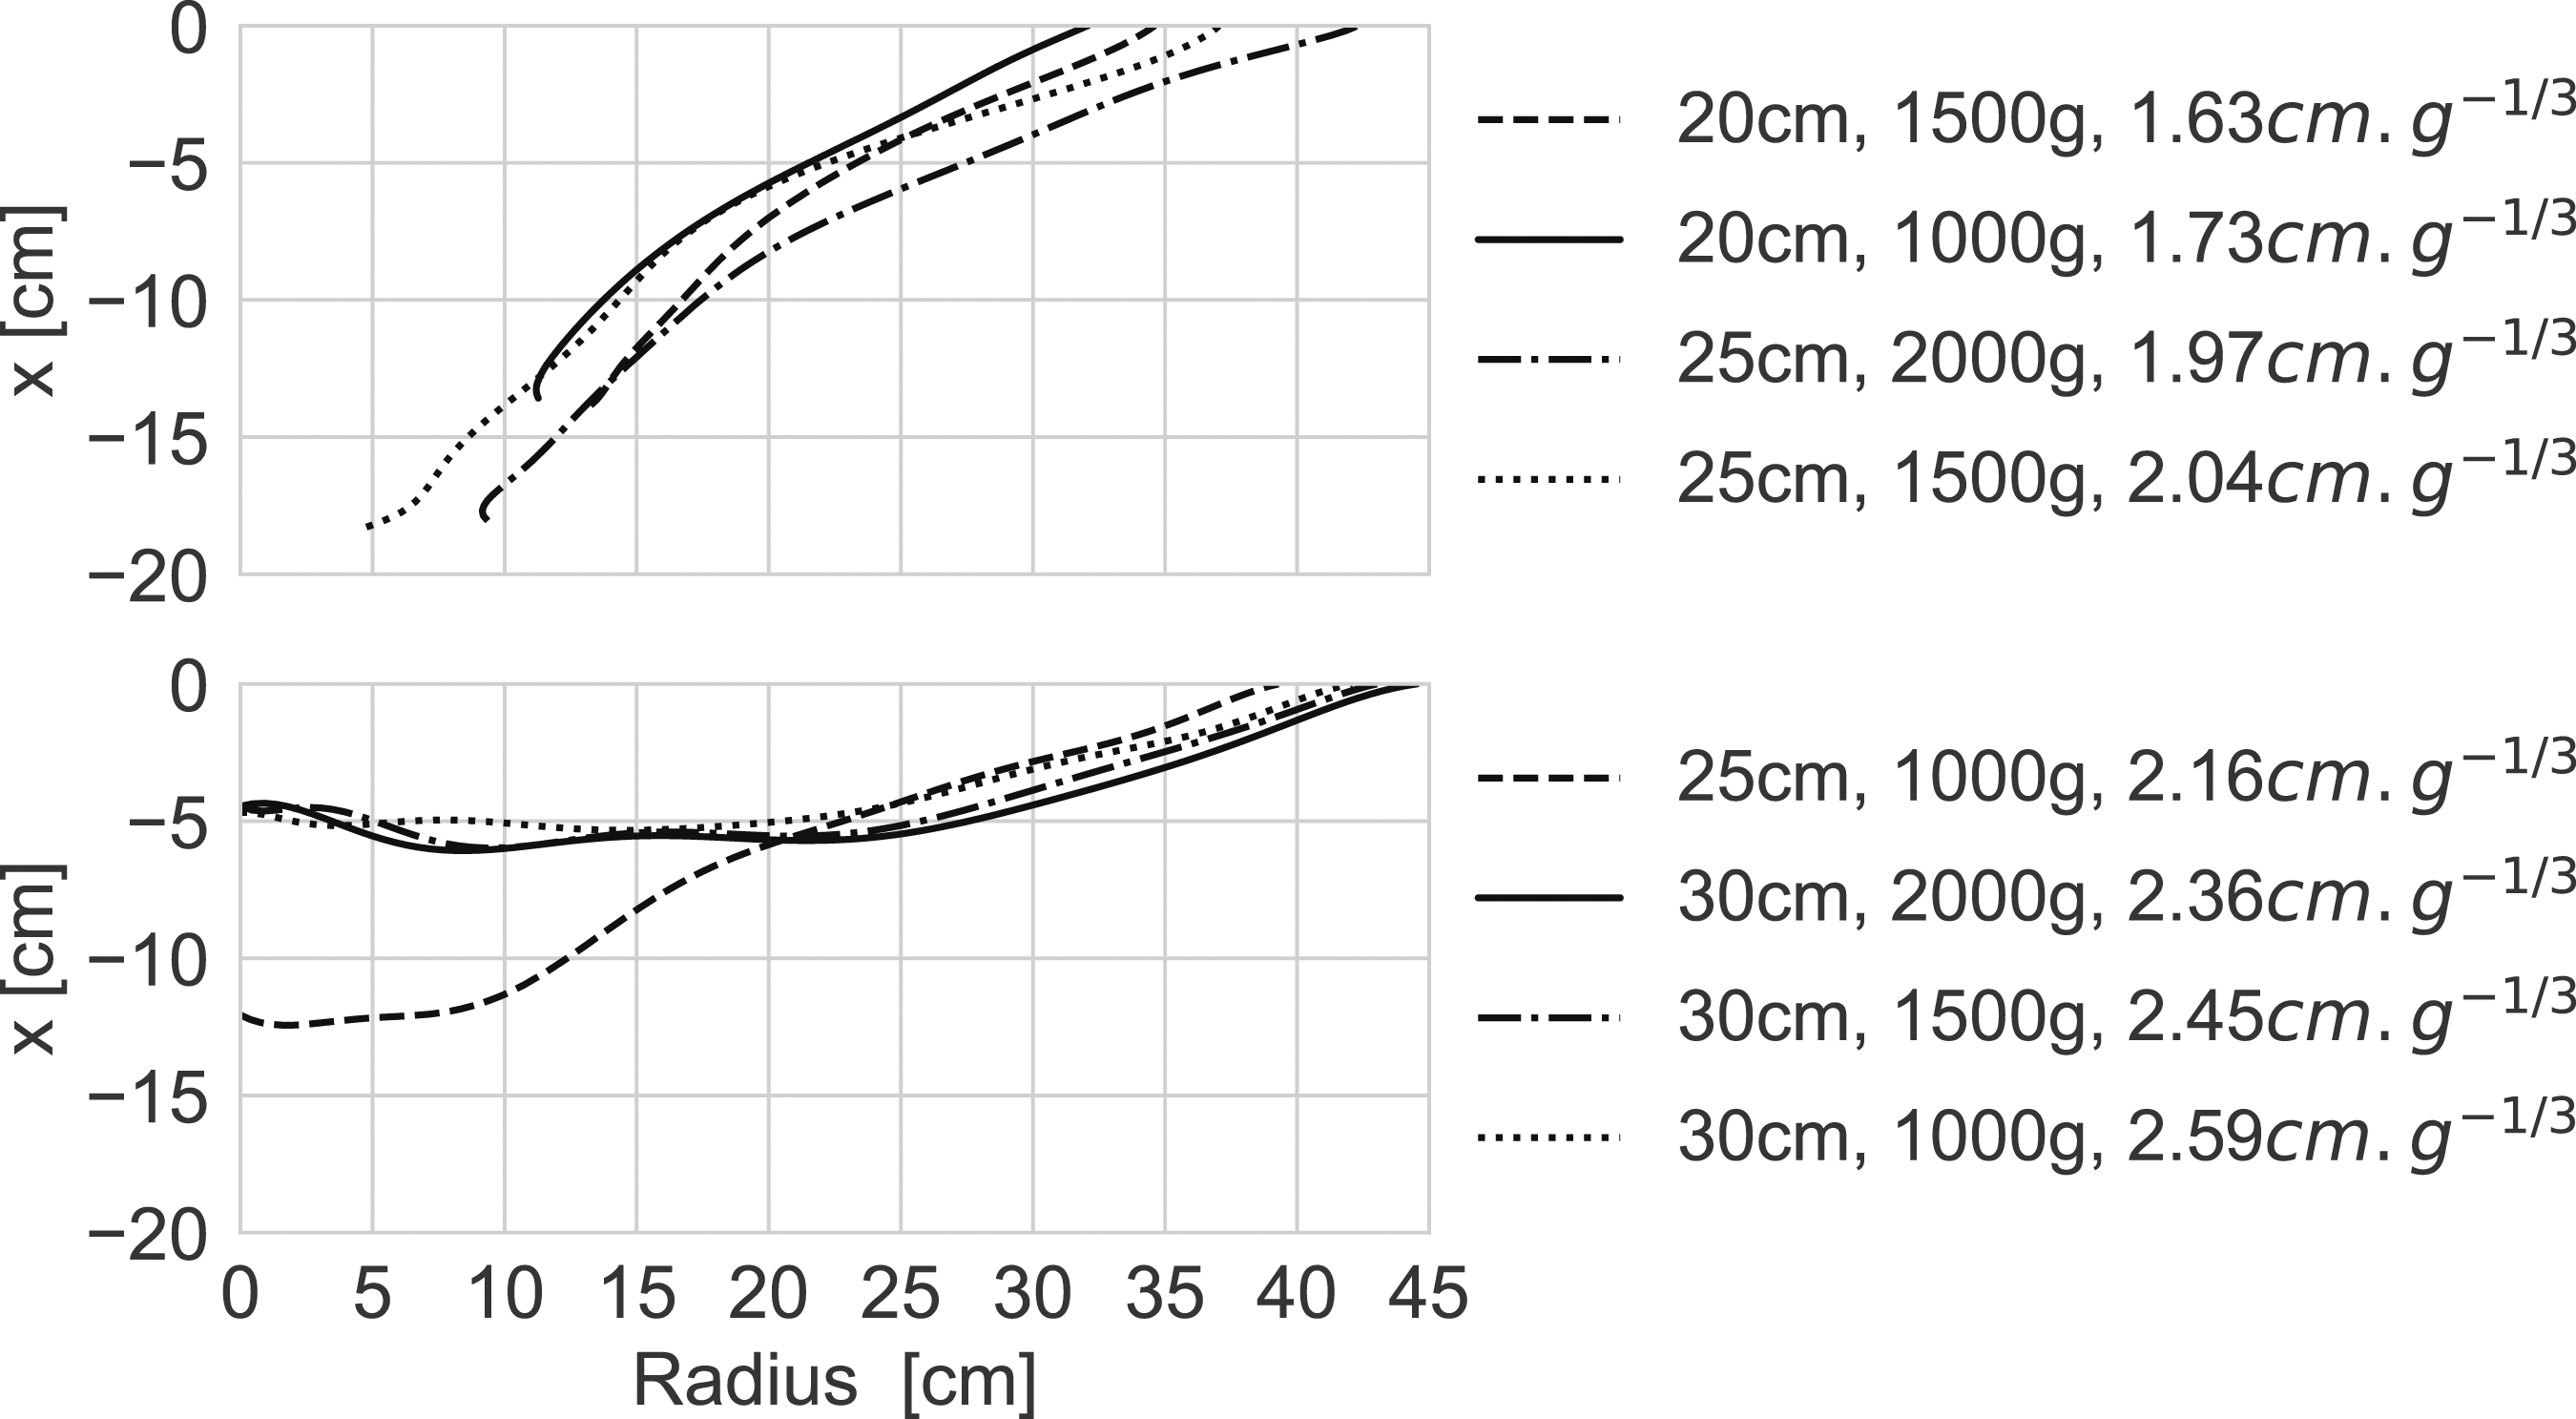
In the present series of tests, a scaled concrete slab thickness of T W = 2.1 cm g−1/3 proves to be a well suited threshold for the occurrence of a breach. For all tests with a scaled thickness of T W <2.1 cm g−1/3, a breach can be observed. For the tests with a scaled thickness of T W >2.1 cm g−1/3, there is no breach and only spalling on the protective side of the concrete slab. This threshold agrees well with that proposed by Morishita et al. (2000), who suggests a scaled thickness of 2.0 cm g−1/3 based on a similar series of tests.
In almost all cases without a breach, the depth of the spalling crater is limited by the position of the rebar relative to the surface of the concrete slab. The only exception is the test with a scaled thickness of T W = 2.16 cm g−1/3, which is slightly above the breach threshold of T W = 2.1 cm g−1/3. This test shows a greater depth of the spalling crater below the rebar layer. However, most of the concrete below the rebar was retained by the rebar during the detonation test and fell out only afterward.
Velocity of secondary debris
The velocity of the secondary debris is determined based on high-speed (HS)-recordings from the protective side of the concrete slab. For this purpose, a tracking algorithm is applied to the HS-recordings, which detects characteristic features and follows them between the different time steps using optical flow.
A feature in this context does not describe a real part of the debris, but rather a unique pattern of neighboring pixels based on their respective color and brightness values. These features are then allocated in subsequent images to document their trajectory. More information on this procedure can be found in Hupfauf and Gebbeken (2022).
An example of the tracking performed is shown in Figure 7 for test SN144 (24 cm, 2000 g). The dots mark the tracked features, with their color representing the determined velocity, and the black dotted lines are the corresponding trajectories. Exemplary tracking for test SN144.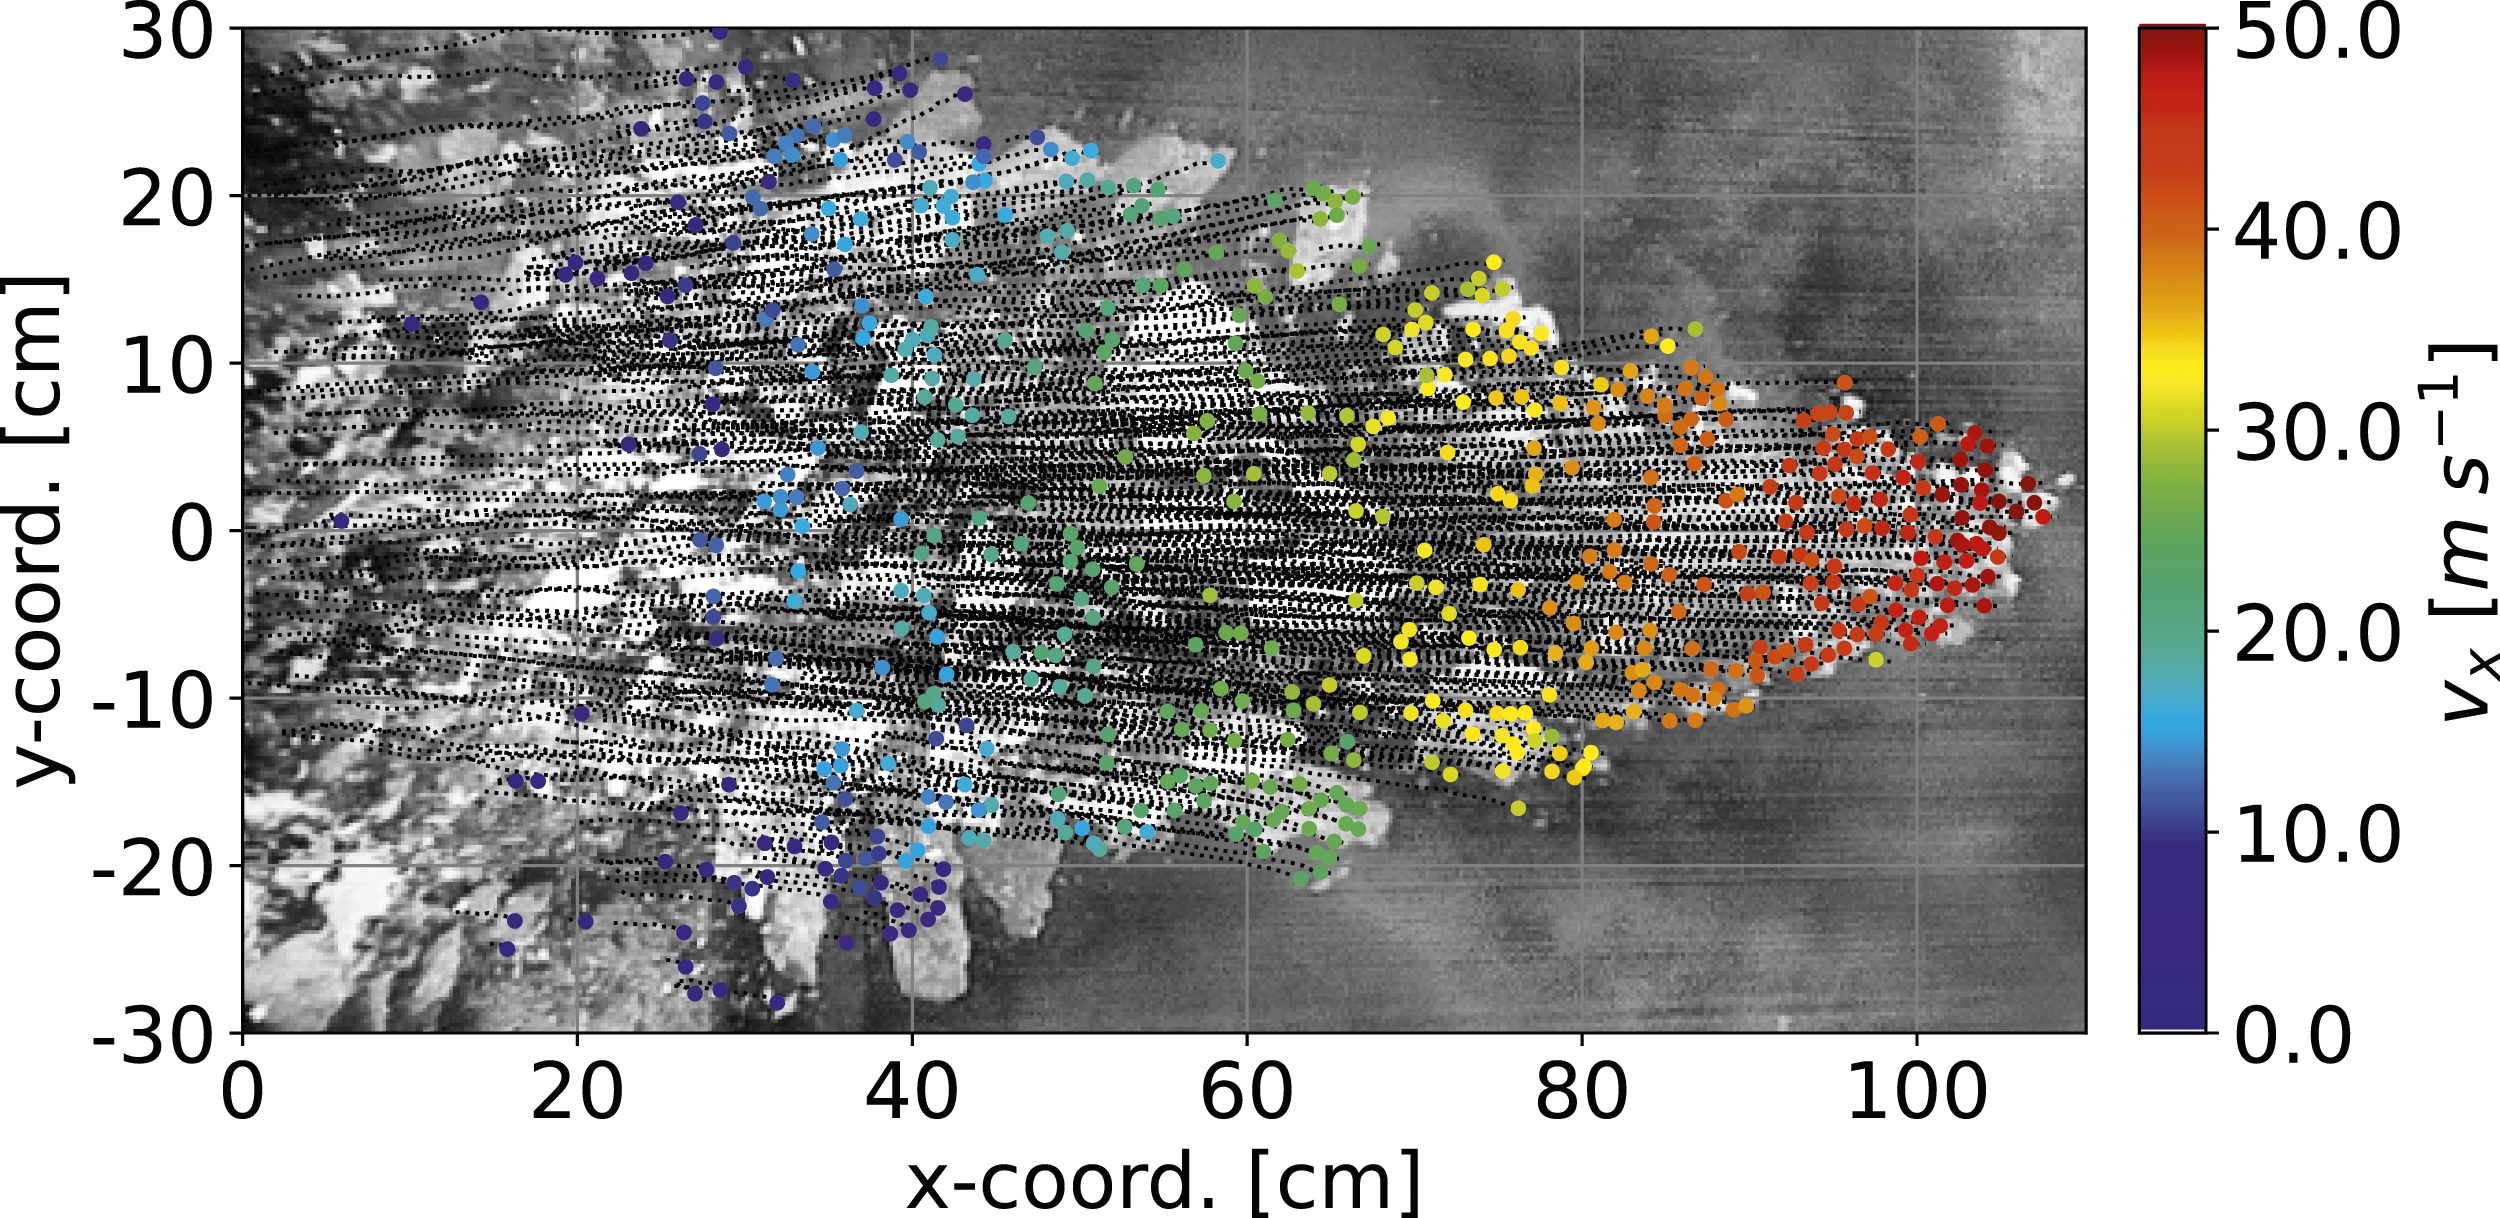
Since the velocity of the secondary debris is dominant in the x-direction, the following evaluations will focus on the velocity in this direction. As shown in Figure 4, there is a convenient linear correlation between the maximum x-velocity of the secondary debris and the inverse of the scaled concrete slab thickness, including the influence of the charge geometry (L/D ratio).
However, the secondary debris is not just a single fragment, but a cloud of multiple fragments with different velocities. Therefore, an enveloping curve of the tracked features is used to approximate the spatial x-velocity distribution of the secondary debris assuming rotational symmetry.
Figure 8 shows the tracked x-velocity distribution in the vertical direction (y-coordinate) for test SN144. The y-coordinate from the HS recordings can also be interpreted as the radial coordinate, assuming rotational symmetry. Analogous approximations for all tests performed can be found in Hupfauf (2024). Approximated distribution of the x-velocity for test SN144.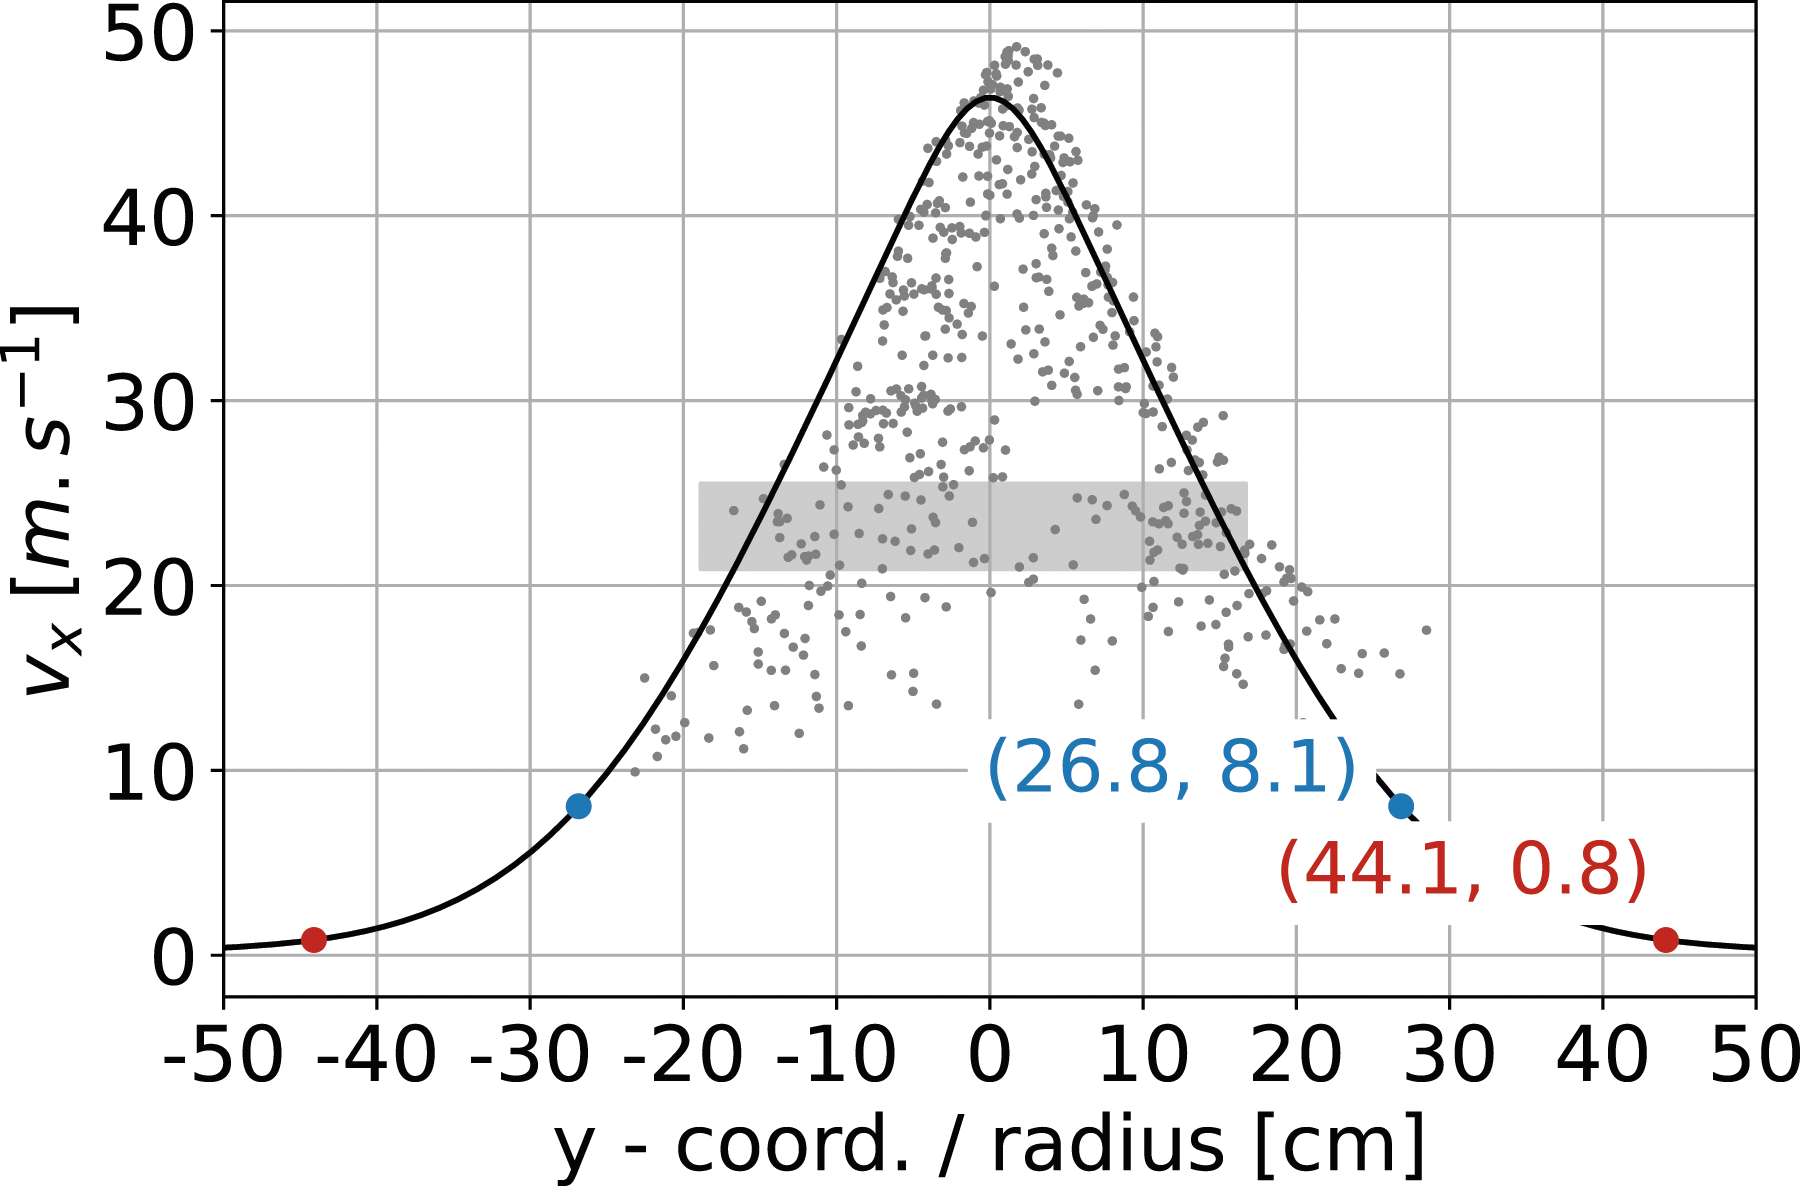
The y-coordinate in Figure 8 represents the original y-coordinate of the corresponding features in the concrete slab before the detonation. This coordinate is determined by tracing the tracked feature back to an x-coordinate of zero. It is assumed that the velocity in the x-direction is constant (no drag) and only gravity changes the trajectory of the respective feature in the y-direction.
To evaluate the spatial x-velocity distribution in the radial direction, the determined x-velocities are approximated by an enveloping curve. The basis for this curve is given by the pseudo-Voigt function V(r) which is a bell-shaped curve resulting from a linear combination of the Gaussian distribution G(r) and the Lorentzian distribution L(r). These curves are given as a function of the radial distance r from the center of the spalling crater, which is given by the y-coordinate for the tracked velocities.
with: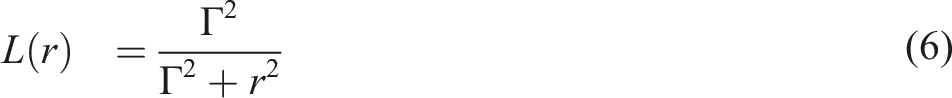

Here Λ is the peak height of the curve given by the maximum x-velocity and η is the ratio of both functions set to 0.25. The shape parameter σ controls the width of the Gaussian part and is determined based on the width w of the point cloud at half of the peak height (maximum velocity):
The width w is determined by the difference between the maximum and minimum y-coordinate of the determined x-velocities within a region ±5 % around Λ/2. This region is marked in Figure 8 by a gray box with a width equal to w. The width Γ of the Lorentzian part is calculated by Γ = σ/2 to give a more pointed shape to the resulting curve.
The red dot in Figure 8 marks the radius of the averaged spalling crater determined from the 3D scans together with the associated x-velocity. In the presented tests, the threshold x-velocity at the outer edge of the spalling crater is on average 1.0 m s−1. The blue dot marks the location of the maximum curvature κ of the deformation determined from the x-velocity distributions according to equation (9):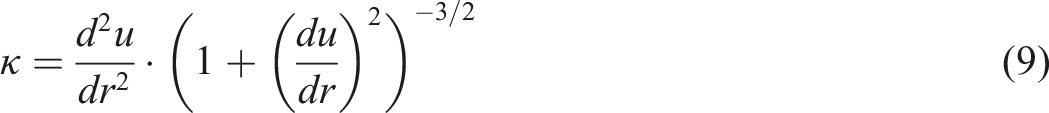
As described in Gensichen (2006), the calculation of a curvature is only meaningful if the two axes defining the curve have the same physical units. Therefore, the location of the maximum curvature is determined from the resulting deformation and not directly from the velocity distribution shown in Figure 8. Because the axes in Figure 8 are scaled for better visualization, this location appears shifted.
The fitted x-velocity distribution depends on the maximum x-velocity and the parameter σ for the width of the distribution at half of the maximum x-velocity in equation (8). To make predictions for similar situations, the maximum x-velocity as a function of the scaled thickness T
W
can be determined from the regression line in Figure 4. To derive a similar dependence for σ, this parameter is plotted against the scaled thickness of the concrete slab in Figure 9 for the tests without steel fibers. Parameter σ for spatial x-velocity distribution over scaled thickness of the concrete slabs.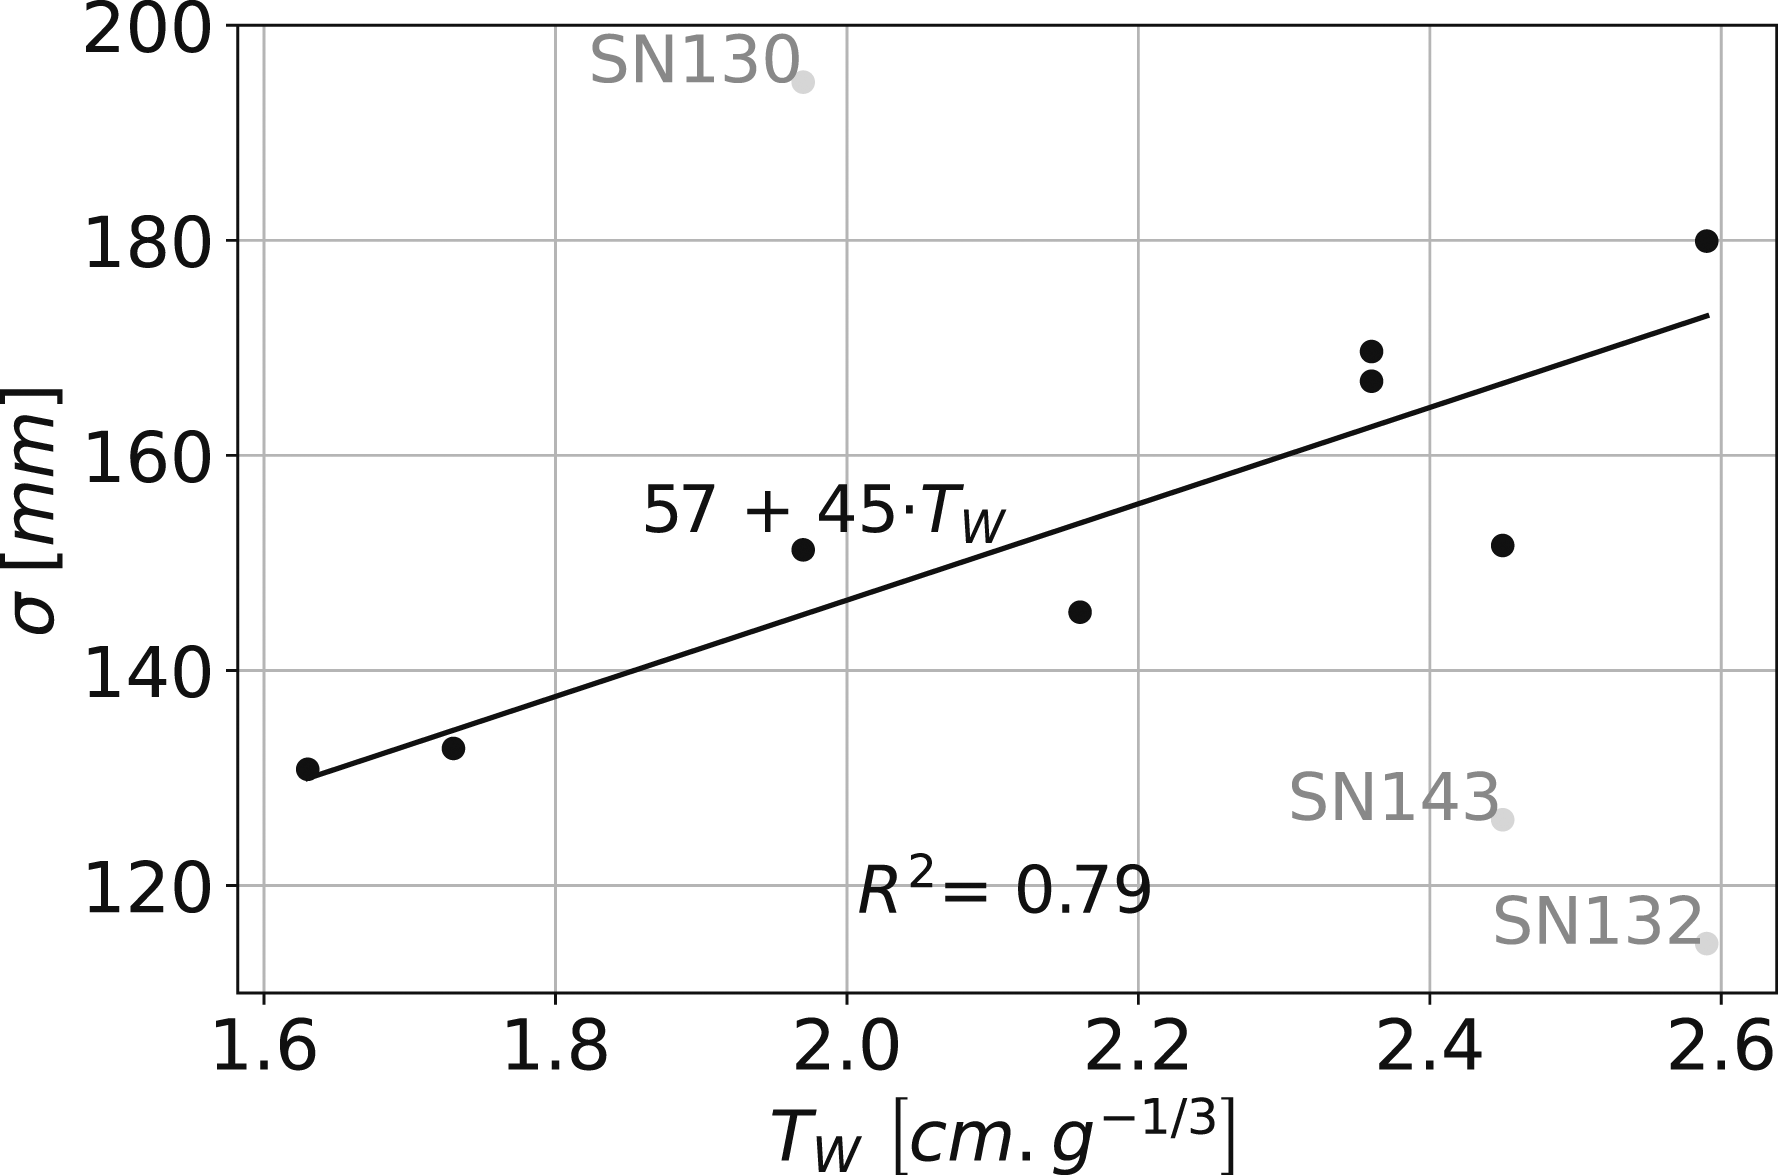
The tests marked in gray are excluded from the calculation of the regression line. In these tests, the tracking was too disturbed by larger rotating debris fragments, leading to incorrect x-velocities, especially in the outer regions of the debris cloud. The agreement between the measured values for σ and the approximated regression line is considered satisfactory for the following evaluations.
Fragmentation of the secondary debris
To validate the determined spatial x-velocity distribution, it is compared to the fragmentation process of the secondary debris. For this purpose, Figure 10 shows the HS recordings of the protective concrete surfaces from selected tests. The tests have been selected to give a good representation of the test series, and the associated HS recordings allow very complete tracking. The upper two images show tests with a breach in the concrete slab, and the lower two images show tests where only spalling occurred without a breach. Fragmentation of the secondary debris.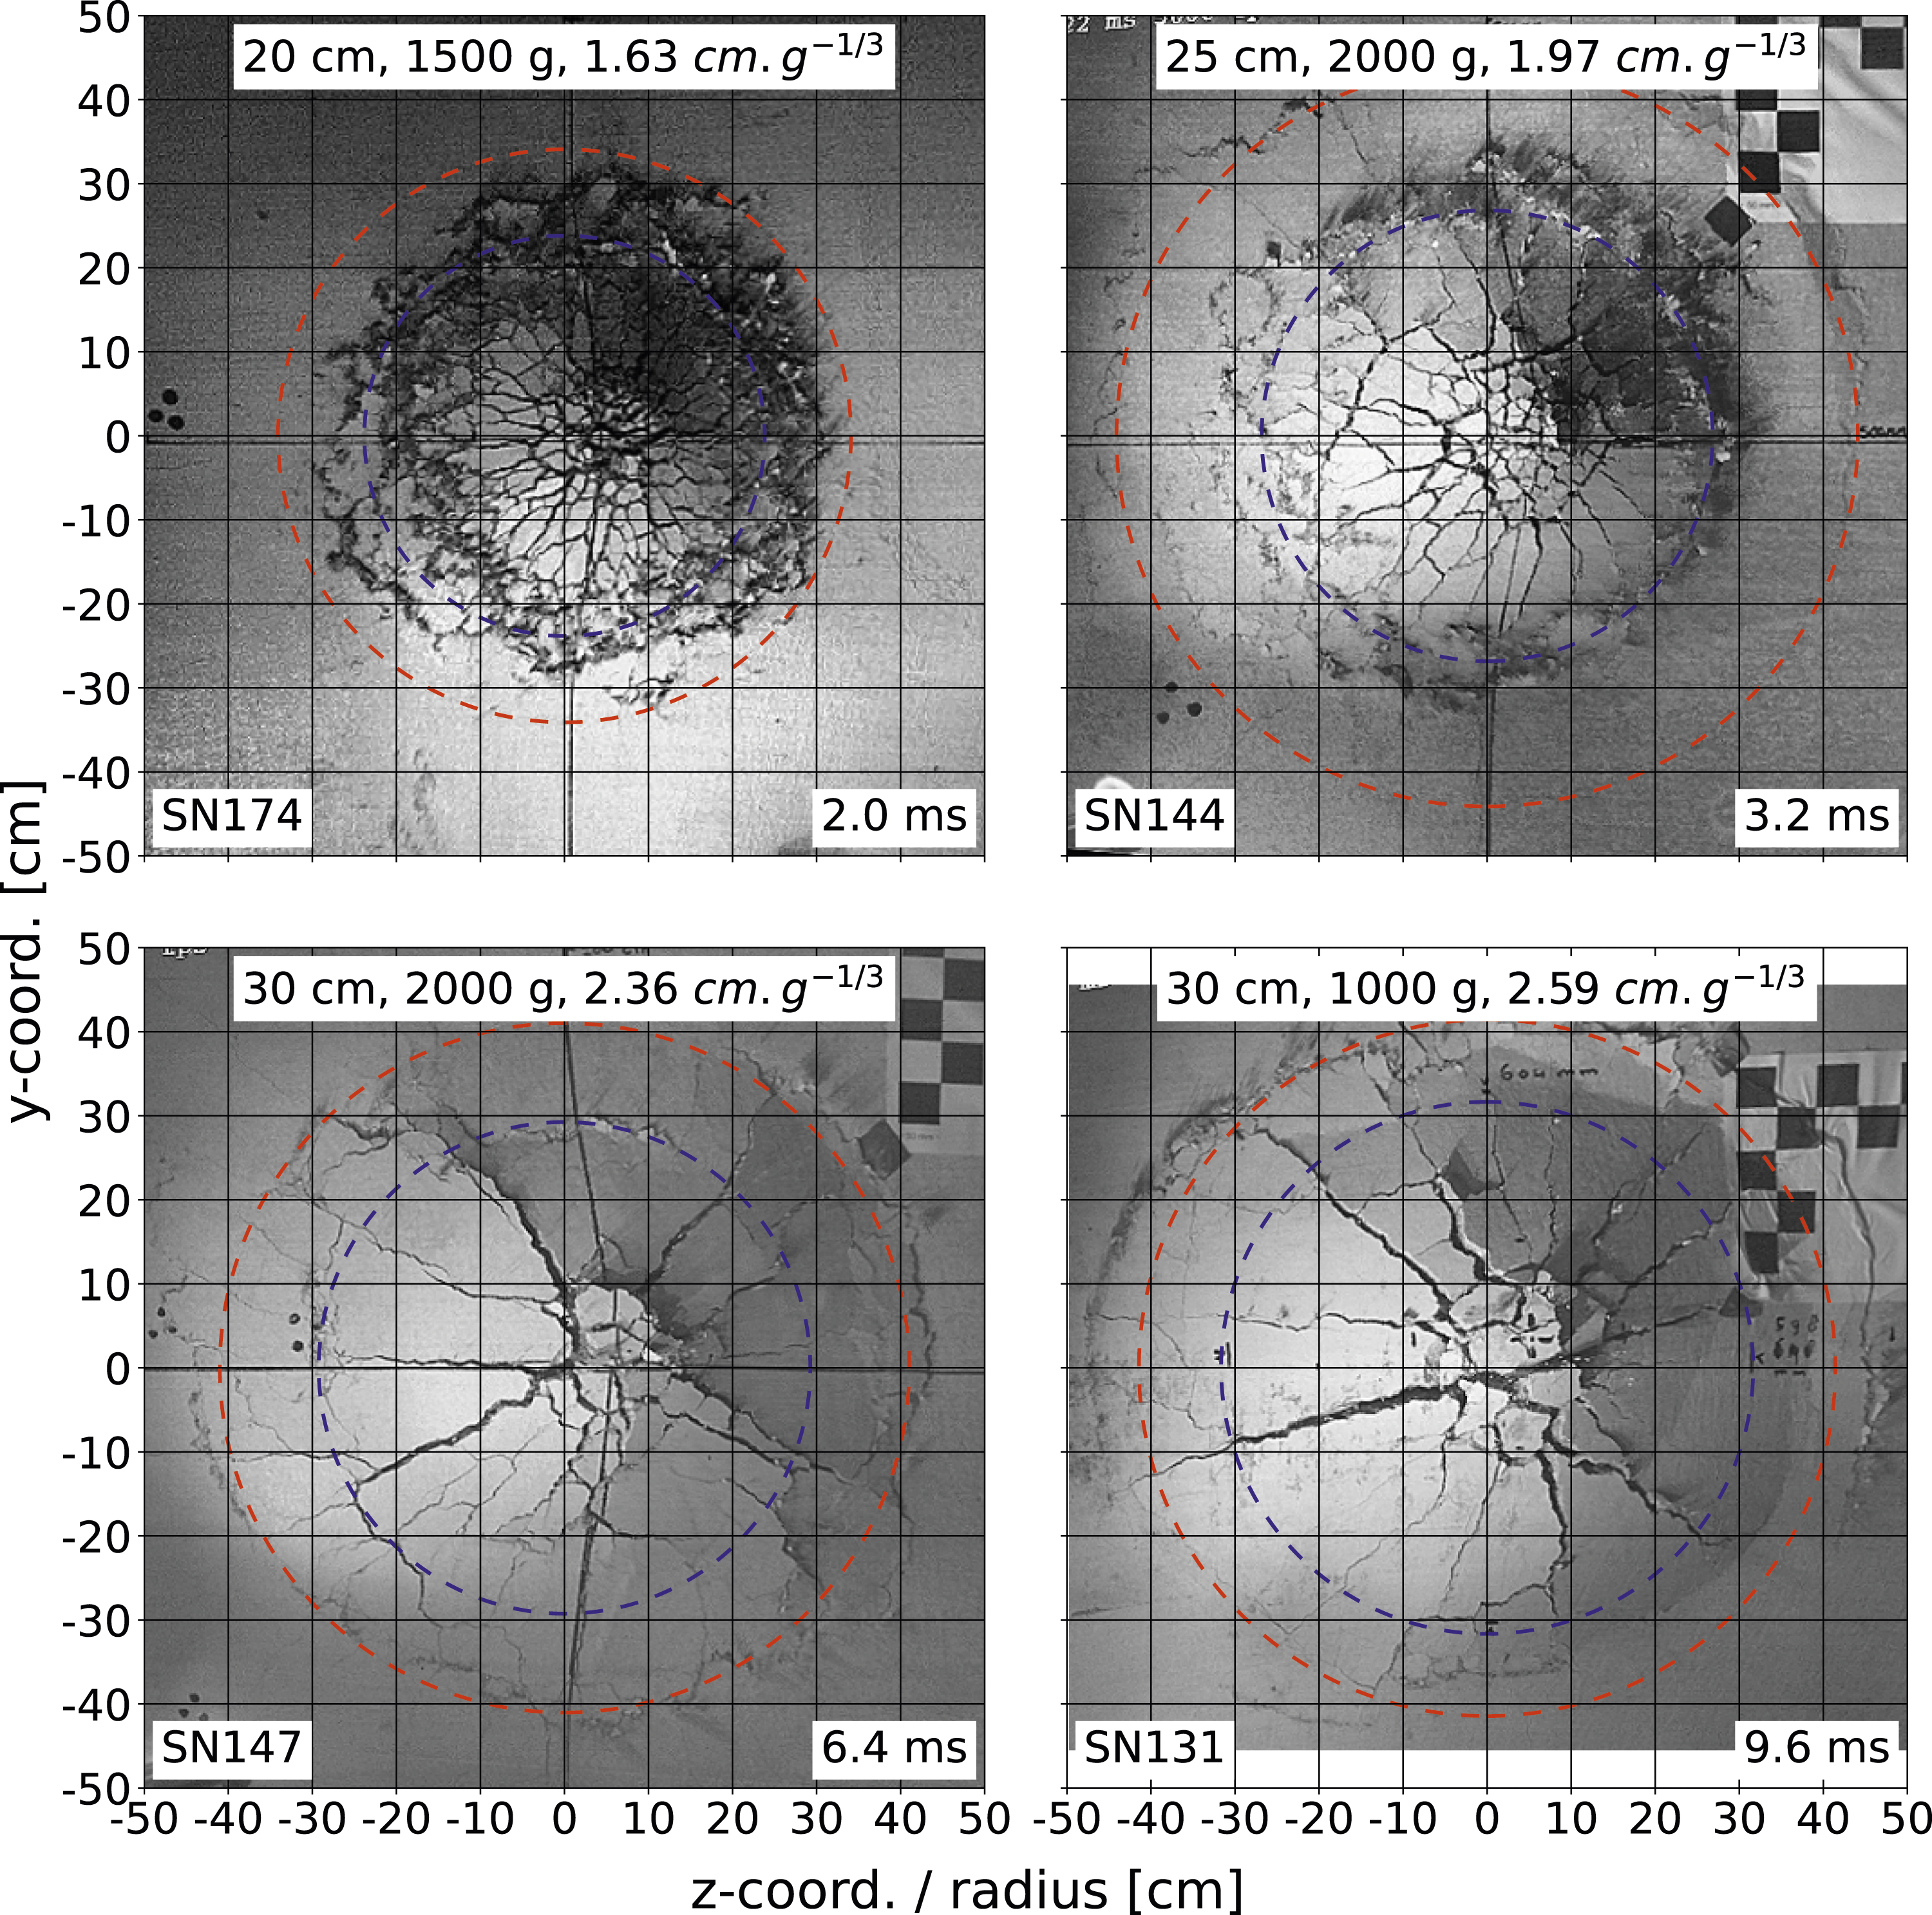
The time steps are chosen to show a complete fracture pattern with a central deformation in the x-direction of about 15 cm. The red circles correspond to area equivalent circles for the damaged region of the spalling craters. The blue circles are the locations of the maximum curvatures of the displacements determined from the velocity distribution and the time steps shown in Figure 10.
To avoid the HS cameras being hit by the secondary debris, the HS recordings of the protective surface were taken from a slightly offset location. Therefore, the tip of the debris cloud in Figure 10 appears to be shifted to the right and up, because it is no longer in the calibrated target plane. However, the perspective of these images is transformed so that the distances on the surface of the concrete slab are displayed correctly. More details about this transformation procedure can be found in Hupfauf (2024).
It can be seen from Figure 10 that there are two distinct regions in the formation of the secondary debris. These two regions are separated by an additional circumferential crack that correlates well with the location of the maximum curvature of the deformation derived from the x-velocity distribution (blue circle). In all cases, the center of the debris cloud with the fastest x-velocity consists of highly fragmented small concrete pieces. Outside of this central region, there is a steep velocity gradient in the radial direction up to the blue circle.
In cases with a breach (T w < 2.1 cm g−1/3), the region inside the blue circle consists of small fragments that become larger with increasing scaled thickness. In cases without a breach (T w > 2.1 cm g−1/3) the debris fragments are much larger with only a few radial cracks. These radial cracks are mainly caused by the different deformations resulting from the x-velocity gradient between the inner and outer regions of the spalled region. These different deformations cause circumferential tensile stresses in the spalled secondary debris and thus radial cracking. The resulting larger secondary debris fragments fly away while rotating around their center of mass.
The two different regions are most pronounced in case of the scaled thickness T w = 1.97 cm g−1/3 with a breach. While the additional circumferential crack (blue circle) is still visible in case of the scaled thickness of T w = 2.36 cm g−1/3, it is hardly noticeable in case of the largest scaled thickness T w = 2.59 cm g−1/3. This indicates a more uniform distribution of the x-velocity in the radial direction with increasing scaled thickness. This is also reflected by the continuous approach of the maximum curvature (blue circle) with the outer diameter of the spalling crater (red circle).
In the region outside the blue circle, the x-velocity is slower than inside the blue circle and the concrete is significantly less fragmented. The experimental tests indicate a correlation between the location of the additional circumferential crack (blue circle) and the position of the rebar layer relative to the surface of the concrete slab. To illustrate this correlation, Figure 11 shows the corresponding spalling craters after the test along with the location of the maximum curvature. Influence of rebar on fragmentation and x-velocity distribution.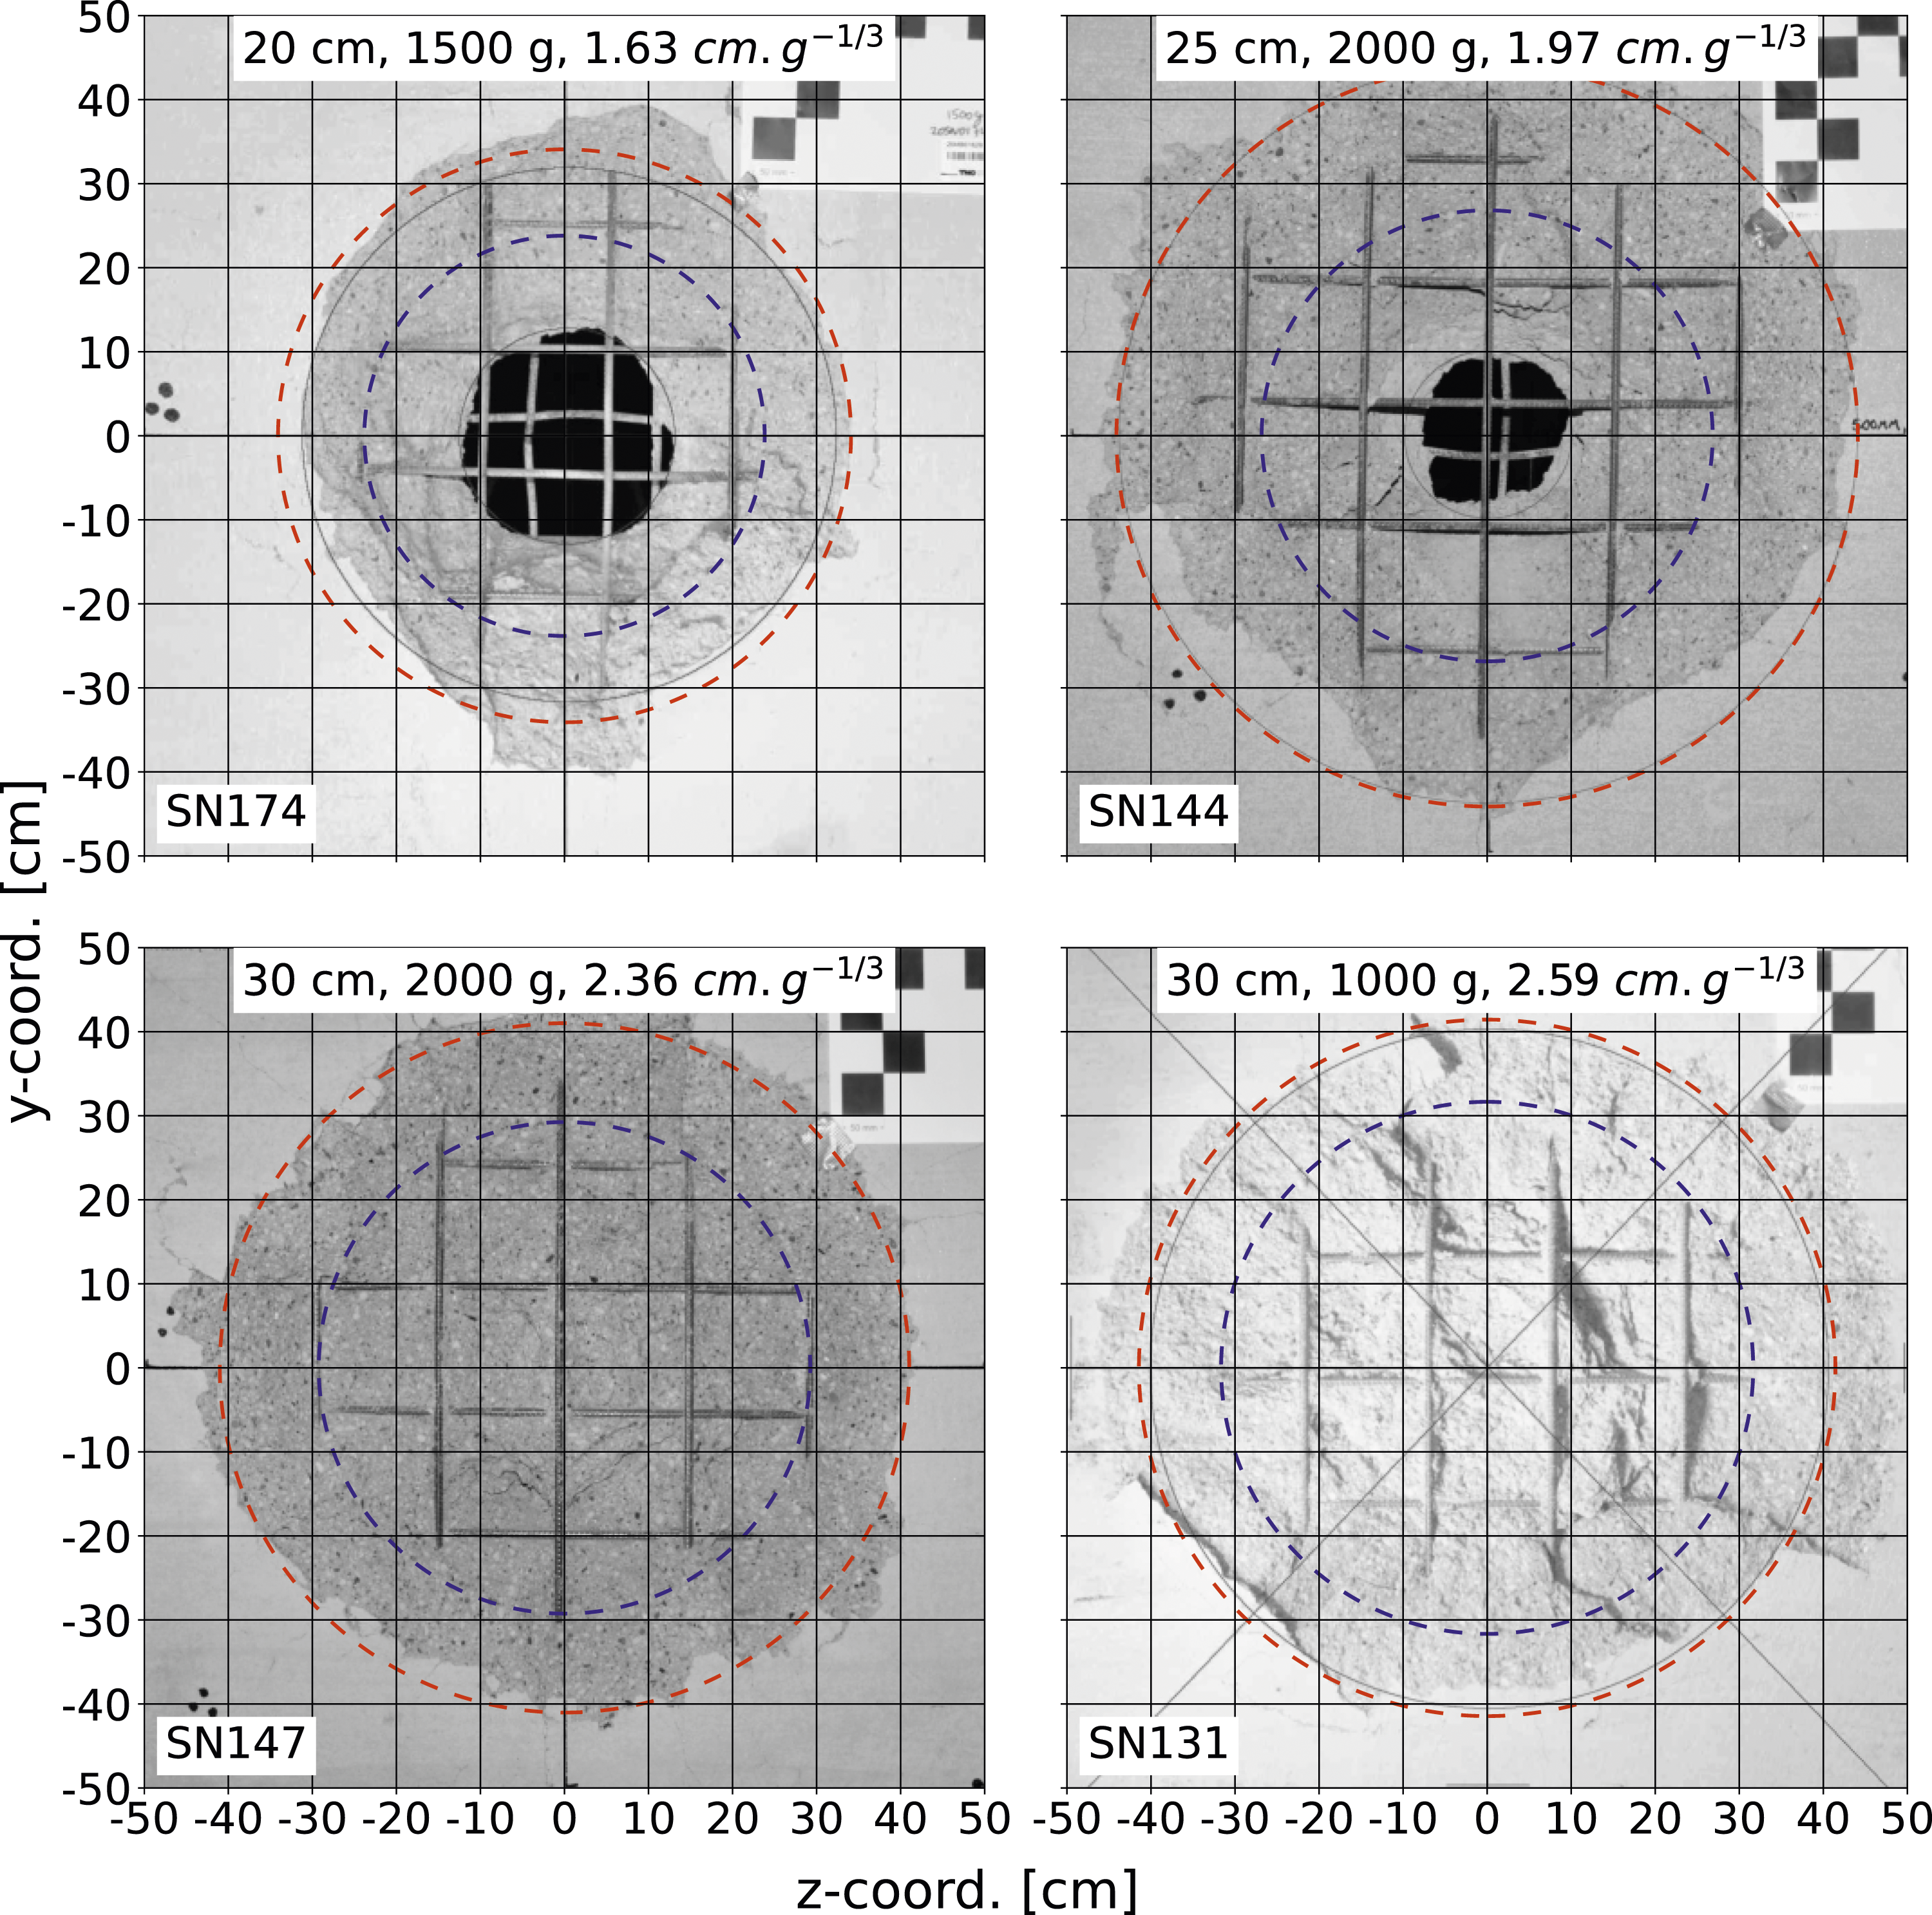
The location of the maximum curvature (blue circle) is almost identical to the location where the surface of the spalling crater intersects the rebar layer. Therefore, it is expected that a variation in the concrete cover will have an influence on the fracture process and the velocity distribution of the secondary debris. However, additional testing is required to quantify this influence.
It is concluded that the distribution according to equation (5) can approximate the radial x-velocity distribution of the experimental tests very well. A comparison with the DIC measurements can be found in the last section of this paper.
Kinetic energy of the secondary debris
The total kinetic energy of the entire secondary debris cloud can be derived from the approximation of the spatial x-velocity distribution according to equation (5) and the shapes of the spalling craters in Figure 6. For this purpose, it is assumed that the x-velocity is constant in the depth direction of the concrete slab.
While the assumption of a constant x-velocity in the depth direction of the concrete slab is considered well suited for situations without a breach, a decrease in velocity below the rebar layer is expected for situations with a breach. Since the velocity distribution in the depth direction cannot be determined experimentally, it must be determined using numerical simulations.
The total kinetic energy of the secondary debris is calculated by numerical integration of the rotationally symmetric approximations of the spalling crater depth t(r) and the associated velocity distribution v(r) over the area of the spalling crater with an outer radius of R.
The density of the concrete ρ = 2.22 g cm−3 was measured on test cubes made from the same concrete mixture as the tested concrete slabs. The resulting total kinetic energy as a function of the scaled thickness is shown in Figure 12 separately for all tests without steel fibers, including a linear regression line. Total kinetic energy of secondary debris over scaled thickness.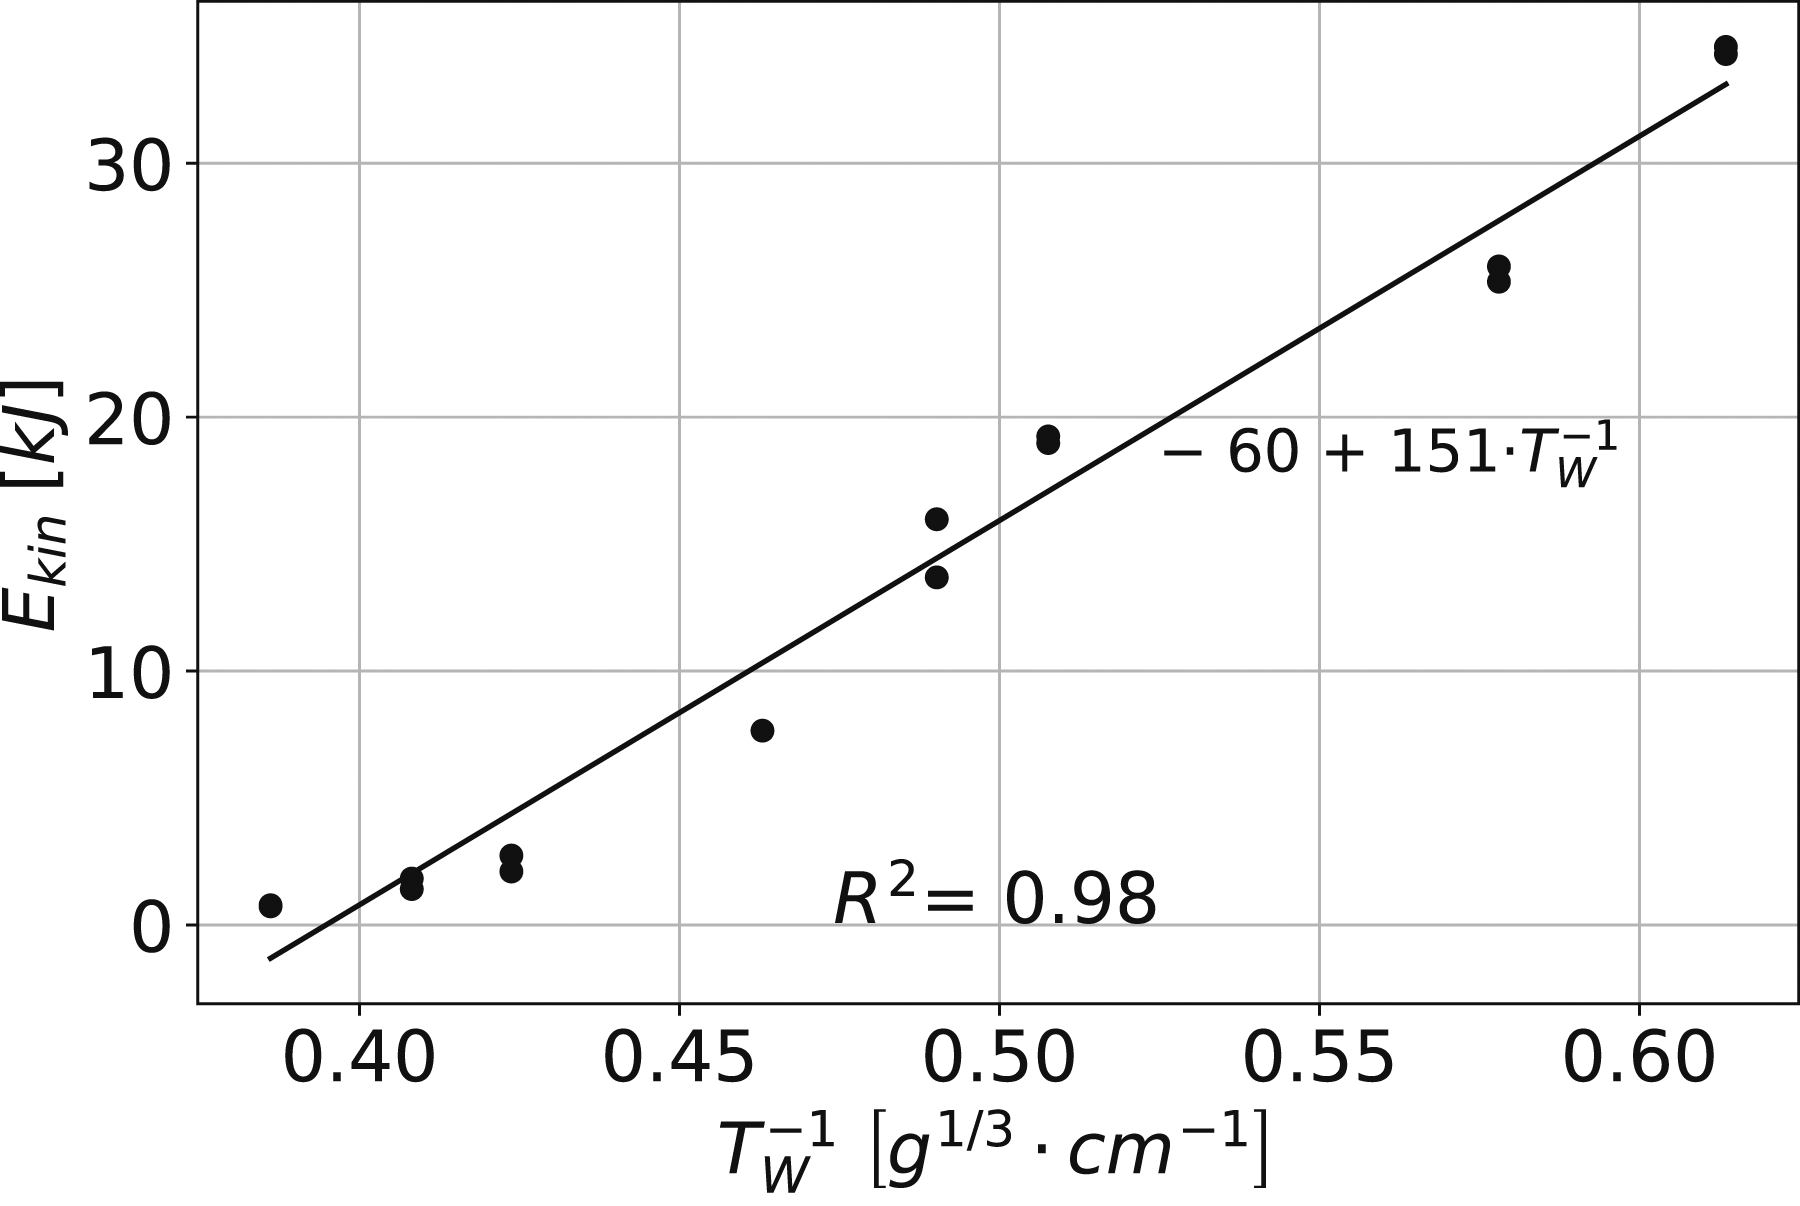
Based on the observed influence of the rebar layer on the secondary debris, a small concrete cover reduces the depth of the spalling crater but widens the region with high velocities. The fastest velocities are in the center of the spalling crater, and velocity has a much greater influence (quadratic) on the kinetic energy of the secondary debris than the mass (linear). Therefore, reducing the depth of the spalling crater at its center by reducing the concrete cover is expected to be beneficial in reducing the kinetic energy of the secondary debris. Further experiments are required to quantify this relation.
An evaluation of the impact of individual fragments as well as the entire debris cloud on humans and technical installations based on the derived kinetic energy can be found in Hupfauf (2024).
In the following section, the kinetic energy is used to quantitatively assess the influence of the steel fibers on the secondary debris.
Influence of steel fibers
To evaluate the influence of the steel fibers on the velocity of the secondary debris, Figure 13 shows the HS recordings at 38 ms for different steel fiber contents. The tests shown are 30 cm thick concrete slabs loaded with 2000 g of SEMTEX10 with steel fiber contents between 0.0 Vol % and 2.0 Vol %. HS-Tracking - Influence of steel fibers on the velocity of the secondary debris.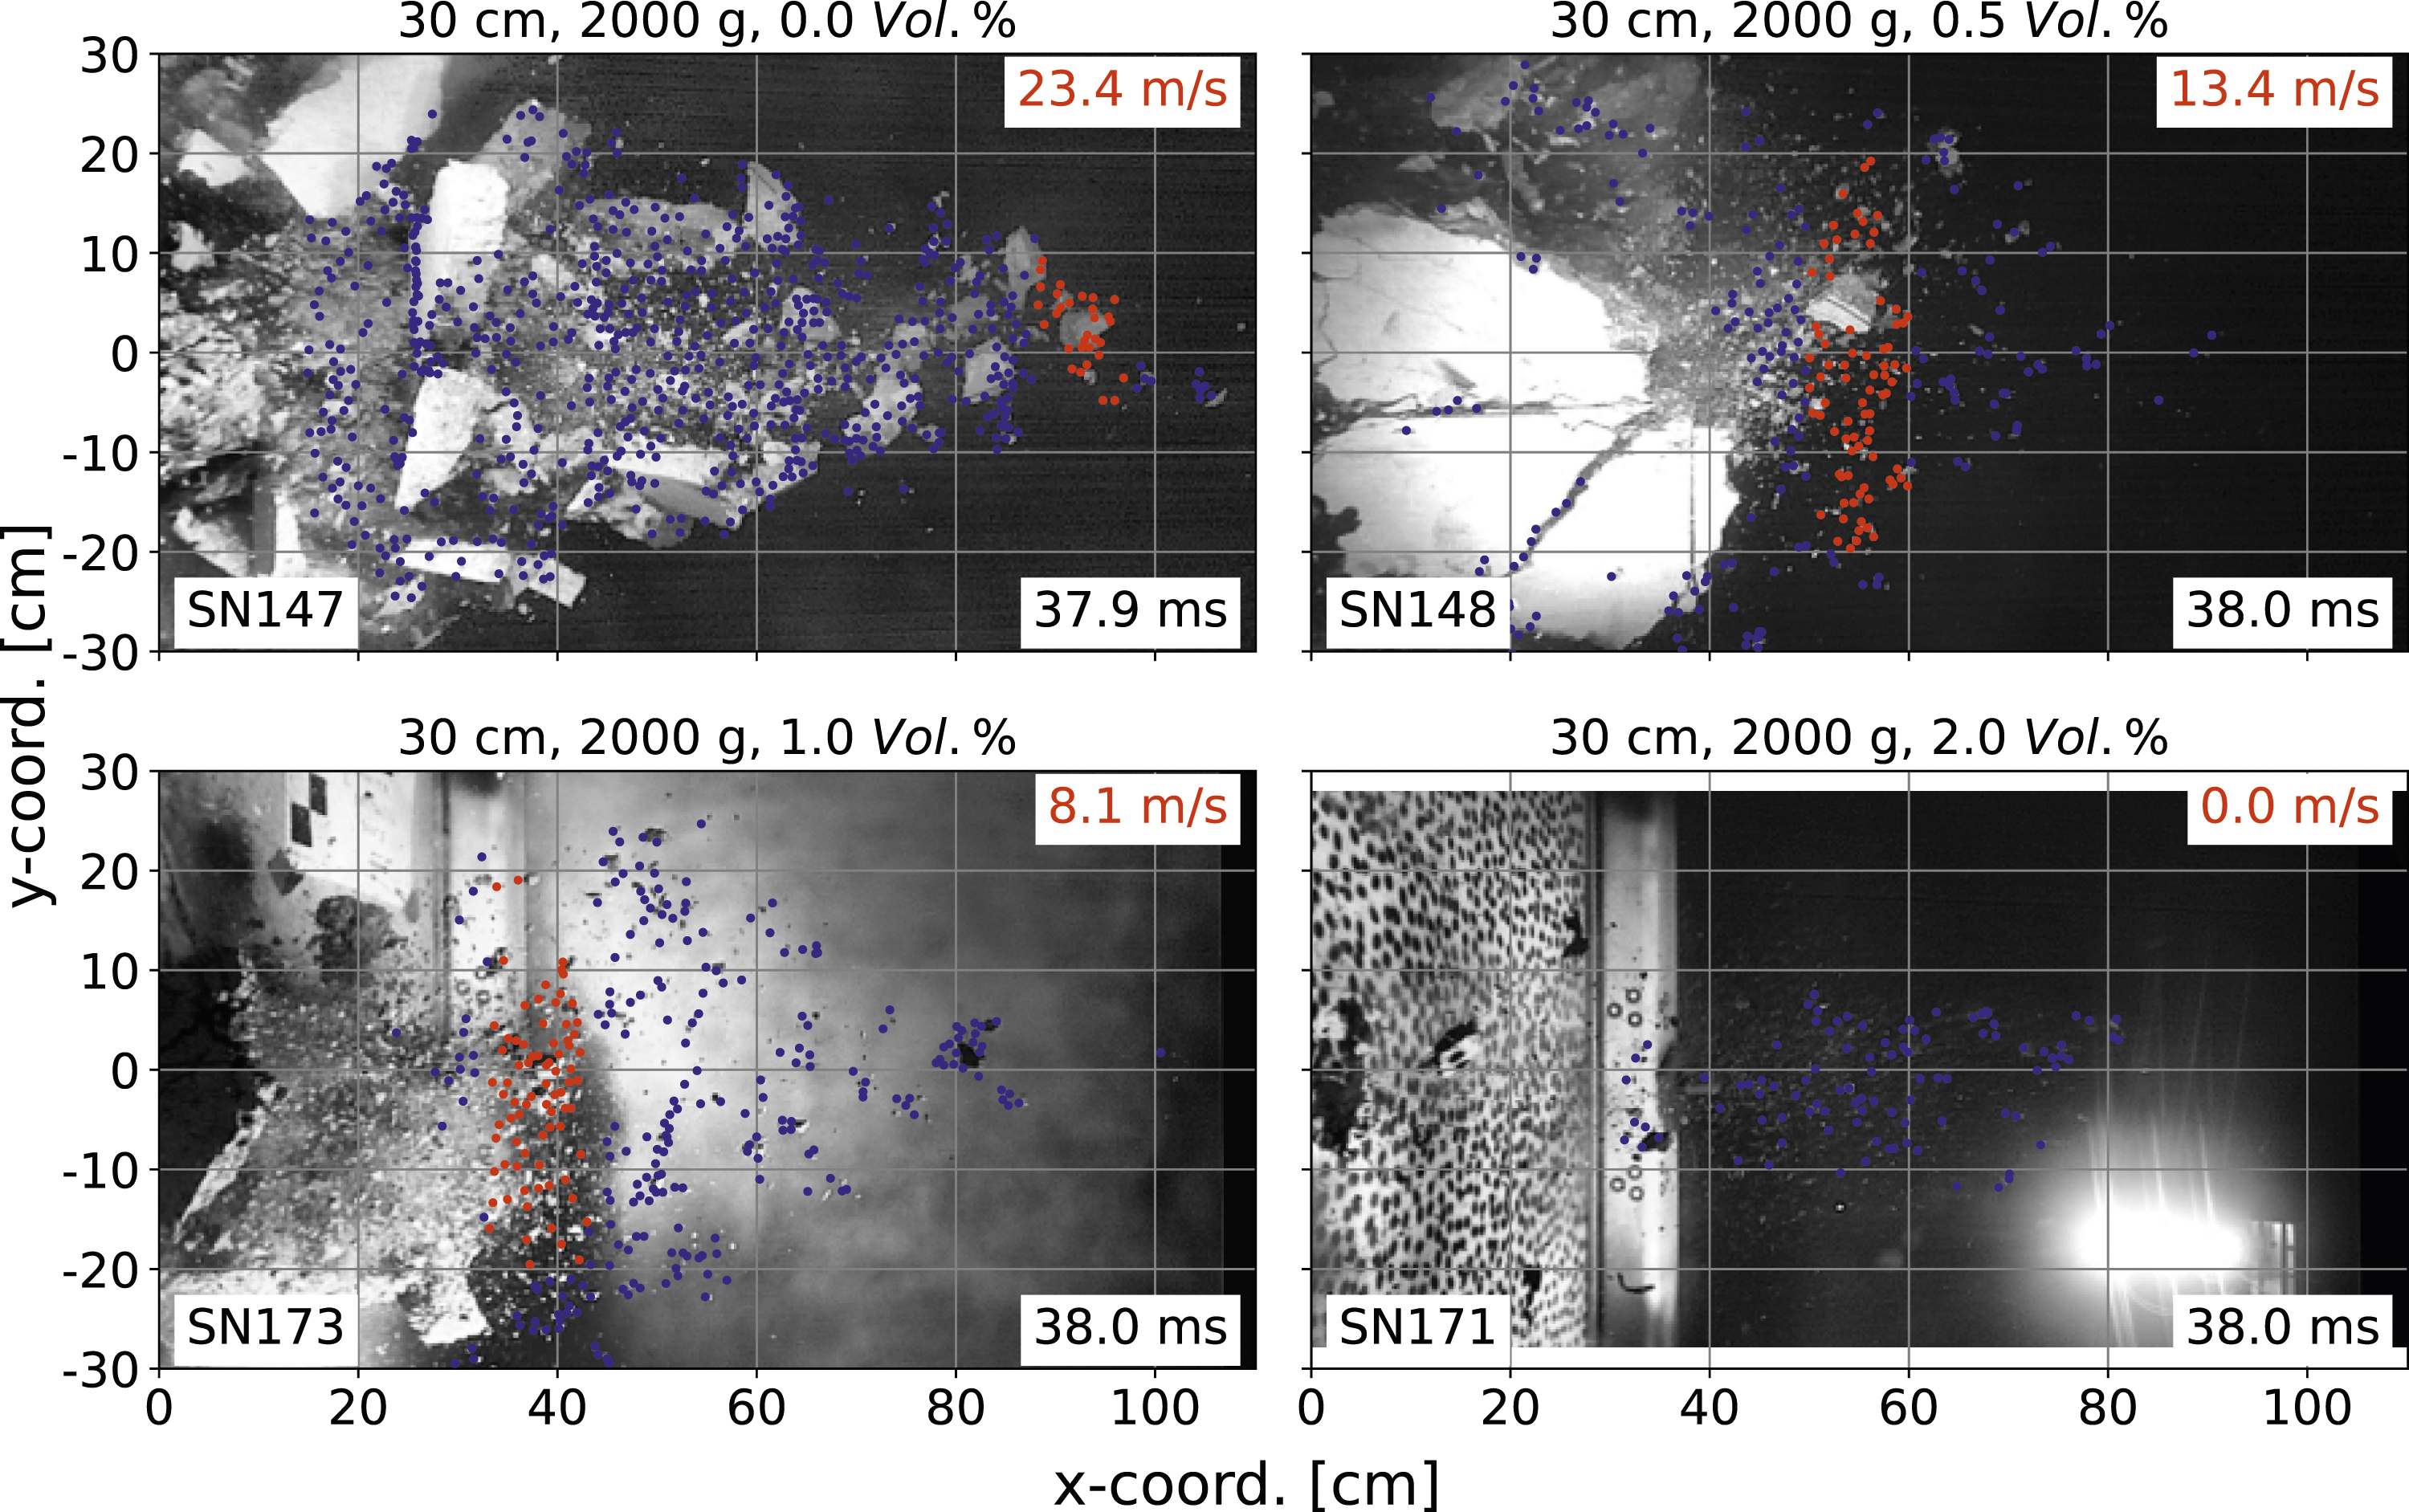
The blue dots mark the locations of the tracked features and the red dots mark the features whose mean x-velocity is given in the upper right corner of each image.
In the tests with steel fiber reinforcement, there are always small debris fragments that are not or only minimally affected by the steel fibers. These debris fragments are either too small to be anchored by the steel fibers, consist of the included aggregates, or originate from regions of an uneven steel fiber distribution. These unaffected or minimally affected debris fragments are propelled away from the concrete slab at a velocity similar to the case without steel fibers.
To evaluate the influence of the steel fibers on the velocity of the secondary debris, the tracked features for the maximum x-velocity (red dots) are selected to correspond to the fastest debris fragments that are expected to represent the behavior of the steel fiber reinforcement.
In the case of 2.0 Vol % of steel fibers (SN171), the tracking algorithm is too disturbed by the DIC pattern on the surface of the concrete slab. Therefore, the x-velocity of the debris fragment at about 15 cm is approximated by its x-location and the current time step. The resulting x-velocity is 4.0 m s−1.
As the steel fiber content increases, the amount and the x-velocity of the secondary debris is continuously reduced. In addition, the size distribution of the secondary debris changes. In the case of 0.5 Vol % steel fibers (Figure 13, top right), it is clear that large debris fragments are held together by the steel fibers as they fly away from the concrete slab. For the higher steel fiber contents of 1.0 Vol % and 2.0 Vol %, this effect is not as obvious because most of the large concrete fragments are retained by the steel fibers and do not fly off the concrete slab. In the situation without steel fibers, the large fragments are broken into several smaller pieces.
Due to large rotating debris fragments and small debris fragments that are not or only minimally affected by the steel fibers, it is not possible to derive a velocity distribution for the tests with steel fibers in the same way as without steel fibers. Therefore, the influence of the steel fibers on the secondary debris is evaluated quantitatively based on the total kinetic energy of the secondary debris and the fracture energy of the concrete.
In a parallel series of tests by Mosig et al. (2021), spallation tests were performed on the Split Hopkinson Bar using the same concrete mixture. The determined specific fracture energies GF,A of the concrete with different steel fiber contents are shown in Figure 14. Specific fracture energy for different steel fiber contents Mosig et al. (2021).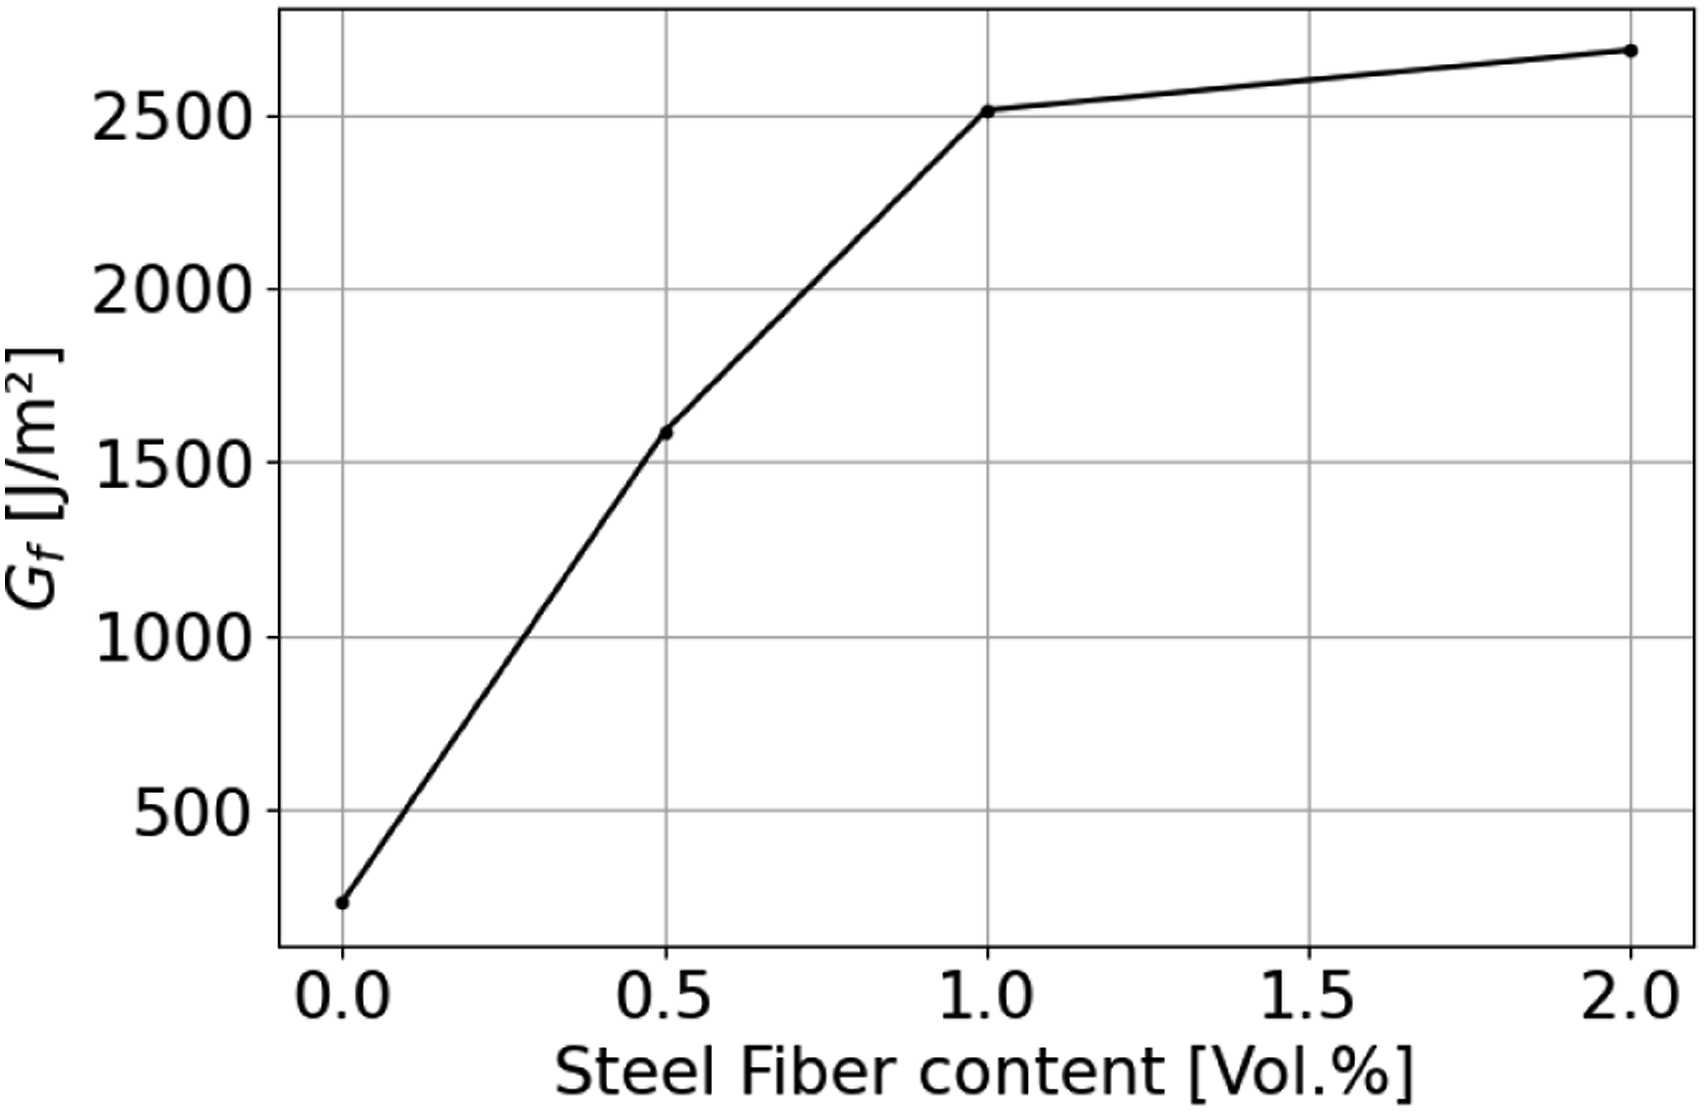
The kinetic energy of the concrete with steel fibers is estimated by reducing the kinetic energy of the concrete without steel fibers E
kin,0
by the difference of the specific fracture energies of the concrete with GF,A,0 and without GF,A,pc steel fibers (Figure 14), multiplied by the surface of the respective spalling crater S0.
Here, E kin,0 and GF,A,0 are the kinetic energy and the fracture energy for the case without steel fibers and the index pc indicates the same values for the different steel fiber contents. The surface S0 is calculated by rotational integration of the averaged shape of the respective spalling crater from the 3D-scans in Figure 6.
Based on this, the x-velocity distribution for the case with steel fibers is estimated by varying the maximum x-velocity in equation (5) such that the kinetic energy from the resulting velocity distribution matches the expected kinetic energy E kin,pc for the steel fiber content pc.
By varying the additional factor f, the resulting x-velocity distribution is fitted to the experimentally measured maximum x-velocity of the secondary debris fragments and the measured diameter of the spalling crater. The criterion for the diameter of the spalling crater from the approximation is a threshold x-velocity of 1.0 m s−1 as derived from the experimental tests without steel fibers shown in Figure 8.
For the present case, the factor f is set to f = 1.45. A reason for this factor could be that the fractured surface is 45 % larger than the surface of the spalling crater and/or that there are additional load-bearing mechanisms.
It can be seen from the collected secondary debris that, except for the highly fractured central area of the spalling crater, the larger secondary debris fragments in cases without a breach cracked mainly at the rebar layer, with only sporadic spalling layers in between. Based on the HS recordings in Figure 10, the increased resistance could be attributed to the additional radial cracks and an associated membrane action of the spalled fragments. The extent to which this effect would be influenced by different rebar layouts cannot be determined because this parameter was not varied in the present series of tests.
Another reason for the factor f = 1.45 could be an influence of the strain rate on the fracture energy. Unfortunately, there is no conclusive explanation in the literature as to how the fracture energy is affected by the strain rate, especially at the extremely high strain rates caused by a contact detonation. Since the difference in fracture energy is used to calculate the velocity distribution with steel fibers, the effect of the strain rate would have to be greater in cases with steel fibers than without steel fibers. However, since the same factor can be used to describe all tested steel fiber contents loaded with different explosive masses, the effect must be constant between the different steel fiber contents.
The resulting x-velocity distribution (left) and relative total energy (right), both as a function of the steel fiber content, are shown in Figure 15 for an explosive mass of 2000 g. Velocity distribution (left) and relative total kinetic energy (rigth) of secondary debris with varying steel fiber content.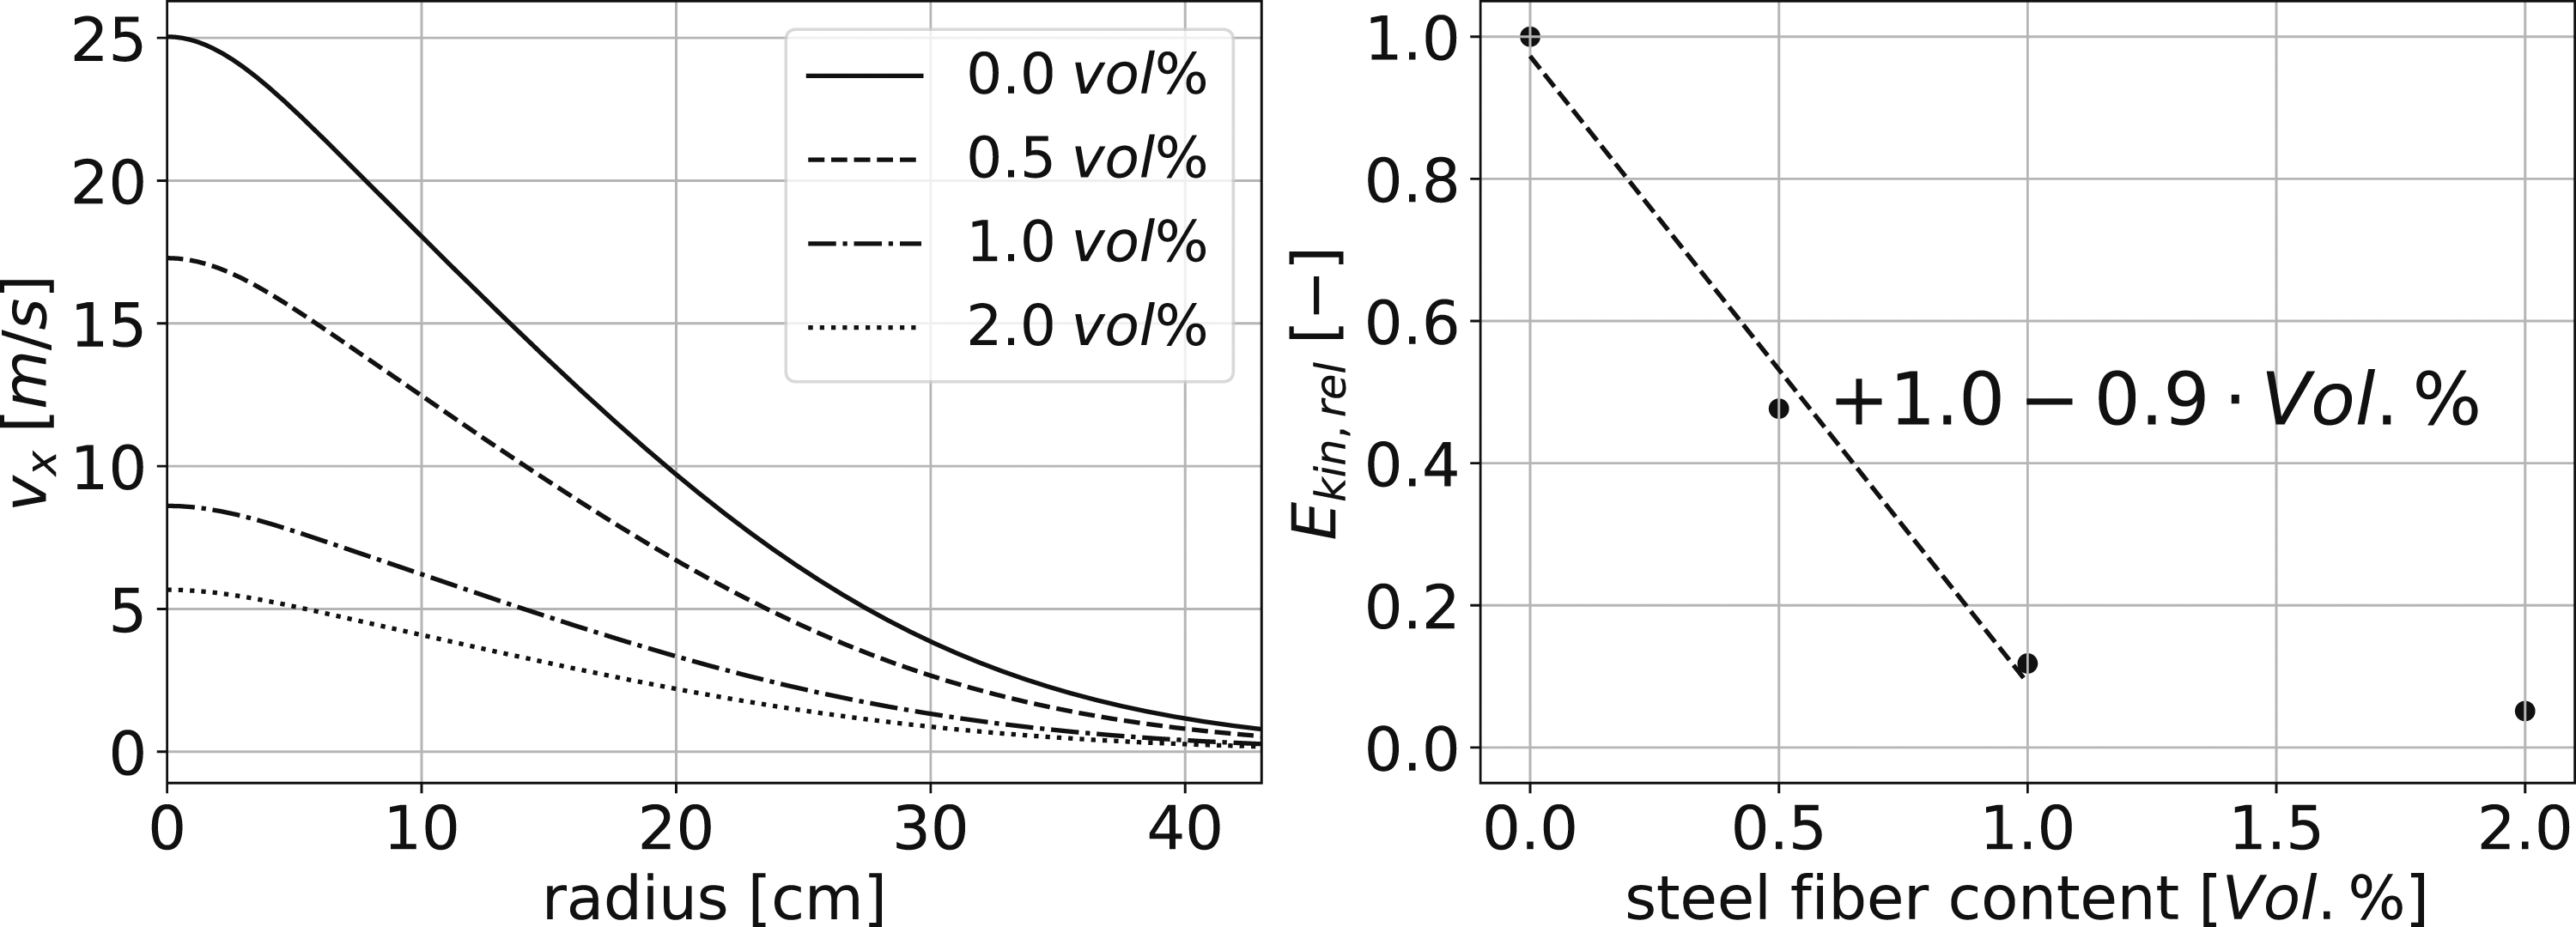
In the presented case of a 30 cm thick concrete slab loaded with 2000 g of SEMTEX10, the total kinetic energy of the secondary debris decreases approximately linearly with increasing steel fiber content between 0.0 Vol % and 1.0 Vol % until it almost vanishes for 2.0 Vol % of steel fibers.
With a steel fiber content of 1.0 Vol %, the total kinetic energy is already significantly reduced by almost 90 %. To properly evaluate the influence of 2.0 Vol% steel fibers, a higher explosive mass would be required. However, at a steel fiber content of 2.0 Vol % it becomes increasingly difficult to achieve a homogeneous distribution of the steel fibers in the concrete Mosig et al. (2021).
To compare the approximated x-velocity distribution (solid line) with the experimental measurements (dashed line), Figure 16 shows the maximum x-velocity of the spalled debris for both tested explosive masses. The dashed lines represent the respective mean values and the vertical lines the individual measurements from the corresponding tests. Comparison of measured and approximated maximum x-velocity.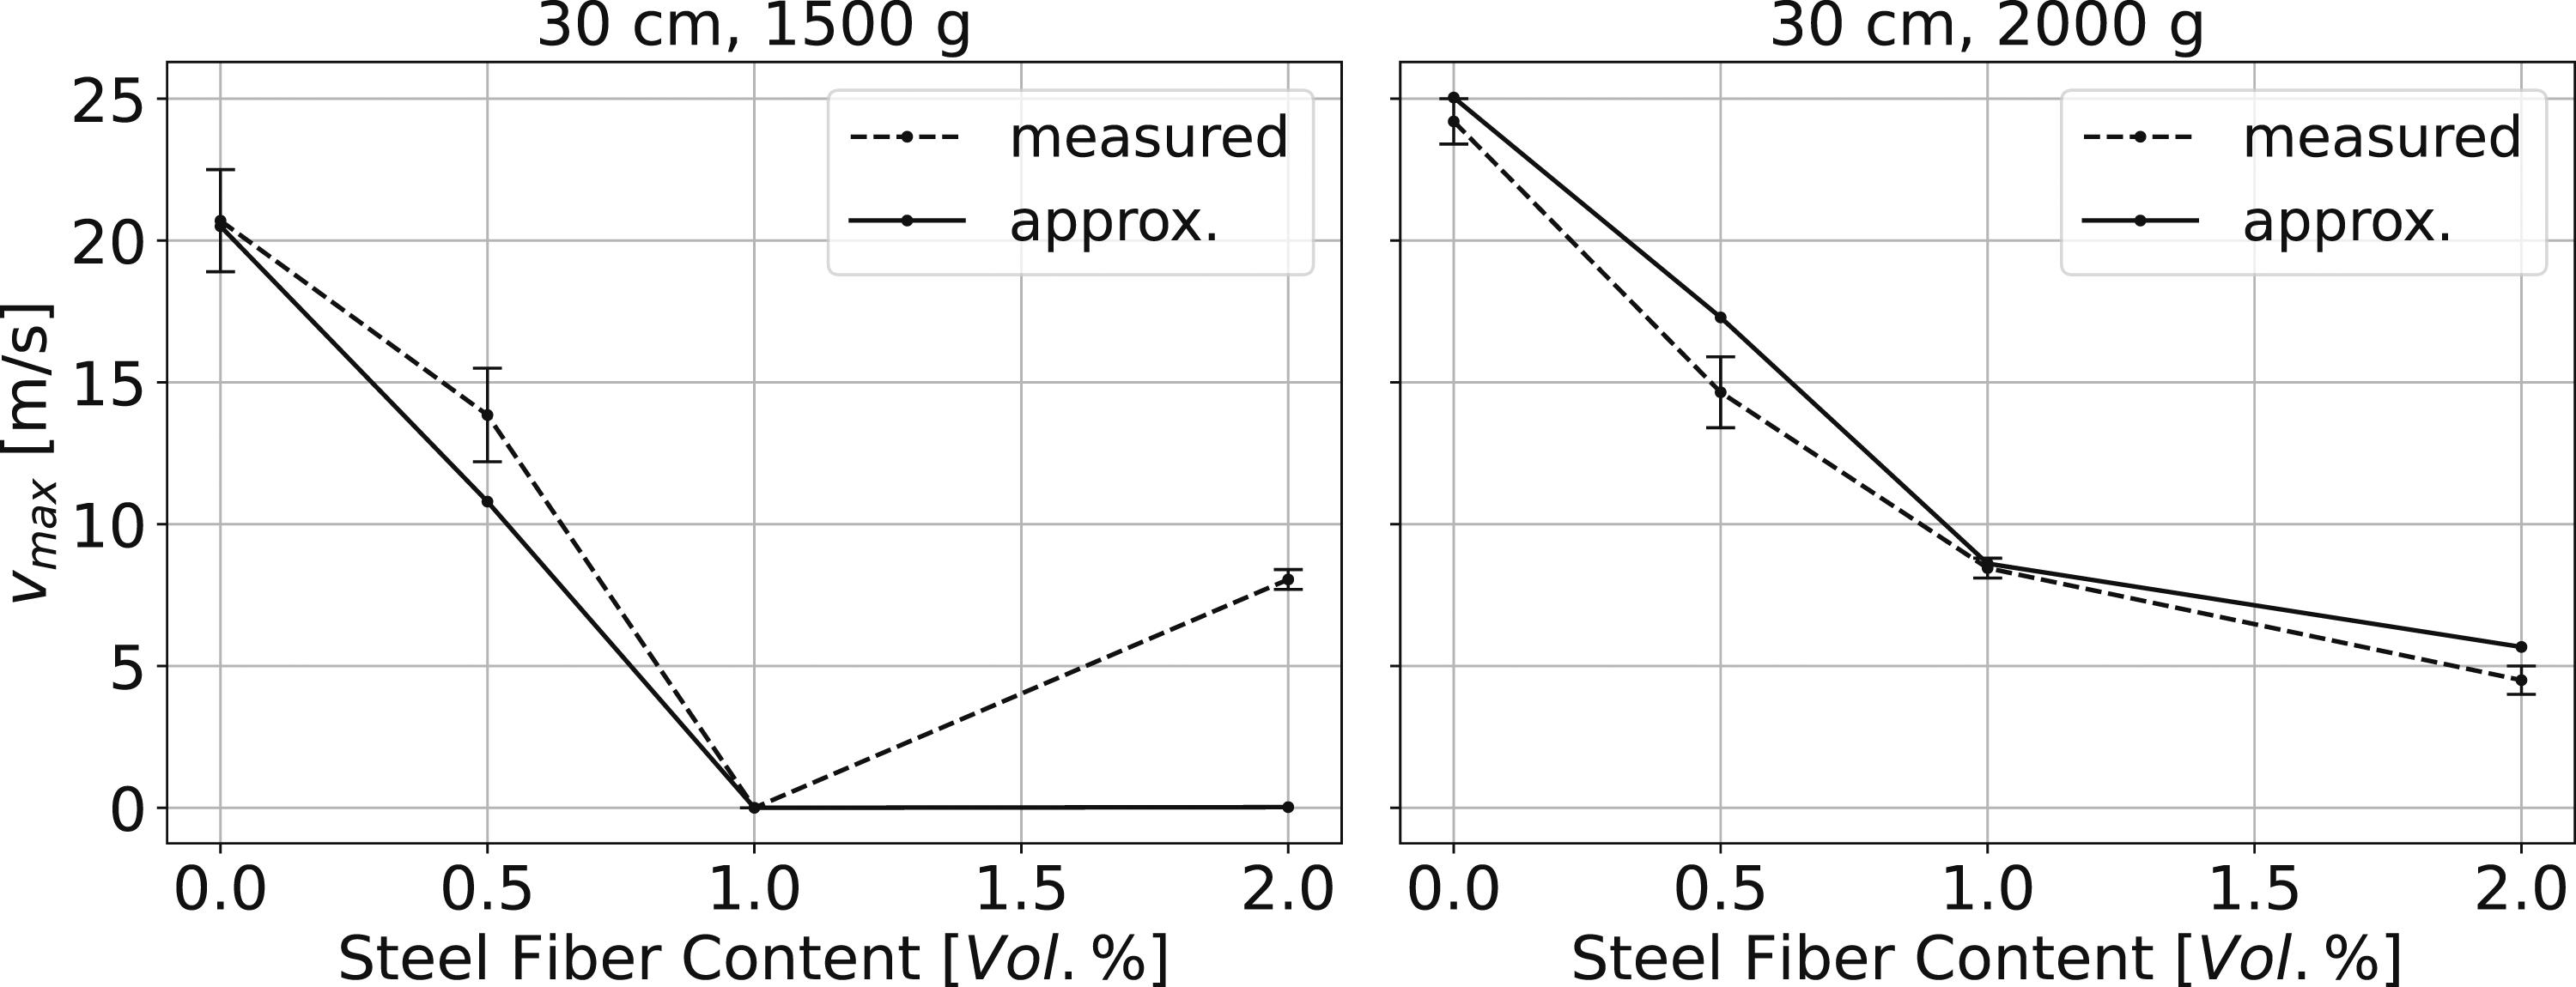
The agreement between the approximation and the experimental measurements is considered satisfactory for the tests presented. Due to the comparatively low kinetic energy in the cases of 1.0 Vol % and 2.0 Vol% steel fibers, the results in this range are extremely sensitive to even small changes in the input parameters.
To compare the approximated diameters (blue lines) of the spalling craters with the experimental measurements (red lines), they are plotted in Figure 17 together with photos of the spalling craters. The criterion for the diameters of the spalling craters is a threshold x-velocity of 1.0 m s−1 as derived from the experimental tests without steel fibers. Resulting spalling crater for different steel fiber contents.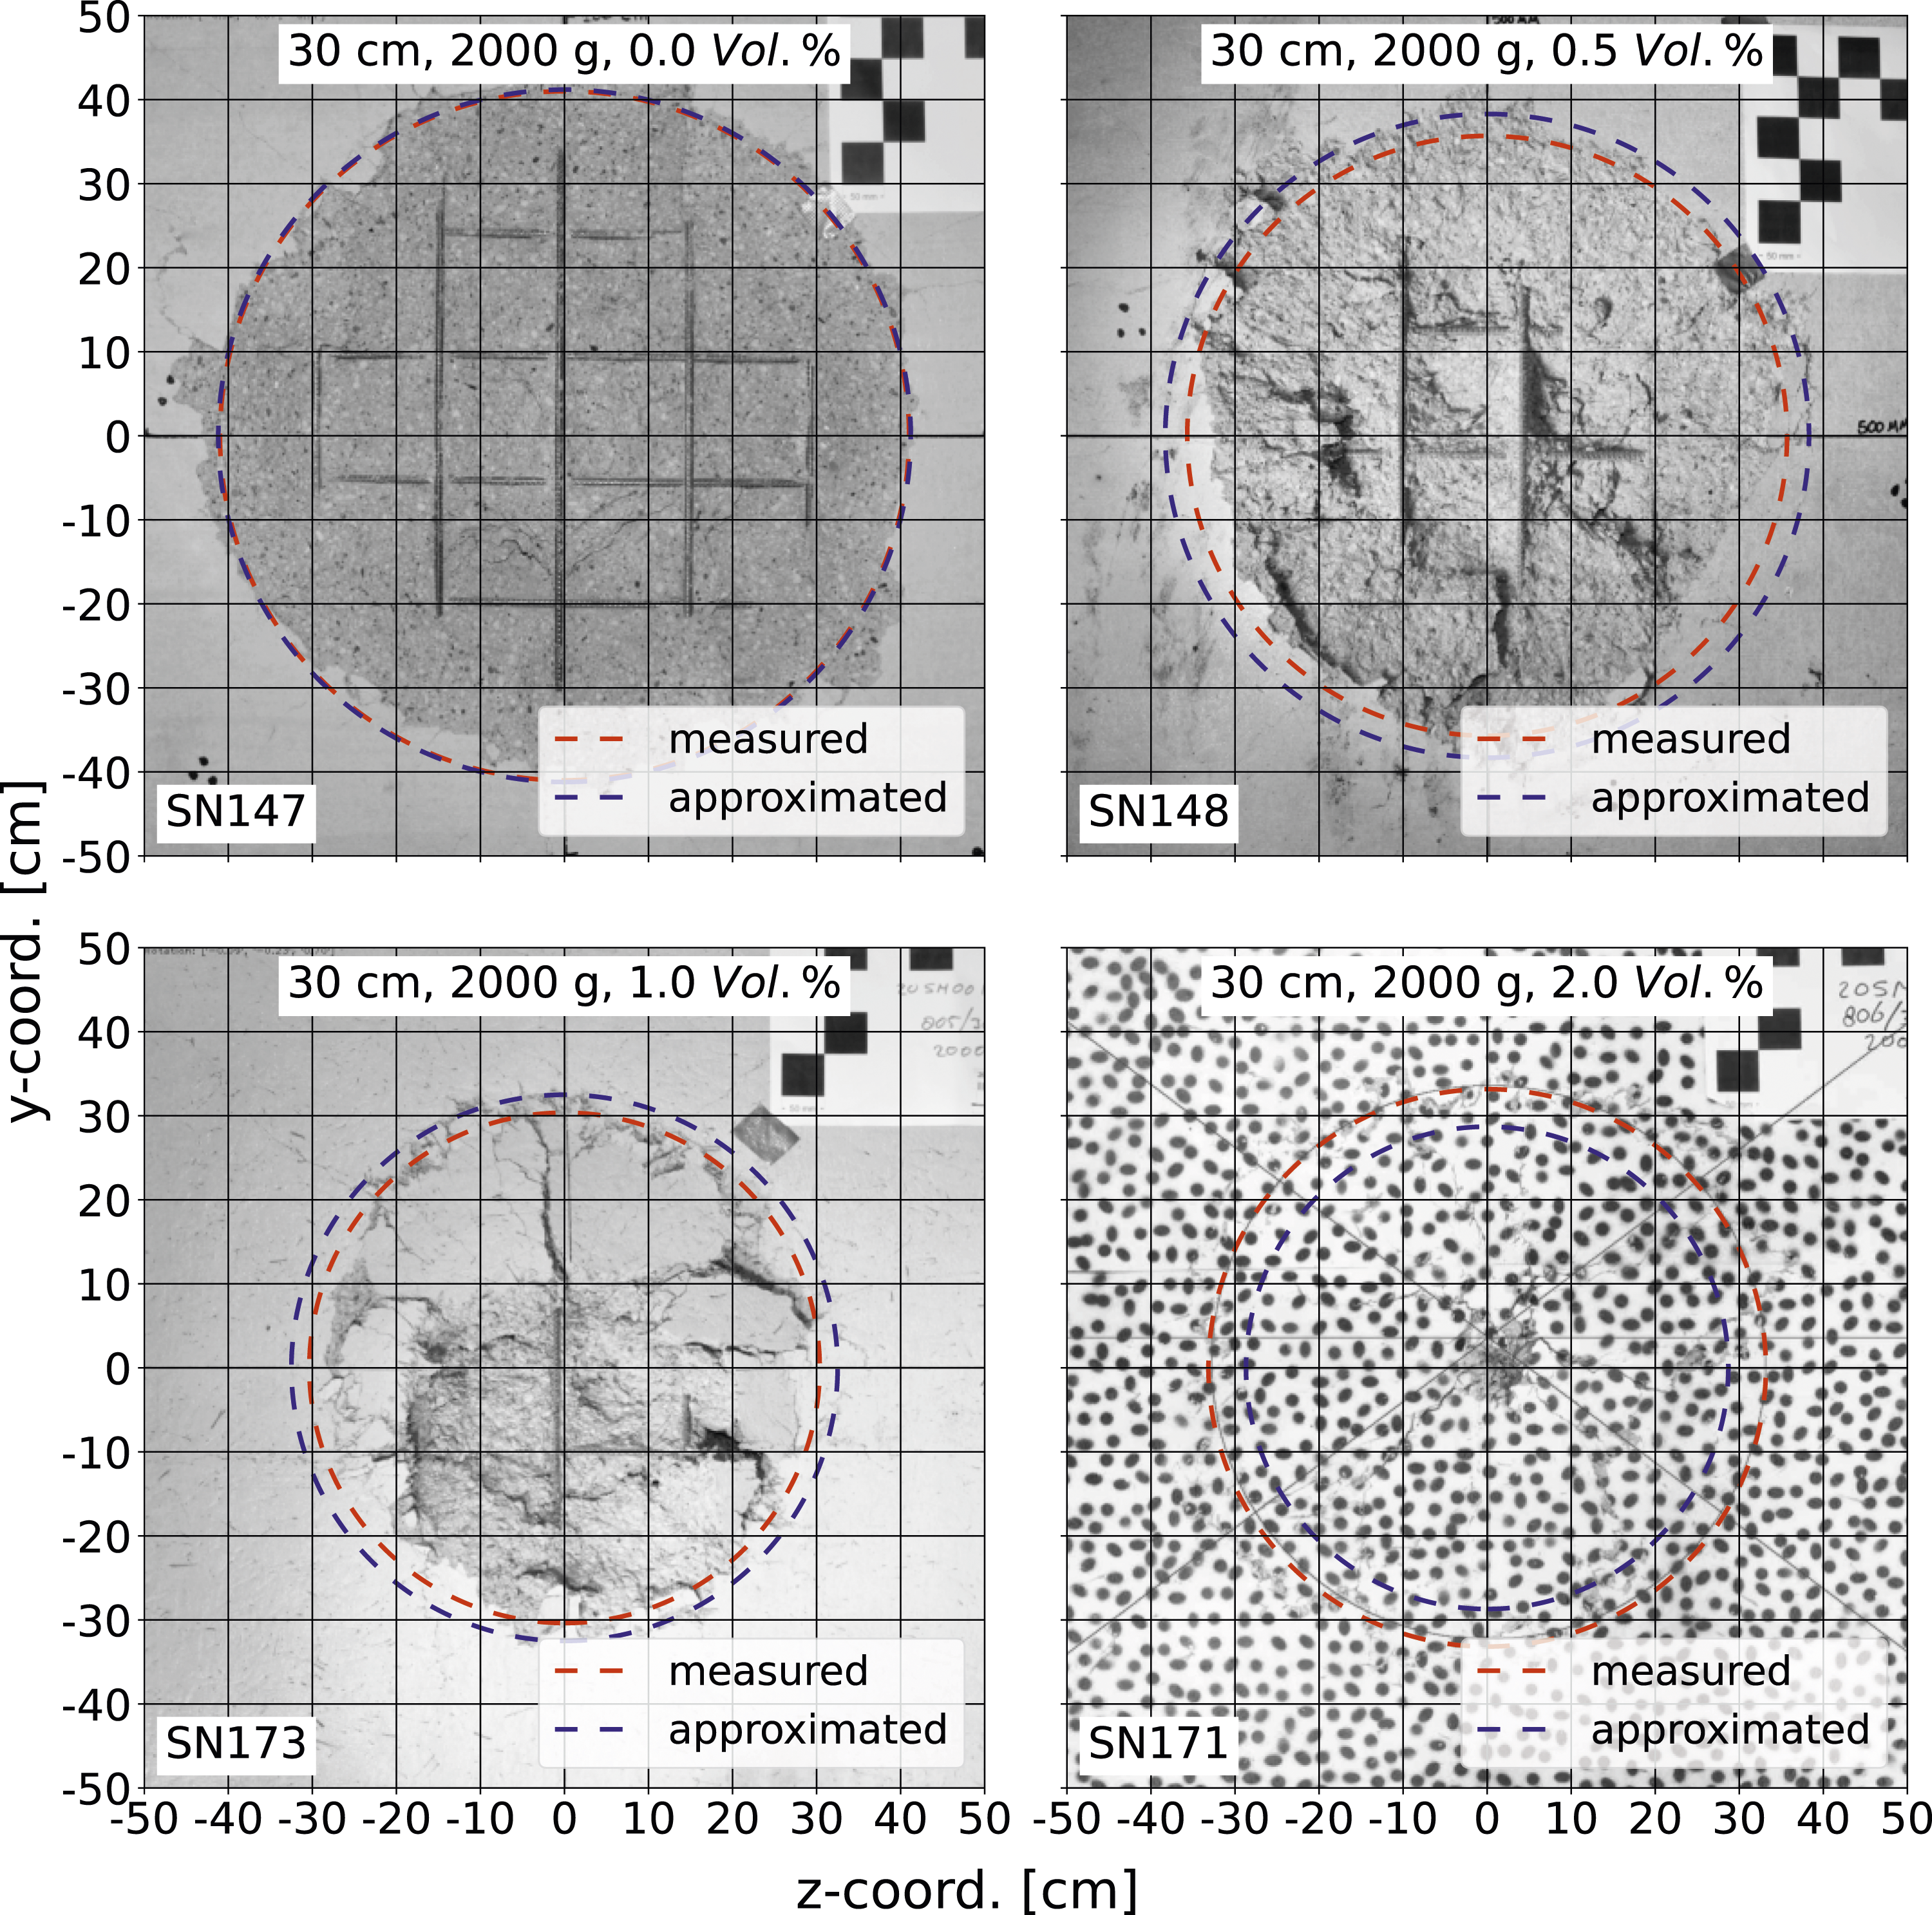
For 0.0 Vol % and 0.5 Vol % (upper two images) the agreement between the measured and approximated values is well within the expected deviations for the tests presented.
For 1.0 Vol % of steel fibers (lower left), the approximation includes the spalling crater, but there are debris fragments within this area that did not detach from the concrete slab. In the analog test, these debris fragments were not held back by the steel fibers, but flew away at a low x-velocity. Therefore, the combination of load and resistance in this case appears to be close to a threshold, for which the approximation gives a conservative prediction.
In the case of 2.0 Vol % steel fibers, almost all of the secondary debris fragments were retained by the steel fibers. The analog test shows some detached debris, but most of it landed directly in front of the concrete slab. After the test, the debris in this area could be removed easily and the resulting damaged area is very similar to the case with 1.0 Vol % steel fibers. The remaining kinetic energy is very low in this case, and even an increase of the fracture energy by less than 1.0 % would result in no predicted secondary debris.
In cases where a concrete slab without steel fibers would already be breached by the detonation, the steel fibers are expected to have a significantly reduced effect on secondary debris. This assumption is based on the fact that the steel fibers cannot anchor in the concrete in the loading direction in cases with a breach.
Validation of the velocity distribution using DIC
It becomes increasingly difficult for the developed tracking algorithm to determine the velocity when there is little secondary debris. This is especially true as the steel fiber content increases. Therefore, in some tests where little secondary debris was expected, DIC measurements were taken from the protective surface of the concrete slabs. The DIC measurements can be used to validate the x-velocity distribution approximated by equation (5) and the influence of the steel fibers according to the presented energy principle.
Figure 18 (right) shows the x-velocity distribution along a section through the center of the protective concrete surface. The test shown is a 30 cm thick concrete slab with 2.0 Vol % that has been loaded with 2000 g of SEMTEX 10. The coordinate on the abscissa is given in terms of the radial distance from the center on the concrete surface. The changing gray values of the lines indicate the different time steps. Velocity in x-direction over time (left) and in dependence on radial location (right) from DIC-measurement.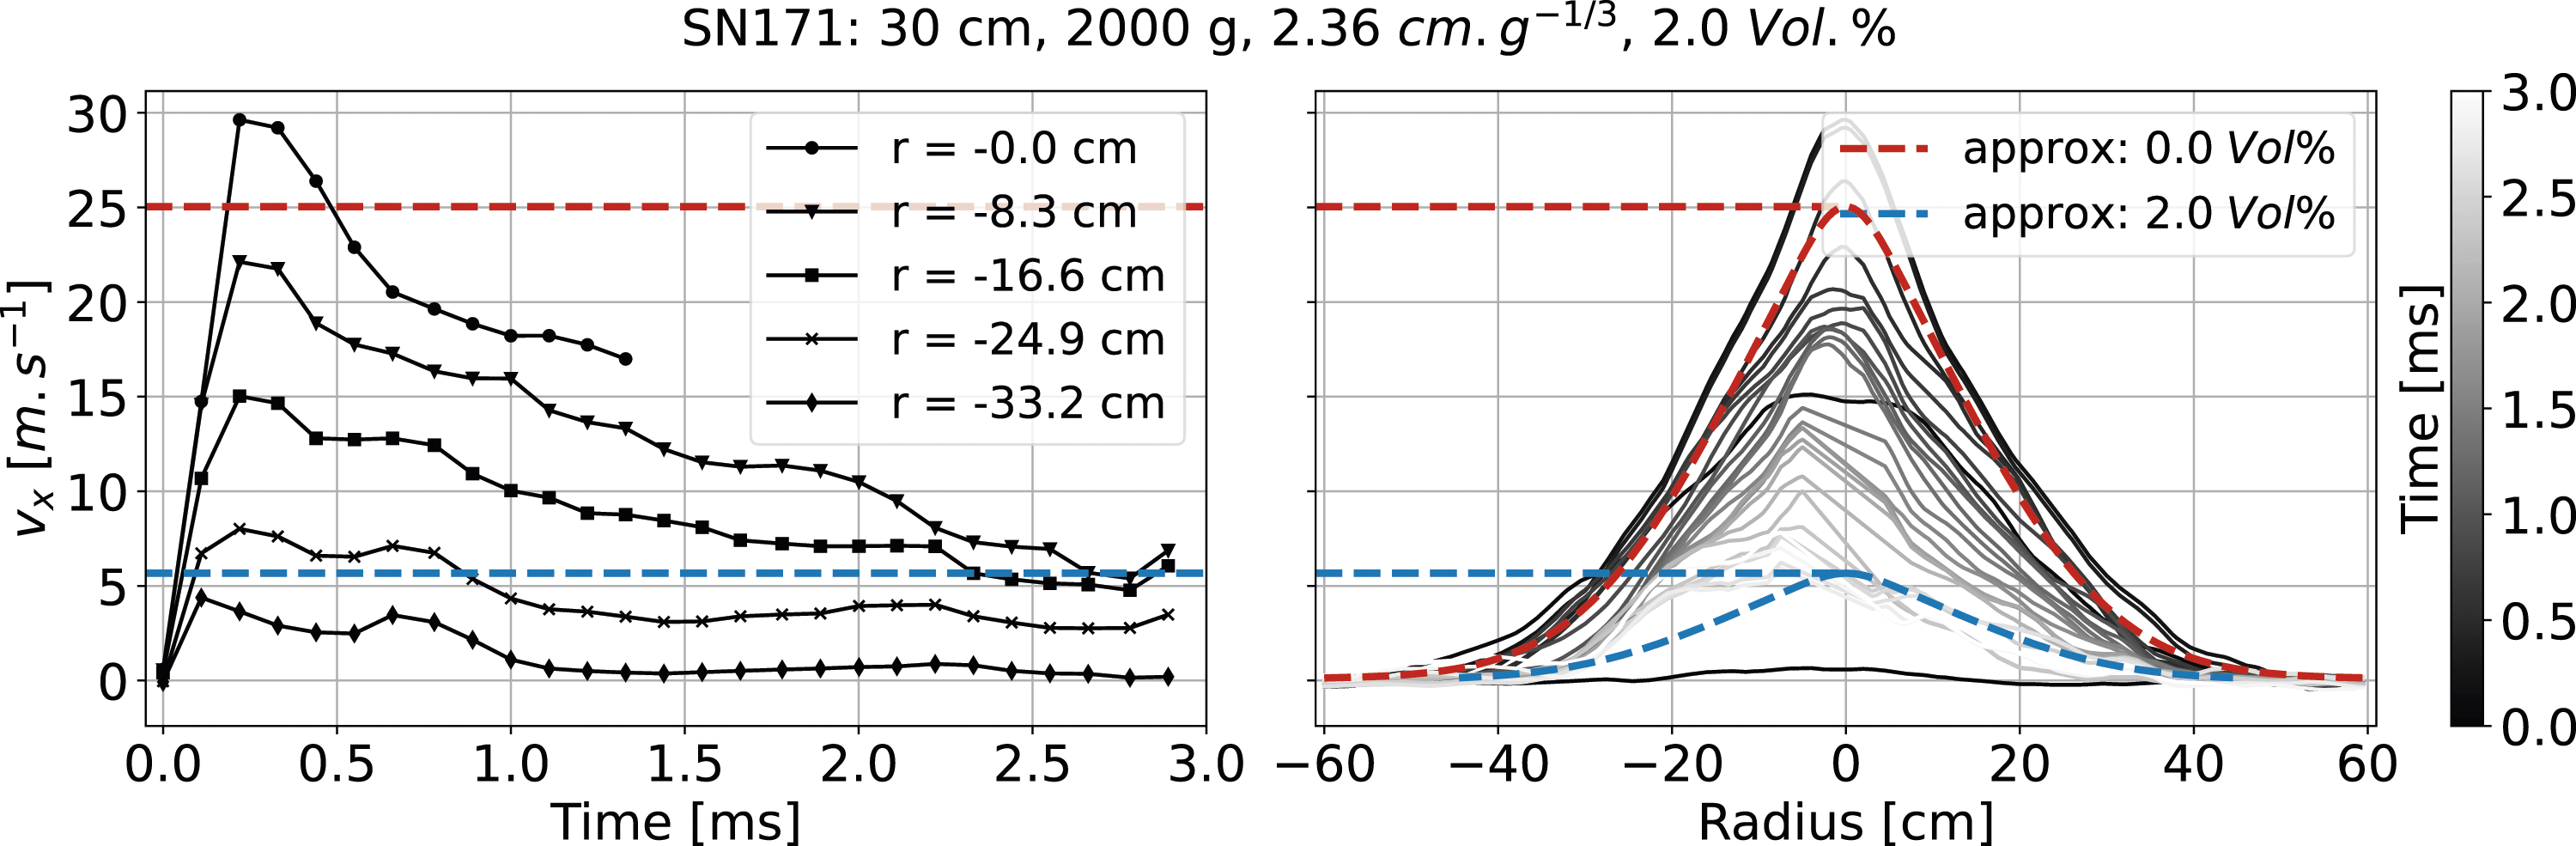
To evaluate the evolution of the x-velocity over time, Figure 18 (left) shows the x-velocity at selected locations. Starting from the time step of 1.4 ms, the DIC pattern in the center (−5.0 cm
The red dashed line shows the x-velocity distribution for 0.0 Vol % of steel fibers determined according to equation (5). The blue dashed line shows the x-velocity distribution for a steel fiber content of 2.0 Vol %, determined using the presented energy principle. For these approximations the maximum x-velocity and the parameter σ for the width of the distribution are calculated from the approximated polynomials in Figure 4 (right) and Figure 9.
The velocity at the protective surface of the concrete slab is the result of the reflection of the incoming compressive wave at that surface. Due to the large difference in impedance between the concrete and the surrounding air, the compressive wave is converted into a tensile wave upon reflection. This tensile wave propagates in the direction opposite to the original compressive wave. As soon as the superposition of the incoming compressive wave and the reflected tensile wave results in a tensile stress above the dynamic strength of the concrete, cracks are formed (spalling). The velocity of the secondary debris then results from the momentum trapped in the spalled concrete minus the energy required for the fracture.
As a result of the incoming compressive wave and the associated particle velocity, the x-velocity of the concrete at the protective surface of the concrete slab increases rapidly between 0.0 ms and 0.2 ms. This brief velocity peak is followed by a velocity drop during which the concrete fractures. The DIC measurements in this series of tests were not performed on reinforced concrete slabs without steel fibers. Therefore, it cannot be clearly determined which part of this velocity drop is due to the concrete fracture and when the influence of the steel fibers begins.
According to Hartmann (2009), who determined the shock velocity - particle velocity relationship for concrete using numerical simulations of the mesoscopic structure, no influence of the steel fibers on the surface velocity can be found before the concrete fractures. This is attributed to the proportionally very low share of the steel fibers in the concrete (≤2.0 Vol %). It is only after the initial cracking that the steel fibers begin to act by inhibiting crack propagation and reducing the velocity of the secondary debris.
At 0.4 ms, the shape of the x-velocity distribution approximated by equation (5) (red dashed line) shows a good agreement with the x-velocity distribution determined from the DIC measurement for 2.0 Vol % of steel fibers. It is therefore assumed that the fracture of the concrete itself is complete at this time step and the subsequent reduction in x-velocity is caused by the influence of the steel fibers. The velocity distribution for a steel fiber content of 2.0 Vol %, approximated by the presented energy principle (blue dashed line), also agrees well with the DIC measurements.
Unfortunately, the frame rate of the present DIC recordings is too low to analyze the initial fracture process before 0.5 ms in more detail. For future test series, a much higher frame rate of the DIC recordings could help to gain a better understanding of the underlying processes. Based on numerical simulations performed, the required frame rate is estimated to be > 1 × 10⁵ s−1 to properly capture the fragmentation process of the concrete.
Conclusion
After a brief presentation of the test series, a method for incorporating the L/D ratio into the experimental evaluations was presented. The derived equivalence factor, based on an energy equivalent impulse, gives a convenient linear relationship between the inverse of the scaled concrete slab thickness and the maximum x-velocity of the secondary debris.
The spatial x-velocity distribution of the secondary debris was derived from the tracked velocities of the secondary debris cloud. This distribution provides a better understanding of the underlying physical process and can be used to validate numerical simulations. The x-velocity distribution was compared to the fragmentation process on the protective side of the concrete slabs for tests without steel fibers. Two different regions of the spalling crater were identified and described.
The derived x-velocity distribution was used together with the averaged shape of the spalling crater to calculate the kinetic energy of the secondary debris. This new method allows a quantitative evaluation of the impact of secondary debris on people and machinery on the protective side of a concrete slab Hupfauf (2024).
Based on the observed influence of the rebar layer on the secondary debris, it is expected that reducing the depth of the spalling crater at its center by reducing the concrete cover is beneficial in reducing the kinetic energy of the secondary debris. Further experiments are required to quantify this relationship.
Based on the kinetic energy and the fracture energy of the concrete, the influence of the steel fibers was quantitatively analyzed. In the case presented, a significant reduction in the kinetic energy of the secondary debris of over 90 % can be achieved with a steel fiber content of 1.0 Vol %. A further increase of the steel fiber content to 2.0 Vol % could not be adequately analyzed with the test series conducted. Although a further reduction in kinetic energy was observed, a higher explosive load is required to test its full capacity.
In cases where a concrete slab without steel fibers would already be breached by the detonation, the steel fibers are expected to have a significantly reduced effect on the secondary debris because they cannot anchor in the concrete in the direction of the load.
Footnotes
Author’s Note
The test series was conducted in cooperation with the Netherlands Organization for Applied Scientific Research (TNO) near The Hague.
Declaration of conflicting interests
The author(s) declared no potential conflicts of interest with respect to the research, authorship, and/or publication of this article.
Funding
The author(s) disclosed receipt of the following financial support for the research, authorship, and/or publication of this article: The project is funded by the German Federal Ministry for Economic Affairs and Energy under project number 1501581.