
Abstract
In blast resistant design, simulation data may be used to generate the explosive loads that would be witnessed by the detonation of a high explosive device. There are many software packages available to simulate explosions, and this study aims to provide a comparison of a selection of them, including some recently available, with the aim of forming an understanding of the potential accuracies and speed of these in far-field explosive prediction. Software selection criteria were formed by a literature survey to highlight the commonly commercially used programmes. Each software package was used to predict the far-field effects of overpressure and specific impulse from two explosive charges against a reflective target. The data generated by these simulations were then critically compared and reviewed, both with respect to each other and, for the 100 kg charge size, with respect to experimental data. It shows that for the simulated scenarios, after domain and cell size fidelity studies have been performed, the choice of software may lead to a variance in prediction in the peak overpressure of up to 50%, specific impulse of up to 15%, and simulation run times by a factor of 600.
Introduction
The detonation of a high explosive in free air produces an overpressure wave that can be approximated by the Friedlander curve (Friedlander, 1946). Kingery and Bulmash in 1984 produced a technical manual that, among other parameters, allows the prediction of the Friedlander curve for a range of charge sizes and distances for hemispherical trinitrotoluene (TNT) explosions. This has been widely used to generate the design parameters of structures that could be near accidental or deliberate high explosive detonations (Kingery and Bulmash, 1984). The Kingery and Bulmash load predictions assume that the target represents an infinitely dimensioned reflective surface parallel to the shock front at ground level (Bogosian et al., 2016). When a shock front interacts with a finite structure, a blast clearing wave will occur Rigby (2014), and should the structure have a non-linear surface or additional reflective elements such as nearby buildings, overhangs and cantilevers. These will produce a complicated interaction where the use of Kingery and Bulmash load predictions would not be suitable (Ballantyne et al., 2010; Nartu et al., 2022; Rickman and Murrell, 2007; Vannucci et al., 2018). For these cases, computational software has been developed to predict the structural loads that can, if required, be incorporated into the design of protective structures (Cormie et al., 2019). Multiple software packages are now available for this purpose, as the dynamics of detonations and the propagation of shock waves are highly complex; a number of solutions/approximations have been proposed to allow answers to be generated (Noorpoor et al., 2020). For example, two of the widely used equations of state (EoS) for explosions are Becker-Kistiakowski-Wilson (BKW) and Jones-Wilkins-Lee (JWL), and the choice of EoS in the simulation will influence its final predictions (Amar et al., 2017).
How large these variations are in the programmes is of interest, both academically and practically, to ensure that the simulated blast loads are truly representational of a real event and that the user’s choice of software does not have an adverse effect on the ultimate use of the predictions.
In addition to the variation in the results, it is also important to consider the time taken to reach them. As such, this paper looks into the variation in run times for the wide range of software investigated.
To understand the range in performance in this area the output of a number of commonly used software packages has been compared through the simulation of the exact same physical setup and charge sizes (subject to software capability), along with a comparison to real detonation data for the larger of the two charge sizes investigated, although for a similar performing but different type of explosive.
Cell and domain size fidelity studies have been carried out for each programme to ensure that the relative performance is represented fairly along with run times and cell size versus accuracy comparisons. The purpose of this paper is not to rank any of the software packages, but to inform. To this aim, all references and comparisons to the various packages have been written alphabetically.
To limit this article and focus on producing a practical comparison, this study will examine events such as those commonly used in the experimental testing of large glazing facades. Where there is the potential for an intended or unintended explosive event to occur near a structure, mitigation of consequences can be achieved by creating a stand-off between the charge and the building, as the protection of structures in close proximity to explosives may well be impractical (Bedon et al., 2014). An example of this protection would be the use of hostile vehicle mitigation (HVM) to protect buildings from Vehicle Borne Improvised Explosive Devices (VBIEDs) (Cormie et al., 2009). Several international standards have been created to qualify this type of far-field test, such as GSA-TS01:2003 and ISO 16933:2007, which relate to the testing of protective structural elements, specifically glazing.
This far-field criterion has been summarised by Róbert (2012) so that once a shock front has detached from the expanding gas detonation products, the blast wave is considered in the far-field (Rigby and Sielicki, 2015). This detachment point can be predicted mathematically using the Zel’dovich-von Neumann-Döring (ZND) model of detonation, which describes the structure of the shock front and the reaction zone behind it (Zeldovich, 1950; Von Neumann, 1942; Döring, 1943).
This paper first seeks to identify the dominant blast software packages that are used across the field to highlight the candidates to be investigated in the comparison. Each software is then summarised to provide a broad outline of its capabilities and a summary comparison. A 92 kg Nitromethane test is then described that was conducted to provide a nominal comparison to the simulations.
The setup of each software is then described in detail along with the methodology. The experimental data are then provided, followed by a domain size study across the packages. A comparison of the run times is made along with a mesh sensitivity study. Finally, the optimised results are then compared with each other for both charge sizes and, in addition, for the larger 100 kg TNT eq charge to the test data.
Several studies have been conducted investigating the comparative performance of software. Tang et al. (2018) conducted a validation study that compared the test data with Air3D and CONWEP predictions for a wide range of charge sizes from 0.25 to 500 kg. Previous work by Shin et al. (2014) performed the largest package comparison found, comparing Autodyn, Kingery Bulmash, and Air3D. Jha and Kumar (2014) compared Autodyn with CONWEP for a single 10 kg charge at a stand-off of three m.
Many of these comparisons are for legacy software such as Air3D. There are a large number of non-commercial analysis packages, many with good accuracy but with restricted access, such as CONWEP and BlastX (Britt and Ranta, 2001).
A large review has not been published, and very little information is available comparing any recently developed blast software, and it is that gap in knowledge that this paper aims to contribute. This initial paper will provide a review of performance against a very simple scenario, and further work will compare them in a complex environment.
Method
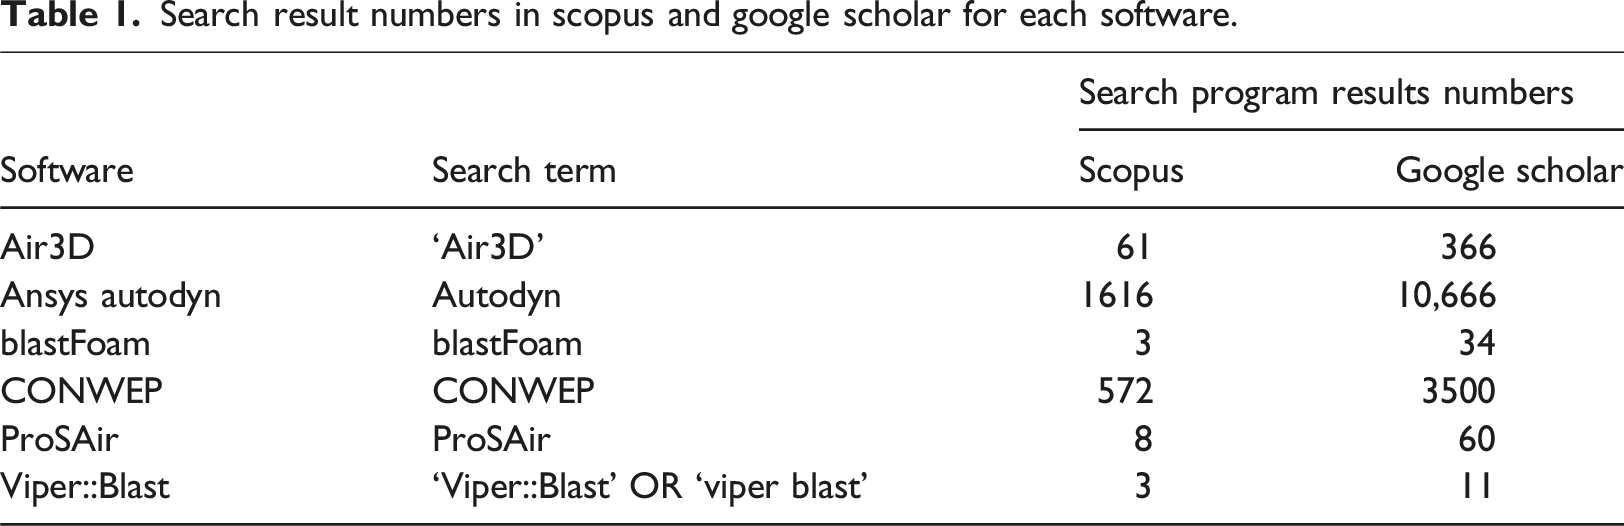
Search result numbers in scopus and google scholar for each software.
This paper focusses on commercially available packages, thus excluding the widely used but legacy software, Air3D, from its comparison along with CONWEP, which has limited availability; however, commercial equivalent versions of these two packages are considered in EMBLAST and ProSAir (Bassam, 2020; Forth, 2018b). There are two main products from Ansys that perform simulations of high-deformation or explosive events, LS DYNA and Autodyn. Autodyn has been chosen in this comparison, as it is more explicitly coded to look at the loading from explosions (ANSYS, 1994). The following sections provide an overview of the software chosen. There are many further commercial packages such as Apollo Blast Simulator, RADIOSS, ABAQUS, FLACS, but the author has limited themselves to those they had ready access to.
Autodyn
Autodyn produced by ANSYS (1994) is designed to simulate material response to impact, high pressure, and explosions that generate short-duration loadings, as well as the interaction between solids, fluids, and gasses. This is performed using non-linear computational fluid dynamics. Autodyn is run through a graphical user interface (GUI) after installation on a Windows system. It is a proprietary package, and pricing is not openly available. Autodyn has an extensive simulation capacity and allows computer-aided design (CAD) drawings to be imported, and gauges placed in any mesh location within the domain to monitor cell conditions such as overpressure. Autodyn version 2023 R1 was used in this study and was the latest available version at the time of writing.
blastFoam
blastFoam (Heylmun et al., 2020a) produced by Synthetik Applied Technologies is an open computational fluid dynamics (CFD) package specifically written to model blast effects, including detonation and air blast. blastFoam uses the OpenFOAM open-source library as its basis, building on this to produce a solver for high explosive and detonation simulations, and has the ability to model afterburn for under-oxygenated explosives (Heylmun et al., 2022). Of the programmes covered in this paper, blastFoam is the most directly configurable, allowing user control of most variables including the equation of state used among many other parameters such as flux schemes and afterburn models, but as such requires a detailed user knowledge should these be used.
blastFoam is free to use and is available from the GitHub website (Heylmun et al., 2020b), where installation instructions are also provided for different operating systems. The package is command-line driven, and results can be viewed using ParaView, an open-source scientific visualisation tool. Individual gauge locations can be placed anywhere within the domain to record the required blast properties such as overpressure, and can automatically correct potential user placement errors to move gauges, which would otherwise have been within unused cells, to the nearest structure face where there is an active cell. The generation of structures within the code can be done directly or via direct import of a CAD model.
blastFoam can use mesh refinement and adaptive meshing if required. Mesh refinement allows specific areas of the domain to have increased cell density, thus potentially replicating the benefits of a small cell size domain, but now with a lower overall cell count that will allow for reduced computation times (Fabritius and Tabor, 2016). Adaptive meshing increases the cell density in areas where the cell data are changing or about to potentially change, and decreases the cell density in areas where the cell data is constant, thus again reducing run times and likely increasing accuracy by allowing a finer definition of the shock front (Maragkos et al., 2022). The version of blastFoam used in this study was the latest at the time of writing, 6.2, published on 27th March 2023. A GPU version of blastFoam exists but has not yet been released on GitHub.
EMBlast
EMBlast (Bassam, 2020) is the energetic materials blast load software produced by the Energetic Materials Blast Information Group (EMBIG) formed in 2018. This package was produced to provide a commercially available solution to legacy software developed by the US military such as CONWEP. These legacy packages are MS-DOS based and do not provide a GUI or visualisation tools. EMBlast contains a free-field module to cover surface hemispherical or free-air and above-ground explosions for spherical bare-charge devices. In 2022 a second module was released to calculate structural load. EMBlast is a fast-running code and produces numerical and graphical results for user defined ranges for both free-field and reflected pressures and their associated impulses and time of arrivals. Pricing for this package is not available freely.
ProSAir
ProSAir (Forth, 2018b) (propagation of shocks in air) is produced and licenced by Cranfield University. It is a compressible CFD solver that is used for the modelling of air blasts on structures and provides structural loading. ProSAir is the modern commercial version of Air3D; it is operated through a GUI and is designed to be used in a Windows operating system. Commercial and academic licence details and prices are freely available. A single commercial workstation licence is £1900 (GBP) per year at the time of writing. The user guide included provides all the required information to go from installation to simulation, result output, and additionally, includes advice about the optimisation of models. ProSAir is restricted to single spherical charges and does not allow the importation of CAD files. The latest version 2018.4 was used in this analysis.
Viper::Blast
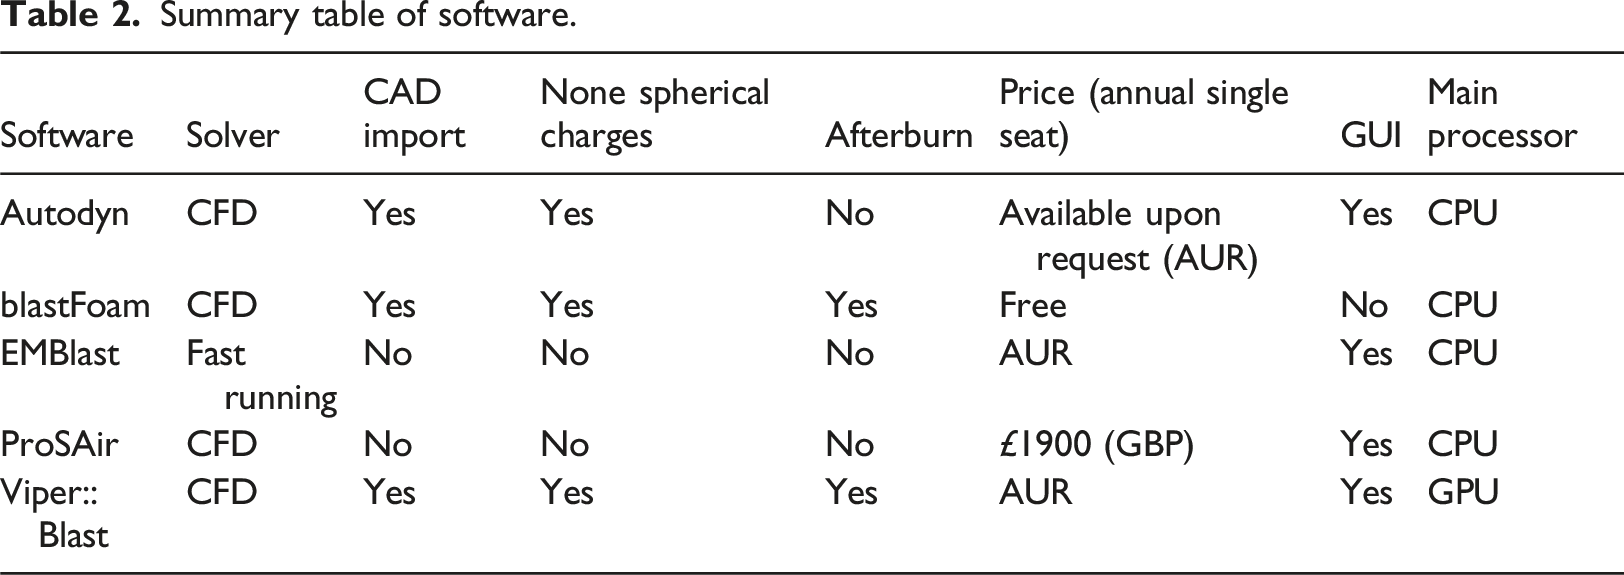
Summary table of software.
Experimental setup
To compare simulation programmes, an experimental scenario was devised which replicates two of the predominant TNT equivalent charges sizes and stand-offs used for commercial trials (Tang et al., 2018; Witty, 2023), 15 kg at 6 m and 100 kg at 25 m, these relate to cladding panel testing (Airports Council International, 2024) and a common test from ISO 16977:2007, EXV25.
In a real experiment, as performed at DNV Spadeadam Research and Development the charges are typically detonated 1.2 m above a steel blast plate placed on a 100 m × 100 m concrete test pad. The charge is raised to reduce cratering, mitigate against ground fragments, and assist in Mach-Stem generation (Johnson-Yurchak, 2020).
At DNV Spadeadam Research and Development, to reduce the effects of clearing both the cladding panel and the ISO 16933 test samples are typically mounted in or on a reflecting surface nominally 9.5 m wide and 4 m tall. To record the structural loading experienced by the test sample, a second reflective structure with dimensions similar to that of the test piece is placed on the same stand-off as the test piece in an arena trial. This ‘gauge block’ is located so as not to generate reflective interference with the test sample and is typically constructed from a stack of 3.5 × 0.75 × 4 m (width x depth x height) of concrete blocks arranged on either side by two rectangular concrete culverts of nominal dimension 1 × 3.5 × 3.95 m (width x depth x height); see Figure 1. The gauge block has mounting holes for pressure transducers to be installed that represent the typical centres of the items under test. Experimental target representing the gauge block, 7.5 × 4 (width × height).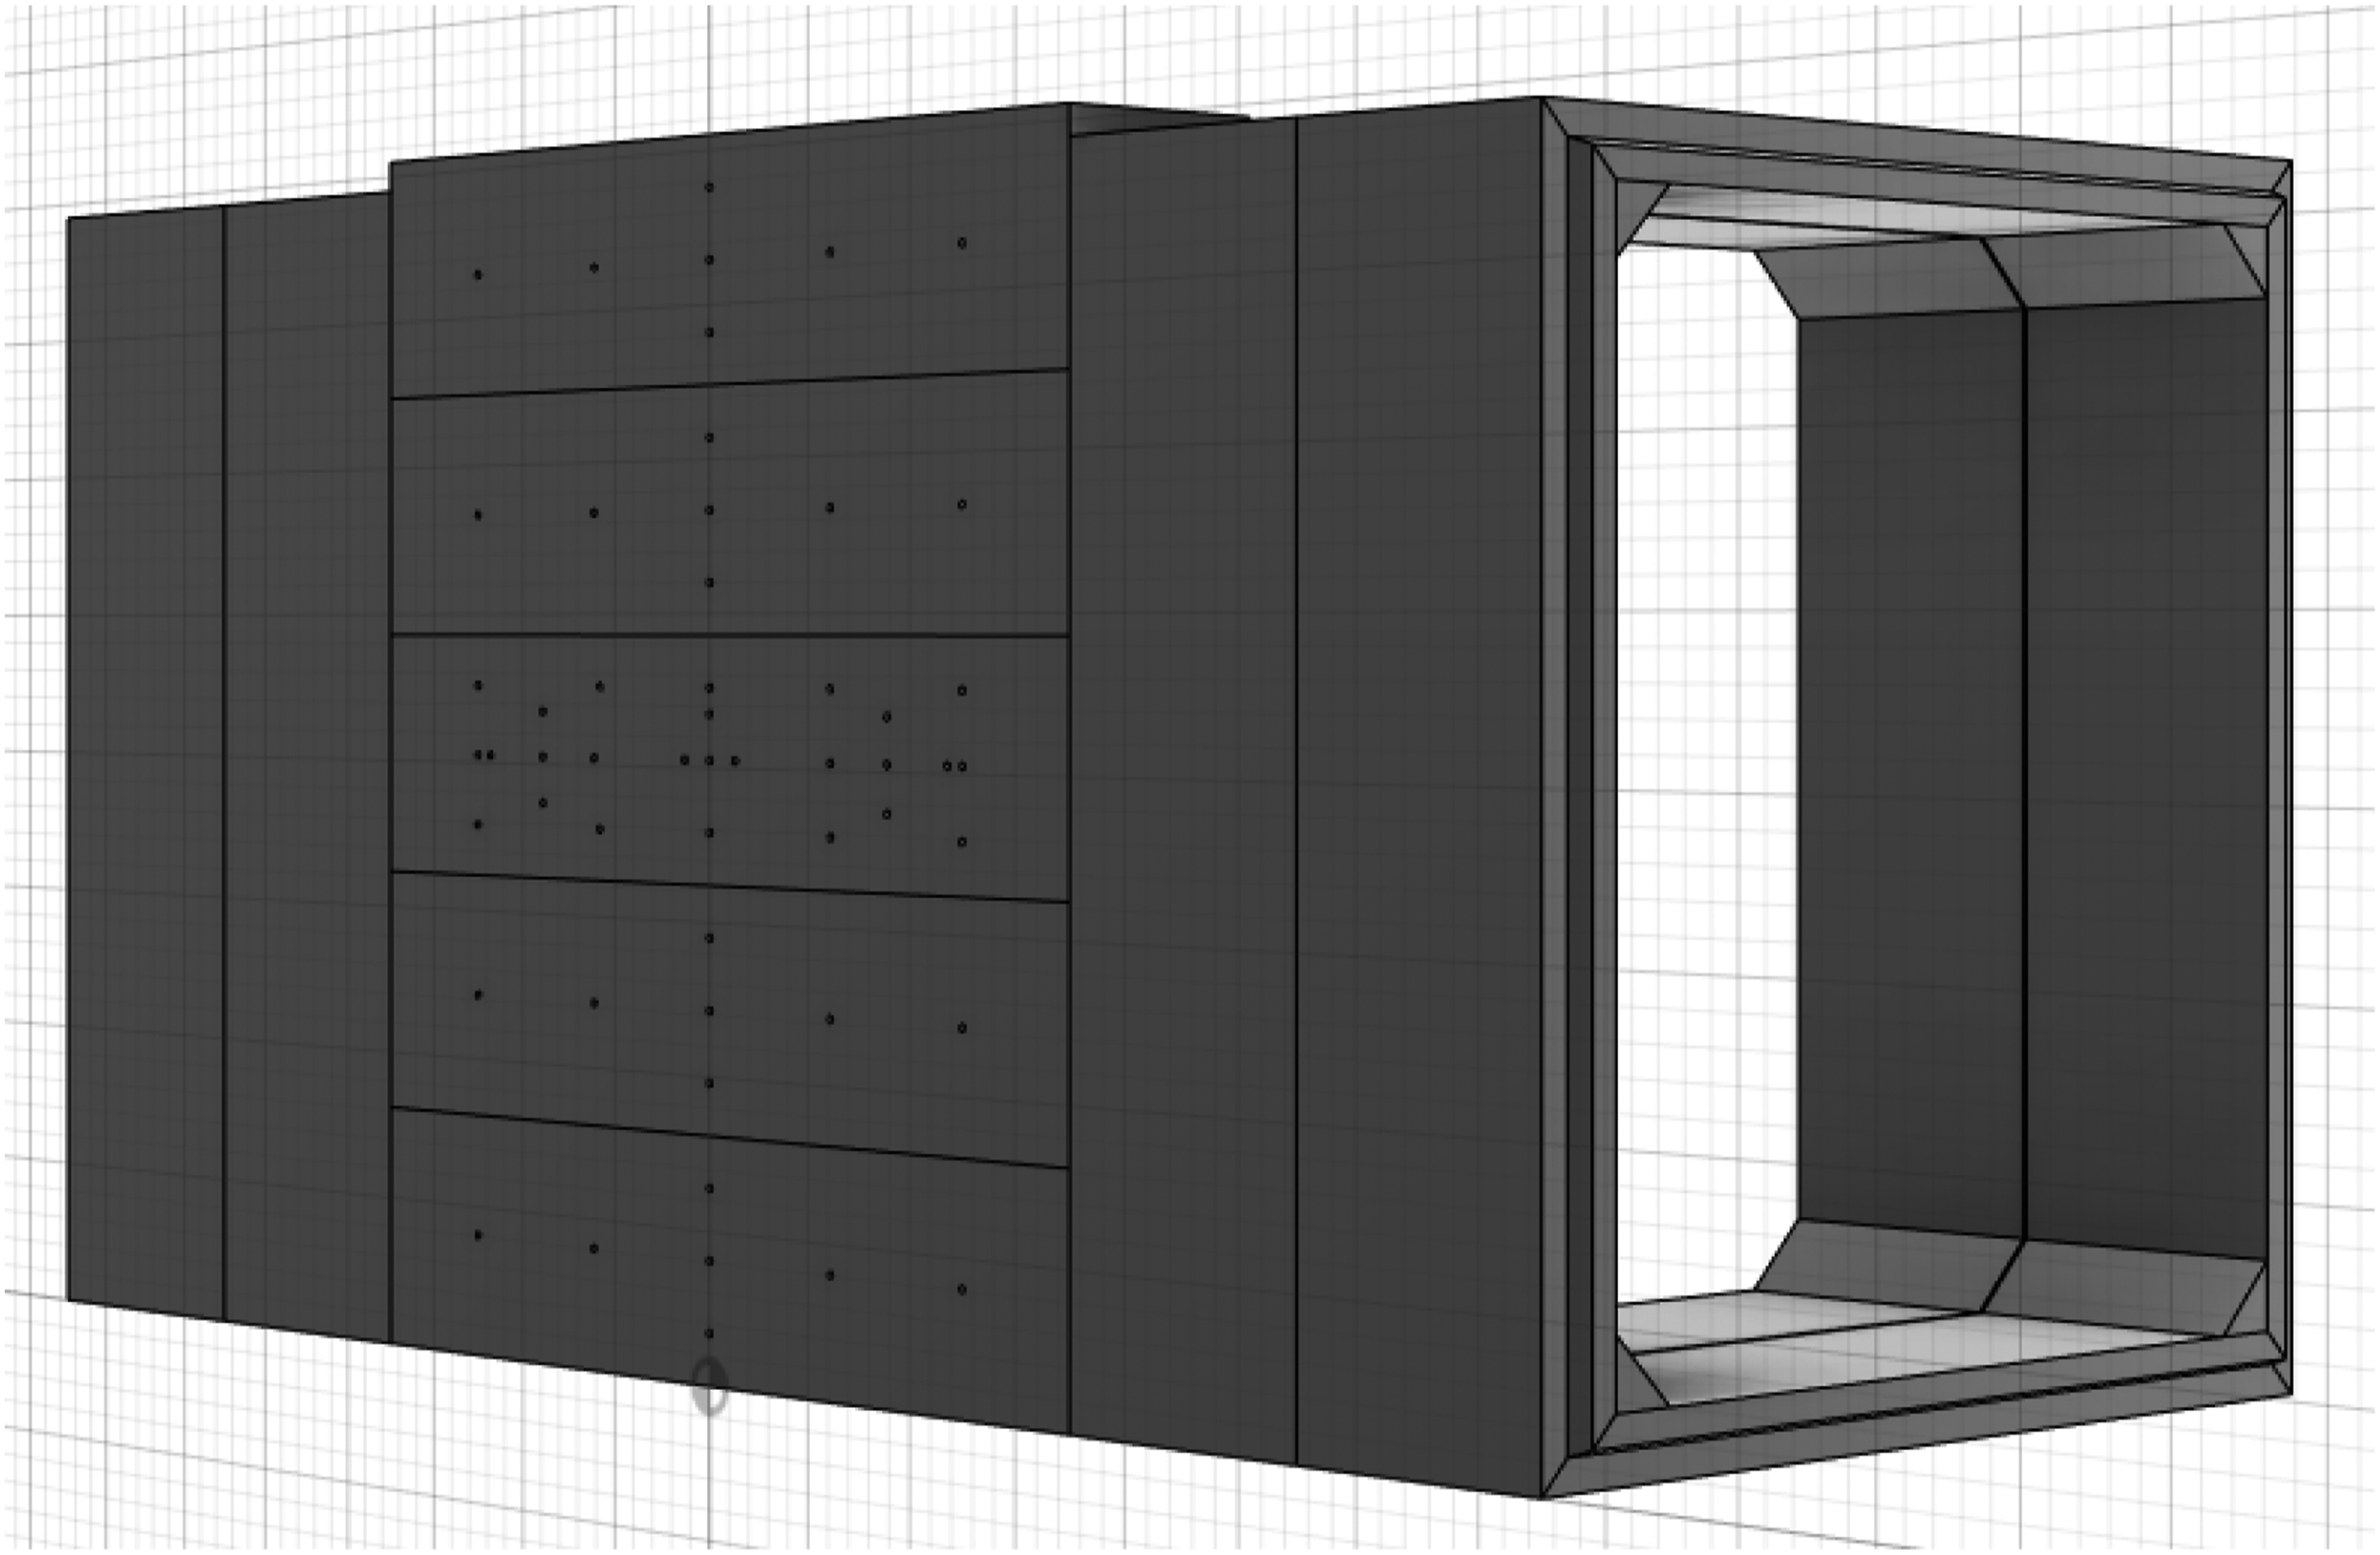
Software setup
The following section covers the details of the setup for each software package and how consistency was maintained between them. The manuals for each package were reviewed to ensure that they were properly implemented according to the manufacturer’s instructions. It should be noted that best-practice guidance from the manufacturers was used, but as many of these CFD programs have multiple variables, there were a number of different ways these simulations could have been performed. Domain size, cell size, CFD remapping, explosive type, boundary conditions, gauge location, reflected wall material, and simulated experimental duration were all set identically for the study.
The final domain size used for the two charge sizes was determined through a domain study in each of the CFD programmes demonstrating that the final domain sizes of 29.45 × 9.5 × 4.95 m and 10.45 × 9.5 × 4.95 m (length x width x height) did not interfere with the positive peak overpressure and positive phase specific impulse, as shown in Section. The same cell sizes were used across programmes to allow for direct comparison.
ProSAir and Viper::Blast were the only packages that recommended particular resolution settings in the 1D and 2D domains in their software manuals (Forth, 2018a; Stirling, 2021). The recommendation of both is that in the 1D domain the charge should have 50 cells across its spherical radius. A ProSAir example for charges close to the ground in 2D uses a cell size of 100 th of the charge height to ensure a good resolution of the shock-ground interaction. Using these recommendations and taking the density of TNT to be 1630 kg ⋅ m−3 this implies 1D cell sizes of 2.6 mm for the 15 kg charge and 4.89 mm for the 100 kg charge. The charges are elevated by 1.2 m, so the 2D mesh size was set to 12 mm. These same optimised mesh sizes were used for each of the CFD packages.
ProSAir can use a 1D to 2D to 3D remap for complex scenarios, where the charge is detonated in the 1D domain running typically until an interaction with a boundary, such as the ground, where a remap is performed to 2D. This 2D simulation then runs until the pressure wave would start to interact with a structure where the simulation can remap to 3D, allowing the calculation of clearing effects in multiple planes. This explicit remapping is not forced in the CFD programmes and the user can choose if/when these remaps take place, however, by running a 1D-2D-3D remap a high resolution cell size can be used in each that more accurately predicts the overpressure profile as shown in Section. To match the charge height, the 1D domain size was set to 1.2 m, the 2D to 7 × 5.8 m (height x radius) for the 15 kg scenario and 26 × 24.8 m for 100 kg scenario. Note that the 2D domain/simulation edge is 200 mm prior to the target wall to avoid potential errors in remapping close to or in the reflective structure. The height of the 2D domain is 1.2 m higher than the radius to allow the blast wave to reach the radial boundary first.
TNT was the only explosive supported across all packages and so was chosen to allow a direct comparison; also by using TNT, no consideration of TNT equivalences was required.
All domain boundaries excluding the ground and target were set to transmissive, with the ground and target treated as an ideal reflective surface.
TNT and air were the only materials used, and the default values for each were used.
The gauge was placed at the origin, at the central base of the wall for each CFD program, as shown by the yellow cross in Figure 2. Experimental target representing the gauge block and gauge position as displayed in Viper::Blast.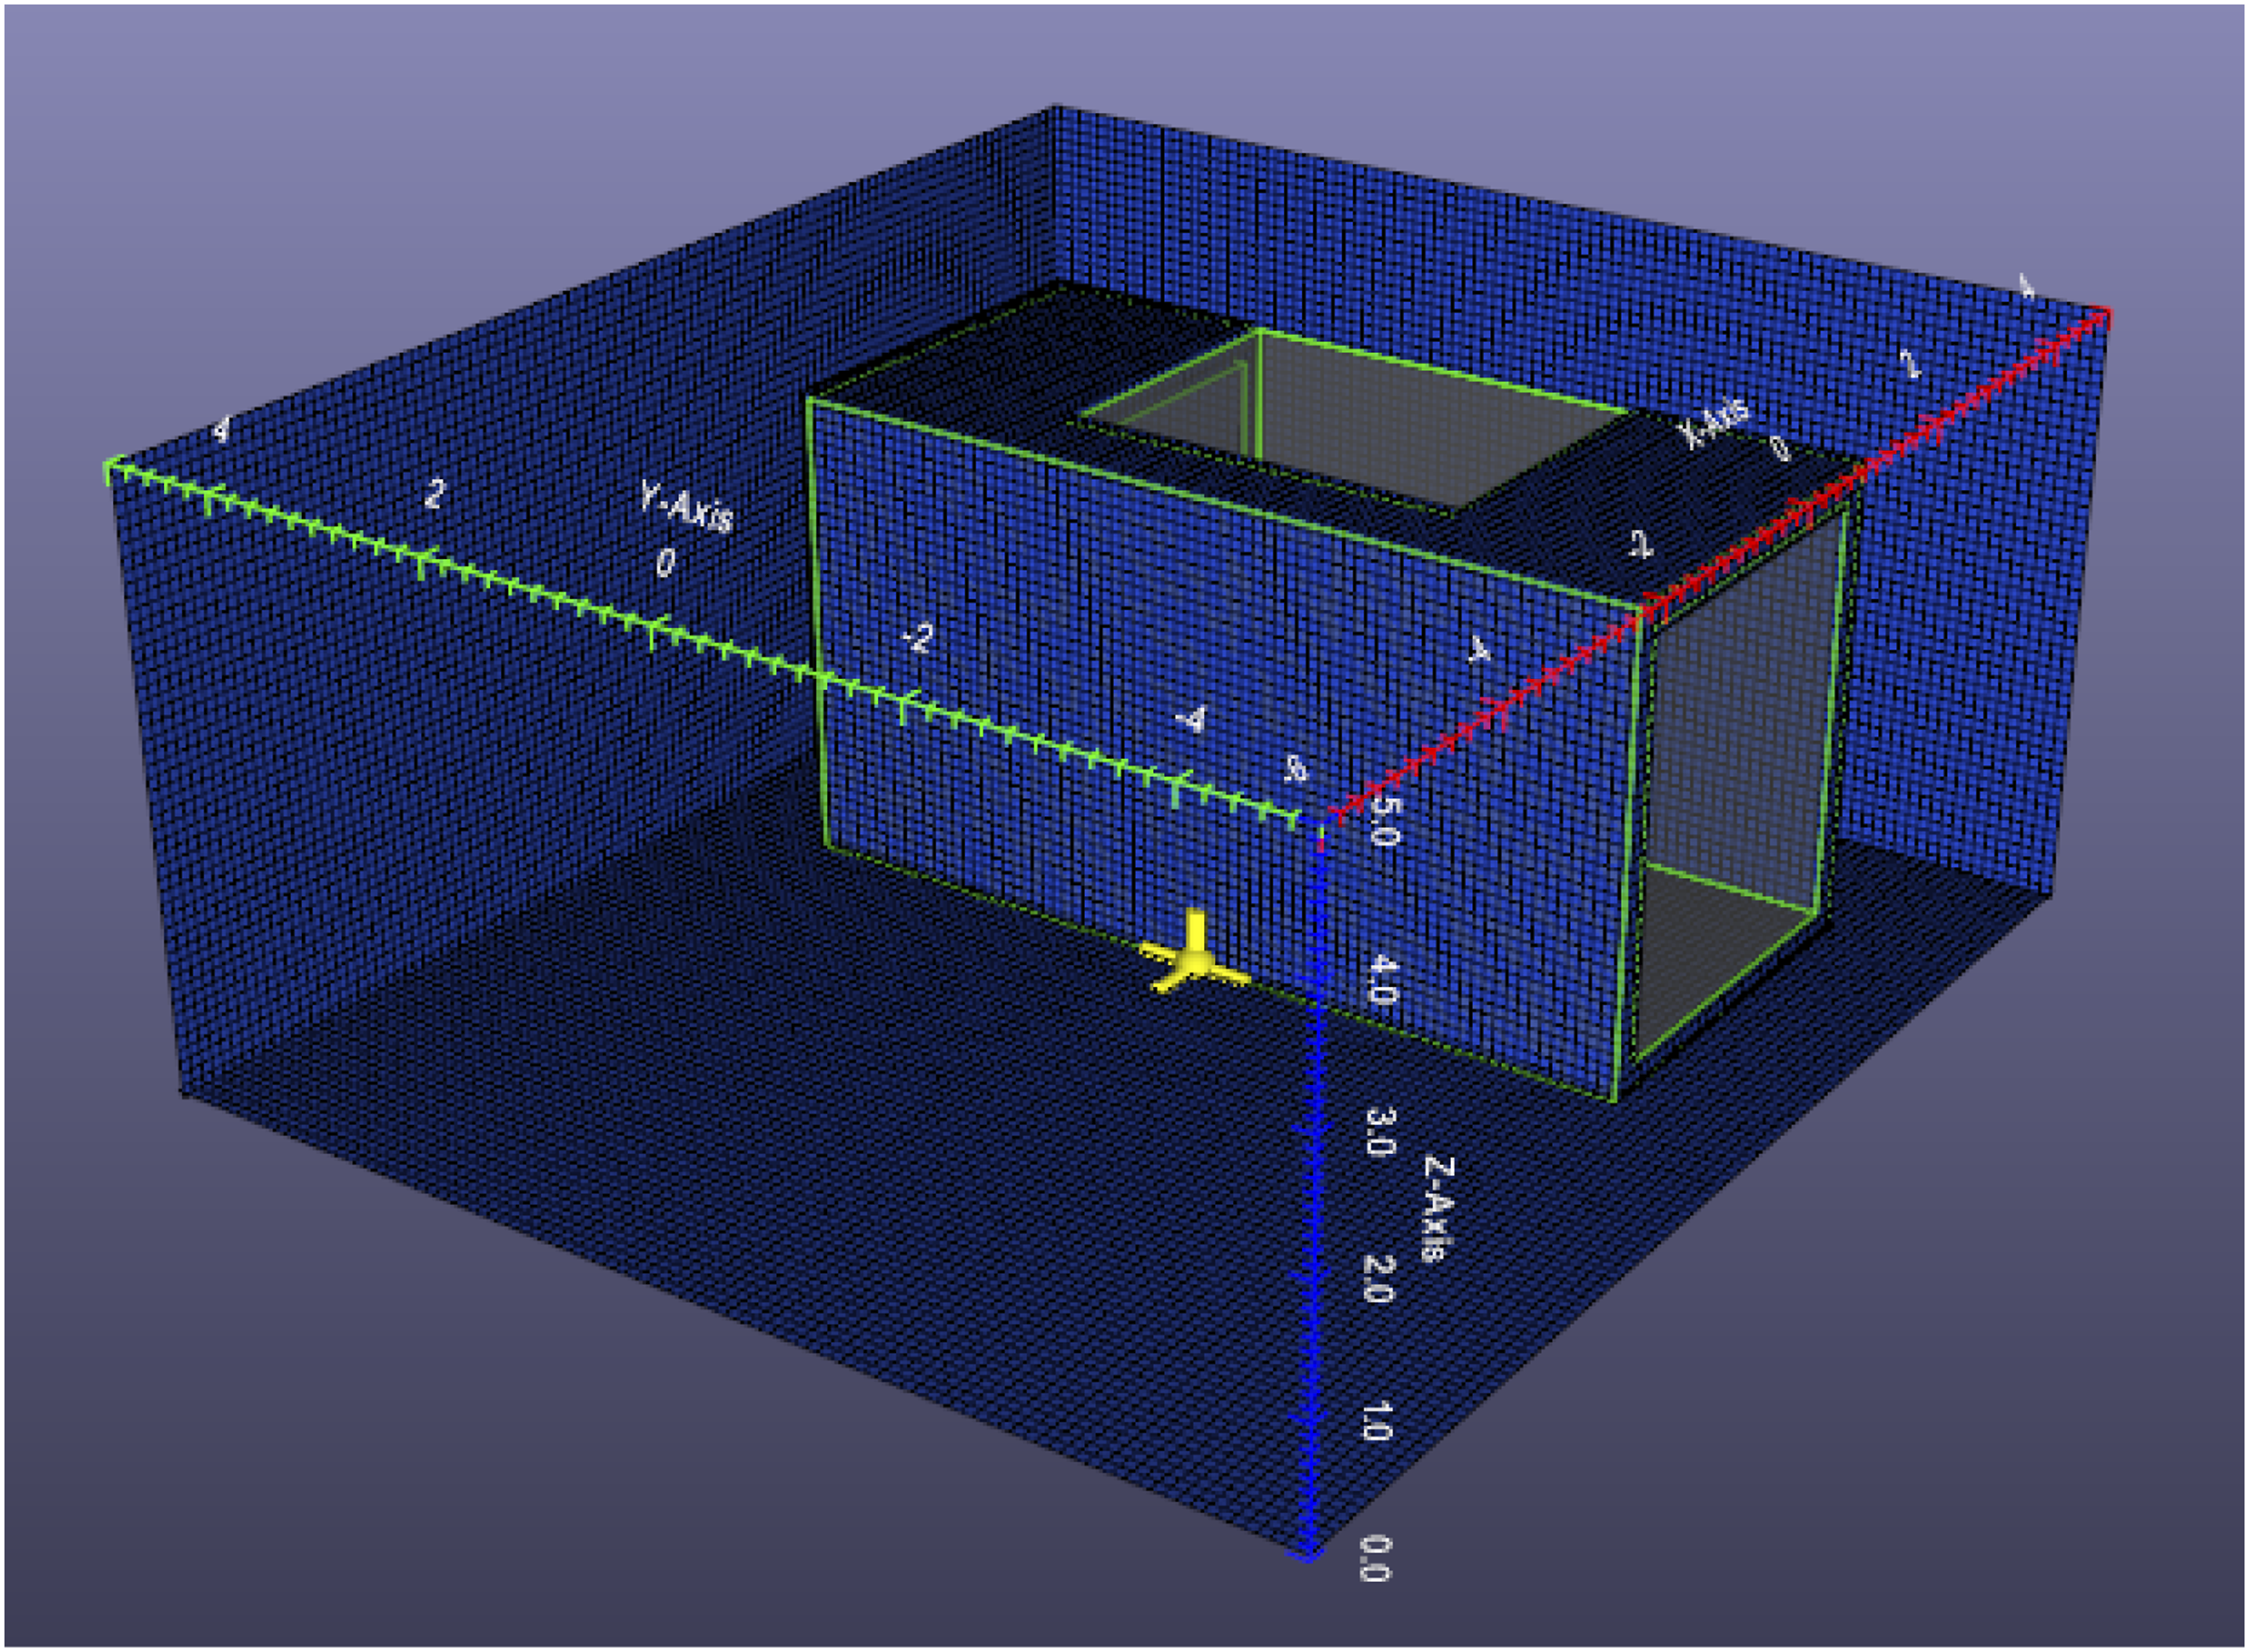
The simulated durations for each of the runs were 40 ms for the 15 kg tests and 100 ms for the 100 kg runs. These values were chosen to allow the negative phase to fully develop at the end of each simulation.
Simulation computer specification.
A limit to this study must be established on the maximum time a run could take at a specific cell size. This was chosen to be 12 h to replicate a scenario in which a simulation would be left running overnight at the best possible cell resolution. This experimental limit differs from standard simulation runs, where once the accuracy of the simulation is no longer changing significantly, no further reduction in cell size would be performed, but this method allows the reader then to see the relative performance speeds. For the cell size study, a minimum of three runs per package were performed to provide trend data for both the 15 kg at 6 m and 100 kg at 25 m scenarios against the reflective gauge block.
In total, 173 simulations were performed in the process of this run time and cell resolution study at up to 12 hours per run. By implementing a twelve-hour maximum run time limit, not all cell sizes could be simulated for each programme due to performance differences. In this range of software, there is a range of abilities to alter the EoS type, coefficients, and parameters. These factors were set to those used in the validation study or best-practice documentation.
Autodyn
The methodology for the basis of the simulation was derived from the Ansys Autodyn training courses ‘Workshop 12 Urban Blast’ and ‘Workshop 13 Urban Blast 2’. The initial run uses a 1.2 m long air filled 1D multi material Euler wedge, including a sphere of TNT of radius 130 or 244.7 mm to represent the 15 or 100 kg charge. The charge was detonated in the centre and the model terminated when the shock front neared the edge of the 1.2 m domain. This model was then remapped to a 2D Euler Ideal Gas Box where the j axis was set as a reflective boundary, and the model was run again until the blast wave was near the domain radius boundary. Autodyn uses i, j and k as axis labels, for this study these corresponded to y, x and z, respectively. This symmetric 2D axis model was then remapped to a 3D Euler Ideal Gas Box where the test structure had been created from unused index space cells and the gauge placed as per Figure 2. Images of the setup are shown in Figure 3. Autodyn, left image showing test structure and domain, right image showing simulation in progress. The domain size shown is 29.45 × 9.5 × 4.95 m (length × width × height).
blastFoam
The blastFoam setup includes in its installation tutorials and validation cases to provide guidance on initial setup and refined use. The tutorials provide examples on a range of cases including shocktubes, internal detonations and external explosions on buildings. The validation cases represent optimised simulations to validate blastFoam against previous studies, such as Kingery and Bulmash. Of these tutorials, two called ‘mappedBuilding3D - sector’ and ‘mappedBuilding3D - wedge’ formed the setup for the methodology. These are, respectively, 1D-3D and 2D-3D remapping simulations detonating a 25 kg cylindrical C4 charge against a L shaped wall at a stand-off of 2 m.
‘mappedBuilding3D - sector’ first creates a 1 m, 500 cell long one dimensional ray with the charge at its origin at one end. The simulation runs until the shock front reaches the edge of the domain. The ray is then rotated about the z and y axes to form a 3D sphere. This sphere is then imported into a 3D domain, 1 m above the ground, where the wave can then continue, interacting with the ground and the target.
‘mappedBuilding3D - wedge’ creates a 2D 1.5 by 1.5 m square domain with 30 cells on the x and z axes. The charge is created and detonated at a height of 0.5 m. Once this shockwave reaches the x axis domain edge this 2D domain is then rotated about the z axis and imported into the same empty 3D domain as per the ‘sector’ tutorial where it can then run to completion. Combining these two tutorials by remapping first the 1D ‘sector’ data into the 2D ‘wedge’ and then into 3D gave the required 1D-2D-3D solution. These tutorials are fast-running models, and hence not optimised for accuracy, whereas the validation cases are. So to refine the inputs a validation case called ‘KingeryBulmash - wedge’ was used. This Kingery Bulmash validation model uses TNT, and so the CFD values for TNT, the EoS etc. from this highly refined model were transferred into the new 1D-2D-3D code. As with the other CFD packages the gauge block was created from primitive shapes. Adaptive meshing and mesh refinement were used, but only to allow a halving of the initial cell dimension. This halved cell size would then be the same as the uniform cell size used in the other software packages. An example image from ParaView is shown in Figure 4. blastFoam example image in ParaView with a domain size of 29.45 × 9.5 × 4.95 m (length × width × height).
EMBlast
EMBlast operates a very simple user interface where the user first defines the project name, explosive size and type and then proceeds to the screen as shown in Figure 5. Here, the charge configuration is set to a hemispherical surface burst, an above-ground burst, or a free-air scenario. For the charges used in this paper, the charge height of 1.2 m is too low for the above-ground burst model to be used, and so the simulation was set as a hemispherical surface burst. The ground surface can be ‘soft’ or ‘hard’ and was set to hard to approximate the ideal reflecting surface used in the CFD models. The user then defines the reflective structure size and the area of interest on the said structure that the data will be calculated from. At this point, the code is ready to run, and the output is generated both graphically and summarised in a report. The graphical data were then exported for further analysis. EMBlast example image.
ProSAir
As ProSAir is specifically written for this type of experimental simulation the parameters detailed in previous sections can be entered directly; no manual remapping such as in Autodyn or blastFoam are required. The only user-calculated value is the switching factor and is calculated from equation (1) (Forth, 2018a). The switch time determines the simulated time at which ProSAir switches from first to second order accuracy.
An example of the live run output is shown in Figure 6 ProSAir example image.
Viper::Blast
Viper::Blast is provided with a detailed manual covering the functions of the software through worked examples of each. The manual provides recommendations for mesh sizes, values for the Courant Friedrichs Lewy condition that influences the stability of the package, and details of the preferred setup for a selection of examples. These recommended parameters are discussed above, and the 1D-2D-3D remapping facility was used. Similar to ProSAir, Viper::Blast has been specifically written to solve this type of experimental problem. As such all the experimental parameters are easily inputted directly into the GUI. The solving method was the ‘AUSMDV, single GPU, out-of-core local’. This is optimised for large models where the model size will not fit within the memory of the GPU and further host PC memory can be used. The JWL mode was not used for consistency with the other programmes, as it is not an option available for all. An example of the live run screen is shown in Figure 7. Although a CAD model of the gauge block could have been imported, for consistency with the other packages, the gauge block was manually constructed from primitive shapes within Viper::Blast. Viper::Blast example image.
Results
Experimental data
A spherical 92 kg Nitromethane charge was detonated at DNV Research and Testing Spadeadam, Cumbria, UK in 2022. This particular charge size is used at DNV Spadeadam to be nominally equivalent to 100 kg of TNT and consistency meets the requirements of the ISO 16933 ‘EXV’ classification (Witty, 2023). The setup of the arena matched the simulated setup as described in section with the charge centre elevated 1.2 m and the reflective wall at a 25m stand-off. As most explosives have different TNT equivalences for overpressure and specific impulse (ISO 16977:2007), no specific comparisons are made between these live experimental data and the simulations; the data are included here for interest. Another comparison of interest is with the Kingery and Bulmash curves that are widely used. To that extent, it should be noted that EMBLAST has been validated against the Kingery and Bulmash curves (Angelides et al., 2022), with the EMBLAST data in this paper also including clearing effects.
In the live experimental data the overpressure and specific impulse measured from an average of three transducers in the centre of the gauge block was 102 kPa and 500 kPa⋅ ms, respectively. The time history of the overpressure of the explosion is shown in Figure 8. Overpressure time history for 92 kg Nitromethane charge at 25 m.
Domain size study
For all CFD based software packages, a domain size study was performed to demonstrate the optimal size to minimise run times but retain accuracy, ideally within 2% in the area of interest in the overpressure time history. Figure 9 shows how the domain size affects the overpressure time history for each of the CFD packages for two domain sizes for the 100 kg experiment. The first is a large domain 29.45 × 20 × 10.2 m, and the second a small domain 29.45 × 9.5 × 4.95 m. The time of arrival, peak overpressure, and specific impulse are similar for the central ground level gauge, but a variance is established in the negative phase and to a greater degree in Autodyn. Domain size comparison for all CFD packages. (a) Positive phase peaks and (b) Negative phases.
In addition to the above domain study, looking at the variation of additional gauge positions located around the edge of the structure reveals slightly larger differences in peak overpressure and specific impulse. An extended domain study was performed in Viper::Blast to show this in more detail. A large series of runs were performed, each incrementing the clearance of the domain boundary from the side of the reflective structure by initially a single cell, see Figure 10. The results of this can be seen in Figure 11 where a gradual increase in the refinement of the peak overpressure and specific impulse occurs with increasing separation. The peak overpressure resolves with increasing cell clearance as shown in Table 4 where the peak overpressure is not fully resolved to a decimal place until a 22 cell clearance and 52 cell clearance for the specific impulse. Showing a comparison between the largest domain and the smallest with a single cell clearance between the edge of the structure and the domain wall, gauges omitted in (b) for clarity. (a) Largest domain and (b) Smallest domain. Viper::Blast domain size comparison for an edge gauge, where the curve name is the number of cells from the edge of the reflected wall to the domain boundary, runs were performed with a 100 mm cell resolution. The one and two cell gaps show the greatest deviation in the shape of the curve with the overpressure remaining higher than the other curves as they enter the negative phase. Shows variation of peak overpressure and specific impulse with cell clearance around the edge of the reflective structure for a gauge on the lower edge. Note that the peak overpressure and specific impulse to one decimal places are not fully refined to one decimal place until a cell clearance of 22 and 52, respectively.
The study of domain size in this article has shown that in these simulated scenarios, increasing the domain size does little to vary the peak overpressure and specific impulse for the central gauge at the base of the wall. It also shows that a 10 cell clearance, corresponding to 1 m in this case, between the domain wall and the edge of the structure keeps the overpressure and specific impulse within 2% of the largest domain studied. As shown by Rigby (2014) the effect of the domain boundary is to create an expansion wave that contaminates the results and, as such, does not depend strongly on cell size, so only the 100 mm cell size has been investigated here. Fixing this domain size at 1 m clearance for all scenarios allows a useful comparison of cell size versus run time to be performed and provides valuable data on the effects of the refinement of peak overpressure against cell size, as shown in the following sections.
For this type of scenario an initial domain size can be estimated for a study if the velocity of the expansion wave, the duration of the pressure pulse required and the distance from the gauge to the domain wall are known. Conservatively, the velocity of the expansion wave could be taken to be that of the blast wave arriving at the reflective structure. This can be quickly estimated from the UN Saferguard website (United Nations, 2021) which uses the Kingery and Bulmash data. For this case, the positive phase duration for the 100 kg charge from UN Saferguard is 18 ms, and the speed of the shockwave at 25 m from a 100 kg TNT charge is 391 m ⋅ s−1. This suggests that a distance from the gauge to the domain wall of ∼ 7 m is sufficient to capture the positive phase data before the expansion wave arrives. This is slightly conservative compared to the full domain study at 5.75 m, but a good initial estimate.
Run time
The following section describes the effect of the size of the mesh on the execution times of the simulations. Figures 12 and 13 and Tables 5 and 6 show the comparison of the run times for the four CFD programmes for both the 15 and 100 kg scenarios.A range in performance is witnessed with the expected trend of increasing run time with decreasing cell size based on a cubic relationship. This is due to a proportionally cubic increase in the number of cells in the domain as the cell size decreases. Autodyn, blastFoam, ProSAir, and Viper::Blast retain their relative performance positions for changes in charge and cell size. A wide range in performance is demonstrated with the faster package, Viper::Blast, being in some cases 40 times faster than the next fastest package and hundreds of times faster than the slowest. This difference in performance is due to the utilisation of Viper::Blast being GPU based and written to specifically simulate the airblast environment resulting from the detonation of high explosives (Stirling, 2021). Although there is a large variation in run times, this must be taken into consideration with the relative accuracy of each and how the overpressure profiles vary with cell resolution. The next section shows how the variation in cell size alters the overpressure profile. This will allow a comparison of where the refined overpressure profile was established in terms of run time. Comparison of run times for CFD packages simulating 15 kg charge at 6 m, 100 to 30 mm mesh run times for Viper::Blast are too short to be clearly seen on the same graph and are shown separately in (b). (a) A comparison of run times for CFD packages simulating a 15 kg charge at 6 m. A PC or software limit was found prior to the 12 h cut off on all models. (b) Viper::Blast run times for 15 kg simulation. Comparison of run times for CFD packages simulating 100 kg charge at 25 m, Viper::Blast run times are too short to be seen clearly on one graph and are shown separately in (b). (a) Comparison of run times for CFD packages simulating 100 kg charge at 25 m. (b) Viper::Blast run times for 100 kg simulation. Summary of run times for all packages – 15 kg at 6 m, simulation time of 40 ms. Units: run time in hours and minutes and hours, minutes, and seconds for Viper::Blast. Note: ‘-’ denotes run failure due to software or PC capacity. Summary of run times for all packages – 100 kg at 25 m, simulation time of 100 ms. Units: run time in hours and minutes and hours, minutes, and seconds for Viper::Blast. Note: ‘-’ denotes run failure due to software or PC capacity.
Mesh sensitivity study
To provide an overview of the effects of changing the mesh size in the CFD simulations on both peak overpressure and specific impulse, a mesh sensitivity study has been performed. Peak overpressure will usually increase with mesh refinement as the shock front becomes more resolved, which is part of a general convergence as refinement continues (Rigby et al., 2014). For the specific impulse the overall shape or the overpressure time history does not vary as significantly and so effects on the specific impulse are less. Figures 14 and 15 show the variation in peak overpressure and specific impulse for the 15 and 100 kg charges for the same range of mesh sizes as the run time study. Showing the variation in peak overpressure and specific impulse for a range of mesh sizes for the 15 kg scenario. (a) 15 kg peak overpressure variation and (b) 15 kg specific impulse variation. Showing the variation in peak overpressure and specific impulse for a range of mesh sizes for the 100 kg scenario. (a) 100 kg peak overpressure variation and (b) 100 kg specific impulse variation.
GCI values for overpressure convergence for the 15 kg TNT charge.
Note: For the GCI tables – denotes values that can't be calculated as this run was not performed.
GCI values for specific impulse convergence for the 15 kg TNT charge.
GCI values for overpressure convergence for the 100 kg TNT charge.
GCI values for specific impulse convergence for the 100 kg TNT charge.
Relative comparison
The following section demonstrates the range of overpressure time histories found across the full selection of programmes in this paper. This is done by comparing all the different outputs at the finest mesh size achieved by each programme within the maximum run time limit of 12 h or until failure of the software or PC capability if faster.
15 kg TNT charge at a stand-off of 6 m
Figure 16 shows the comparison for the 15 kg scenario. Apart from the Autodyn model, the CFD overpressure curves are in good alignment up until after the secondary shock front has passed, where large deviations then start to appear across the models, but this is likely due to the different EOSs used as well as their inputs and domain sizing, as discussed in Section. The EMBlast model follows a similar shape to the CFD models but does not include/model secondary shock information. Figure 16(b) shows a close-up of the peaks ranging from 463 to 696 kPa, a 50% difference relative to the minimum peak overpressure seen. The specific impulse varies less, 755 to 869 kPa⋅ ms, or a relative difference of 15%. Table 11 summarises the peak pressures and impulses. Shows the comparison of the analysed software packages for a 15 kg TNT charge at 6 m from the gauge block for identical domain sizes. (a) Full trace and (b) Highlighting peaks. Summary table of peak overpressure and specific impulse for all packages – 15 kg at 6 m.
100 kg TNT charge at a stand-off of 25 m
Figure 17 shows the comparison for the 100 kg scenario. Again, apart from the Autodyn model, the CFD programmes overlay in a uniform manner with deviations occurring after partial recovery of the negative phase. Figure 17(b) shows a close-up of peaks ranging from 83 to 94 kPa, a 15% relative difference in the peak overpressure. The specific impulse varies from 487 to 549 kPa⋅ ms, a relative difference of 13%, similar to the 15 kg case. The clearing in the 100 kg at 25 m model is more pronounced than in the 15 kg at 6 m due to the difference in clearing factors as shown by Rose et al. (2006). There is also a larger difference in the range of time of arrivals compared to the 15 kg models. Table 12 summarises the peak overpressure and specific impulse results. Shows the comparison of the analysed software packages for a 100 kg TNT charge at 25 m from the gauge block for a 100 mm cell size with identical domain size. (a) Full trace and (b) Zoomed. Summary table of peak overpressure and specific impulse for all packages – 100 kg at 25 m.
Absolute comparison
The live experimental data generated by the 92 kg Nitromethane charge are shown versus the simulated data in Figure 18. Here, it can be seen that the arrival time and shape of the real data are nominally matched to the simulated data in the positive phase. A significant difference is seen in the negative phase from the predictions, where the models do not reproduce the same secondary shock, but this is a different explosive and the effects of the domain size will also be influential here, as previously shown by Rigby and Sielicki (2015). A shorter positive phase duration for the Nitromethane charge is seen in Figure 18, and the higher maximum overpressure is seen in Figure 19. Overall, although a TNT charge would have provided more value, this gives the expected confidence in the modelling for the positive phase of the simulated data versus charge data from a similar explosive, with expected deviations due to the charge type, real-data measurement errors, etc. (Bedon et al., 2014). Blast software comparison with real data. Blast software comparison with real data focussing on peak pressures. Note the sharp overdrive peak generated by the vibration of the overpressure transducer creating an artificially high peak overpressure that is ignored (Skotak et al., 2018).
Ease of use
The ease of use of these programmes is subjective. Limited user knowledge is required to generate results in EMBlast and a working model could be constructed in a matter of minutes. There is then a sharp increase in the knowledge required to run any of the CFD packages. The user needs to understand domain and mesh sizes, boundary conditions, the use of primitive shapes or the import of CAD shapes, CPU threads or GPUs, equations of state, the remapping of data to different dimensions, and other parameters. These factors are most easily imported into ProSAir and Viper::Blast who’s GUIs make this relatively simple. As Autodyn has not been optimised for airblast calculations, its implementation is more challenging, taking a significantly longer time to learn and setup, creating more opportunities for user error. Generating a new model in Autodyn with different cell or domain sizes would take more than 5 min compared to less than a minute for the other software. Finally, blastFoam is the most customisable and complex, operating in Linux with a multi-text file interface. It took the author half a day to install and run the first tutorial and many days to learn and generate a 1D-2D-3D remapping model. Once up and running, altering basic simulation parameters such as domain or cell sizes is very fast, and the simulations simply batched to run consecutively, as they could also be in ProSAir and Autodyn.
Discussion on results
This article has compared the simulation software Autodyn, blastFoam, EMBlast, ProSAir, and Viper::Blast in two scenarios, a 100 kg charge at 25 m and a 15 kg change at 6 m from the same reflective surface. When considering the dimensions of the simulated space in CFD models, Section shows the importance of initially defining the area of interest of the overpressure time history. Reducing the domain size decreases the simulation time but increases the variation in the pressure time history. If only the positive phase is of interest, then its duration, the wave velocity and distance from the gauge to the domain wall can be used to calculate a domain size that can be used to still maintain consistency from data generated with much larger domains, certainly to an accuracy of peak overpressure and specific impulse of
A mesh sensitivity study was performed for each CFD programme as part of the run time experiments; see Section. This allowed a comparison of how cell size affects overpressure time histories for a similar range of cell sizes. Tables 7 and 10 show that the sensitivity of the mesh sizing results is significantly greater than the sensitivity of them to the domain size in all CFD packages, with variations up to 15% seen in the peak overpressure. The user’s choice of software will also affect their time-of-arrival predictions, which varies by up to 1.5 ms for the 100 kg simulations and 0.6 ms for the 15 kg one. Decreasing the cell size increases the resolution and sharpness of the initial shock wave arrival, leading to higher predicted values. This will probably also be the case for blastFoam, but there were insufficient runs that could be performed in the 12-h period to draw a definitive conclusion.
Comparison of run times for identical simulations across the CFD packages highlights a wide range of performance, with run times varying by a factor of up to 600. blastFoam is based on OpenFOAM, an open-source solver with a broad CFD capability; Autodyn is similarly not specifically written to solve air blast problems with its focus being on the simulation of large material deformations and failures, both are also CPU-based. The primary function of ProSAir and Viper::Blast is to simulate air blasts, and so have been highly optimised. Further to this, Viper::Blast is GPU based, modern GPUs operate hundreds of cores as opposed to typically less than 10 for a CPU. This allows for high data throughput and massive parallel computing, which can be ideally used in CFD simulations (Porter and Krishnamoorthy, 2022). These factors explain the relative performance seen with run times of the GPU based Viper::Blast up to 40 times faster than ProSAir, which itself is around 7 times faster than Autodyn, and 13 times blastFoam. Where run time is a factor for air blast studies, this large variation in performance would allow for rapid domain and cell size studies, leading to results that will have a finer resolution of the peak overpressure and a reduced chance of errors due to the size of the boundary.
EMBlast simulations took a matter of seconds and produced results that matched the optimised scenarios of the CFD software, but without having to perform domain or mesh studies. The programme is also very easy to set up and overall provides a very efficient way of generating overpressure time histories for simple scenarios such as those in this study. More complex situations are out of the scope of the EMBlast programme at this time.
Comparing the simulation outputs with the 100 kg charge data from the live experiment shows the agreement in the time of arrival and shape of the curve with the expected deviations due to the different type of charge and errors in collecting real overpressure data (Tang et al., 2018). Comparing the relative difference in the simulation predictions showed a variance in the 15 kg charge results of 50% and 15% for the peak overpressure and specific impulse range, respectively, compared to 14% and 13% for the 100 kg charge.
Conclusion
This paper presents a comparative study of five commercial software packages that can simulate the effects of high explosive detonations in the air and their impact on structures. The software packages are Autodyn, blastFoam, EMBlast, ProSAir, and Viper::Blast. The purpose of the study is to inform users about the potential accuracies and speeds of these software packages in far-field explosive prediction. Software packages are used to simulate the same two scenarios of spherical TNT charges (15 kg or 100 kg) detonated at different stand-offs (6 or 25 m, respectively) from a reflective target. The simulation parameters such as domain size, cell size, boundary conditions, gauge position, and explosive type are set identically for each software and follow the manufactures best practise setups. The simulation results are then critically compared and reviewed, both with each other and, for the 100 kg scenario, with experimental data from a live test.
The main findings of the study are: (1) There is a significant variation in the predicted peak overpressure and specific impulse across different software packages and cell sizes. For the 15 kg scenario, the maximum overpressure varies from 463 to 660 kPa, and the specific impulse varies from 755 to 869 kPa⋅ ms. For the 100 kg scenario, the peak overpressure varies from 83 to 95 kPa and the specific impulse varies from 487 to 549 kPa⋅ ms. (2) There is also a significant variation in run times for different software packages and all tested cell sizes. Viper::Blast is the fastest package by a large margin, followed by ProSAir, Autodyn, and blastFoam For the 15 kg scenario, Viper::Blast runs that take between 40 s and 2 min on blastFoam would take 2 to 6.5 h for the same cell sizes. (3) For the 100 kg scenario with a larger domain, Viper::Blast runs in less than 21 min for all cell sizes, where some of the other CFD packages would take over 12 h for their finest mesh. (4) The size of the domain affects the accuracy of the simulation results. The domain needs to be sufficiently large so that the expansion wave caused by the interaction of the shock wave with the domain wall reaches the simulated gauge after the required data have been captured. (5) The fast-running tool, EMBlast, provides very similar results to the CFD output that has been optimised for mesh and domain sizes, along with best-practice recommendations. It should be noted, though, that EMBlast and other fast-running tools have relatively very limited ranges of applicability, which is why they can be so fast for the simple problems they are designed for. (6) With Autodyn’s strong dependence on mesh size (Si et al., 2023) its results were an outlier in this study. (7) There is a very large range in user expertise and knowledge required to generate results from the fast-running Emblast to the highly customisable CFD tool blastFoam. (8) The choice of software package may have an impact on the blast resistant design of structures, as different packages produce different loading profiles and magnitudes. Users should be aware of the strengths and limitations of each package and choose the one that best fits their needs and objectives.
Footnotes
Acknowledgements
The author would like to express his thanks to the range team at DNV for collecting the experimental data, along with the authors of the software for their time and training.
Declaration of conflicting interests
The author(s) declared no potential conflicts of interest with respect to the research, authorship, and/or publication of this article.
Funding
The author(s) received no financial support for the research, authorship, and/or publication of this article.