
Abstract
A significant amount of scientific effort has been dedicated to measuring and understanding the effects of explosions, leading to the development of semi-empirical methods for rapid prediction of blast load parameters. The most well-known of these, termed the Kingery and Bulmash method, makes use of polylogarithmic curves derived from a compilation of medium to large scale experimental tests performed over many decades. However, there is still no general consensus on the accuracy and validity of this approach, despite some researchers reporting consistently high levels of agreement. Further, it is still not known whether blast loading can be considered deterministic, or whether it is intrinsically variable, the extent of this variability, and the range and scales over which these variations are observed. This article critically reviews historic and contemporary blast experiments, including newly generated arena tests with RDX and PETN-based explosives, with a view to demonstrating the accuracy with which blast load parameters can be predicted using semi-empirical approaches.
Introduction
There has been a considerable amount of scientific effort aimed at characterising and quantifying the fundamentals of explosive loading through extensive testing regimes, especially over the last 80 years. Despite similar experiments being conducted in the global research community, there is still no consensus on the general predictability of blast loading parameters. Whilst some researchers have concluded explosions to be inherently variable, to the extent that quantifying blast effects should always be done in a probabilistic sense, others maintain that they are essentially deterministic in nature. It is clear that this issue still casts great uncertainty over principles and practices for protecting civilian infrastructure against accidental and intentional explosions.
With developments in structural engineering comes a drive for improved efficiency and aesthetics in design, both of which may result in a reduction in the intrinsic robustness of a structure, thereby increasing the need for considered and holistic blast protection measures. Current design approaches for robustness typically make use of sophisticated computational fluid dynamics, evaluated on a threat-by-threat basis, which themselves require validation against experimental measurements. Clearly, if blast experiments are viewed as naturally varying, approximate, and even first-order in nature, then our ability to strenuously and rigorously validate numerical modelling approaches is hampered. This clearly has negative connotations for the use of modelling tools for design, and therefore it is important to fully understand the nature of blast parameter variability, and its dependence on extrinsic features such as experimental set up, control, and interpretation of data.
This article provides a detailed analysis of the explosive output from three high explosives, PE4 (nominally 88% RDX with 12% Plasticiser/Taggant), PE8 (nominally 86.5% RDX with 13.5% Plasticiser/Taggant) and PE10 (nominally 86% PETN with 14% Plasticiser/Taggant), and compares them against semi-empirical predictions and high-fidelity numerical modelling. The overall aim of this article is to demonstrate that far-field blast parameters
A review of historic and contemporary blast pressure measurements
The fundamental physical principles behind explosive events have been investigated across several decades, leading to a reasonable understanding of how explosive properties develop from the early stages of fireball breakout to far-field blast wave propagation. This scientific effort was expedited by the nuclear arms race, which began in the 1940s and initiated a critical need across the globe to better understand the effects of explosions with extremely large yields. The resulting research produced some of the more widely-regarded data sets which helped develop semi-empirical prediction tools for free-air blast scenarios (Kingery and Bulmash, 1984). This well-known method (hereafter referred to as the ‘KB method’) utilises polylogarithmic curves fitted to the compilation of both rudimentary numerical analysis results and experimental measurements ranging from medium to large scale events (<1 kg to > 400,000 kg). This has resulted in a widely accepted standard practice for predicting blast loads from a given explosive mass at a given distance from the target.
Figures 1(a) to (d) present experimental recordings from a variety of TNT charges masses, spherical and hemispherical in shape, recovered from 22 individual references dated between 1940 and 1980 (detailed in Appendix A) which have been scaled to an equivalent hemispherical shape and 1 kg mass to compare accordingly with KB predictions. During this time period, because of the threat of high yield explosive events, research in this field was heavily invested in, in order to acquire the knowledge needed to prepare civilian safety measures and establish the extent of infrastructure damage. Plotted alongside the data are the KB curves. Despite some anomalous results, the four positive phase parameters compare well with the KB curves and are fairly consistent across the entire range. It is worth noting that Kingery and Bulmash (1984) made use of some of the presented data in order to produce the predictive curves, so whilst this exercise is not a strictly fair comparison, it does highlight the general consistency of the measured blast parameters. Compiled blast parameters from TNT explosive trials with varying mass as a function of scaled distance, which has been scaled to a 1 kg equivalent hemispherical charge, using a shape scaling factor of 1.8 and compared with KB predictions: (a) Peak overpressure, (b) Scaled peak specific impulse, (c) Scaled arrival time, (d) Scaled positive phase duration.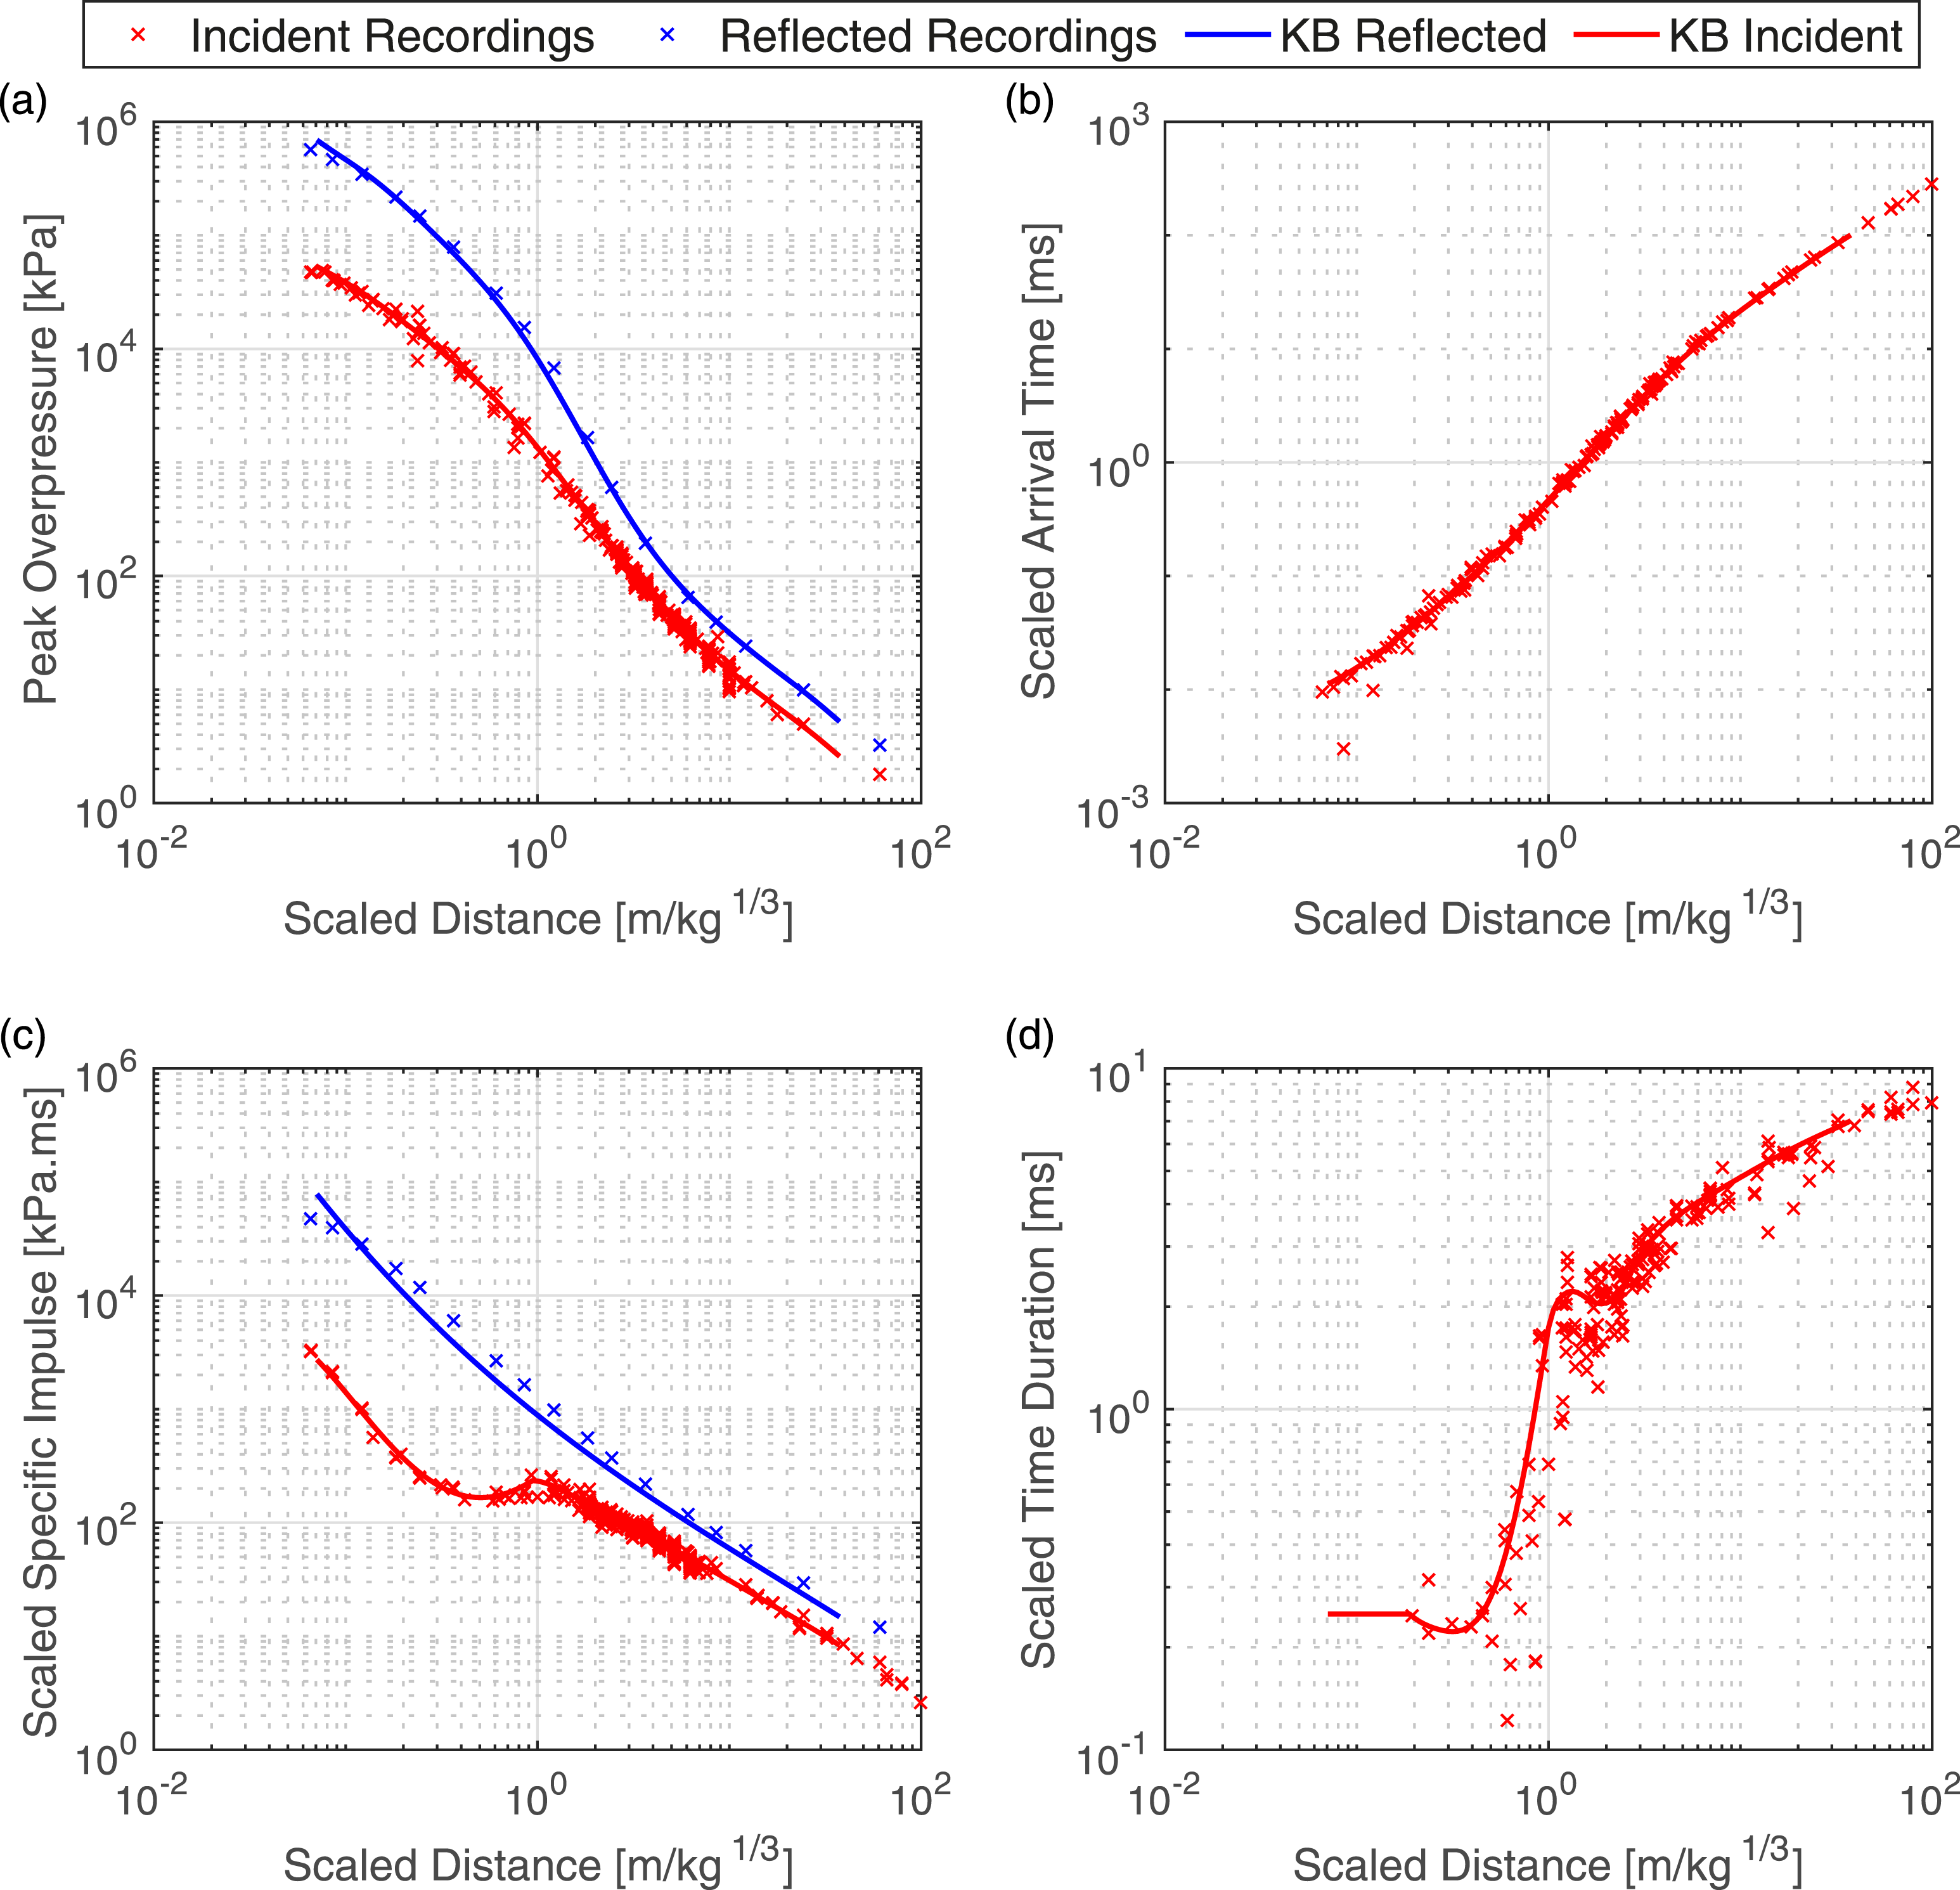
Figures 2(a) to (d) again present experimentally recorded blast parameters but from detonating Pentolite, another commonly used high explosive at the time, from a variety of masses of spherical and hemispherical charges, again scaled accordingly to be equivalent shape and size. The data presented has been extracted from six individual references, detailed in the Appendix A, and scaled to an equivalent TNT explosive using a TNTe = 1.2, in line with averaged figures evaluated by Shin et al. (2015) for both pressure and specific impulse in far-field scenarios. The consistency in this data is much the same as that presented in Figures 1(a) to (d) and holds good agreement with the KB predictions. It is important to note a collection of far-field incident pressure and specific impulse readings compare better to reflected which was detailed to be a feature of the experimental methodology developing Mach Stem features during these recordings (Goodman, 1960; Goodman and Giglio-Tos, 1978). These two extensive data sets provide reasonable evidence to support the hypothesis that explosive parameters are predictable for ideal high explosives. Compiled blast parameters from Pentolite explosive trials with varying mass as a function of scaled distance, which has been scaled to a 1 kg equivalent TNT hemispherical charge using a shape scaling factor of 1.8, and a TNTe = 1.2 (Shin et al. (2015)), comparing to KB predictions: (a) Peak overpressure, (b) Scaled peak specific impulse, (c) Scaled arrival time, (d) Scaled positive phase duration.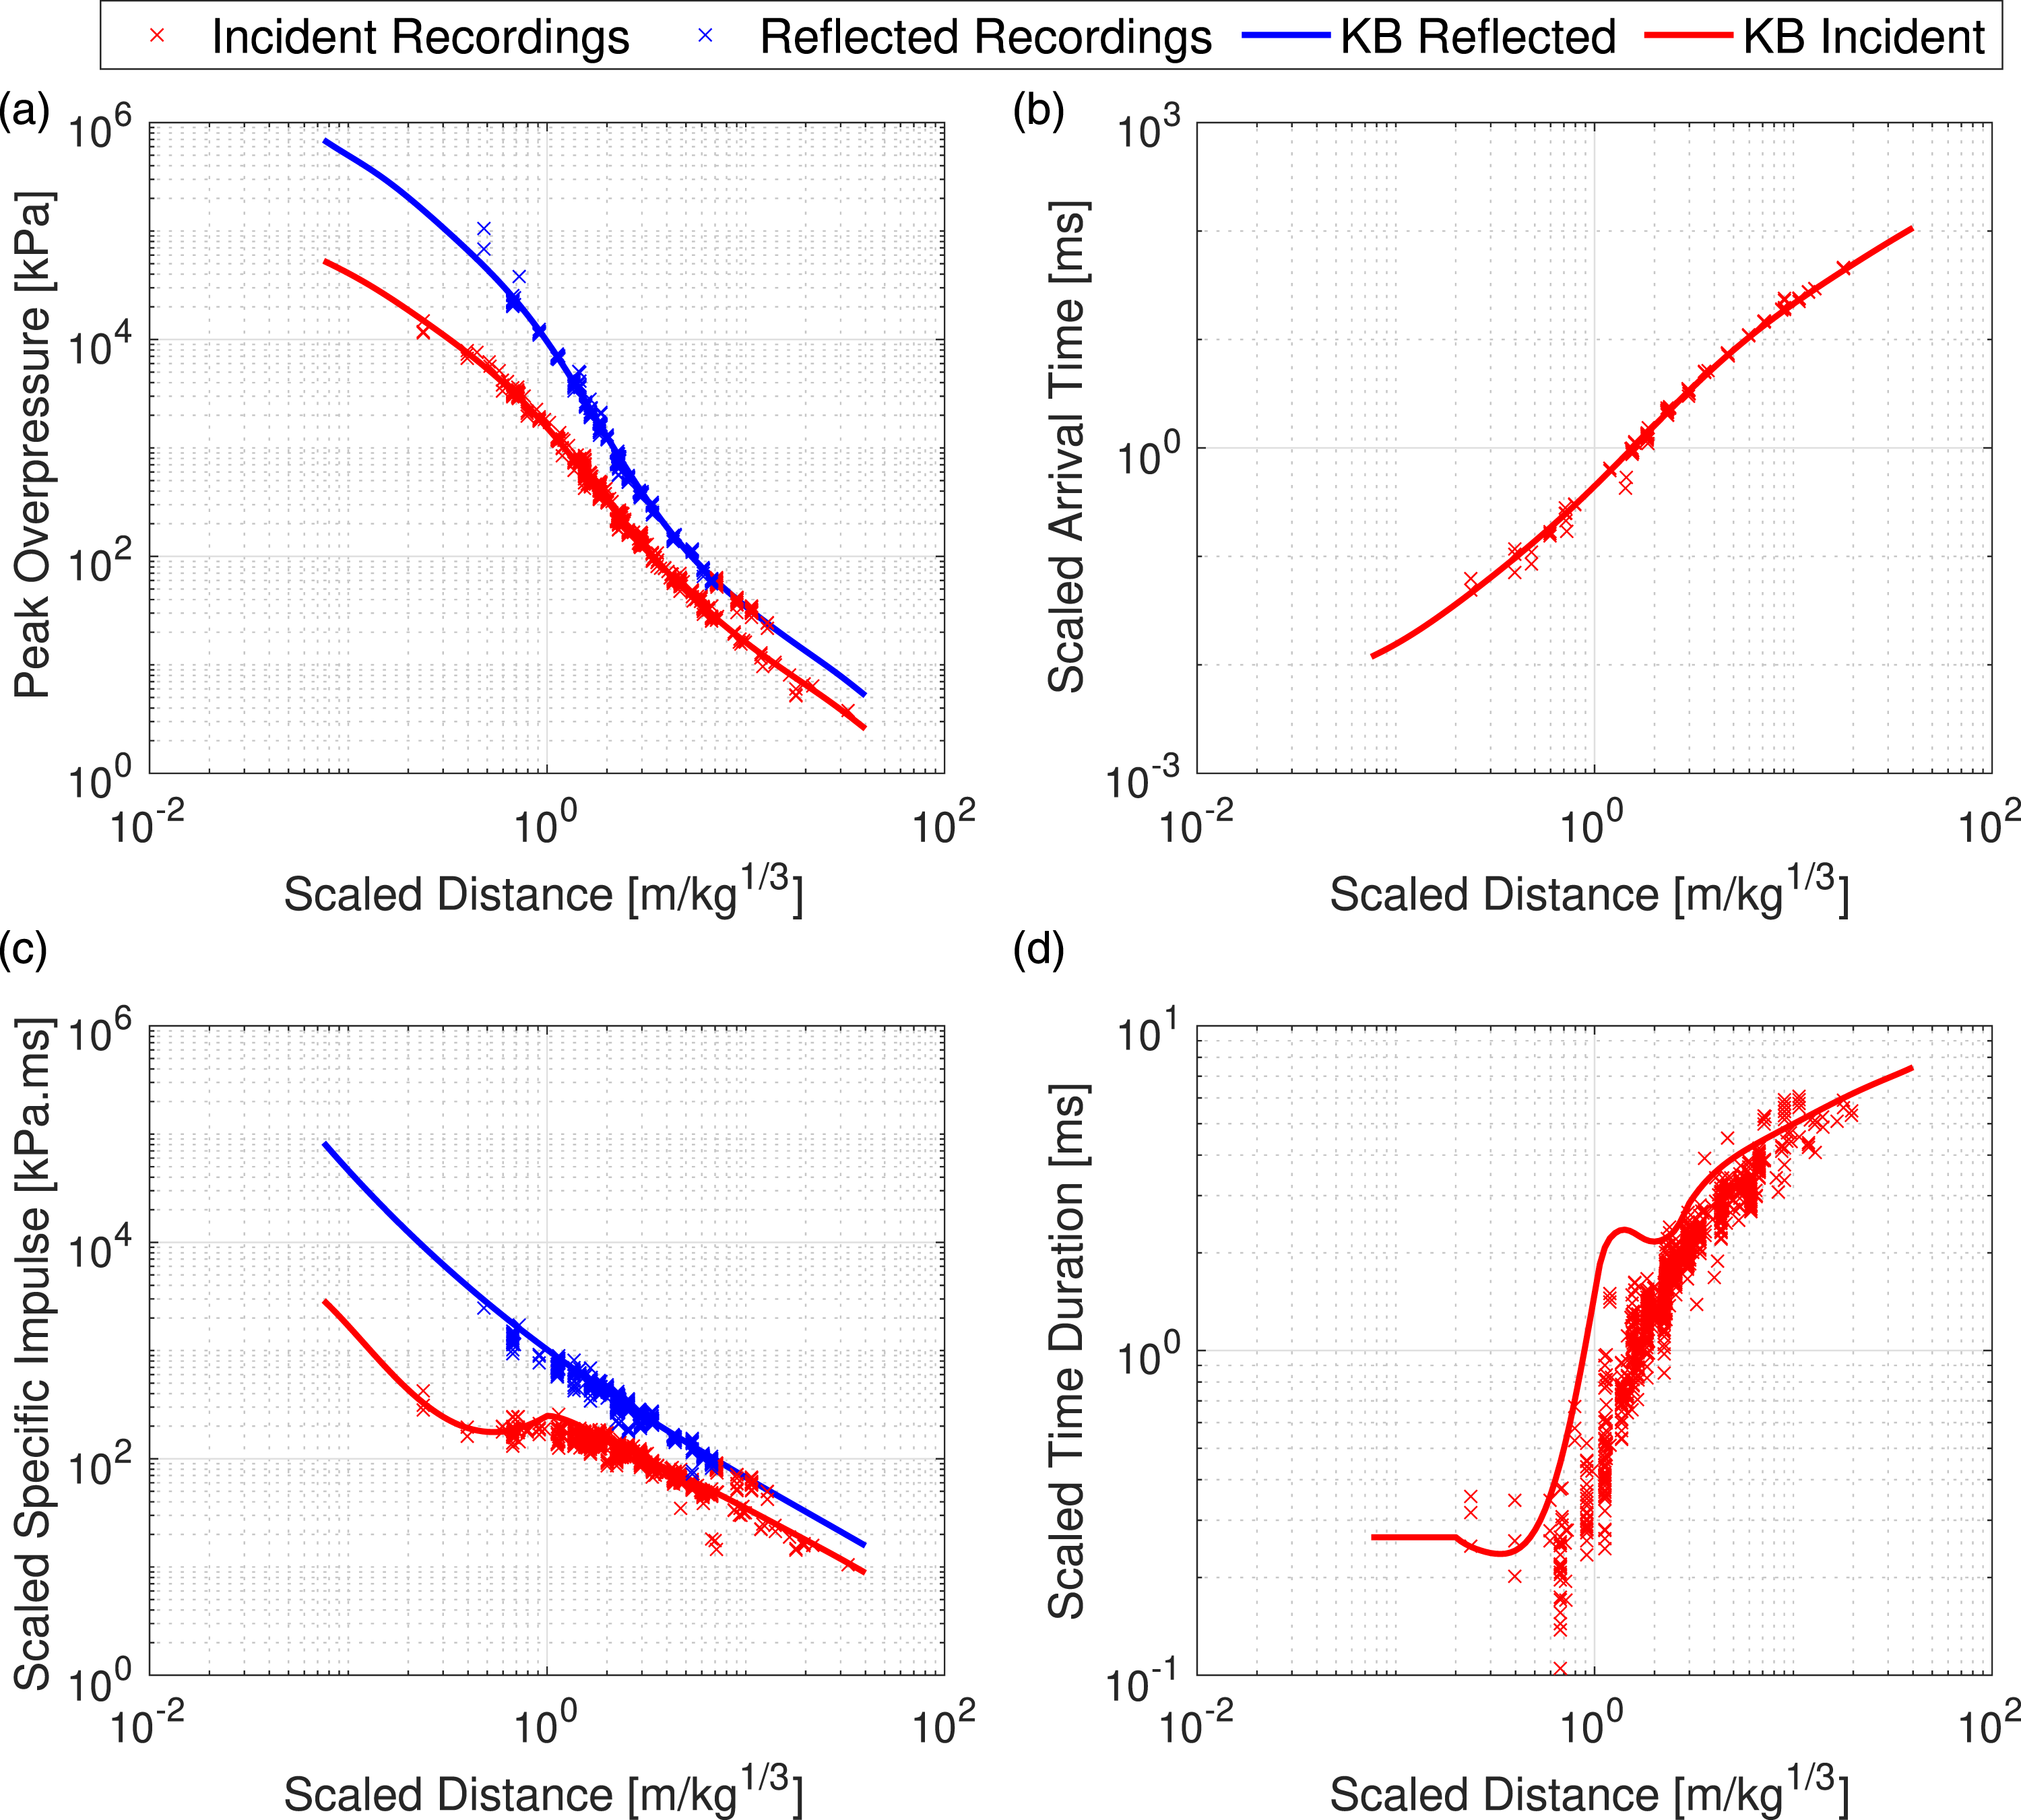
Despite this, the accuracy of the KB method has been questioned over recent years. Paradoxically, it would seem that with more modern and precise experimental procedures, the results should exhibit a reduction in uncertainty, however, many contemporary researchers have reported a significant lack of repeatability in experimental measurements when comparing directly to KB parameters and the much older data sets used to produce them.
Bogosian et al. (2002) utilised an extensive experimental database and compared it with KB predictions of similar explosives, with typical variations of between 70–150% and 50–130% for peak pressure and specific impulse, respectively, from nominally identical far-field (1 < Z < 40 m/kg1/3) tests. Similar levels of uncertainty have been found in related studies, with the general observation being a reduction in uncertainty as distance from the charge increases (Bogosian et al., 2014). Formby and Wharton (1996) explored the TNT equivalence of a variety of hemispherical secondary explosive compositions with the results demonstrating relatively high levels of variability: ±30% and ±15% for pressure and specific impulse, respectively, at large scaled distances, leading to a general impression that there will always be some degree of randomness in blast pressure measurements (Smith et al., 1999). Borenstein (2009) performed a sensitivity study of blast parameters taken from the 303 individual measurements discussed in Bogosian et al. (2002) and highlighted that these comprised of different explosive shapes, sizes and composition and were scaled to relate directly with TNT. The data were analysed collectively, resulting in quantification of a more extrinsic representation of blast parameter variability, which the authors seemingly incorrectly attributed to the inherent randomness of explosives.
Stoner and Bleakney (1948) reported that the data recorded from free-air tests, using a variety of charge shapes, sizes and compositions. When separated into nominally identical test groups and analysed, the results presented much lower levels of variability in pressure, between ±0.6 and 6.5%, again with the observation that variability reduced with an increase in scaled distance. Esparza (1986a, 1986b) presented blast parameter results from a variety of high explosive compositions when detonated with respect to mass-scaled distance. Despite not quantifying variability in the recordings, visually the data holds agreement with itself for nominally identical tests. Tang et al. (2017) also undertook a variety of incident and reflected scenario measurements from a range of PE4 masses formed into spherical and hemispherical charges which had similar magnitudes of variability quoted by Stoner and Bleakney (1948). This experimental data were compared against both KB predictions and hydrocode numerical simulator, Air3D, which presented reasonable levels of agreement for medium to large scale charges (Tang et al., 2018). Rickman and Murrell (2007) and Tyas et al. (2011) both presented well controlled small-scale experimental explosive testing recorded using pressure transducers which provided comparable results to KB predictions for normally reflected conditions at far-field scaled distances. Ohashi et al. (2001) made use of optical methods to record shock wave propagation of small-scale explosive tests with varying masses and converted radius-time data into incident pressure of a given shock wave using Rankine–Hugoniot jump conditions. The results of this analysis, when scaled, provided remarkably low variability both test-to-test and also compared well with KB predictions.
Rigby et al. (2014a) gave an in-depth literature review of articles which discuss experimental variability of far-field blast parameters and how they compare with the KB predictions. Systematic experimental and analytical errors are suggested to be the reason as to why such high levels of variability have been documented, rather than inherent randomness of explosive events. In an attempt to tackle systematic analytical variability, the authors used an exponential ‘Friedlander’ curve fitting method to determine blast parameters from each experimental trial in an unbiased manner. The results showed very good test-to-test consistency across the measured blast parameters (arrival time, reflected peak overpressure and reflected specific impulse) typically within a range of ±2.5% (arrival time) and ±6 −8% (pressure and impulse) of the mean values for each set of repeat tests. The recorded positive duration was the only parameter to exhibit higher levels of variability with all but one value achieving a ±9% range of the mean value. Positive phase duration typically exhibits higher levels of experimental spread due to the difficulty in determining when overpressure returns to zero when signal noise is present (Lyons, 2012). No signal will ever be perfectly noiseless, and therefore the positive phase duration will always carry an enhanced level of uncertainty. Errors or uncertainties in this parameter contribute very little to the overall loading, since a curve fit can always be tailored with a different decay parameter in order to match a prescribed specific impulse value. Hence, studying sources of uncertainty in positive phase duration are of lesser importance and will not be considered further. Chiquito et al. (2019) and Bogosian et al. (2019) both used similar methods of functional fitting curves to experimental data, and both presented results exhibiting enhanced consistency, reduced subjectivity and improved reliability of analysed blast data.
Farrimond et al. (2022) used two different data processing techniques to revisit the idea proposed by Stoner and Bleakney (1948) and Bogosian et al. (2014) that variability levels differ with scaled distance. The results of both analytical techniques provided enough evidence to suggest that as the near-field is approached, Z < 3 m/kg1/3, a much greater spread in the arrival time data, and thus other blast parameters, is observed which agreed with findings presented by Simoens and Lefebvre (2015). This not only provides evidence to the hypothesis of scaled distance regions over which fireball surface instabilities are prominent, as discussed by Tyas et al. (2016), Rae and McAfee (2018) and Rigby et al. (2020a), but when compared with other published works on blast variability starts to build a more robust understanding of the development of explosive shock fronts.
The aforementioned articles and resulting data presents a clear divide in the blast community in whether it is reasonable or not to accept free air far-field blast parameters as inherently variable, to the extent that they are difficult to characterise and quantify for a given explosive composition, shape and size. As stated by Borenstein (2009), there are clear reasons as to why extrinsic and intrinsic sources of variability should be considered: 1. The generalised real-world application of predicting explosive parameters which include safety factors and variability margins accounting for the unpredictability of explosive size, shape, composition and separation distance from a target (extrinsic). 2. The specific, scientific approach of assigning precise loading characteristics for a particular charge shape, size and composition and looking at how removing those as independent variables results in increased consistency (intrinsic).
This provides an important, but seemingly overlooked steer to the blast research community: in order to produce robust and reliable models that account for extrinsic variations in blast properties, we must better understand and be able to quantify intrinsic sources of variability. This is where well-controlled scientific testing can make significant contributions to our understanding of, and ability to predict, blast load parameters from known explosive sources.
Experimental setup
Test summary for shots documented within this article.
Data was recorded using piezo-resistive pressure gauges in the historic tests and current tests and were processed using the automated techniques described in Farrimond et al. (2022). Figure 3 shows the configuration of the far-field arena trials. General arrangement of the test pad at the University of Sheffield Blast and Impact Laboratory: Site photograph taken approximately from the location of the high speed video camera.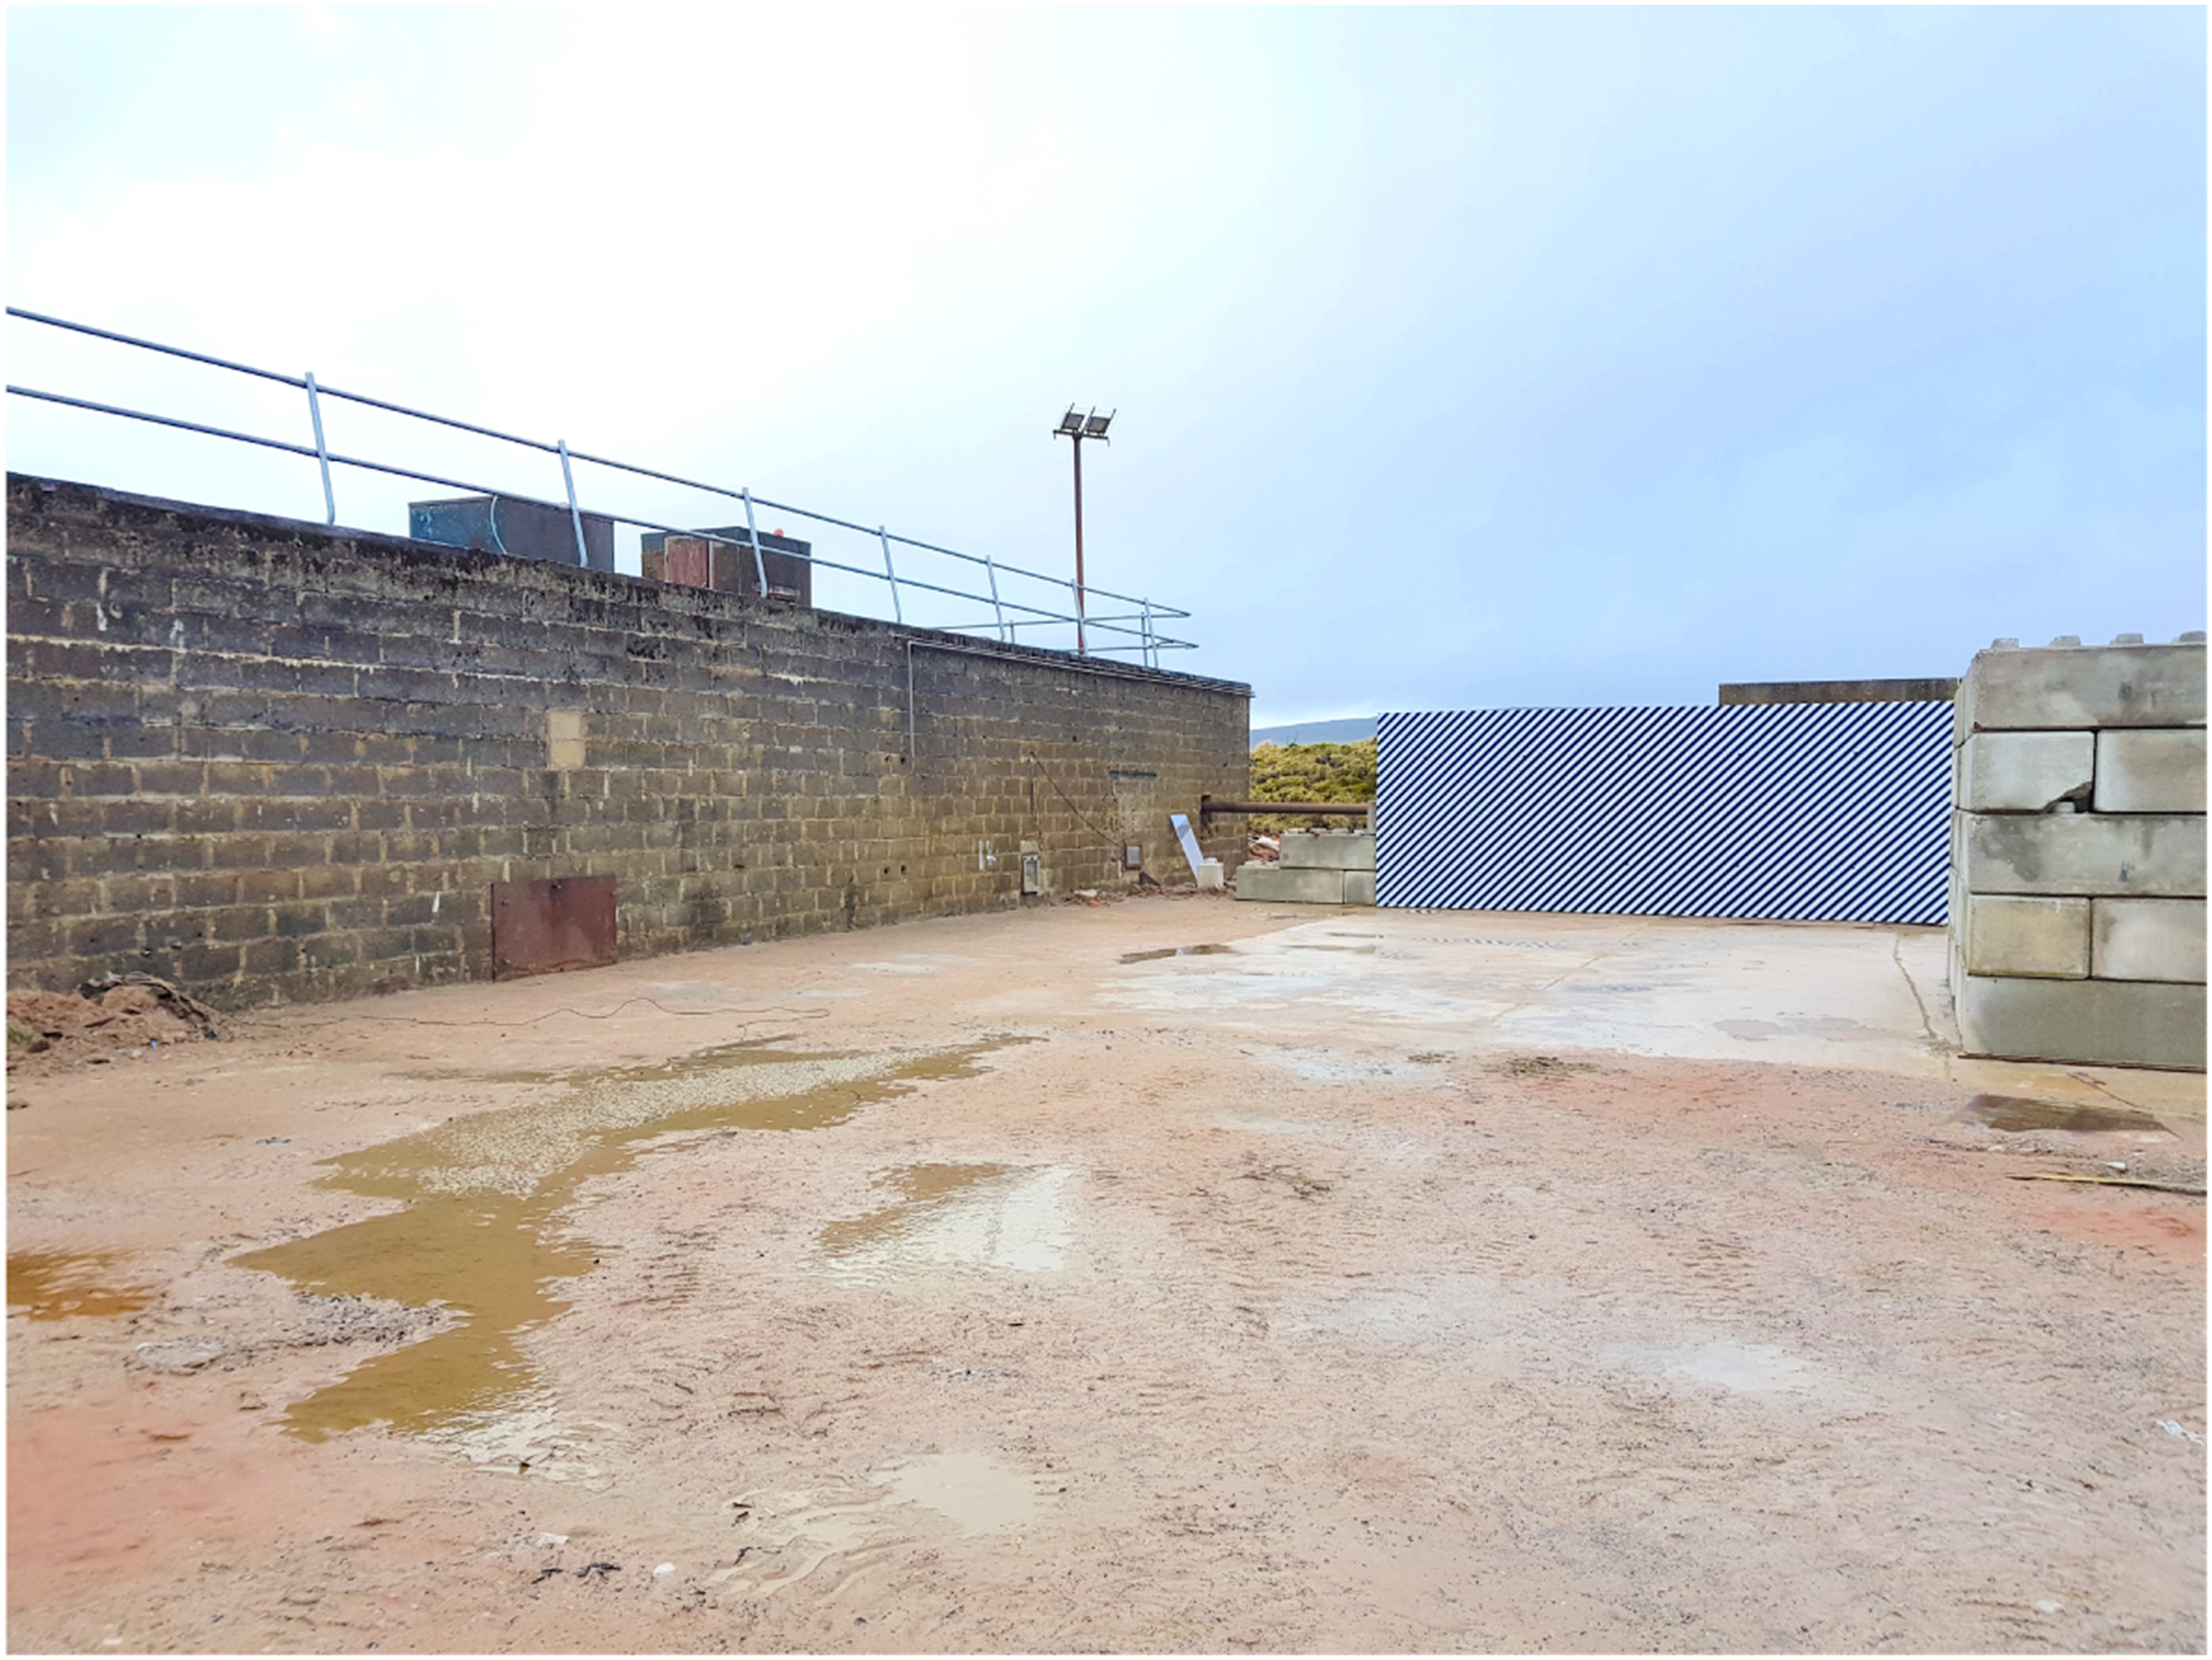
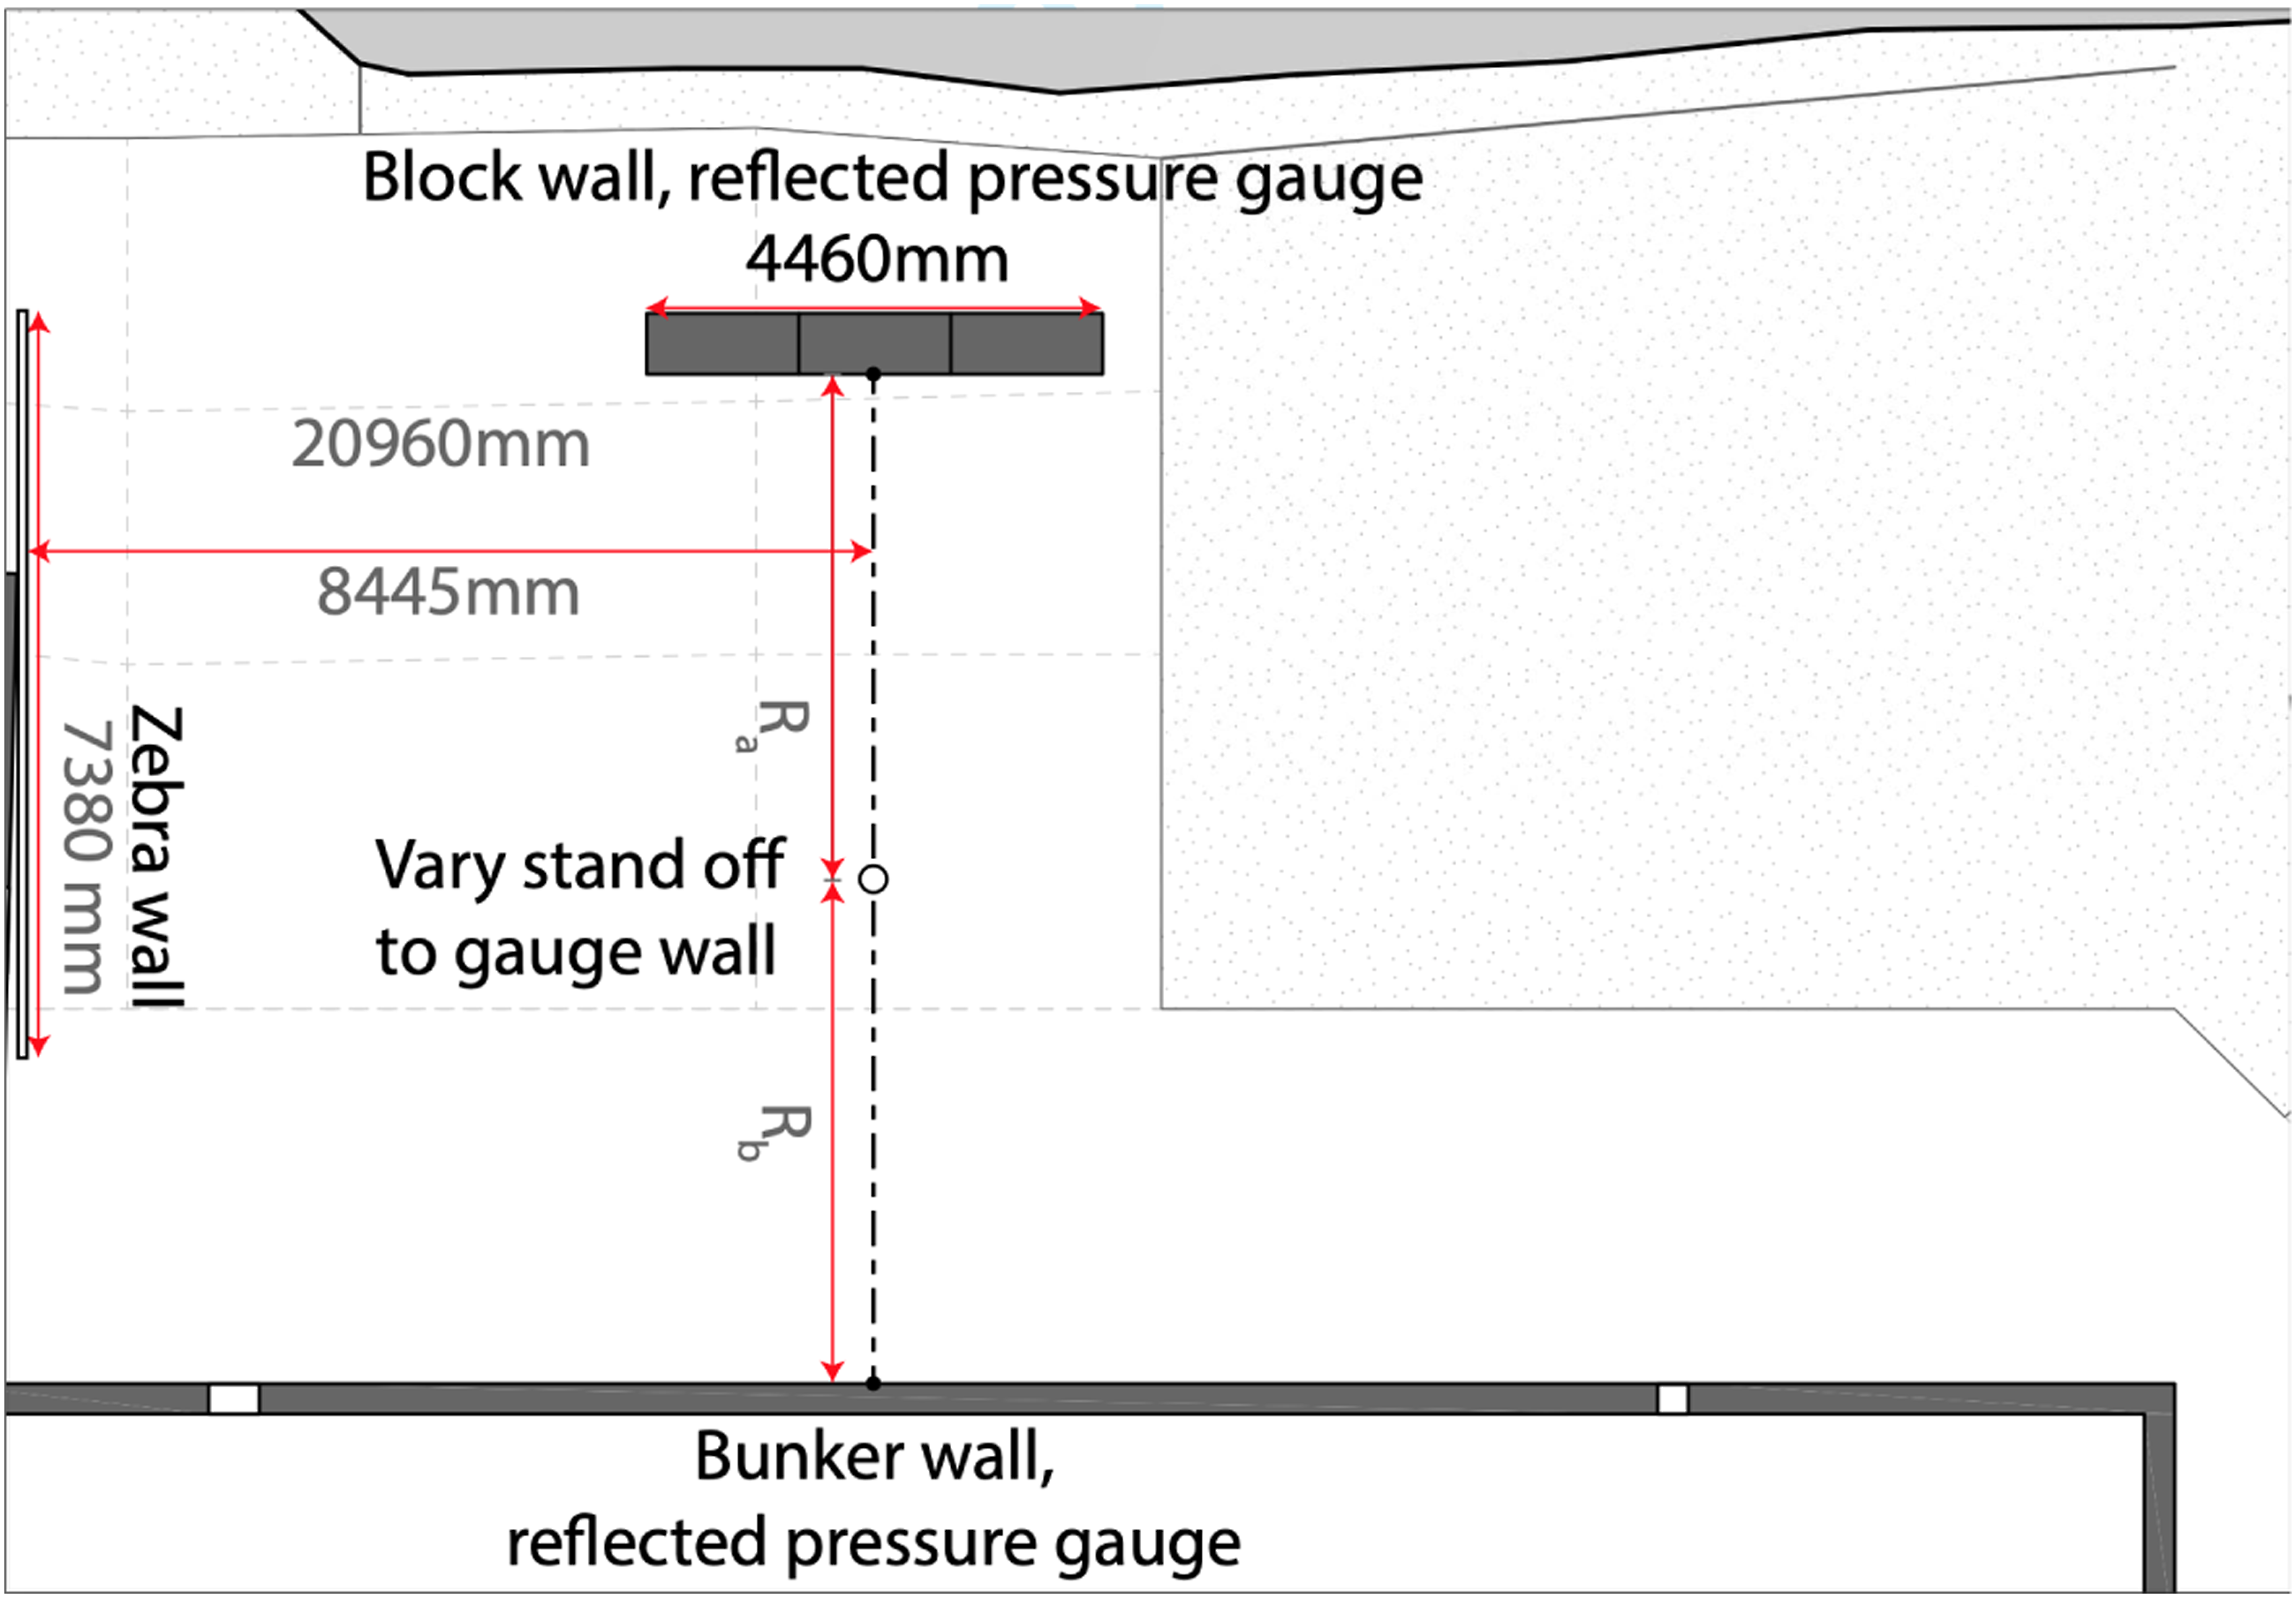
For each of the trials, hemispherical explosive charges, formed using a 3D-printed mould (see Figure 4), were surface detonated at varying stand-off distances, R
a
and R
b
in Figure 5, perpendicular to two rigid reflective surfaces in the form of a reinforced concrete bunker 4m in height) and a blockwork wall (2.2 m in height, 4.46 m in width), separated exactly 10.0 m apart. Kulite HKM-375 piezo-resistive pressure gauges were used to record the reflected pressure history in each test at both locations. The gauges were threaded through, and made flush to the surface of a small steel plate (approximately 110 × 150 × 10 mm) which was fixed to these walls. The plates were fixed to the two reflective surfaces, achieving a 10 mm height from the centre of gauge to the ground surface level to ensure pressures recorded were normal to the charge. The charges were placed on a small steel plate (150 × 150 × 25 mm) prior to detonation, in order to avoid repeated damage to the concrete testing pad. The pressure was recorded using a 16-bit digital oscilloscope and TiePie software, with a average sampling rate of 195 kHz at 16-bit resolution. The recording was triggered automatically using TiePie’s ‘out window’ signal trigger on a bespoke break-wire signal, formed by a wire wrapped around the detonator. The ‘out window’ trigger initiated with a voltage drop outside the normal electrical noise experienced in the break-wire. This coincides with the detonation of the charge breaking the circuit. Photographs of the moulding stages of a 250 g PE10 hemispherical charge in which the 3D printed mould is used to provide consistency in charge shape and density, which can be seen when removed from the casing. General arrangement of the test pad at the University of Sheffield Blast and Impact Laboratory.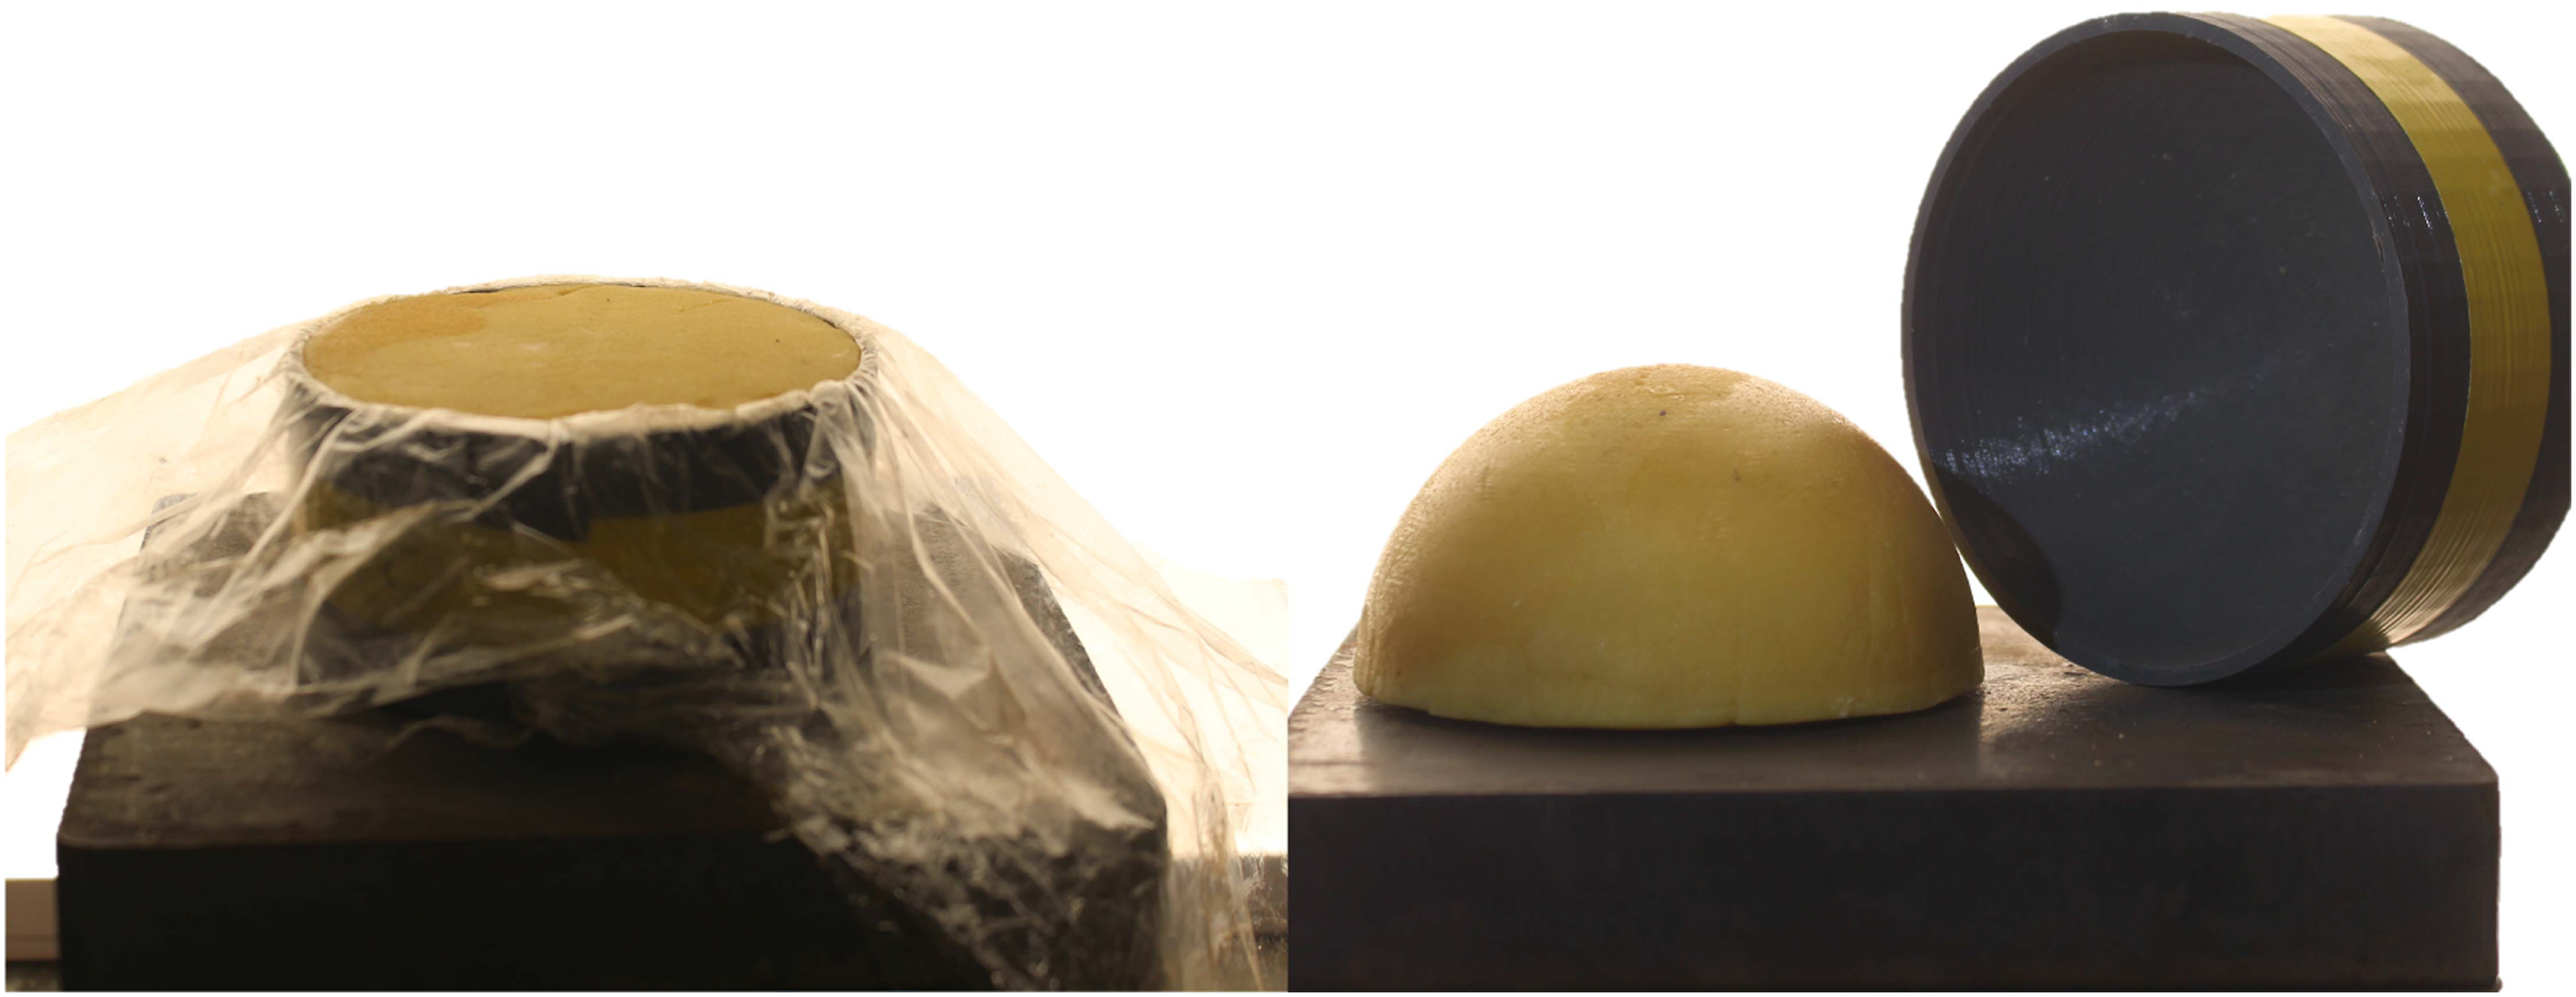
Reflected gauge results
Comparison of raw data from nominally identical tests
Prior to any analysis or scaling being applied to the data, it is important to establish how the raw recordings compare. Figure 6 displays a compilation of as-recorded positive phase pressure-time history profiles for 250 g hemispherical PE10 detonations at various stand-off distances from a single testing regime. Since pressure was recorded at two stand-off distances for each tests (2 m to the bunker wall and 8 m to the blockwork wall in test 1, 3 m to the bunker wall and 7 m to the blockwork wall in test 2, etc.), the results from different tests but identical stand-off distances can be compared. Qualitatively, each pair of results is in excellent agreement, with minimal variations in the blast pressure histories. The raw peak pressures at 2 m stand-off (Z ∼3 m/kg1/3) exhibits a higher level of variability when compared to the other pairings, which is in agreement with the working hypothesis of enhanced variability in the regions described by Tyas (2019), hypothesised to be due to Rayleigh-Taylor (1882; 1950) and Richymyer-Meshkov (1960; 1969) surface instabilities. Similar profiles and relationships between nominal tests are seen for both PE4 and PE8. Compilation of the entire raw data set of 250 g PE10 hemispherical ground burst comprising of two recordings at each scaled distance. Positive phase only.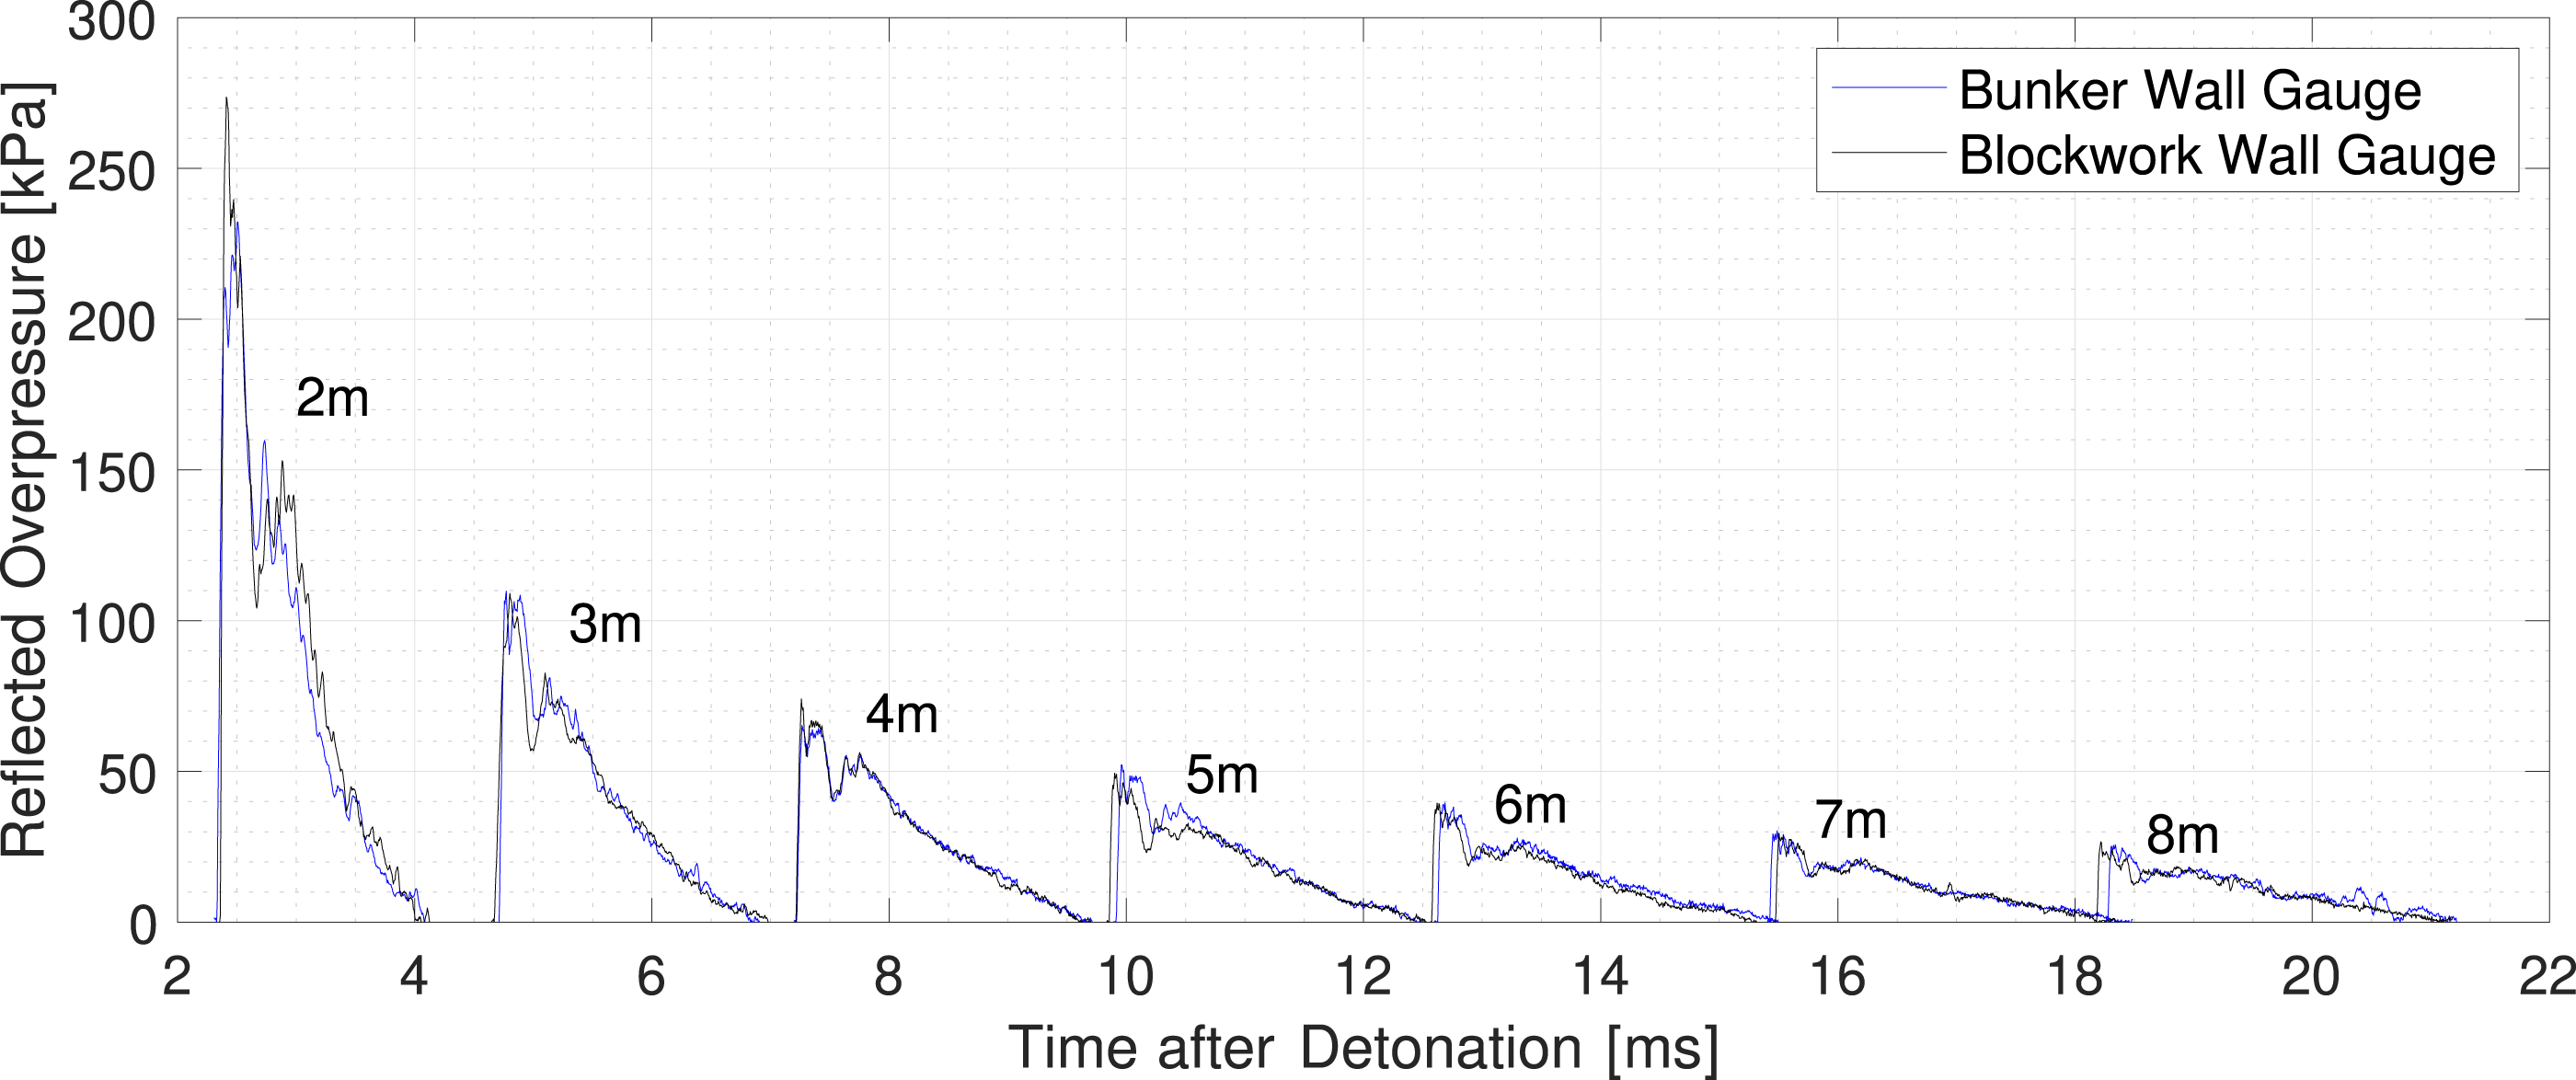
Curve-fitting analytical procedure
The pressure gauge data collected from these trials was processed using statistical curve fitting methods, initially proposed by Rigby et al. (2014b) and further developed and validated for use by Farrimond et al. (2022). The determination of the arrival time, t
a
, and positive phase duration, t
d
, were automatically assigned and then used in conjunction with the raw pressure-time data and equation (1), to output peak pressure, specific impulse and decay coefficients for a given test. Oscillations in the pressure signal experienced in the opening 0.5 ms (Figure 7(a)) are omitted from the fit. These were initially believed to be a feature of sensor ringing and electrical noise; however, numerical modelling (detailed later) has confirmed this to be in-part due to a physical effect Example historic test results using a 250 g PE4 hemispherical charge at 4 m stand-off with optimal fits overlain: (a) Reflected overpressure, and; (b) Reflected specific impulse.
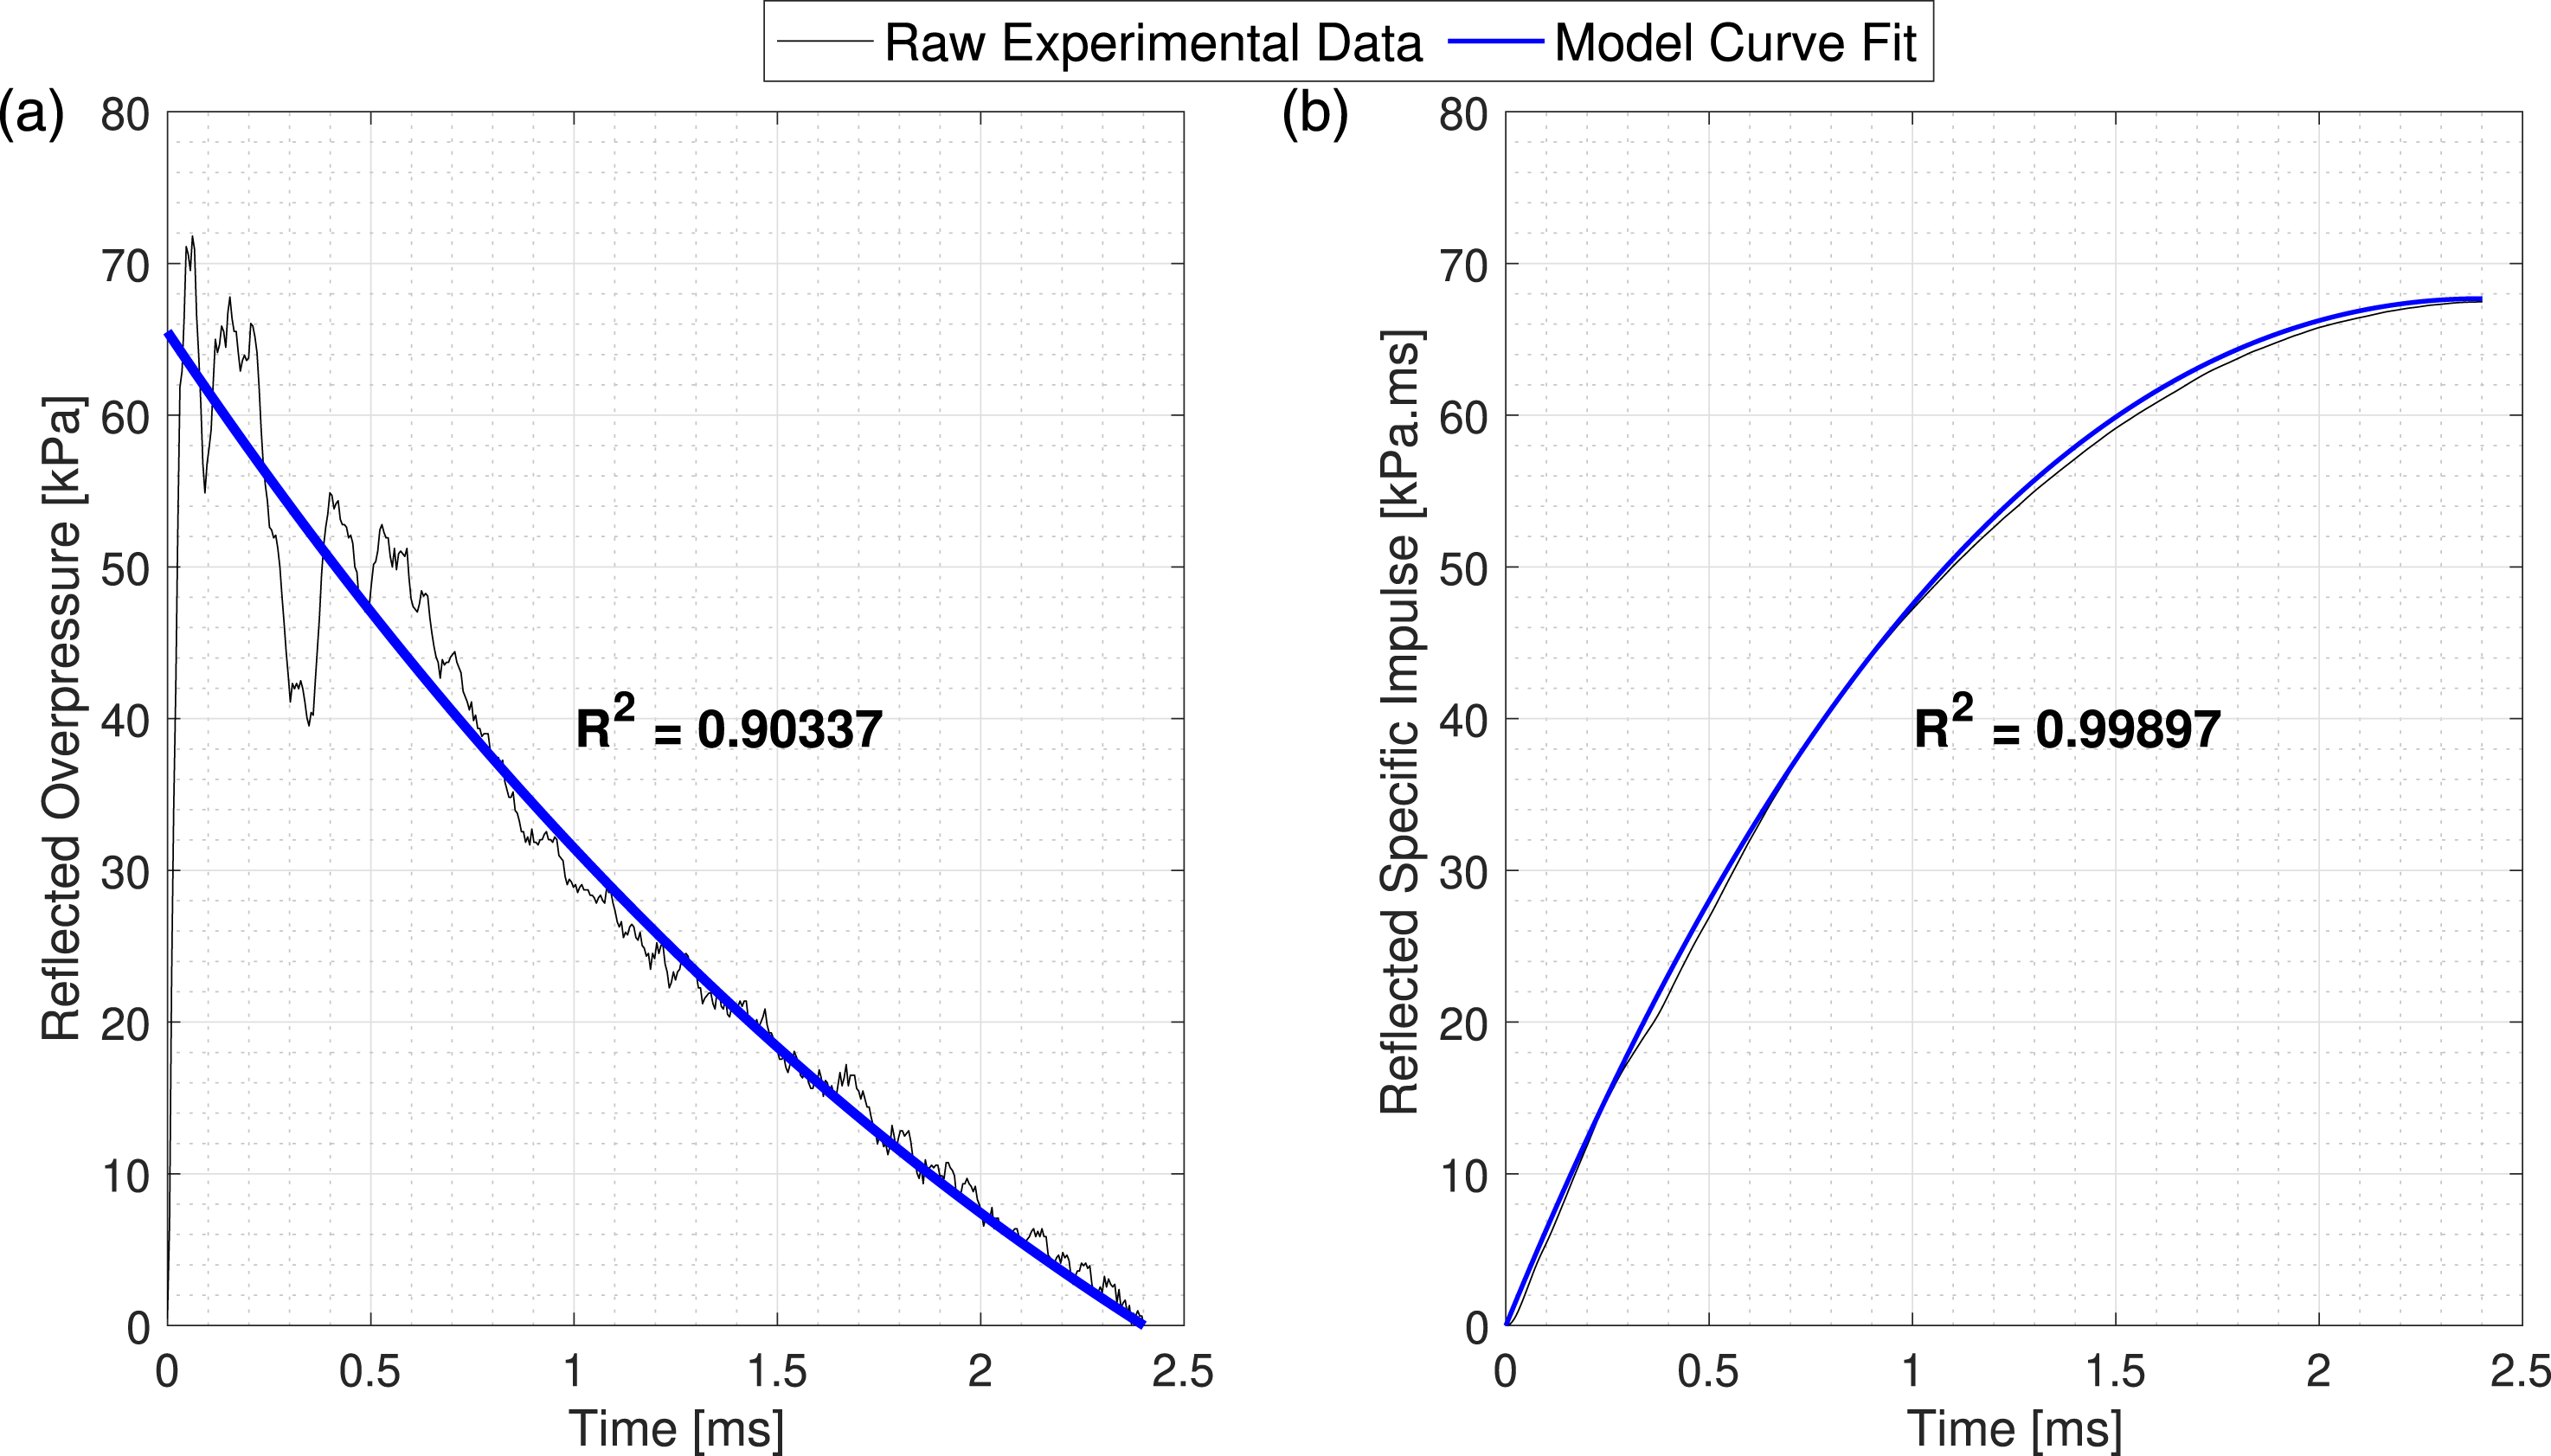
Figures 7(a) and 7(b) show the raw data from the example test (250 g PE4 hemisphere at 4 m stand-off), and the resulting modified Friedlander curve fits determined from the aforementioned automated process. The high coefficients of determination, R2, shown on each figure, indicate that the generalised model fits compare well to the raw data and therefore can be used with confidence to provide robust and accurate representations of the recorded pressure histories. It is worth reiterating that although Figures 7(a) and 7(b) present optimal fits from a single given test evaluated from a large number of different potential fits. These fits were checked and any potential outliers from the general data set were revisited and manually analysed.
Processed blast parameter variability
Comparison against mean values
The compiled data set for all three explosives is presented here against scaled distance in order to comment on whether variability is seen to reduce with increasing scaled distance. Each positive phase blast parameter has been normalised against the mean value of each blast parameter at that scaled distance, for each set of trials with comparable experimental criteria (i.e. stand-off, charge mass, shape and composition), as in Figures 8(a) to (d). Compiled blast parameters from RDX and PETN based explosive trials as a function scaled distance, normalised against the mean of nominally identical trials: (a) Peak reflected overpressure (Mean-Normalised P
r
), (b) Scaled reflected peak specific impulse (Mean-Normalised I
r
), (c) Scaled arrival time (Mean-Normalised t
a
), (d) Scaled positive phase duration (Mean-Normalised t
d
).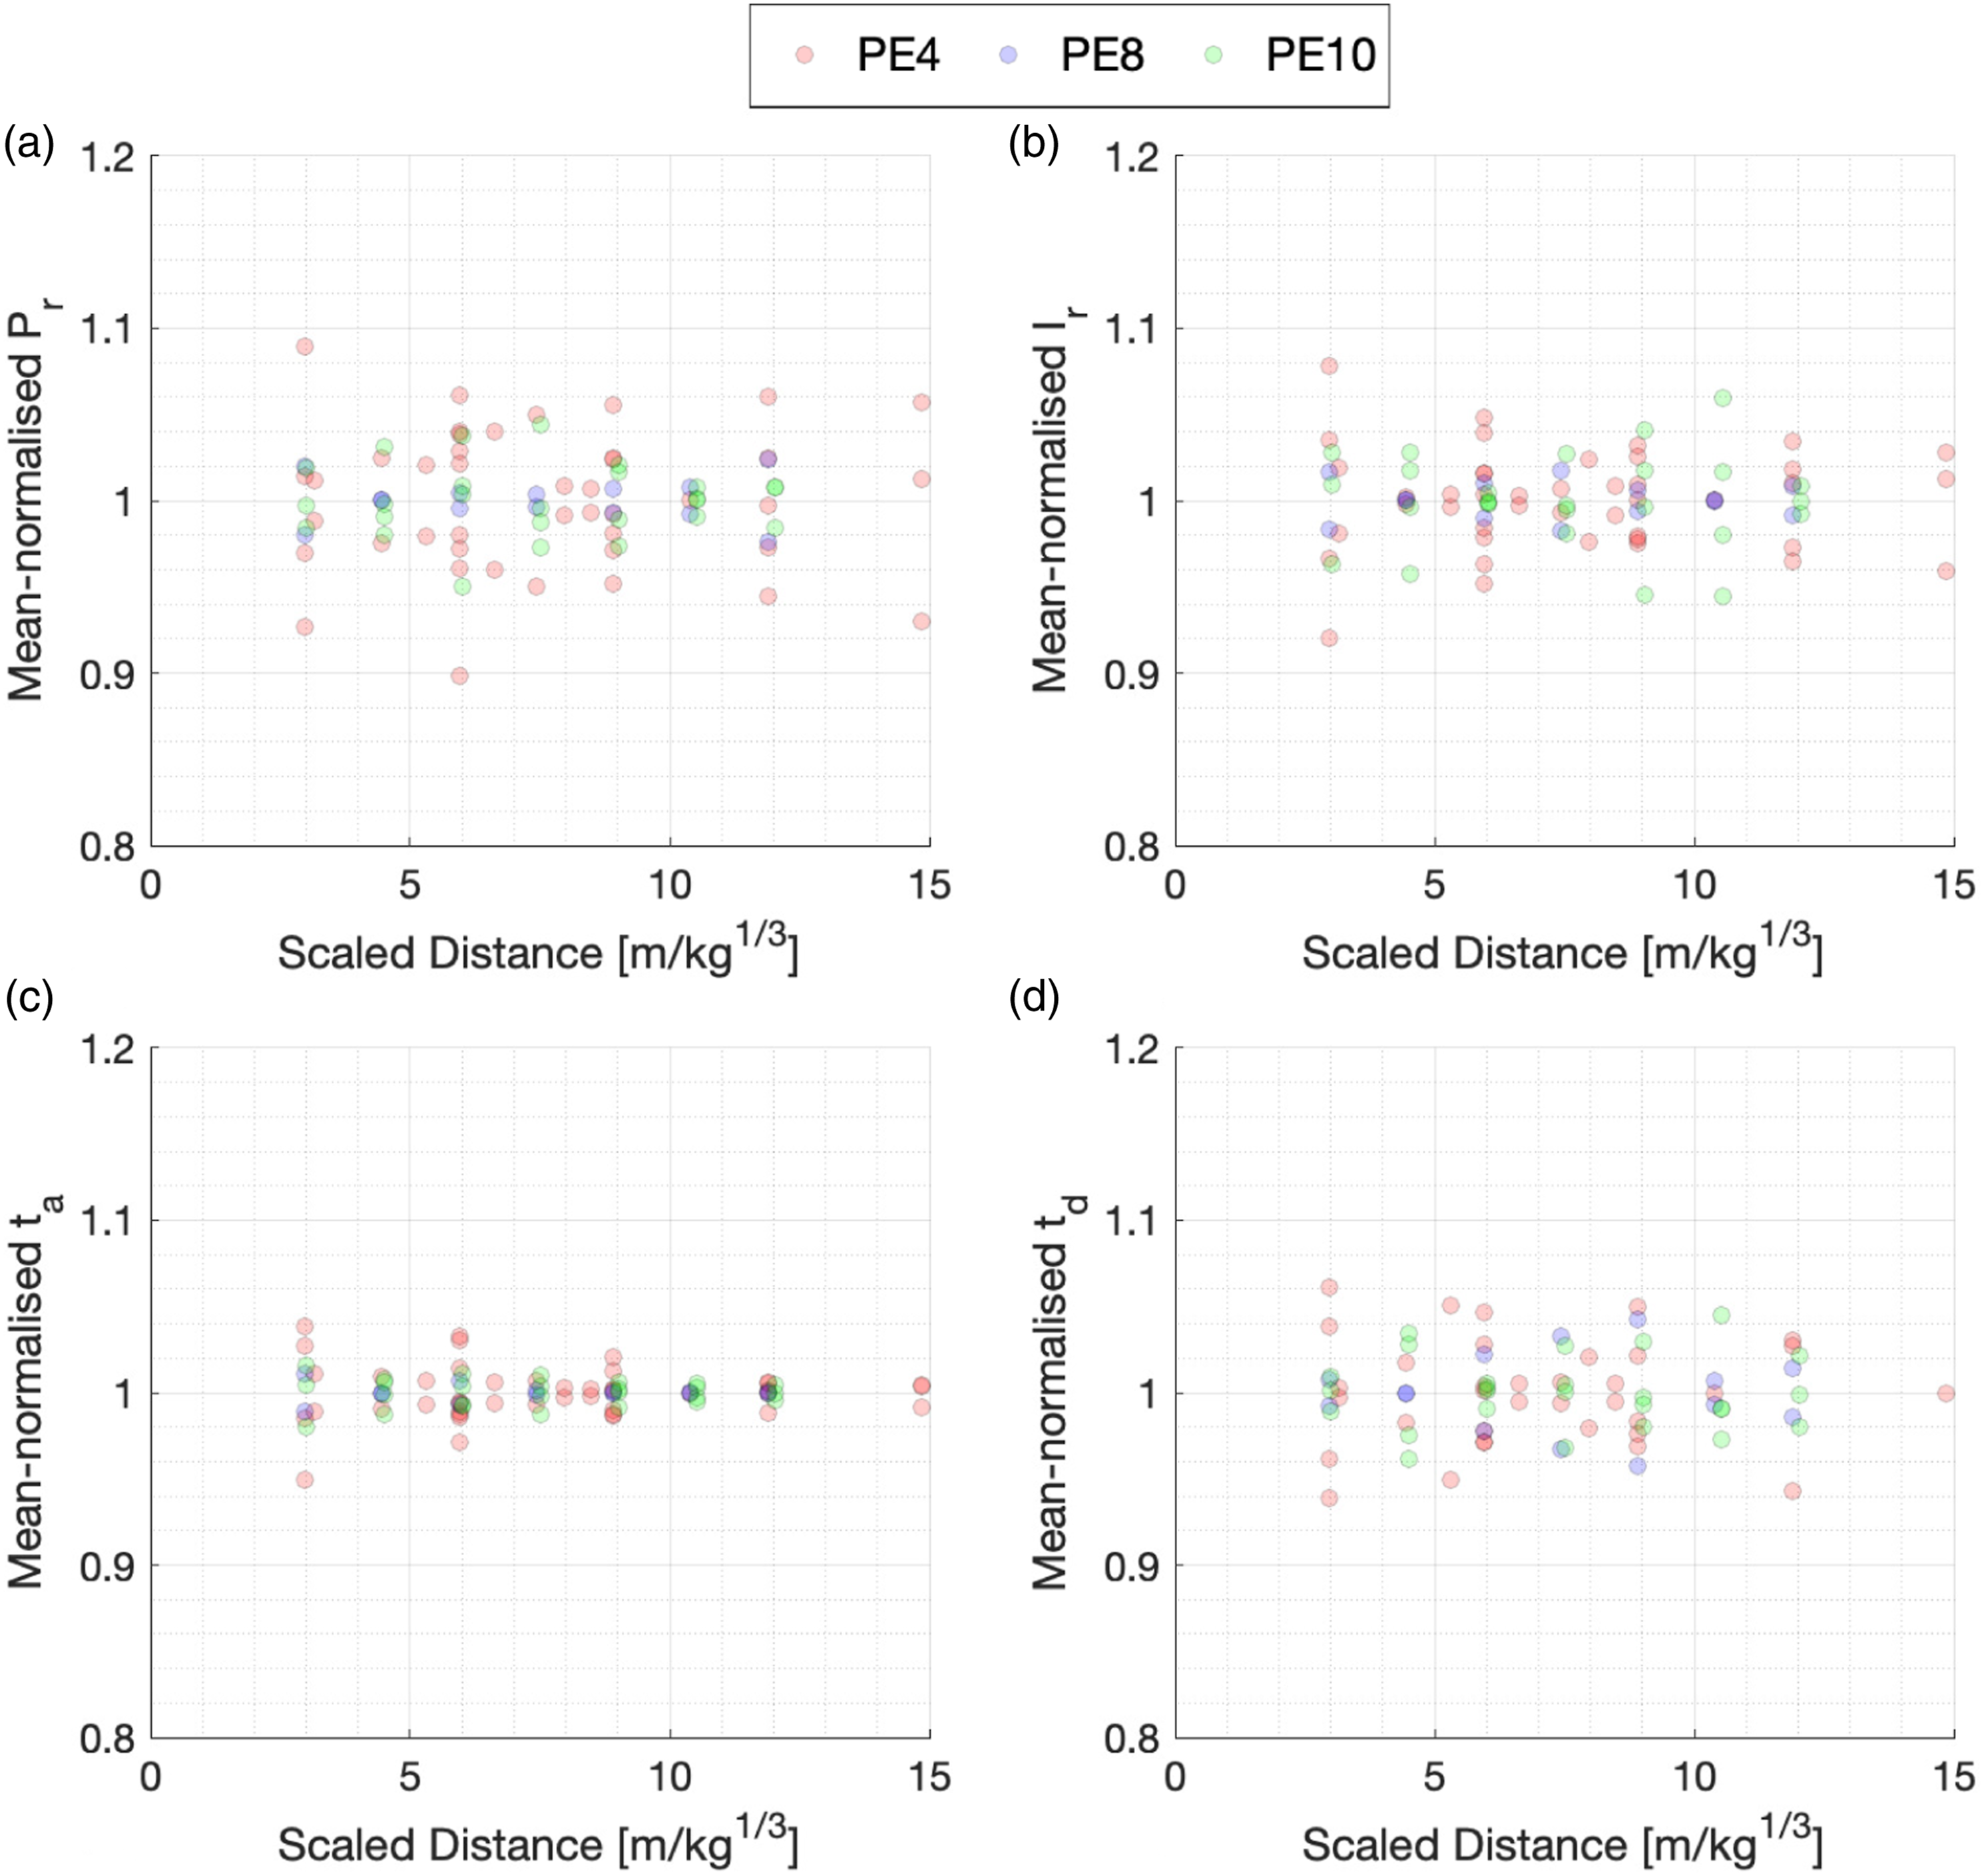
There is a notably high level of repeatability in the experimentally recorded blast parameters. Reflected peak pressure, peak specific impulse and positive phase duration exhibit similar levels of spread across the entire range of scale distances tested; typically around ±6–8%, with a slight reduction in consistency as scaled distance reduces. The arrival time of the shock wave exhibits a considerably smaller spread Rigby (2021), again with a noticeable increase in variability as scaled distances reduces. In the far-field, Z > 3 m/kg1/3, the results are typically within ±2%. The consistency of the experimental results presents a clear indication that for small-scale, far-field, geometrically simple scenarios, the blast parameters are essentially deterministic with quantifiable but limited levels of variability. Despite only a few data points at each scaled distance, there seems to be a clear reduction in variability as scaled distance increases, which holds true for all three explosive types.
Comparison against semi-empirical predictions
A Mean Absolute Error (MAE) analysis was undertaken between the results from each explosive and those predicted for varying quantities of TNT to establish an equivalence value. The positive phase duration tends to hold higher levels of variability due to the difficulty in assigning a specific value to the parameter due to noise in the signal making the true point at which conditions return briefly back to atmospheric difficult to determine. Thus, positive phase duration has been omitted from the MAE analysis. The analysis was performed for Z > 3m/kg1/3, in light of comments on variability above. It was found through an averaging the MAE values for pressure, specific impulse and arrival time at all far-field scaled distances that the three explosives tested all resulted in very similar TNT equivalency factors with PE4 and PE10 resulting in an equivalence of 1.22 and PE8 resulting in an equivalence of 1.24. These factors were applied to each of the recorded blast parameters and are presented in Figures 9(a) to (d) which show a striking agreement between each experimentally recorded blast parameter (expressed as a TNT equivalent mass), and the KB predictions, for all three explosives in the far-field. Compiled blast parameters from RDX and PETN based explosive trials as a function scaled distance, compared with KB predictions: (a) Peak reflected overpressure, (b) Scaled reflected peak specific impulse, (c) Scaled arrival time, (d) Scaled positive phase duration.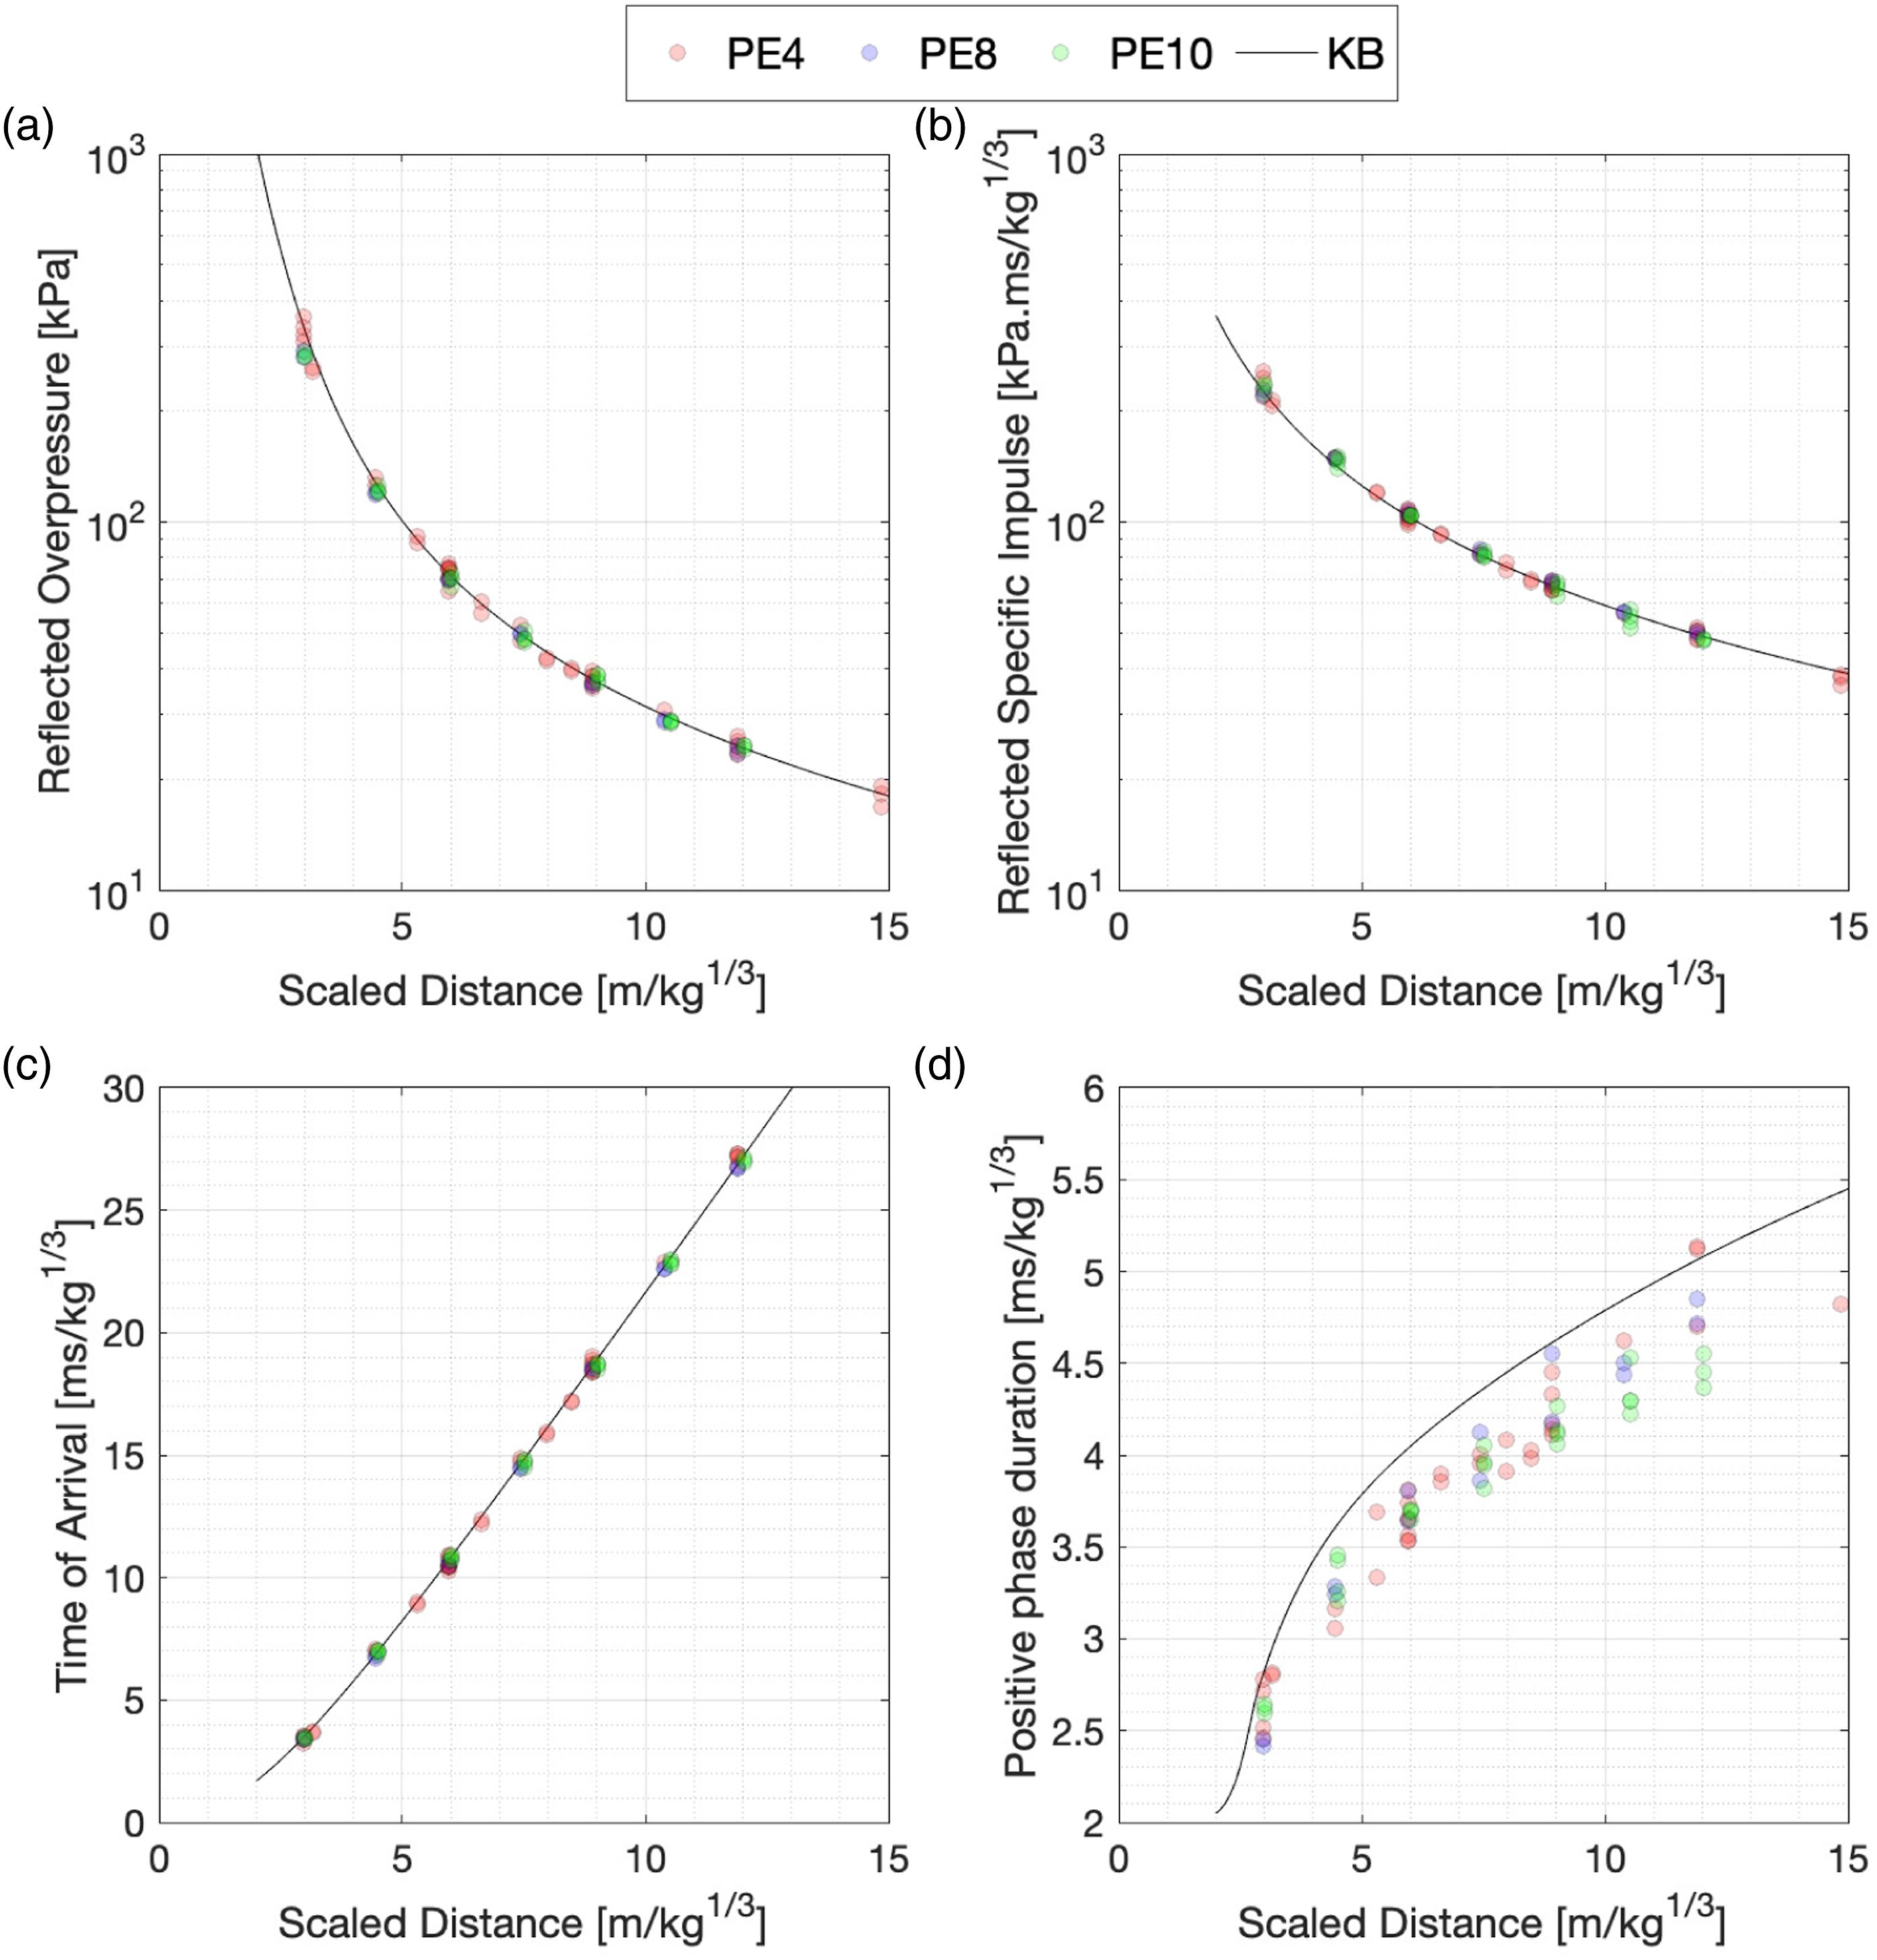
In order to establish specific levels of variability that the scaled experimental recordings had in comparison to KB predictions, a similar approach was adopted in which experimental recordings were normalised by the KB prediction of the parameter in question, at each scaled distance for which data was available. Figures 10(a) to (d) present the results of the KB normalisation, which shows that for far-field loading in simple geometrical scenarios, existing semi-empirical predictions are in fact remarkably accurate and compare well to experimental data. This suggests that semi-empirical methods can be used with confidence as a first-order approach for quantifying the blast load conditions from a small-scale high explosive in far-field situations. Compiled blast parameters from RDX and PETN based explosive trials as a function scaled distance, normalised against KB predictions for nominally identical trials: (a) Peak reflected overpressure (KB-Normalised P
r
), (b) Scaled reflected peak specific impulse (KB-Normalised I
r
), (c) Scaled arrival time (KB-Normalised t
a
), (d) Scaled positive phase duration (KB-Normalised t
d
).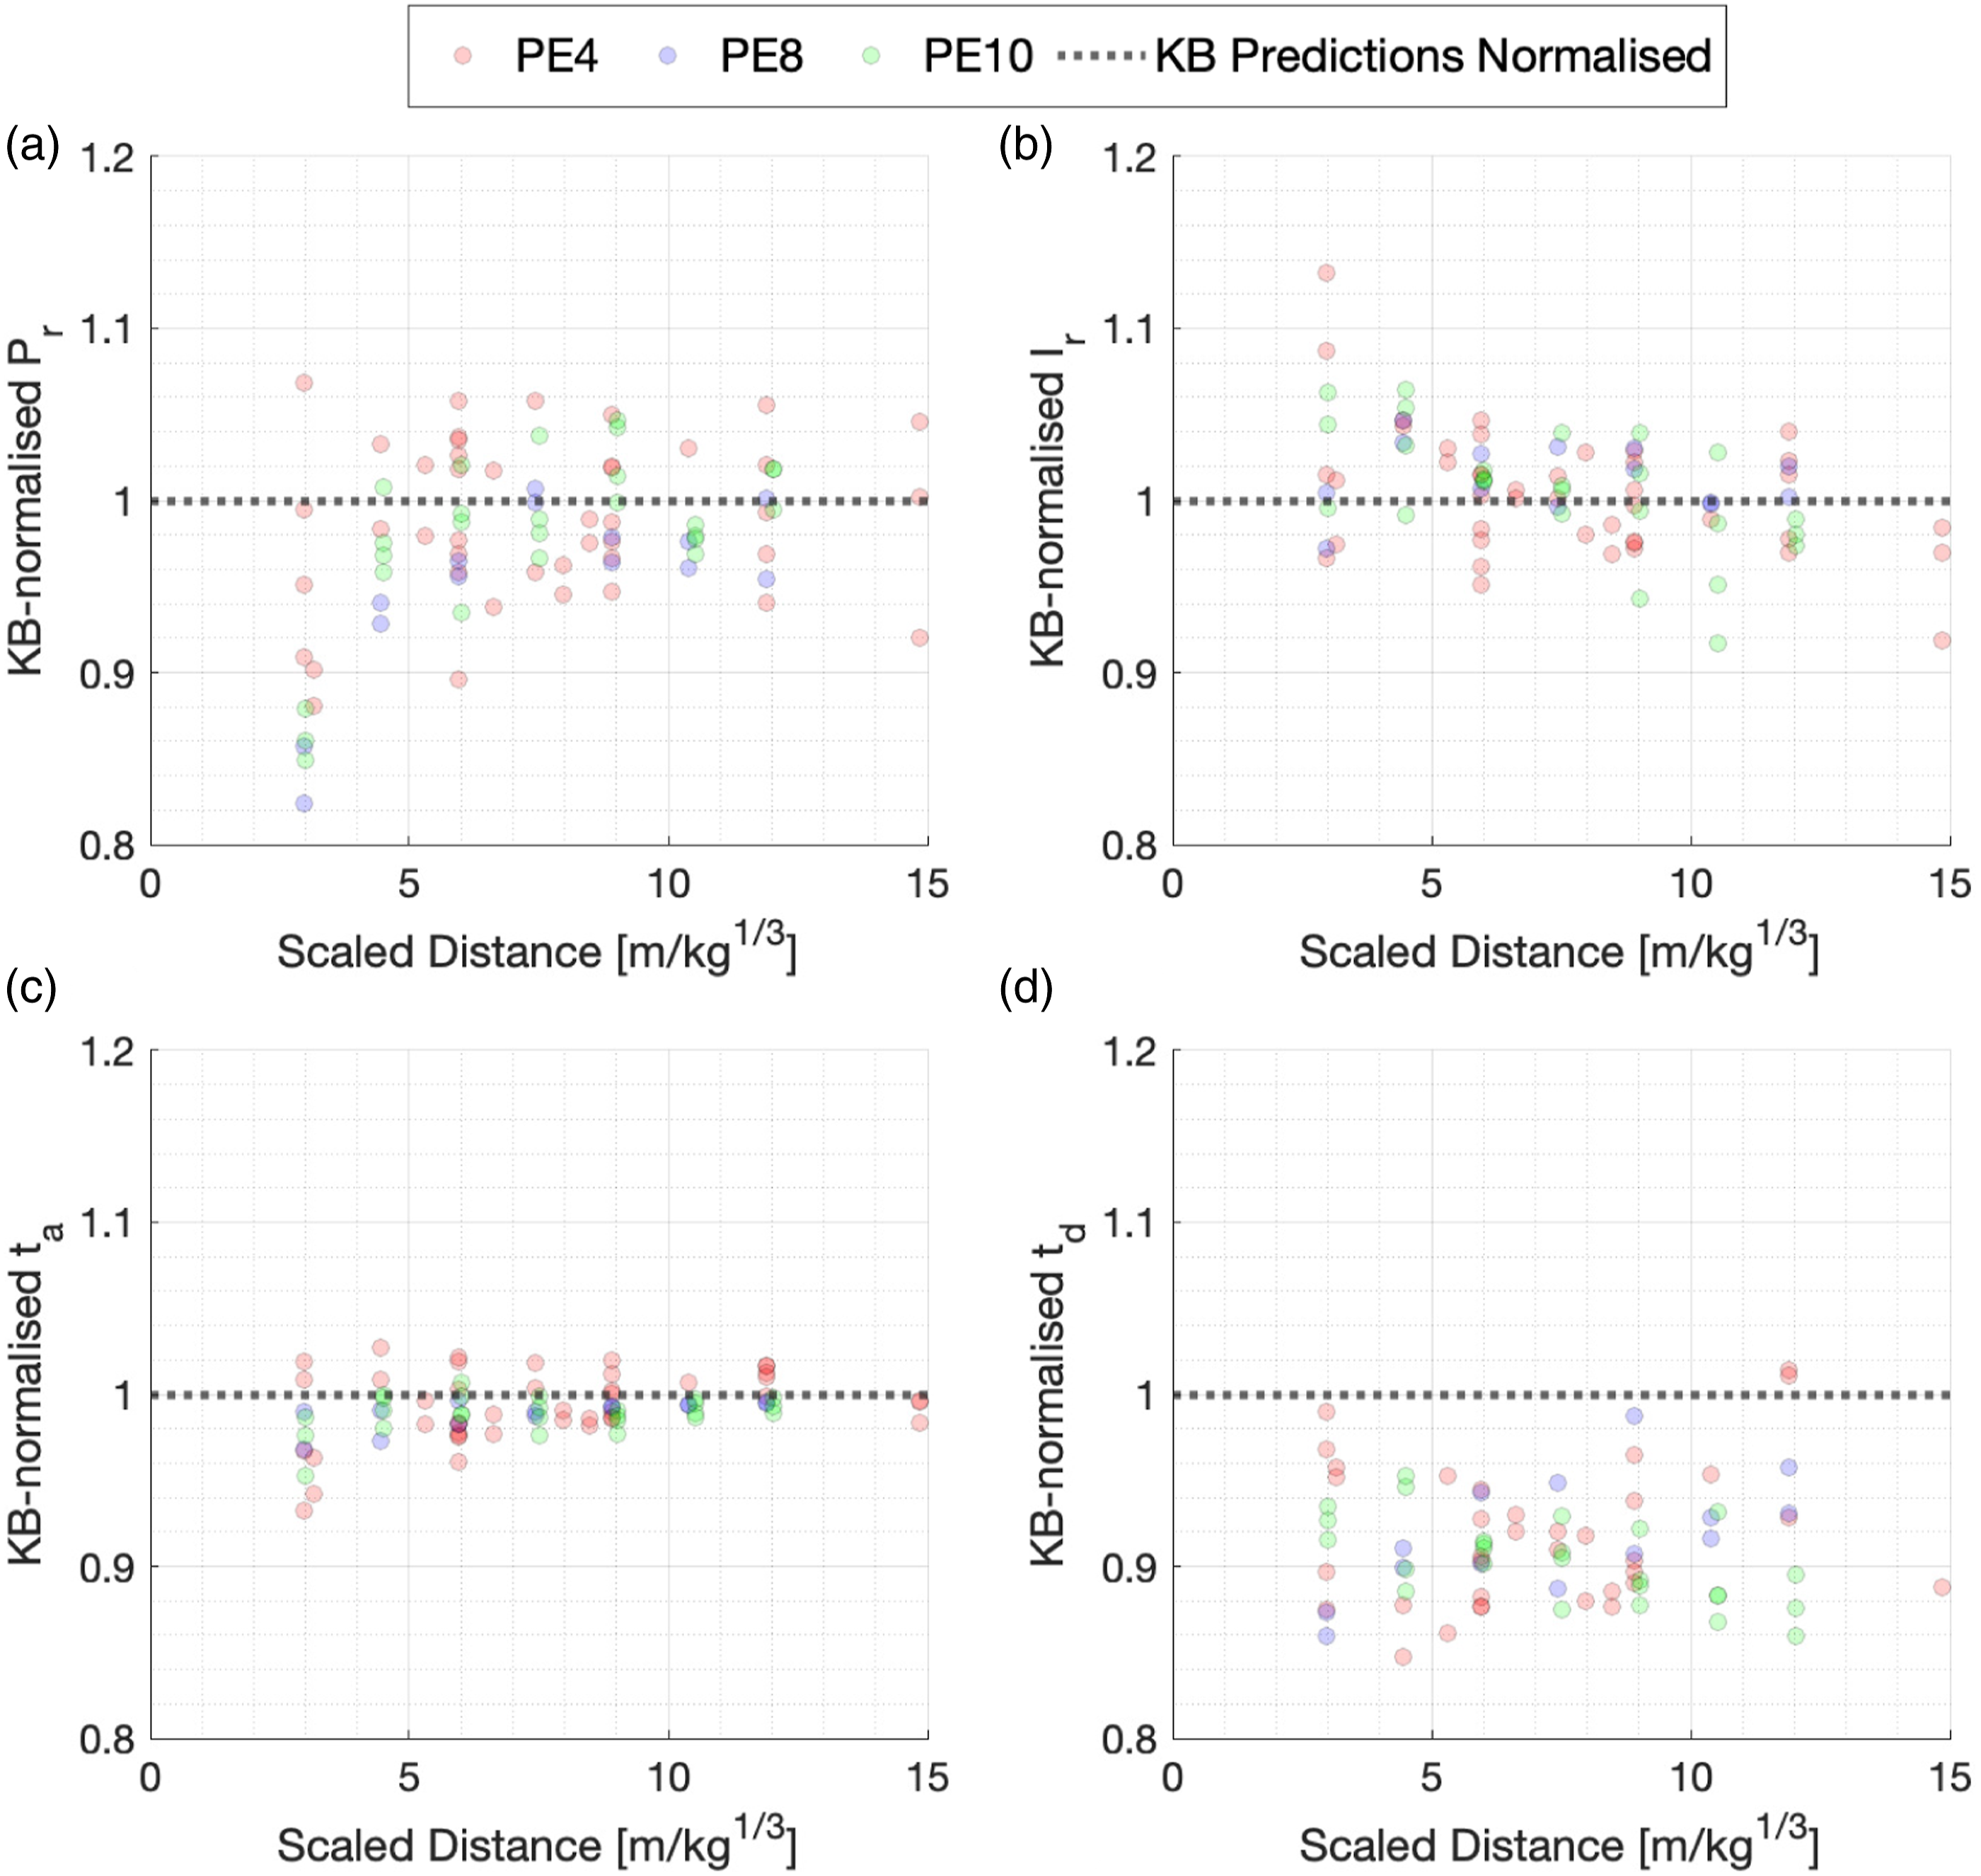
The experimentally established positive phase duration, shown in Figure 10(d), presents lower values to those evaluated by KB predictions by up to 15%. The large spread in the experimental recordings is directly related to the difficulty in determining this parameter, as discussed previously. This generally becomes more difficult with increased scaled distance as: (a) signal:noise is typically lower, and (b) the gradient of the latter stages of the positive phase is shallower, as can be seen in Figure 6.
Numerical analysis comparison
The results presented within this article, alongside many of the aforementioned articles which generally exhibit low levels of blast parameter variability, begin to build a coherent fundamental understanding of the nature of experimentally recorded far-field loading from a given charge composition, shape and mass. The importance of these findings provides a starting point to establish characteristics of more challenging blast loading conditions both in the near-field and those in complex environments, knowledge of which can be supplemented with high-fidelity, validated numerical modelling.
Understanding the mechanisms and magnitudes of blast loading on targets from both near-field detonations of high explosive, and those in complex environments, is of key importance for the analysis and design of the response of protective structures. However, there is relatively little definitive experimental data on the measurement of these loads and consequently the predictions of numerical models of near-field blast loading are largely unvalidated. The experimental results from this paper have been used to validate far-field numerical models for PE4, PE8 and PE10, using the methodology outlined in Whittaker et al. (2018), which can be implemented into much more complex numerical simulations to produce validated and accurate predictions.
Model description
The baseline numerical model consisted of 250 g hemispherical charges placed on the floor which were centrally detonated (of an equivalent sphere) to match the experimental procedures adopted within this article. A reflective boundary was set at the edge of the model used to represent the reflective wall (be that the bunker or the blockwork wall) with a size of 2.2 m in height and 4.4 m in width to prevent any clearing effects within the positive phase of the reflected shock. An additional reflective boundary was set up along the ground surface to represent the concrete pad used during the explosive trials. Afterburn is included in these free-air models to show that thermochemical analysis can suitably parametrise numerical models (as well as allowing interrogation of data artefacts, such as the ‘ringing’ effect) rather than relying on experimental methods which are very expensive and time consuming processes; the EOS was generated in a few hours using a thermochemical code. If validating a developed EOS, which includes populating an explicit afterburn model, then afterburn should be included in free-field models. This is to show that the model behaves in a representative way when it is included for all scenarios, whether that is relatively small amounts in free-field or large amounts in confined scenarios.
The numerical model was solved using APOLLO blastsimulator, which makes use of Adaptive Mesh Refinement (AMR), and zoom levels (distance-dependant AMR) to allow finer mesh resolution to be used within the complex regions of numerical analysis, in close proximity of the detonation and initial propagation (Pannell et al., 2021; Dennis et al., 2021). The AMR process requires user-defined zone length, corresponding to the coarsest cell size, and a maximum resolution level size which corresponds to the smallest allowable cell size. The software then refines and un-refines different zones within the model (based on differentials of pressure, material. etc) to accurately simulate the event while maximising efficiency. The model also uses ‘zoom levels’ which allows a higher resolution level to be used for a fixed radius from the charge centre (e.g. a zoom level of 1 for 200 mm would increase the maximum resolution level by 1 until a disturbance is registered at 200 mm, the model would then only allow the initial maximum resolution level to be achieved for the remainder of the model). As an example, the 2m models reviewed within the remainder of this document had the following zone lengths and resolution levels: • Zone length = 200 mm, maximum resolution level = 5. • Zoom level 3 for 200 mm from charge centre. • Zoom level 2 for 600 mm from charge centre. • Zoom level 1 for 1.4 m from charge centre. • Then maximum resolution level of 5 (6.25 mm) for the remainder of the model (6 ms).
Collaboration of modelling and experimental studies for improved precision
Whittaker et al. (2018) validated APOLLO blastsimulator, developed by EMI, using an in-house explicit afterburn method (leveraging Cheetah and EXPLO5), against experimental data for PE4 and PE10 explosives. The agreement attained gives confidence in the standard equation of states (EOSs) and subsequent parameters developed for these particular explosives, which can be utilised in numerical modelling for more complex scenarios. Numerical modelling generally is taken at its most simplified form to try and establish key explosive characteristics from basic scenarios which can then be mapped into more complex settings. These elementary numerical models usually do not account for minor environmental variations, such as terrain levels, reflective surface blemishes and energy loses, therefore omitting any shock wave mechanisms which could occur because of the aforementioned.
The authors of this article have identified a consistent feature across all the reflected data collected, which has been discussed in detail as ‘sensor ringing’ (Rigby et al., 2014a; Farrimond et al., 2022). This, however, is not generally predicted in simplistic numerical models, as seen in Figure 11 which shows the experimentally recorded reflected pressure and specific impulse, compared against APOLLO simulations (with EOS parameters derived from Cheetah and EXPLO5 thermochemical codes, respectively) for 250 g PE10 hemisphere at 2 m stand-off. The numerical models utilised quarter-symmetry, with both the ground, vertical symmetry plane, and a boundary wall at the required stand-off distance defined as perfectly reflecting surfaces with afterburn features included using an explicit method. The Explosive EOS (Equation Of State) parameters used in this study were generated using the thermochemical code Cheetah v7, which, due to export control reasons, are not available for publication. Therefore, an alternative thermochemical code, EXPLO5, was also used to determine the EOS for the explosives. These parameters have only been used for a complimentary comparison to the Cheetah study and have not been fully assessed or validated, but are provided as representative values in Appendix B. It is important to note the developed parameters were produced purely based on the explosive composition, correct density, composition and a best guess of plasticiser material (finding the exact plasticiser may improve the results), all done using the same default methodology. No calibrating to experimental data or tweaking of technique or parameters to improve results was performed. Comparison between experimentally recorded data for a 250 g hemispherical PE10 charge detonated 2 m away from a reflected gauge and Apollo numerical modelling (with EOS parameters developed using Cheetah and Explo5): (a) Reflected overpressure, (b) Reflected specific impulse, both with respect to time after detonation occurs.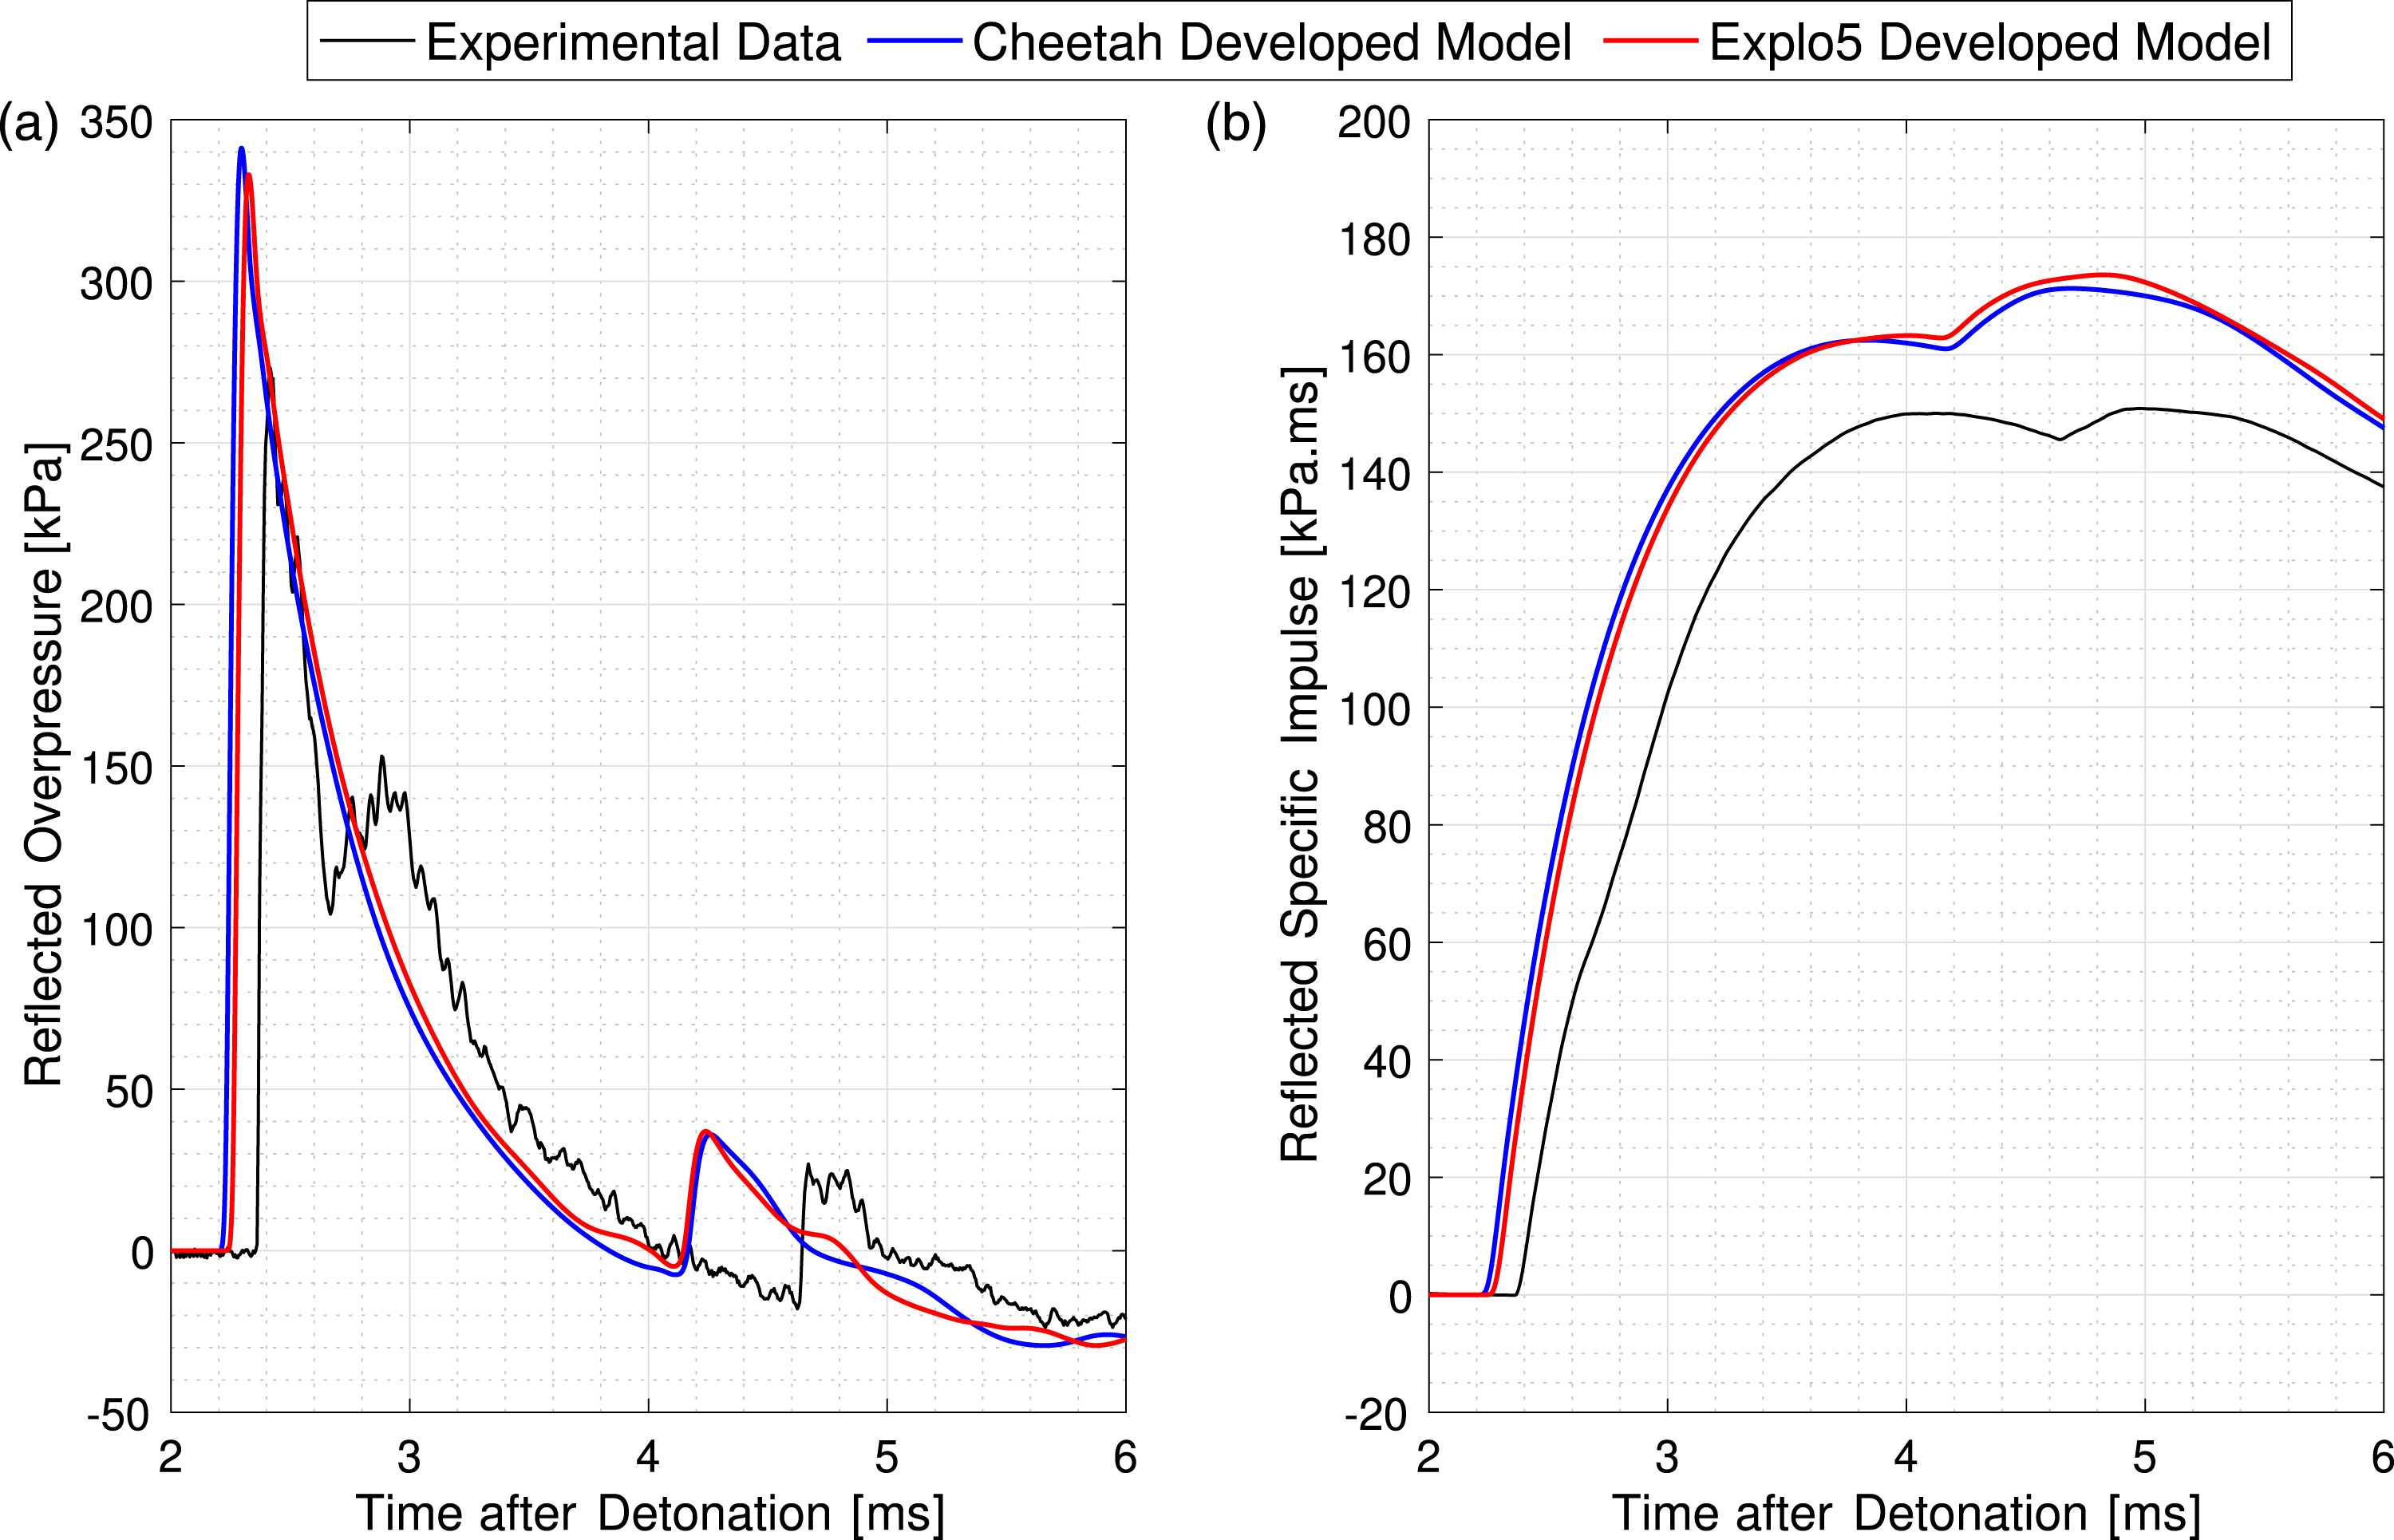
Figure 11 shows both numerical models to be almost identical in this scenario, but with both somewhat overpredicting the peak reflected pressure and impulse of the event whilst not capturing the ringing seen in the opening 0.5 ms of the positive phase. The arrival of the secondary shock in the numerical models is much earlier than that seen in the experimental data, which can lead to artificially high specific impulse predictions as the secondary shock arrives during the positive phase of the event. Other published literature describes the numerical secondary shock as arriving much later than the experimentally-recorded value when using numerical codes which do not explicitly account for afterburn (Rigby and Gitterman, 2016), and it has been shown that including a calibrated secondary energy release can bring the secondary shock in line with the experimental recordings (Schwer and Rigby, 2017). It is clear, therefore, that the arrival of the secondary shock is intimately linked to the post-detonation pressure–volume–energy relations of the fireball, and is a known limitation of current modelling capabilities and is believed to be due to the over prediction of the sound speed within the fireball, but will not be covered further in the contents of this article. Hereafter, APOLLO blastsimulator using the Cheetah-determined equation of state parameters was the chosen method of numerical prediction.
In the experimental methodology, the explosive charge was detailed as being placed on top of a steel anvil to reduce progressive damage to the ground; this alone is enough evidence to suggest some energy is being lost to the ground surface and therefore the first modification to the simplistic model was to take these into account. A 10% energy loss was applied to the simulation, in line with TM5-8858 (Hyde, 1991), by using 225 g rather than 250 g of PE10, the results of which are shown in Figure 12. This is conceptually similar to the 1.8 spherical equivalence factor adopted in the KB predictions, and brings the modelling results much more in-line with the experimental data. Comparison between experimentally recorded data for a 250 g hemispherical PE10 charge detonated 2 m away from a reflected gauge and numerical model evaluating using APOLLO when accounting for energy losses into the ground (a) Reflected overpressure, (b) Reflected specific impulse, both with respect to time after detonation occurs.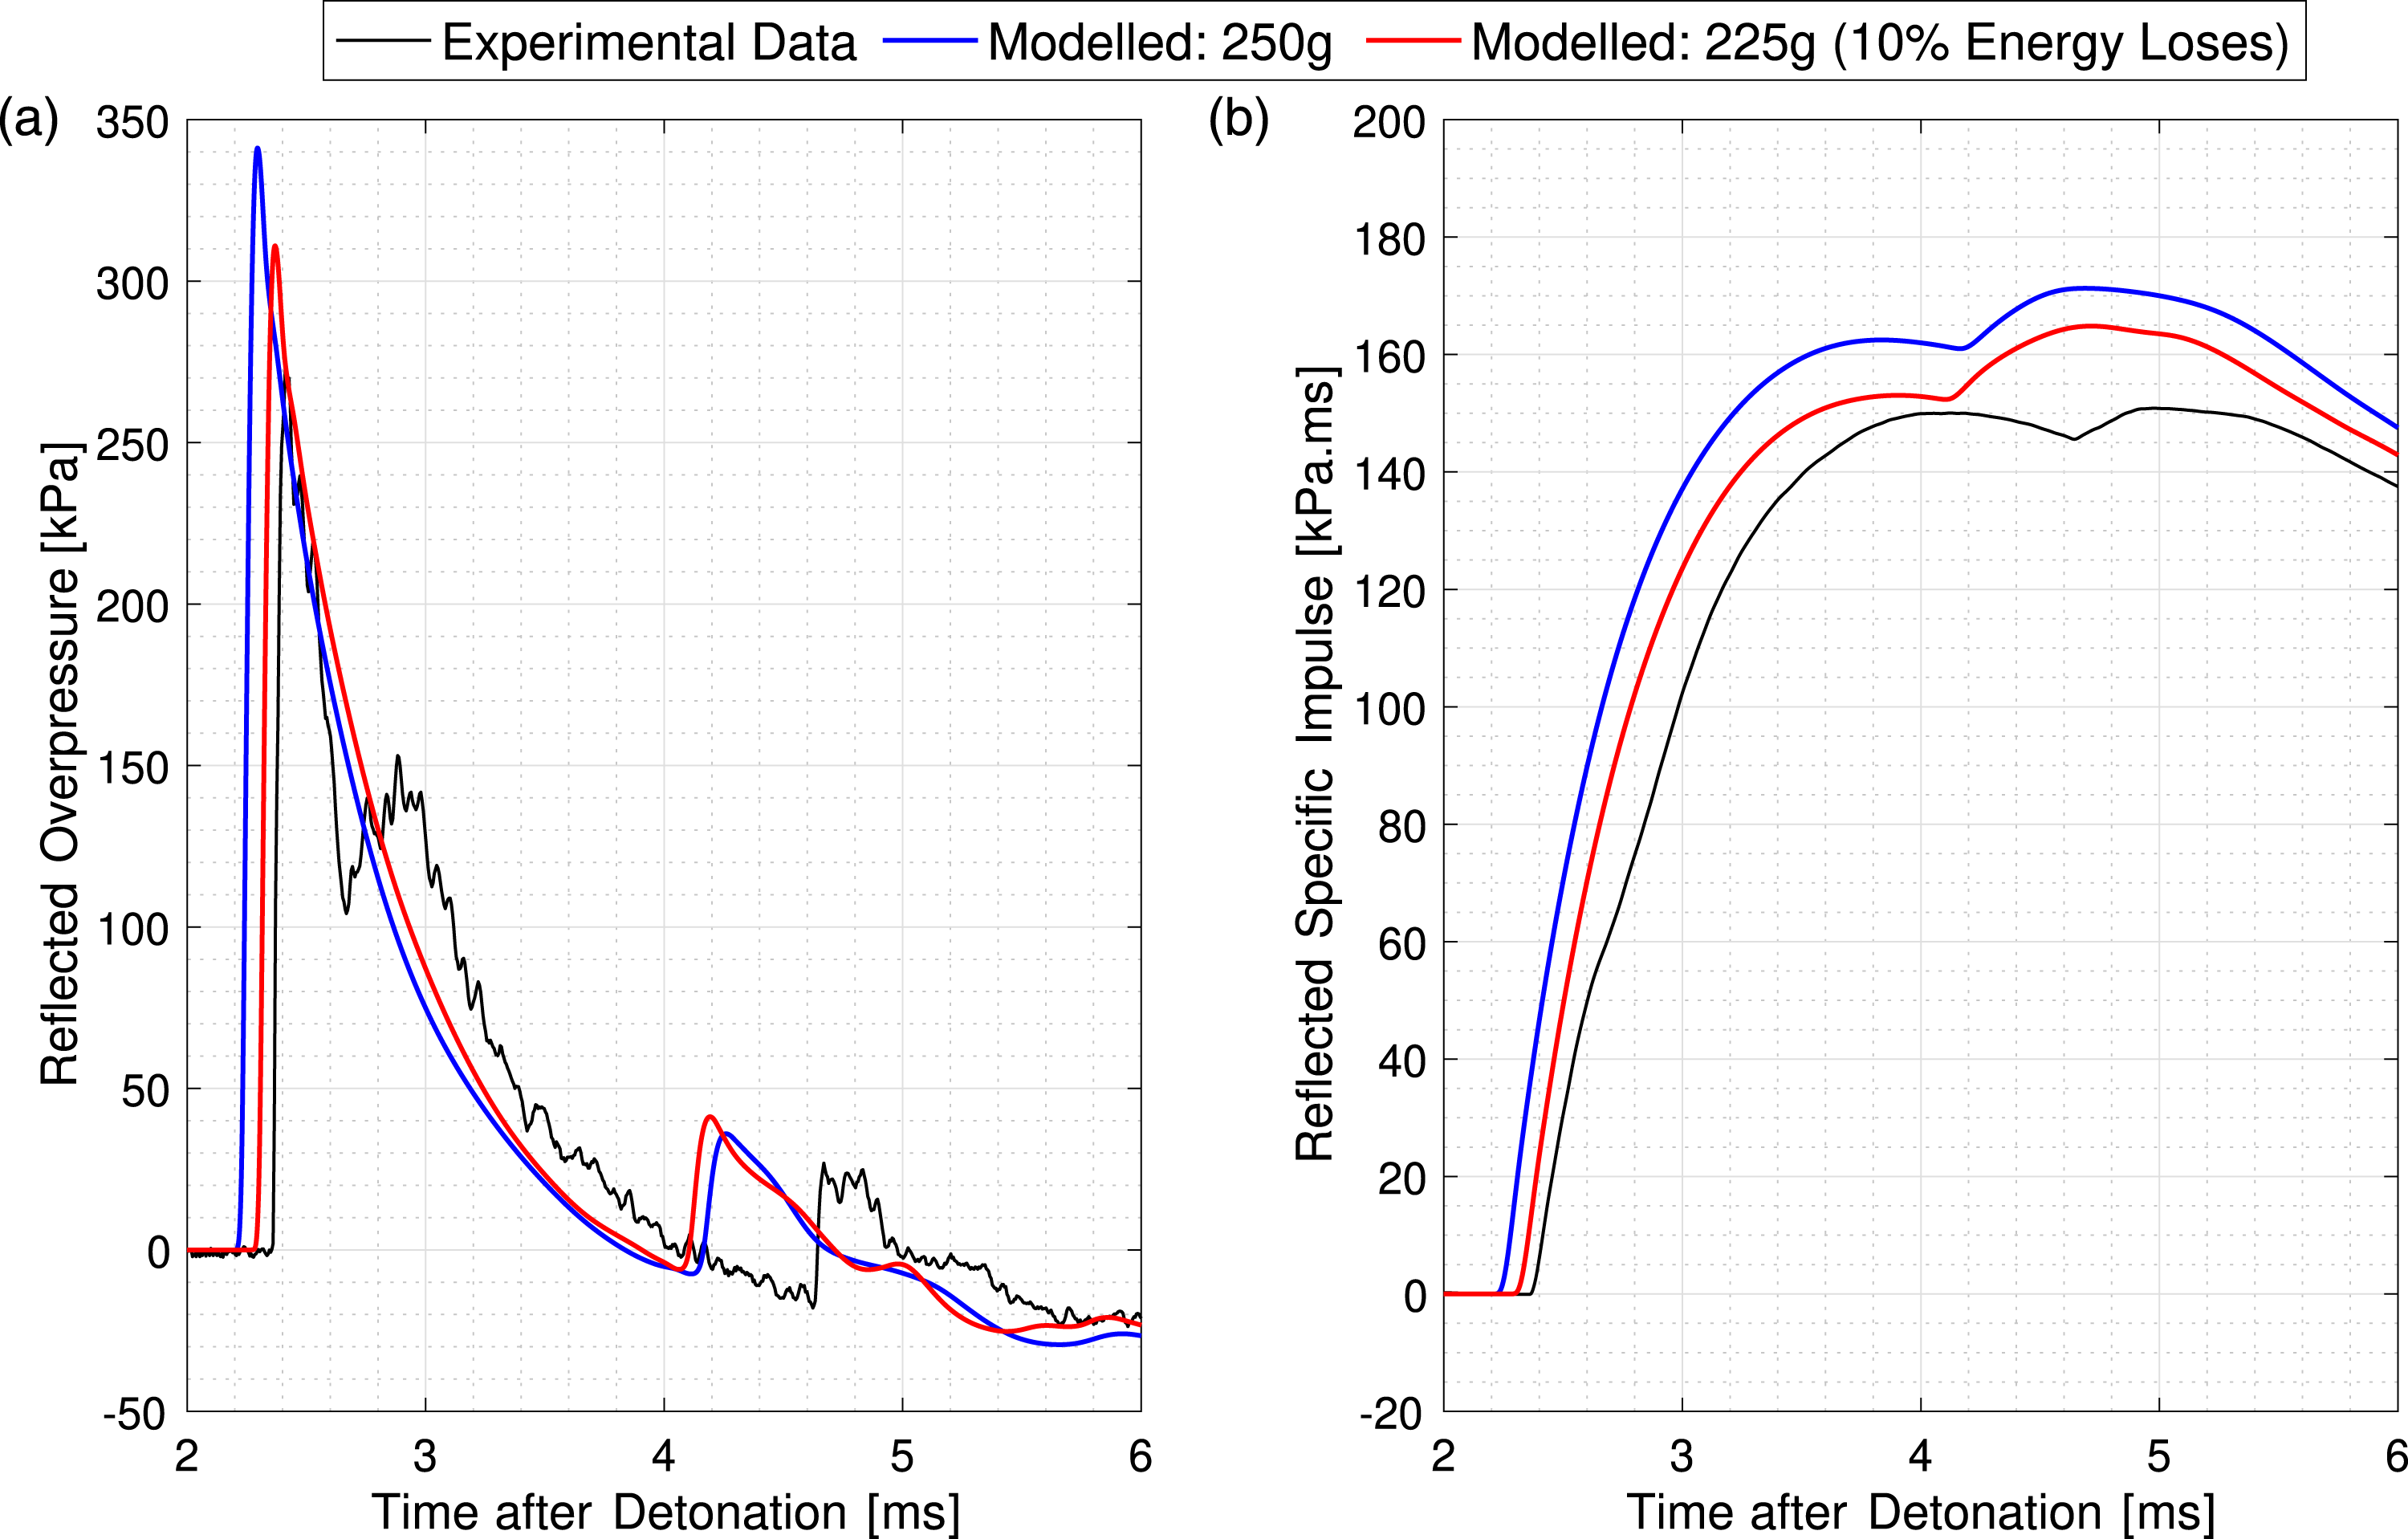
The ‘sensor ringing’ seen in the experimental data was still not captured in the model detailed in Figures 12(a) and (b). In higher fidelity numerical analysis, the pressure gauges were detailed as being made flush to a steel plate which protruded 25 mm from the reflecting surface. The significant drop in the pressure seen in Figure 13(a) over the opening 25% of the positive phase is enough evidence to support the necessity of accurate models to verify experimental procedures. By capturing some of the more complex early-time behaviour initially attributed to ‘sensor ringing’, numerical analysis and experimental procedures can work collaboratively to achieve higher levels of accuracy overall. This is a key insight for future experimental trials as it means if a truly flush surface can be achieved without any opportunity for clearing and reflected wave interactions, the statistical accuracy of the recorded data quoted in this article may be improved on further and the ‘sensor ringing’ maybe omitted. Comparison between experimentally recorded data for a 250 g hemispherical PE10 charge detonated 2 m away from a reflected gauge and numerical model evaluating using APOLLO when accounting for energy losses into the ground and substantial terrain features (a) Reflected overpressure, (b) Reflected specific impulse, both with respect to time after detonation occurs.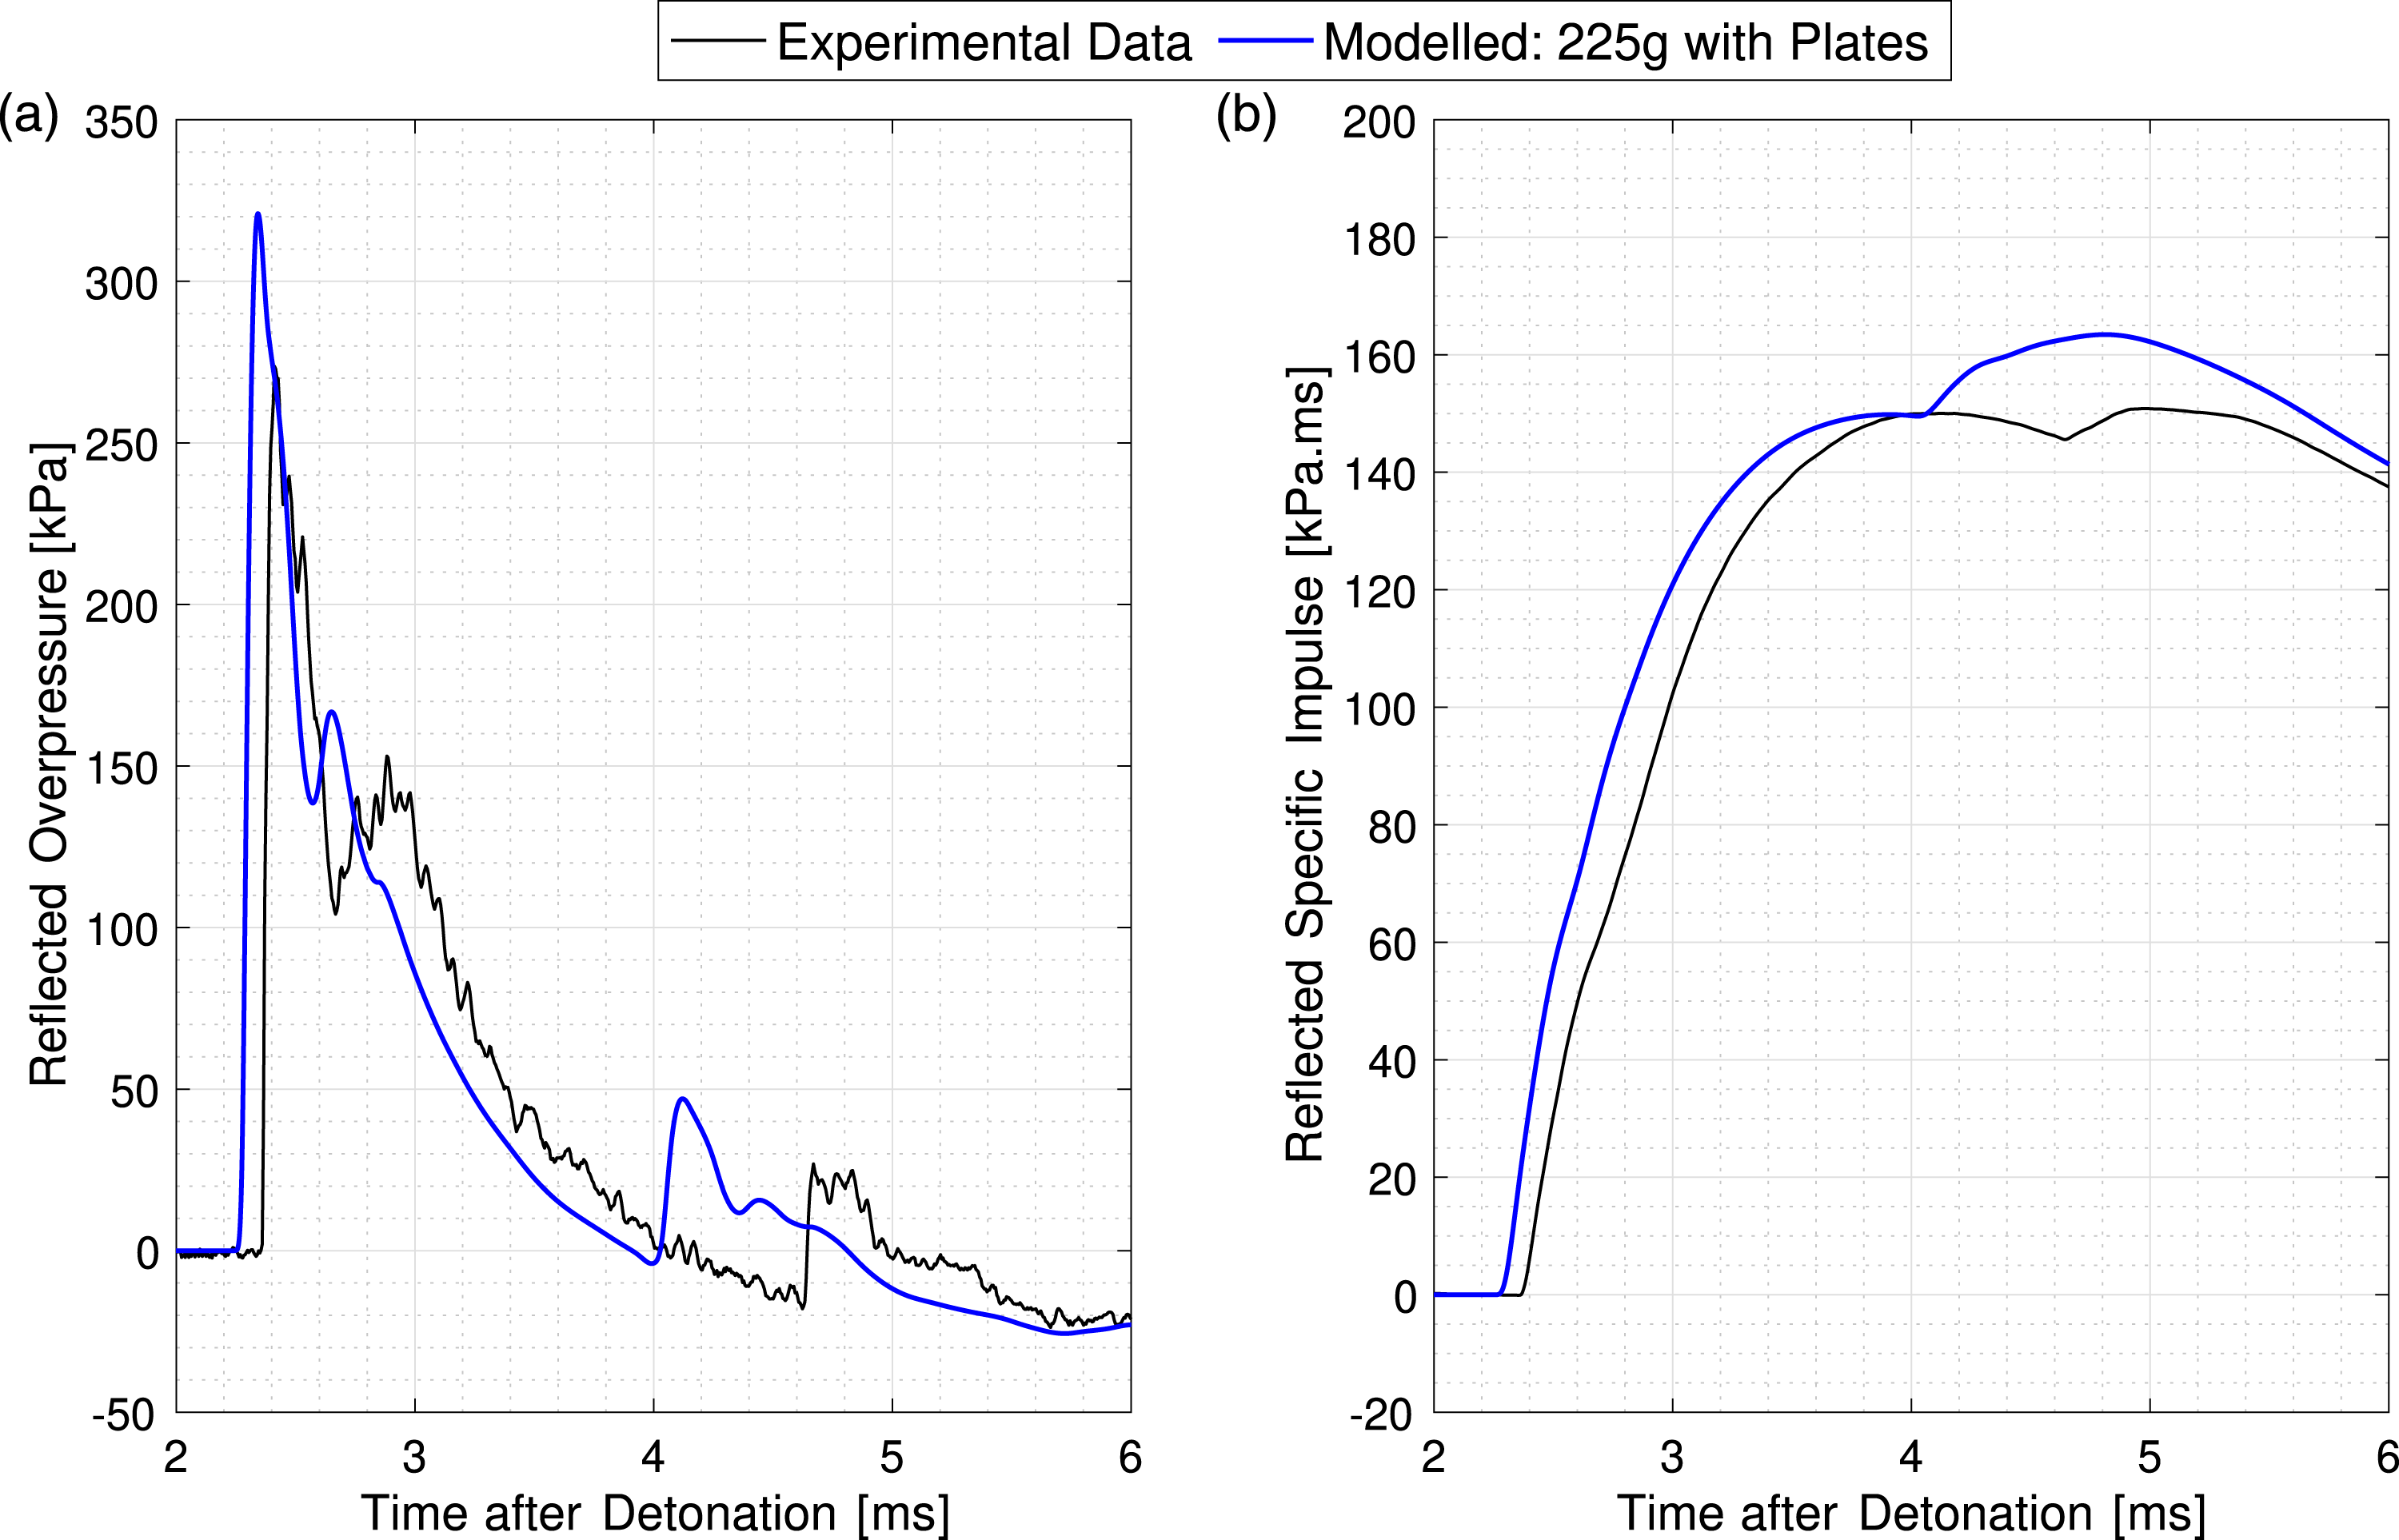
Blast arena modification
The fact that the numerical modelling has allowed the identification of systematic features within the experimental arrangement is testament to the synergistic nature of modelling and experimentation, especially when high levels of control are attained as they are in this study. A larger steel plate, with a minimum distance of 1.5 m from the gauge to the edges of the plate, was affixed to the bunker wall to ensure that the aforementioned localised clearing effects would not interfere with the positive phase of the shock. A repeat trial was conducted using a 250 g PE10 hemisphere detonated 5 m away from this surface and compared to the original trials, the data of which are presented in Figures 14(a) and (b). The new results indicate that whilst these ’sensor ringing’ oscillations alter the qualitative form of the pressure trace, their influence on the quantitative blast parameters, determined through curve fitting, or integration of the pressure signal to find specific impulse, are negligible when comparing the raw data to the curve fit itself as seen in Figures 7(a) and (b). Comparison between experimentally recorded data, time-shifted so the arrival of the positive phases align exactly, for a 250 g hemispherical PE10 charge detonated 5 m away from a reflected gauge with adjustments to the blast arena and without: (a) Reflected overpressure, (b) Reflected specific impulse, both with respect to time after detonation occurs.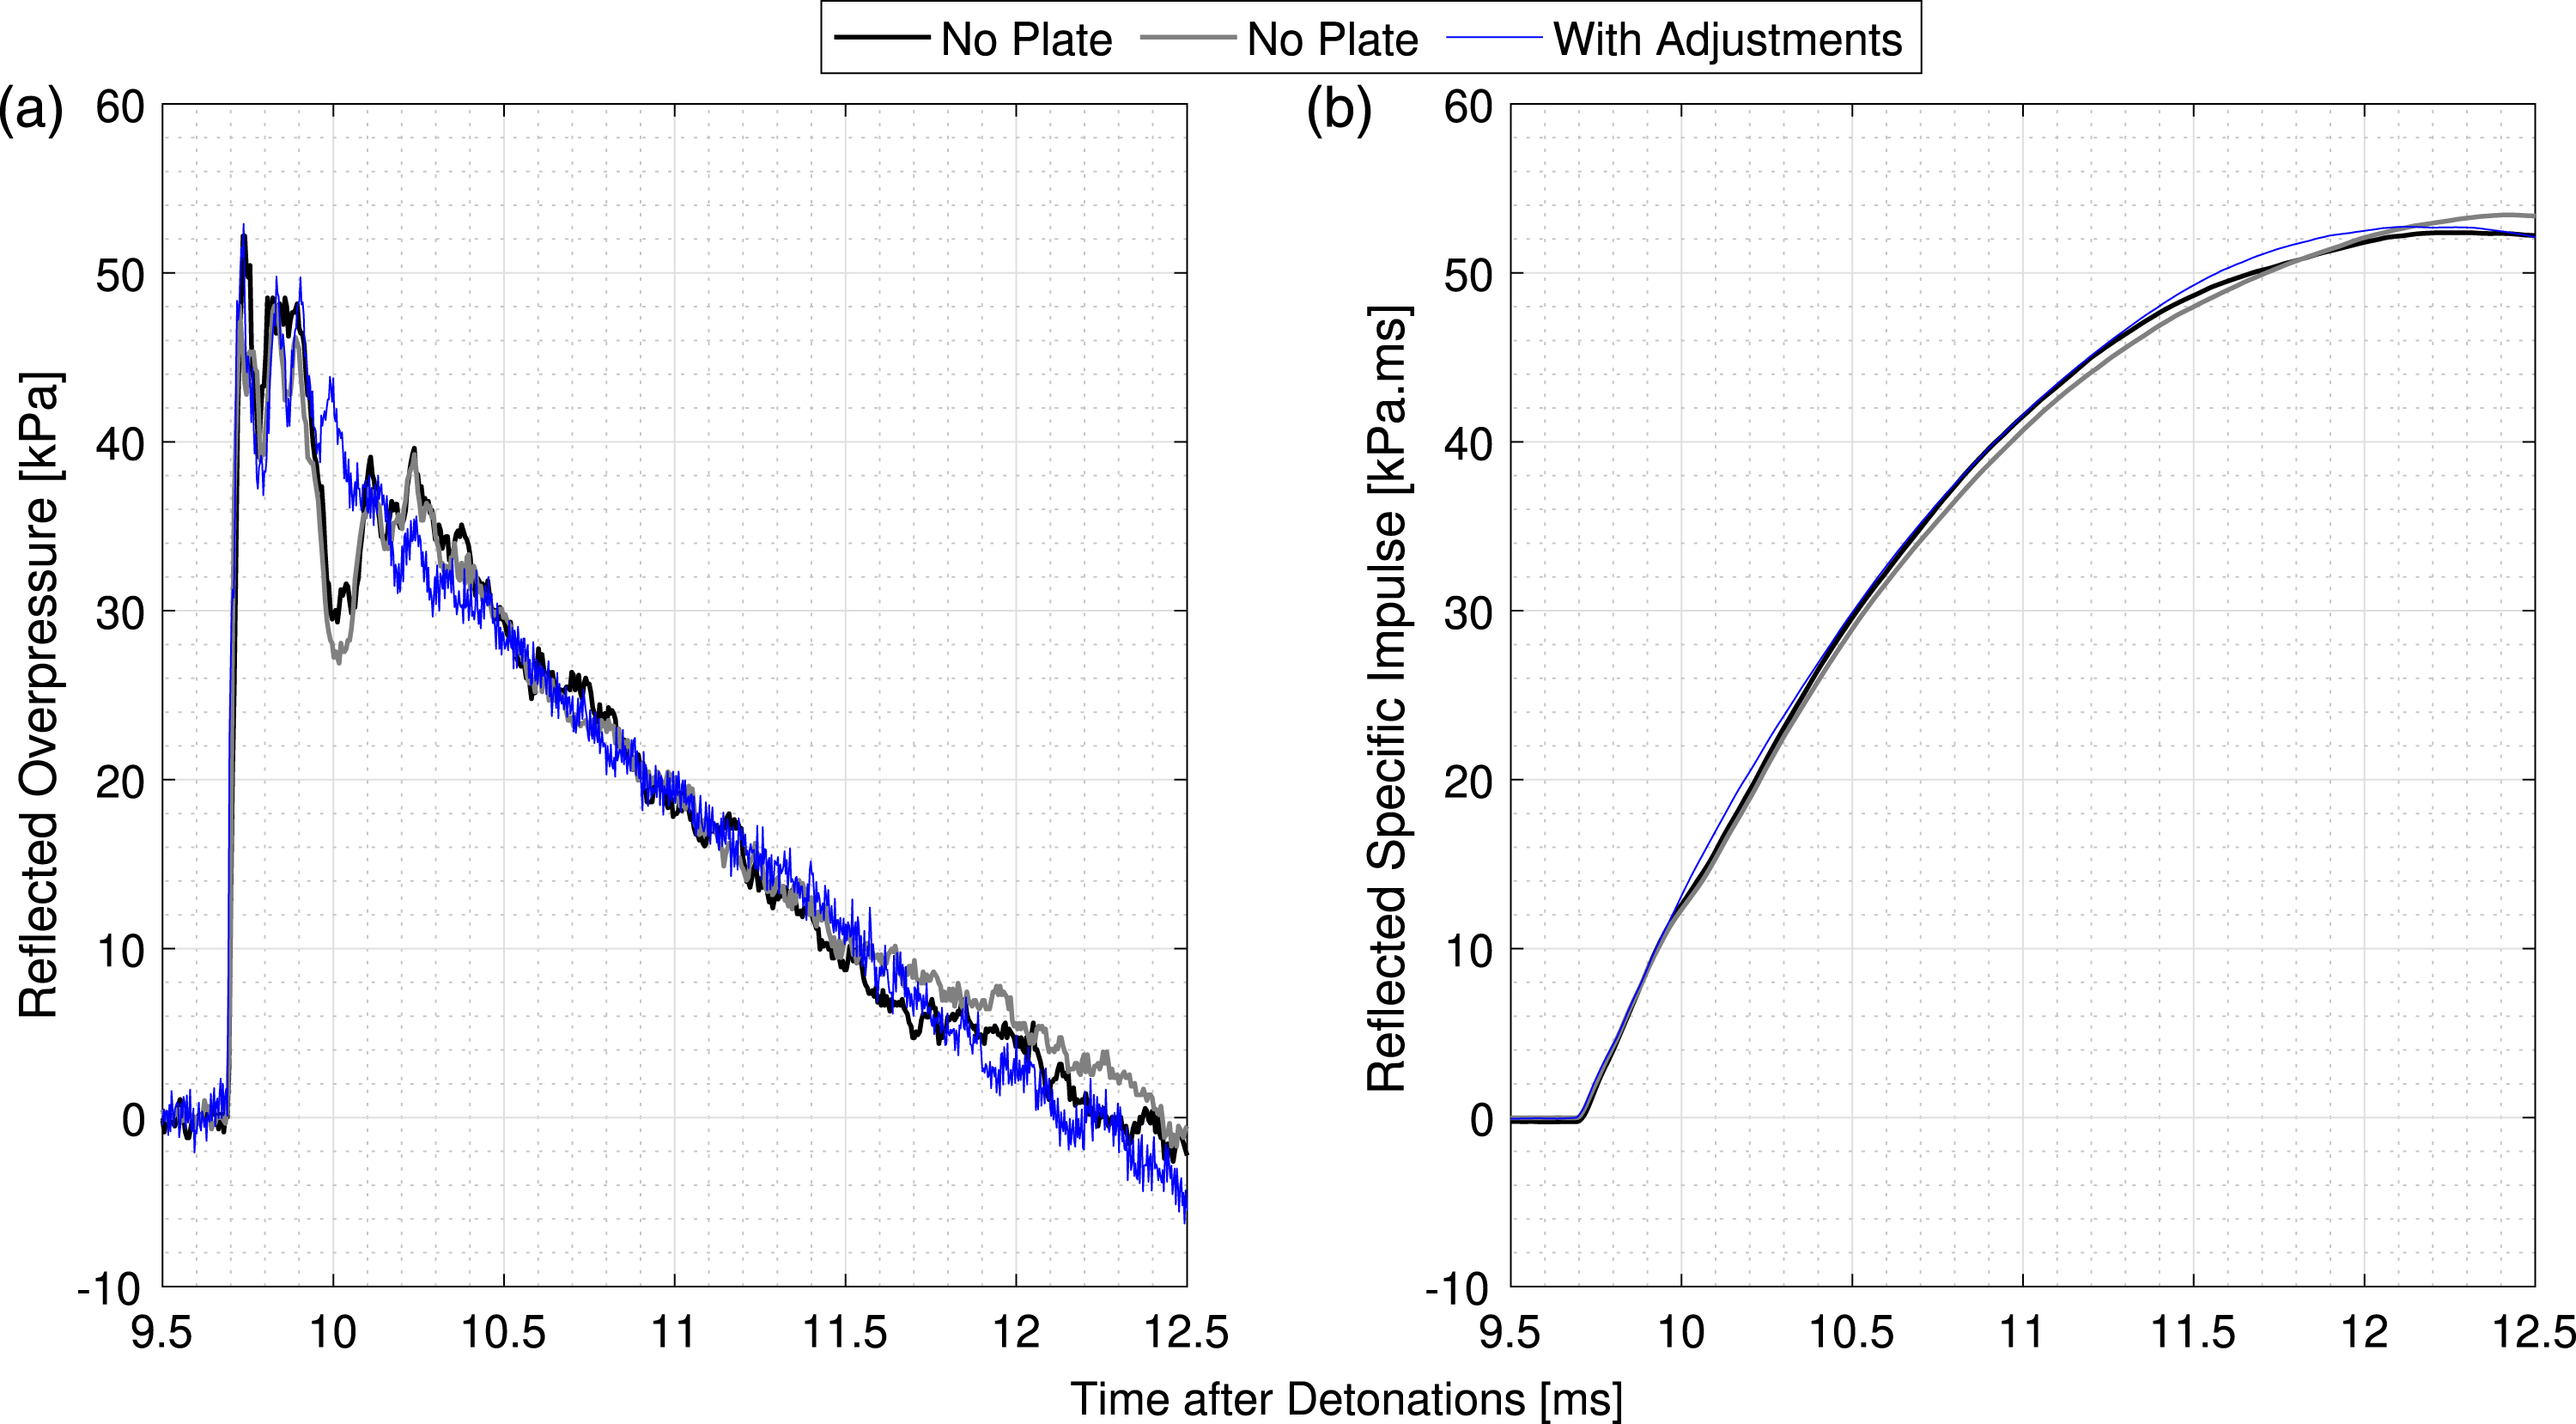
Numerical model validation
Figure 15 presents a comparison between numerical and experimental pressure histories across a wide range of scaled distances. A high degree of similarity in the qualitative form of the pressure-time histories, for all three explosives, across the entire range of far-field stand off distances, provides confidence in the modelling approach and parameters. This finding alone gives rise to the hypothesis presented by Tyas (2019) that for at least far-field scenarios, Z > 3 m/kg1/3, explosive characterisation is essentially deterministic with low levels of variability. The comparable results between the experimental data and numerical analyses, adopting a more realistic representation of the test conditions, highlights the synergistic nature of these two techniques: numerical models have become powerful enough to not rely solely on experimental data for validation and can now be used to fault-find systemic flaws within experimental procedures. A compilation of reflected overpressure-time history plots for the three explosives tested across three different stand-off distances compared to the corresponding validated and APOLLO model predictions.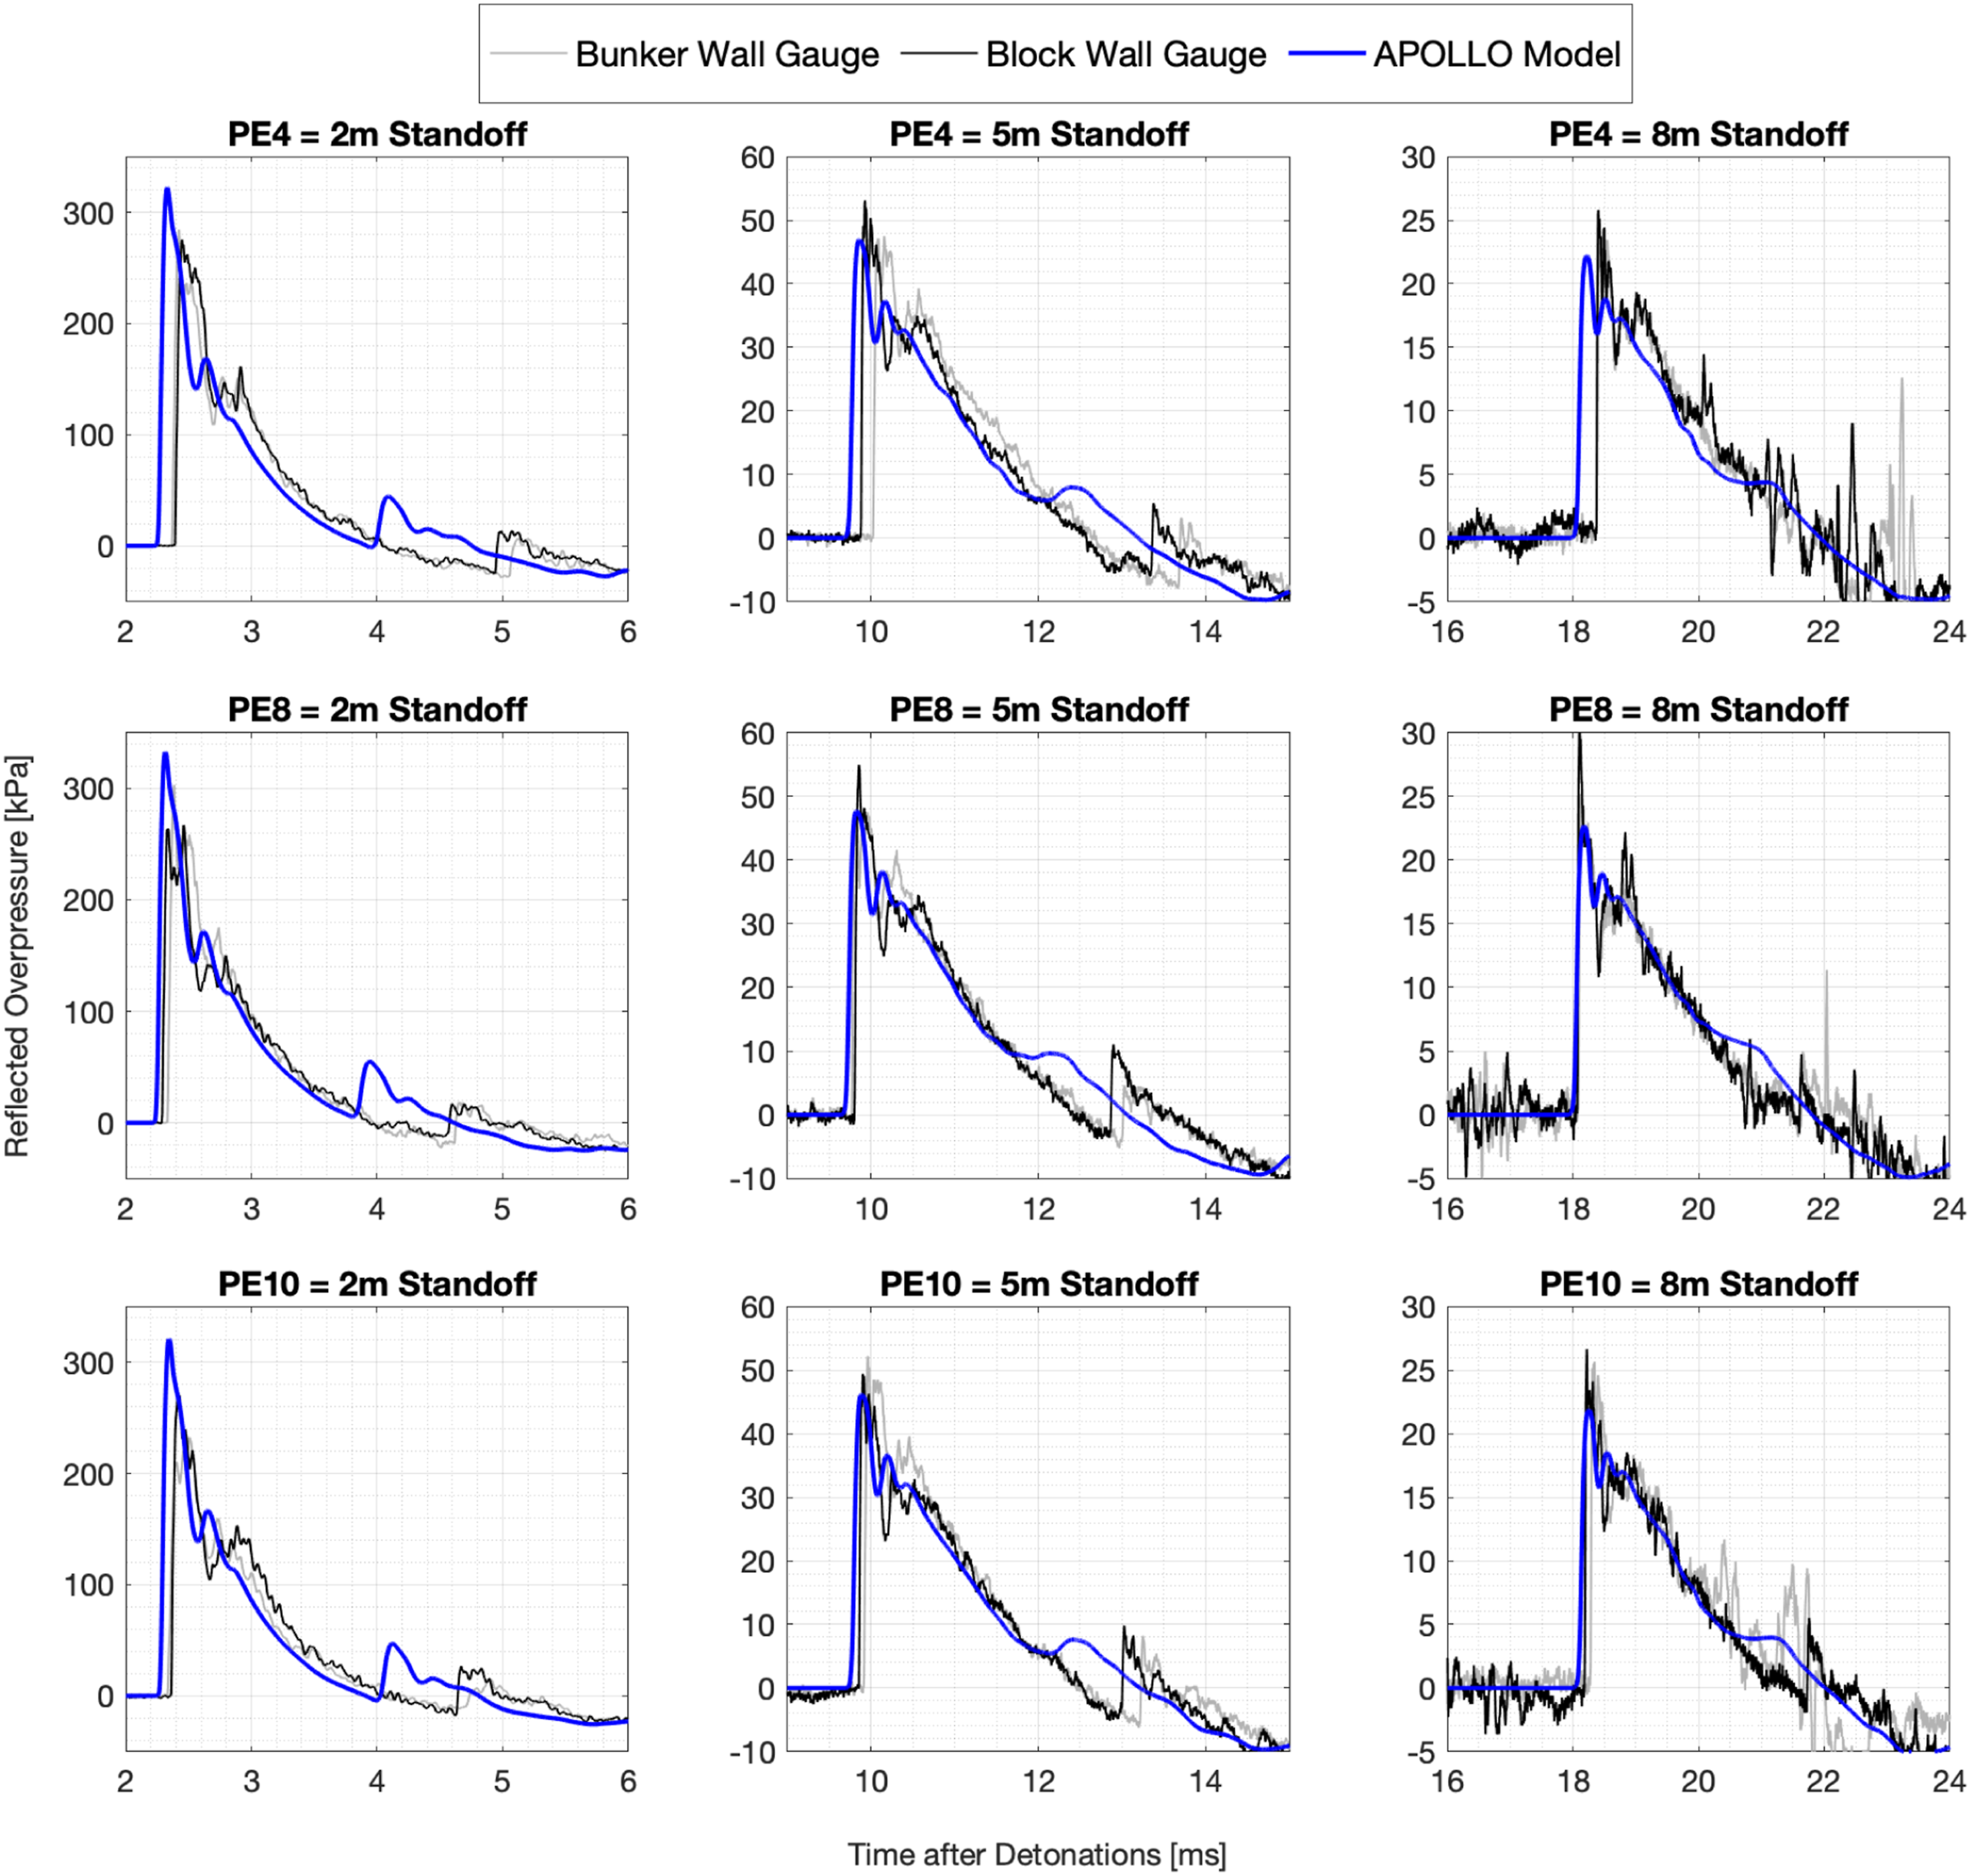
Conclusions
A variety of 250 g hemispherical RDX and PETN based plastic high explosives have been detonated at far-field ranges, with reflected pressure-time histories measured using piezo-resistive pressure gauges. The positive phase of these explosions have been analysed within the context of this article to establish the repeatability of blast parameter recordings in order to establish how well they compare with both semi-empirical predictions and numerical models. The well-controlled experimentally recorded data demonstrate high levels of test-to-test repeatability of positive phase parameters, and also exhibit increased variability at scaled distances of Z < 3 m/kg1/3. The low levels of variability in the data, when compared to both nominally identical tests and against KB predictions for the same scaled distance, suggest that TNTe is consistent in the far-field. This also serves to validate the use of the semi-empirical KB method for small-scale, far-field, geometrically simple settings. The striking agreement between numerical model results and experimental recordings, at least for the positive phase, gives rise to the idea that the quantification and characterisation of explosive properties is deterministic within reasonable levels of error. Furthermore, the quality of experimental data and numerical modelling means that we are now able to identify on the pressure traces the effects of even relatively minor features in the reflecting surface. This gives confidence in the ability of numerical modelling approaches to lead to general improvements in experimental procedures, and to subsequently be used to accurately predict the blast loading experienced by geometrically more complex targets.
Footnotes
Acknowledgements
The authors wish to thank the technical staff at Blastech Ltd. for their assistance in conducting the experimental work. It is important to note that Blastech Ltd. were responsible for the experimental aspect of this article and DSTL the modelling part.
Declaration of Conflicting Interests
The author(s) declared no potential conflicts of interest with respect to the research, authorship, and/or publication of this article.
Funding
The author(s) disclosed receipt of the following financial support for the research, authorship, and/or publication of this article: Experimental work for PE4 and PE10 reported in this paper was funded by the Engineering and Physical Sciences Research Council (ESPRC) as part of the Mechanisms and Characterisation of Explosions (MaCE) project, EP/R045240/1. The experimental work consisting of PE8 was funded directly by DSTL. The first author gratefully acknowledges the financial support from the EPSRC Doctoral Training Partnership and DSTL.
Appendix
Historic TNT and Pentolite data reference list.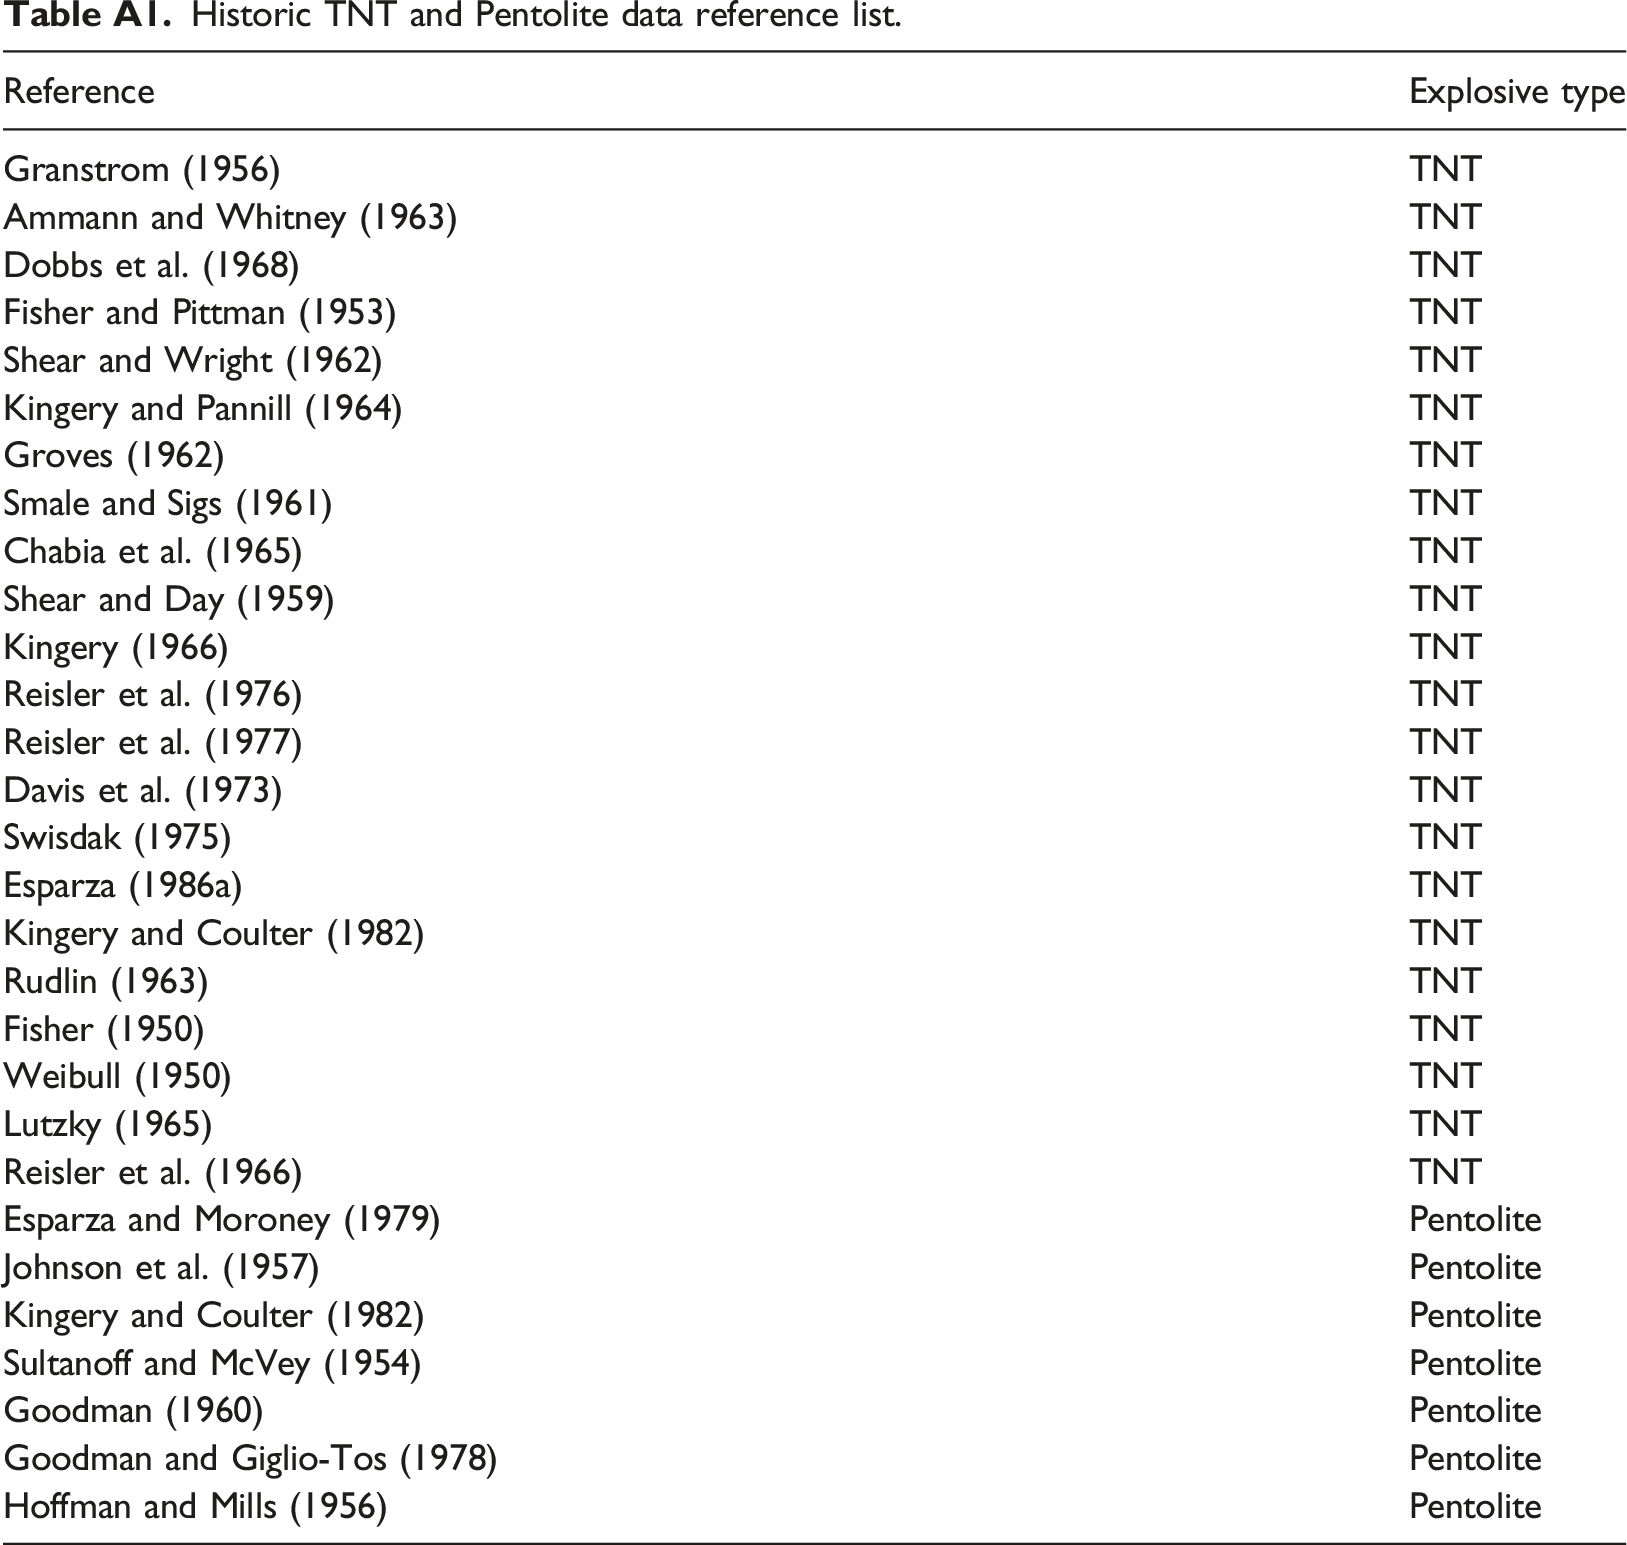
Reference
Explosive type
Granstrom (1956)
TNT
Ammann and Whitney (1963)
TNT
Dobbs et al. (1968)
TNT
Fisher and Pittman (1953)
TNT
Shear and Wright (1962)
TNT
Kingery and Pannill (1964)
TNT
Groves (1962)
TNT
Smale and Sigs (1961)
TNT
Chabia et al. (1965)
TNT
Shear and Day (1959)
TNT
Kingery (1966)
TNT
Reisler et al. (1976)
TNT
Reisler et al. (1977)
TNT
Davis et al. (1973)
TNT
Swisdak (1975)
TNT
Esparza (1986a)
TNT
Kingery and Coulter (1982)
TNT
Rudlin (1963)
TNT
Fisher (1950)
TNT
Weibull (1950)
TNT
Lutzky (1965)
TNT
Reisler et al. (1966)
TNT
Esparza and Moroney (1979)
Pentolite
Johnson et al. (1957)
Pentolite
Kingery and Coulter (1982)
Pentolite
Sultanoff and McVey (1954)
Pentolite
Goodman (1960)
Pentolite
Goodman and Giglio-Tos (1978)
Pentolite
Hoffman and Mills (1956)
Pentolite
Table of EXPLO5 modelling parameters.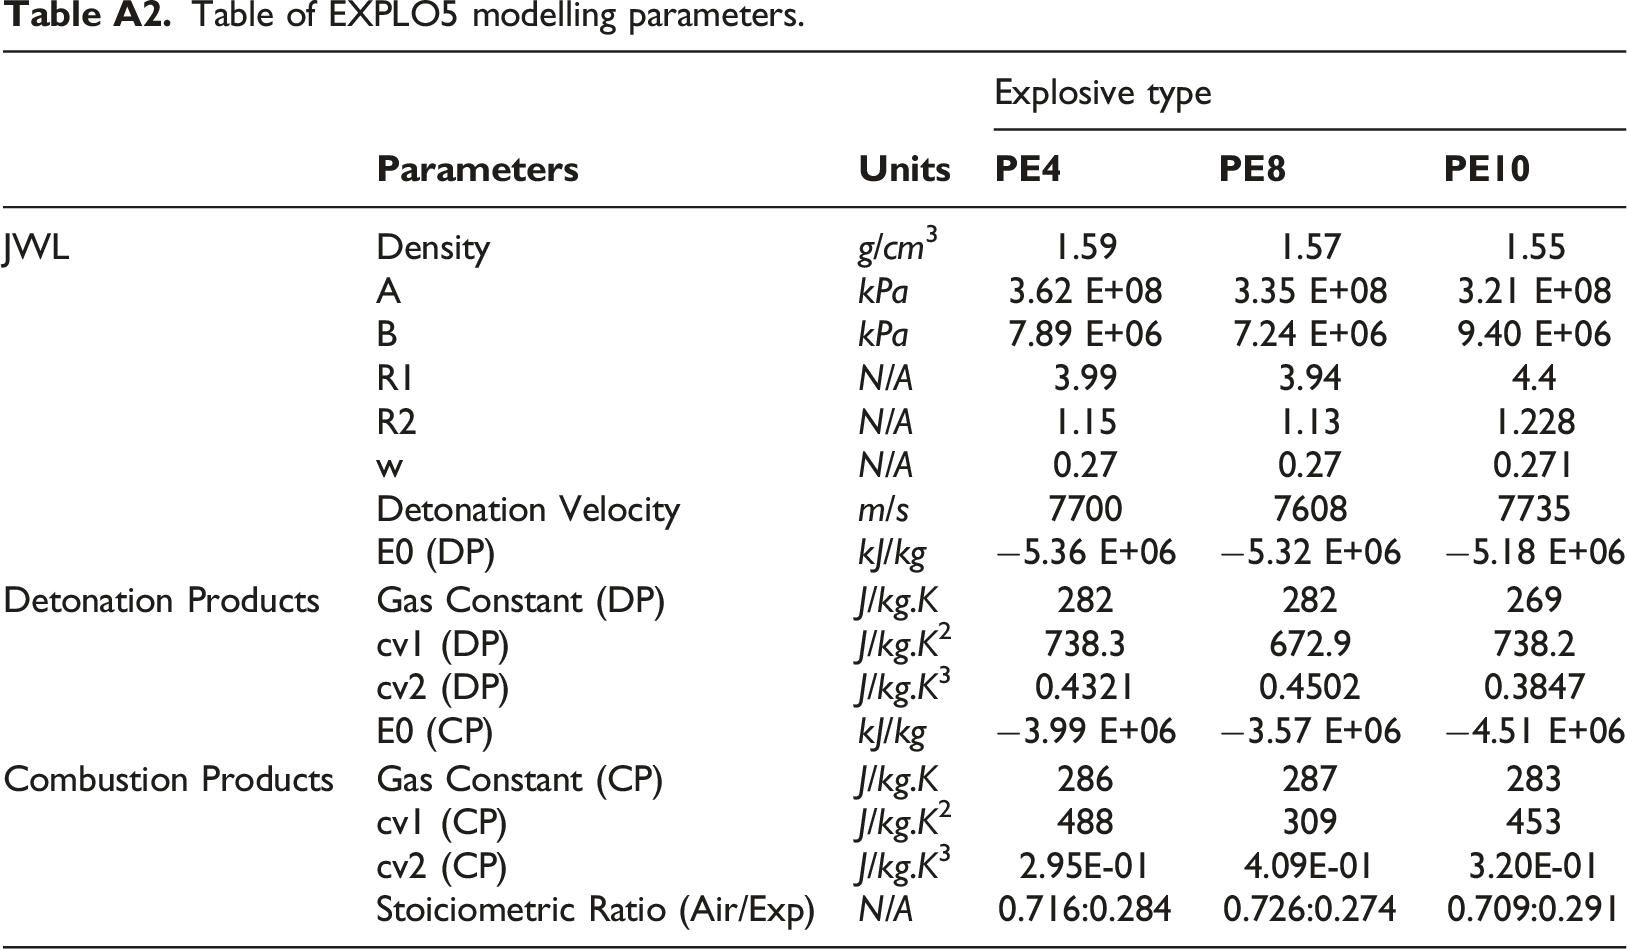
Explosive type
JWL
Density
g/cm3
1.59
1.57
1.55
A
kPa
3.62 E+08
3.35 E+08
3.21 E+08
B
kPa
7.89 E+06
7.24 E+06
9.40 E+06
R1
N/A
3.99
3.94
4.4
R2
N/A
1.15
1.13
1.228
w
N/A
0.27
0.27
0.271
Detonation Velocity
m/s
7700
7608
7735
E0 (DP)
kJ/kg
−5.36 E+06
−5.32 E+06
−5.18 E+06
Detonation Products
Gas Constant (DP)
J/kg.K
282
282
269
cv1 (DP)
J/kg.K2
738.3
672.9
738.2
cv2 (DP)
J/kg.K3
0.4321
0.4502
0.3847
E0 (CP)
kJ/kg
−3.99 E+06
−3.57 E+06
−4.51 E+06
Combustion Products
Gas Constant (CP)
J/kg.K
286
287
283
cv1 (CP)
J/kg.K2
488
309
453
cv2 (CP)
J/kg.K3
2.95E-01
4.09E-01
3.20E-01
Stoiciometric Ratio (Air/Exp)
N/A
0.716:0.284
0.726:0.274
0.709:0.291
Table of EXPLO5 equation of states for air and parameters.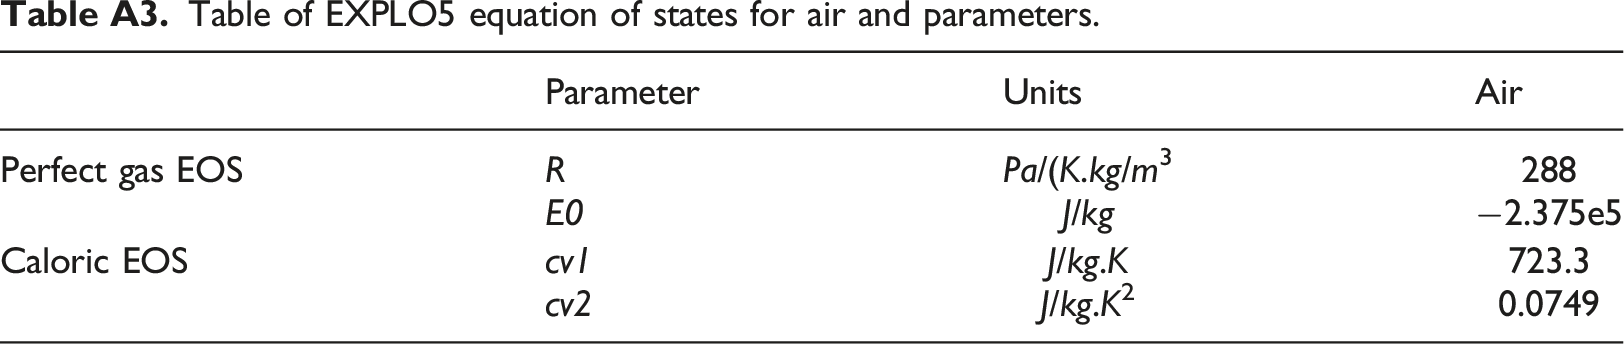
Parameter
Units
Air
Perfect gas EOS
R
Pa/(K.kg/m3
288
E0
J/kg
−2.375e5
Caloric EOS
cv1
J/kg.K
723.3
cv2
J/kg.K2
0.0749