
Abstract
Background:
Musculoskeletal disorders (MSKDs) are the leading cause of disability worldwide. The associations between socioeconomic and lifestyle factors and MSKDs have been widely studied in Europe and North America. However, little data are available about their relationship in Latin America.
Objectives:
To estimate the prevalence of chronic MSKDs in Brazil and assess their relationship with socioeconomic and lifestyle factors.
Design:
This is a cross-sectional study, based on a subanalysis of the open-access database from the Brazilian National Health Survey 2019. This survey was a nationwide, cross-sectional, door-to-door study that included 87,648 adults and was conducted between 2019 and 2020.
Methods:
Prevalence estimates were based on weighted sample strata, and the relationship between MSKD and socioeconomic and lifestyle factors was examined through network analysis and weighted Poisson regression models with robust variance.
Results:
The weighted prevalence of chronic MSKDs was estimated at 26.1% (95% confidence interval, 25.5%–26.8%). In the network analysis, including all socioeconomic and lifestyle variables, MSKDs prevalence was notably linked to higher body mass index, drinking, smoking, and low income. In the regression models, MSKD prevalence was associated with obesity, sleep disorders, smoking, alcohol consumption, and depression, and inversely associated with physical activity, even after controlling for the sociodemographic disparities.
Conclusion:
This study identifies specific socioeconomic and lifestyle factors associated with MSKDs and highlights the need for immediate national health promotion programs focused on MSKDs prevention through targeted lifestyle modifications, especially in populations belonging to the lower-income strata in Brazil.
Plain language summary
This study aimed to understand how common chronic musculoskeletal disorders (MSKDs) are in Brazil and how they relate to people’s socioeconomic status and lifestyle habits. MSKDs are the top cause of disability worldwide. While many studies have explored these connections in Europe and North America, there are limited data from Latin America. Researchers utilized data from the 2019 Brazilian National Health Survey, which interviewed 87,648 adults nationwide. They calculated the prevalence of MSKDs and analyzed how it is affected by factors like income, weight, smoking, drinking, and physical activity. The results showed that 26.1% of adults in Brazil have chronic MSKDs. Higher rates were linked to obesity, smoking, alcohol consumption, sleep disorders, depression, and low income. On the other hand, regular physical activity appeared to lower the likelihood of MSKDs. These findings highlight the need for urgent public health programs in Brazil to prevent MSKDs, particularly by promoting healthier lifestyles in low-income populations.
Keywords
Introduction
Chronic musculoskeletal disorders (MSKDs) are the leading cause of disability in the world, prevailing among the most common complaints in primary care settings, and have an enormous socioeconomic impact.1,2 The prevalence of the most common MSKDs, such as low back pain and osteoarthritis, has presented a substantial rise since 1990, reflecting their growing burden on a global scale.3–7 This upward trend in frequency underscores the need for continued research on surveillance, associated factors, management, and prevention.
To mitigate the progression of MSKDs and their consequences, many studies are focused on understanding the socioeconomic and lifestyle factors that influence these conditions. Some factors, such as physical inactivity/sedentary behavior, smoking, stress, sleep disorders, unhealthy diet, and obesity, have been identified.7–10 However, the associations of lifestyle and socioeconomic factors with MSKDs at the national level in the Brazilian population have rarely been addressed.
This represents a significant knowledge gap, as the 2013 National Health Survey (Pesquisa Nacional de Saúde—PNS 2013) estimated that 21.6% of the Brazilian adult population was affected by chronic MSKDs. 11 Understanding the lifestyle and socioeconomic factors linked to MSKDs is essential for guiding targeted health promotion interventions, particularly regarding lifestyle and socioeconomic factors.12–17
According to the Brazilian Ministry of Health’s Strategic Action Plan for Coping with Chronic Diseases 2021–2030, 18 the latest version of the 2019 National Health Survey, the PNS2019, was completed in 2020.18,19 This edition can provide updated prevalence estimates of chronic MSKDs in Brazil and their related lifestyle and socioeconomic factors.
Therefore, we aimed primarily to analyze the prevalence of major chronic MSKDs in the Brazilian adult population. In addition, we conducted a network analysis and a series of logistic regressions and examined their complete relationships with lifestyle and socioeconomic factors. Compared to traditional regression-based methods, network analysis can fully elucidate complex relationships within a dataset by identifying key drivers of health outcomes and developing targeted public health strategies. 20
We hypothesized that chronic MSKDs would be associated with unhealthy lifestyle factors and lower socioeconomic strata in the Brazilian population.
Methods
This is a subanalysis of the PNS2019 database, a nationwide, cross-sectional, door-to-door survey of a representative sample of the civilian noninstitutionalized Brazilian population. The Ministry of Health surveyed in partnership with the Fundação Oswaldo Cruz (Fiocruz) and Instituto Brasileiro de Geografia e Estatística (IBGE) between August 2019 and March 2020.
The PNS2019 adopted a complex sampling design, 19 based on a three-stage cluster sampling with stratification of primary sampling units (PSUs) from census tracts or sets of tracts and selection of PSUs for the main sample. Households were selected from the National Register of Addresses for Statistical Purposes, and the final definition of the PSU sample size was established. 19 The survey sampling weights were defined based on the weight of the corresponding PSU. Corrections for non-response and calibration of the estimates were made according to the population totals estimated by the IBGE. 19
The PNS2019 sample consisted of 8015 PSUs, comprising 574 strata. In the sample with individual responses from the dwellers, there were 94,111 household visits, with 90,846 participants interviewed (96.5% response rate). In this study, data were collected from Brazilian adults aged 18 years or older who responded to questions about general sociodemographic information, lifestyle behaviors (Module P), and chronic diseases (Module Q).
The National Research Ethics Committee (#3.529.376) has reviewed and approved PNS2019. All participants provided written consent prior to enrollment.
Assessment of variables
Presence of chronic MSKD
Chronic MSKD was defined as the presence of any of the following chronic conditions: (i) neck, dorsal, or low back pain; and/or (ii) self-reported diagnosis of spinal disc disorders and/or sciatica, arthritis, rheumatism, or (iii) work-related musculoskeletal pain, diagnosed by a physician.
Sociodemographic factors
Sociodemographic variables included age in years (age range groups), sex assigned at birth (female, male), Brazilian Regions (Southeast, South, Central West, Northeast, North), housing place (urban, or rural), self-reported skin color (White, Black, Brown, Others—Asian, Indigenous, marital status (single, married, separated/divorced, or widower), household Income (per capita), and separated into quartiles, Q4 income (lowest), Q3 income, Q2 income, and Q1 income (highest). Quartiles income values are converted into International Dollars (Int$): Q4 = Int$ < 197.23, Q3 = Int$ 197.24–394.46, Q2 = Int$ 394.47–658.100, and Q1 = Int$ > 658.11, based on exchange rate of 2.53:1 (as for 2021, according to World Economic Bank) (https://data.worldbank.org/indicator/PA.NUS.PPP?locations=BR, accessed March 30, 2023); schooling (no formal/incomplete primary, complete primary, complete high school, and complete college), labor force status (inside the labor force, outside the labor force), excluding income from the pension. People inside the labor force were defined as working-aged people employed or unemployed, and outside the labor force. People outside the labor force were defined as working-aged people not classed as employed or unemployed; retirement pension (yes/no) was inquired as any income from retirement or pension received from municipality, estate, or federal social security at the time of the survey.
Lifestyle factors
Leisure-time physical activity
The following questions surveyed leisure-time physical activity (LTPA): (i) “In the previous 3 months, did you engage in any physical exercise or sport?” (excluding physiotherapy, yes/no answer options); (ii) “How many days per week do you practice any physical exercise or sport?” (never/less than once per week, or 1–7 days options); (iii) “In general, how much time in hours do you spend performing physical exercise or sport?”; and (iv) “In general, how much time in minutes do you spend performing physical exercise or sport?” The total weekly minutes of LTPA were calculated and categorized according to the World Health Organization’s (WHO) 2020 physical activity guidelines. 21 Participants were classified as “active” if they met at least one of the following criteria: engaging in a minimum of 150 min/week of moderate to vigorous physical activity or 75 min/week of vigorous physical activity. Those who reported no physical activity were classified as “inactive.” Participants who engaged in physical activity but did not meet the thresholds for the “active” category were classified as “insufficiently active.” 21
Smoking status
Current smoking status was assessed with the question: “Do you currently smoke any tobacco products?” Answer options were “yes” or “no.”
Alcohol consumption
We used the question “How often do you usually consume any alcoholic beverage?” to assess drinking habits. The response options were “never,” “less than once/month,” and “once or more/month.”
Sleep disorders
The definition of having a sleep disorder was based on the question, “In the past 2 weeks did you take any sleep medicine?” (answer options were yes/no) and/or responding to item 3 of the Patient Health Questionnaire-9 (PHQ-9) with “More than half the days” or “Almost every day.” 22
Body mass index
Body mass index (BMI) was calculated based on self-reported weight and height, and grouped according to the WHO classification (normal, underweight, overweight, and obesity). 23
Depression diagnosis
Depression diagnosis (yes/no) was based on a self-reported, physician-endorsed diagnosis of depression or the PHQ-9.22,24 A PHQ-9-based depression diagnosis was made if the respondent answered ⩾5 of the 9 symptom items with “more than half the days” (for the suicidal symptom “several days”) and the presence of a depressive mood and/or anhedonia. 25
Statistics
The population estimates with chronic MSKDs were based on the number of strata, the number of selected PSUs in each stratum, and the number of households and residents included in each PSU, along with their respective expansion factors and sample weights. The data on weights, number of PSUs, and strata were provided in the dictionary of variables file along with the PNS2019 database.
In the PNS2019 survey, it was necessary to define expansion factors or sample weights for the PSUs, households, and all their residents, as well as for the selected residents. The weights of the PSUs were based on the probabilities of selection for both the main sample and the research sample.
In the descriptive analyses, we reported the weighted prevalence of chronic MSKDs as a proportion (%) with a 95% confidence interval (CI). In the hypothesis tests and analyses, we utilized weighted Poisson regression models with robust variance to assess the relationship between chronic MSKDs, lifestyle, and mental health. This statistical approach has been deemed adequate for the cross-sectional surveys and considers time at risk as a constant to ensure accurate estimation of the prevalence ratios (PRs). 26 The results were presented as PRs and 95% CIs. We performed crude (Model 1) and adjusted (Model 2) models, the latter of which was controlled for the effect of sociodemographic characteristics.
Network analysis was conducted to visualize the relationships among the variables selected in the study and to identify central nodes for proposing impactful, targeted interventions.
A type I error rate <0.05 was accepted as statistically significant in all analyses. All analyses were conducted with Stata software (version 17.0; StataCorp LLC, College Station, TX, USA). Complex sampling design svy commands with weights for the non-response sample corrections and post-stratification adjustments were performed. The NetworkAnalyzer plugin of Cytoscape v.3.10.2 was used to build the network analysis.
Results
Prevalence of MSKDs
In this study, 87,648 participants provided full data regarding variables of interest. The mean (95% CI) age was 45.0 (44.8–45.3) years, and 52.6% were female. Of these, 23,169 participants reported at least one MSKD, with a weighted prevalence of chronic MSKDs of 26.1% (95% CI: 25.5%–26.8%), representing 41,235,665.1 Brazilian adults. Figure 1 depicts the flowchart of the participants included in this study.

Data collection flowchart of the study.
Risk factors associated with MSKDs prevalence
Females showed a higher weighted prevalence of chronic MSKDs than males (30.7% (29.9%–31.6%) vs 21.0% (20.3%–21.8%), p < 0.001). In general, the weighted peak prevalence of MSKDs was observed in people aged ⩾65 years (39.7% (38.4%–41.1%)). In females, the peak prevalence was observed in individuals aged ⩾65 years (47.2% (45.4%–49.1%)), while in males, it was in individuals aged 50–64 years (30.4% (28.7%–32.2%)). Compared to males, the age-adjusted PR of MSKDs was 1.40 (95% CI: 1.34–1.45) in females.
Characteristics associated with a significantly higher prevalence of MSKDs were female, unmarried status, no formal/incomplete primary education, outside the labor force, living with retirement pension, living in rural areas, physically inactive, sleep disorders, smokers, non-drinkers, higher BMI, and with depression (Table 1). A significantly lower frequency of MSKDs was observed in individuals residing in the Central-West region, urban areas, and those with lower household incomes (Table 1).
Weighed prevalence of musculoskeletal disorders according to sociodemographic, lifestyle, and depression by chronic MSKDs in 87,648 Brazilian adults in the PNS2019 survey, 2019.
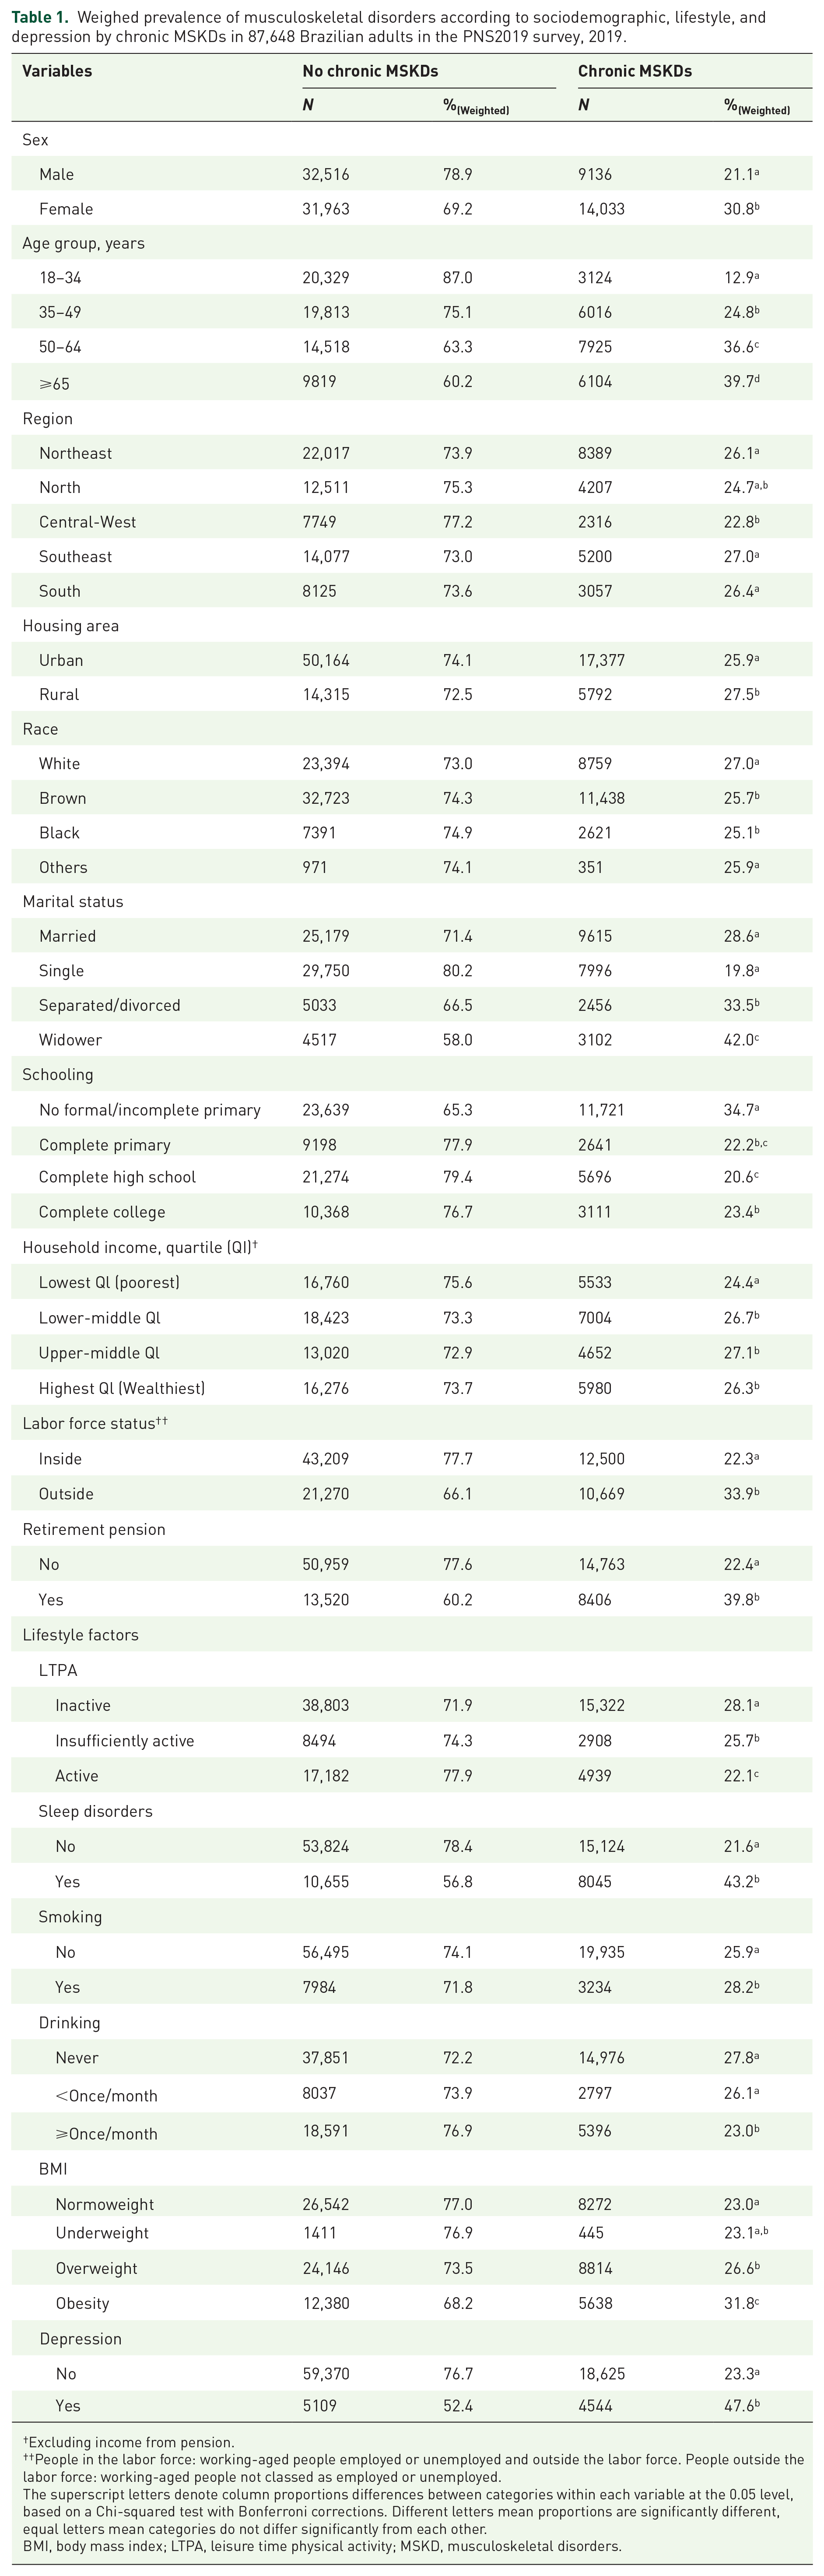
Excluding income from pension.
People in the labor force: working-aged people employed or unemployed and outside the labor force. People outside the labor force: working-aged people not classed as employed or unemployed.
The superscript letters denote column proportions differences between categories within each variable at the 0.05 level, based on a Chi-squared test with Bonferroni corrections. Different letters mean proportions are significantly different, equal letters mean categories do not differ significantly from each other.
BMI, body mass index; LTPA, leisure time physical activity; MSKD, musculoskeletal disorders.
Crude and adjusted models showed a similar pattern of association for all lifestyle factors and depression, except drinking, wherein there was an inversion from lower to higher PR of chronic MSKDs in any level of drinking frequency (Table 2). The model adjusted for age, sex, and sociodemographic data showed that physically active people presented lower PR (0.92 (95% CI: 0.86–0.99), p = 0.020), while sleep disorders (2.32 (95% CI: 2.17–2.48), p < 0.001), smoking (1.14 (95% CI: 1.05–1.23), p = 0.001), drinking less than once a month (1.24 (95% CI: 1.15–1.35), p < 0.001), drinking once a month (1.16 (95% CI: 1.08–1.25), p < 0.001), overweight (01.12 (95% CI: 1.05–1.20), p = 0.001) or obesity (1.39 (95% CI: 1.29–1.39), p < 0.001), and depression (2.55 (95% CI: 2.35–2.77), p < 0.001) were associated with higher PR for MSKDs (Table 2).
Weighed PR with 95% CI for chronic MSKDs according to lifestyle and depression in 87,648 Brazilian adults in the PNS2019 survey, 2019.

Model 1: crude model; Model 2: adjusted model, controlled for the effect of age, sex, marital status, race, household income, schooling, labor force status, and retirement pension.
BMI, body mass index; CI, confidence interval; LTPA, leisure time physical activity; MSKDs, musculoskeletal disorders; PR, prevalence ratio.
Network analysis
There were 34 edges connecting the 11 nodes (variables). Alcohol consumption (drinking) and smoking (each with 8 degrees) were identified as the two most central nodes, followed by income and BMI, indicating that they are the primary drivers with the highest control over the network (Table 3).
Degree and betweenness in the network analysis of selected variables in the PNS2019 survey.
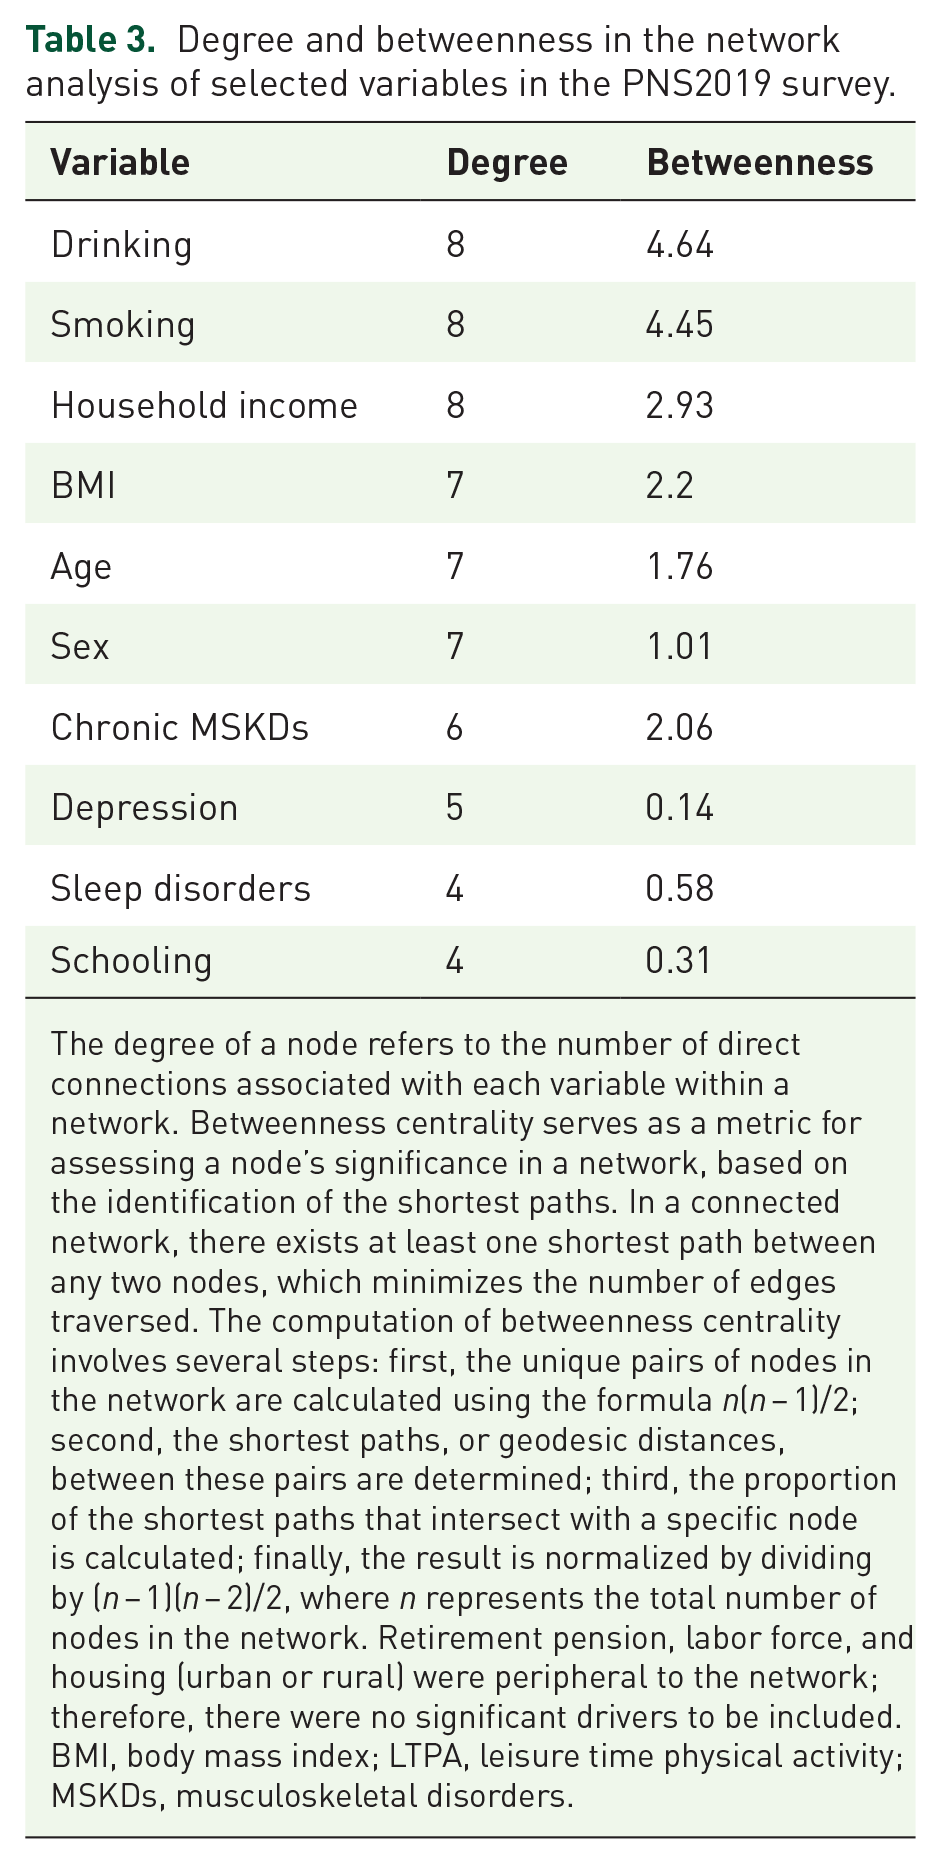
The degree of a node refers to the number of direct connections associated with each variable within a network. Betweenness centrality serves as a metric for assessing a node’s significance in a network, based on the identification of the shortest paths. In a connected network, there exists at least one shortest path between any two nodes, which minimizes the number of edges traversed. The computation of betweenness centrality involves several steps: first, the unique pairs of nodes in the network are calculated using the formula n(n − 1)/2; second, the shortest paths, or geodesic distances, between these pairs are determined; third, the proportion of the shortest paths that intersect with a specific node is calculated; finally, the result is normalized by dividing by (n − 1)(n − 2)/2, where n represents the total number of nodes in the network. Retirement pension, labor force, and housing (urban or rural) were peripheral to the network; therefore, there were no significant drivers to be included.
BMI, body mass index; LTPA, leisure time physical activity; MSKDs, musculoskeletal disorders.
In the context of our object of interest, that is, factors connected with MSKD prevalence, high levels of LTPA, and education demonstrated direct inverse relationships with MSKD prevalence, while high BMI and smoking showed direct relationships with higher MSKD prevalence. Depression had an indirect relationship with MSKDs through BMI, and age had an indirect relationship through smoking or BMI. Income was another primary driver and was associated with either a “protection” against MSKDs via inverse relation with BMI or a “risk” factor for MSKDs via positive relation with smoking. Figure 2 depicts a complete visualization of the network.

Network analysis of selected variables in the PNS2019 survey.
Discussion
In this representative sample in Brazil, we estimated that 41.2 million Brazilian adults present some chronic MSKD. The prevalence of MSKDs was associated with unhealthy lifestyle and socioeconomic factors. Based on the most pivotal nodes in the network analysis, the main factors associated with chronic MSKDs were BMI, drinking, smoking, and low income.
Compared to other countries/regions, the prevalence of chronic MSKDs in Brazil (26.1%) was higher than in England (18.4%), 27 and below the average of European countries (30.0%) 28 and the United States (33.5%). 29 Differences in prevalence across countries may result from distinct surveying approaches, sampling designs, the definition and number of chronic MSKDs surveyed, and access to diagnosis. The prevalence in the PNS2019 was higher than in the previous edition of this survey (21.6%), conducted in 2013 (PNS2013). 11 However, in PNS2013, work-related MSKDs were not included, and unweighted prevalence estimates were used, which may explain this difference. 11
Despite the lifestyle factors studied here may have bidirectional relations with chronic MSKDs,13,14,30–36 our findings concur with other cross-sectional15,32,37–40 and prospective12,14,16,41 population-based studies. Agreeably, higher BMI was associated with the most common chronic MSKDs.3–7,9,10,27,28,42 Importantly, BMI represents the leading attributable factor of disability in general, 43 as well as MSKDs-related burden in high-income countries, 9 with an increasing rate in several regions, including Brazil.3,44,45 Emerging evidence indicates that obesogenic, inflammatory processes, and mechanical loading may underlie the association between MSKDs and high BMI.46,47 Similarly to previous research, our findings support an inverse association between LTPA levels and MSKDs15,40,42,48 and a direct relationship between sleep disorders and depression with these conditions.
The role of lifestyle factors, such as smoking and alcohol consumption, should be emphasized, considering their prominent associations in both analyses performed in this study. Smoking is the third leading attributable risk for years lived with disease due to low back pain, according to the Global Burden of Disease (GBD) Study. 7 In Brazil, the GBD estimates for disability-adjusted life years indicated that smoking is also the top attributable risk factor for low back pain among women aged 50–69 and a risk factor for rheumatoid arthritis. 49 Besides being associated with osteoporosis, tobacco chemicals have been suggested to trigger vasoconstriction, diminishing blood perfusion, and causing malnutrition in intervertebral disc tissue, resulting in degenerative lesions. 49 On the other hand, a meta-analysis of cross-sectional and prospective studies found a dose–response effect for the relationship between alcohol consumption and the risk of gout. 50 Also, heavy alcohol use and chronic pain may mutually contribute to the heightened sensitivity of neural circuits involved in pain perception. 35 Alternatively, assuming reverse causality, the association between these unhealthy lifestyles and chronic MSKDs may be explained by the possibility that individuals suffering from these conditions may engage in habits, such as smoking and alcohol abuse, as a means of coping with pain.34–36
The relationship between sleep disturbances and the severity of chronic pain, a common clinical manifestation of MSKD, has been extensively analyzed in prospective studies, revealing a bidirectional relationship, although the impact of sleep on pain seems to be stronger than the other way around.51,52 The neurophysiological bases that could explain increased pain sensitivity in the presence of a sleep disorder might involve various neurotransmitters that play roles in both the sleep–wake control and nociception modulation, such as opioids, serotonin, dopamine, orexins, melatonin, and the endocannabinoid system, along with the interaction of the immune system. 53 Furthermore, depressive symptoms and depression have been associated with chronic pain. Experiencing low back pain was linked with depressive symptoms or having suffered a previous depression episode, with an odds ratio of 2.21–2.88. 54 In addition, depressive symptoms could mediate the relationship between sleep disorders and chronic pain,55,56 through alterations in diurnal patterns and an increase in arousal. 56
Regarding the inverse association of LTPA with chronic MSKDs, numerous putative underlying mechanisms have been suggested: reduced immune-inflammatory activity,57,58 exercise-induced hypoalgesia59,60 and neuroplasticity, 61 improved cartilage matrix, 62 higher joint hydration and glycosaminoglycan content,63–65 and restrained sarcopenia. 46 Moreover, physical activity may reduce the burden of MSKDs and chronic pain by ameliorating depressive symptoms. 66 The association between LTPA and reduced MSKD frequencies could reflect reverse causality, as it was a cross-sectional study. That is, chronic MKSDs may act as a barrier to engaging in regular LTPA and could also predispose individuals to depression and sleep disorders, creating a potentially vicious cycle of unhealthy lifestyles.
From a public health perspective, the PNS2019 data highlight the need for national health promotion programs focused on the primary and secondary prevention of chronic MSKDs and directing efforts toward these specific lifestyle and socioeconomic factors to yield the greatest overall improvement at the population level. Despite some goals of the previous Brazilian Ministry of Health’s Strategic Action Plan for Coping with Chronic Diseases having been achieved, such as reducing smoking, 67 and increasing LTPA levels, 68 it is evident that there are still multifaceted health challenges that require comprehensive attention. For example, despite the trend of increasing LTPA levels, only 3.7% of the elderly, who are at higher risk of chronic MSKDs, met the international recommendations for muscle-strengthening activities. 69 Furthermore, leveraging multimodal programs in populations at risk could be key to tackling multiple unhealthy lifestyle habits.12,13,15,16,38,62,70,71
The main limitation of this study is its cross-sectional design, which may lead to reverse causality. A caution is needed when interpreting these results, as the analysis of multiple MSKDs combined may introduce associative errors. However, from a public health perspective, establishing associations across diverse MSKDs is valuable for identifying common risk factors that may inform public health strategies in Brazil, where data specific to Latin America are limited. Data on MSKD, lifestyle factors, and anthropometrics were self-reported, introducing potential recall and social desirability biases. Depression was assessed using the PHQ-9, which, while valid, may miss nuances captured in clinical diagnoses. Variables like smoking and alcohol use were categorized broadly, limiting detailed associations with MSKD. LTPA was focused on structured exercises, excluding activities such as household chores and active transportation. Lastly, the survey did not include institutionalized populations, who may have a higher MSKD prevalence.72,73
In conclusion, chronic MSKDs are highly prevalent in Brazil and are associated with several modifiable lifestyle factors, including physical inactivity, overweight and obesity, depression, sleep disorders, smoking, and alcohol consumption. Interventions focused on these modifiable factors should prioritize underserved populations to reduce the burden of MSKDs in Brazil.