
Abstract
Background:
The criteria for remission in both clinical and pathological contexts for lupus nephritis (LN) remain controversial.
Objectives:
To identify optimal short-term goals (remission criteria) for LN predicting long-term success at 5 years, using repeat kidney biopsy (Biopsy 2) and clinical data.
Design:
Single-center observational study.
Methods:
Twenty-three consecutive LN patients undergoing Biopsy 2 2 years post-induction therapy were evaluated. Two ideal long-term goals at 5 years were defined as: “A,” Systemic Lupus Erythematosus Disease Activity Index 2000 (SLEDAI-2K) = 0 and prednisolone (PSL) ⩽5 mg/day, and “B,” proteinuria ⩽0.2 g/day with a normal serum creatinine level and PSL ⩽5 mg/day. Histologically, the electron-dense deposit (EDD) score grades immune deposits based on their intensity, amount, and location. A score of ⩽1 was defined as “electron microscopy remission (ER).”
Results:
Conventional renal indices failed to predict long-term goals. The short-term goals with an accuracy (area under the curve: 95% confidence interval) of ⩾0.8 predicted long-term goals: “A at 5 years” (A-5y), A-2y (0.91: 0.79–1.00), DORIS-R-2y (0.87: 0.72–1.00), EDD score (0.85: 0.70–1.00), B-2y (0.83: 0.66–0.99), and SLEDAI-R-2y (0.82: 0.66–0.98) as well as “B at 5 years” (B-5y), A-2y (0.87: 0.73–1.00), B-2y (0.87: 0.73–1.00), EDD score (0.85: 0.69–1.00), and DORIS-R-2y (0.83: 0.67–0.99). EDD scores predicted A-5y, B-5y, and PSL dose at 5 years in proportion to the score. The clinical and histological goals aligned.
Conclusion:
The best predictive short-term goal was A-2y. Concordance between clinical remission (A-2y, B-2y, and DORIS-R-2y) and histological remission (ER) at 2 years suggests optimal short-term goals for LN.
Keywords
Introduction
Lupus nephritis (LN), one of the most intractable conditions in systemic lupus erythematosus (SLE), can lead to unsatisfactory long-term, renal, and quality-of-life outcomes, even with the current standard of care.1–3 Accurately determining the diagnosis and severity of LN by clinical indicators alone is difficult 4 ; thus, histological confirmation with an initial kidney biopsy (Biopsy 1) is indispensable. Predicting long-term outcomes is also difficult before starting treatment and is limited to the chronicity index (CI) at the time of biopsy 15,6 and serum creatinine (Cr) level.7,5 Therefore, reassessing induction therapy at the “appropriate” timing with “appropriate” short-term goals to modify treatment accordingly is an imperative step. Based on many reports that proteinuric response and serum Cr levels at 6–12 months correlate with long-term outcomes,7–10 various short-term goals (i.e., remission criteria) have been devised with these items. There are conflicting opinions on using urinary sediment and serological indices as remission criteria.11,12 However, one-third of patients with proteinuria ⩽0.5 g/day at 1 year will still have progressive renal damage 13 ; thus, the optimal clinical short-term goals for LN have yet to be established.
Given that clinical indicators alone cannot accurately predict renal histology after the start of induction therapy, a repeat kidney biopsy (Biopsy 2) is performed as needed.14,15 Due to the low incidence of end-stage renal kidney disease in patients with an activity index (AI) of 0 in Biopsy 2, 16 this was conventionally defined as “histological remission.” However, histological and clinical responses to treatment do not match at any time of Biopsy 2 from 6 months to 3 years later; poor renal prognosis is still observed even in cases with AI = 0.16–19 AI = 0 is thus not a short-term goal. The optimal histological short-term goal for LN has not been established. Regarding treatment modification, there are two proven benefits of Biopsy 2. First, higher AI correlates with worsening renal function 20 and early relapse, 18 findings that can be useful in deciding to intensify therapy. Second, AI = 0 in the maintenance phase at 3–4 years after clinical remission is a determinant for discontinuing maintenance therapy without relapse.17,21,22
In our experience, proteinuria improvement reached a plateau after 1 year of induction therapy. In contrast, improvement of the Systemic Lupus Erythematosus Disease Activity Index 2000 (SLEDAI-2K) and glucocorticoid reduction reached a plateau after 2 years. 23 Based on these results, we performed Biopsy 2 at 2 years in patients who provided consent, regardless of clinical remission or nonremission, to histologically confirm the therapeutic response and help determine whether subsequent treatments need to be modified. In clinical practice, Biopsy 2 is often performed in patients with a poor clinical evolution, 20 and information on patients in clinical remission at 2 years is minimal. In addition, our department performs electron microscopy on all patients. Thus, this study aimed to identify the optimal short-term goals (remission criteria) and their timing to predict achieving ideal long-term goals at 5 years, using per-protocol repeat kidney biopsy findings at 2 years post-induction therapy and clinical data up to 5 years.
Materials and methods
Patient selection
This is a single-center observational study, conducted and reported in accordance with the STROBE statement. Forty patients were diagnosed with LN by Biopsy 1 at our hospital between July 2009 and September 2015. Excluding four cases deemed inappropriate by their attending physician (classified as Class II, rapidly progressive glomerulonephritis, aged 79, and with coexisting other nephritis), all 36 received remission induction therapy with a first-line combination treatment of mizoribine (MZB), tacrolimus (TAC), and glucocorticoids according to our protocol. 23 Of these, 24 patients consented to undergo Biopsy 2 at a median of 27 (quartile range: 25–34) months after the start of treatment. Twenty-three patients with adequate renal tissue (⩾10 glomeruli) were included in the analysis. All patients continued on their first-line strategy therapy at the time of Biopsy 2.
Two ideal long-term goals (“A” and “B” at 5 years)
There were no deaths at 5 years among 23 patients, and 1 patient underwent hemodialysis. Given the current inadequate long-term prognosis of patients with LN, we considered the conventional “nondialysis” or “serum Cr level of ⩽1”8,9 as inappropriate goals at 5 years. Thus, we defined the following two criteria from different perspectives as ideal long-term goals at 5 years: “A,” SLEDAI-2K = 0 and prednisolone (PSL) ⩽5 mg/day and “B,” proteinuria ⩽0.2 g/day and normal serum Cr levels and PSL ⩽5 mg/day.
Kidney biopsy and histological outcomes
Using standard techniques, kidney biopsy tissues were processed for light, immunofluorescence, and electron microscopy. Histological evaluation was performed by the following personnel blinded to the patient’s clinical data: light microscopy by our nephrologists, immunofluorescence by our pathologists, and electron microscopy by outsourced pathologists. Light microscopy was used to classify disease types according to the ISN/RPS 2003 classification 24 and evaluate disease severity according to the modified NIH scoring system 25 of AI and CI. AI ⩽ 1 was defined as “light microscopy remission (LR).” Immunofluorescence microscopy was performed to evaluate the presence and pattern of immunoglobulin (Ig) and complement (C) deposits. An intensity of <1+ was defined as negative. Overall, negative staining (IgG, IgA, IgM, C3, and C1q) was defined as “immunofluorescence remission (IR).” Electron microscopy was performed to evaluate the presence and distribution of high electron-density deposits. Electron-dense deposit (EDD) scores (0–3) were defined as follows: 0, complete resolution of every deposit; 1, obsolete deposits or deposits in the mesangial area only; 2, mild-to-moderate deposits in the epithelial and/or endothelial areas; 3, severe deposits in the epithelial and/or endothelial areas. An EDD score of ⩽1 was defined as “electron microscopy remission (ER).”
Clinical data collection and clinical outcomes
Clinical data at baseline (start of remission induction therapy), at 6 and 12 months after starting induction therapy, the time of Biopsy 2, and at 5 years were collected. The following remission criteria were used: “complete renal response (CRR),” proteinuria ⩽0.5 g/day and estimated glomerular filtration rate ⩾60 or a ⩽20% decrease from baseline 26 ; “complete remission (CR),” proteinuria ⩽0.4 g/day, normal urinary sediment and serum albumin (Alb) level ⩾3.5 g/dl, and normal serum Cr level 27 ; “proteinuria ⩽0.2 g/day”; “SLEDAI remission (SLEDAI-R),” SLEDAI-2K = 0; “clinical SLEDAI remission (cSLEDAI-R),” clinical SLEDAI-2K = 0 12 ; “DORIS remission (DORIS-R),” clinical SLEDAI-2K = 0, Evaluator’s Global Assessment <0.5 (0–3), and PSL ⩽5 mg/day with a stable dose of antimalarials, immunosuppressants, or biologic agents 12 ; our defined “A,” SLEDAI-2K = 0 and PSL ⩽5 mg/day and our defined “B,” proteinuria ⩽0.2 g/day, normal serum Cr level, and PSL ⩽5 mg/day. The urinary protein/Cr ratio was used as a substitute for 24-h urinary protein excretion when 24-h urine excretion could not be measured. Normal serum Cr levels were defined as ⩽1 mg/dl in men and ⩽0.8 mg/dl in women. Complement and anti-ds-DNA antibodies were determined according to the institutional criterion. Owing to the retrospective study design, the Evaluator’s Global Assessment data were unavailable and thus omitted from the evaluation. Data at 5 years for one case lost to follow-up was substituted with values obtained at the last visit. There were no missing data concerning the above parameters.
Treatment protocol
Between 2009 and 2015, before the approval of mycophenolate mofetil (MMF) for patients with LN in Japan in 2016, the first-line combination strategy of MZB, TAC, and PSL was our institution’s standard therapy.23,28,29 MZB was developed in Japan and approved for LN in this country in 1990. Its mode of action is similar to that of MMF. The treatment protocol was described in detail in a previous publication. 23 Briefly, patients initially received intravenous methylprednisolone pulse therapy (0.5 g/day for 3 days) followed by oral PSL. The daily dose of PSL was started at 60 mg/day (80 mg/day for patients weighing >60 kg) and then reduced by 10 mg/day every week to reach 30 mg/day, which was followed by further tapering by 5 mg/day at 2-week intervals until the dose reached 20 mg/day. Further tapering to 5 mg/day was allowed if the patient’s condition was stable. The target doses of PSL at months 2, 6, and 12 were 20, 10, and 5 mg/day, respectively.
The initial MZB dose was 300 mg/day once daily for 3 days per week.28,29 Peak blood concentration (C3) was measured once or twice during the hospital stay to assess the therapeutic range. 29 The initial TAC dose was 3 mg/day once daily. Blood trough concentration was measured every week during the hospital stay and at every outpatient visit, and the dose was reduced if the blood trough concentration was >10 ng/ml or the serum Cr level was dangerously elevated. 29 The maximum doses of MZB and TAC were 300 and 3 mg/day, respectively.
When a treated patient achieved SLEDAI remission (=0) and/or the PSL dose could be tapered to 5 mg/day, either MZB or TAC was discontinued, while the remaining drug was continued as maintenance therapy. In case of treatment failure or relapse, second-line therapy (intravenous cyclophosphamide [IVCY] or MMF plus TAC) was initiated.
After 2 years, Biopsy 2 was recommended for all patients, whether in clinical remission or not, to confirm the histological response. If high disease activity, which could not be overlooked, remained (a high AI score), the patient was transitioned to second-line therapy. If immunological activity (non-IR or non-ER) alone remained, we refrained from further reduction of the PSL dose and/or immunosuppressant.
Statistical analysis
Data are presented as median (interquartile range (IQR)) or number of patients (percentages) unless otherwise specified. Continuous variables were compared using the Student’s t-test or the Mann–Whitney U test depending on data distribution. Categorical variables were compared using Fisher’s direct probability test. The area under the receiver-operating characteristic curve (AUC) was used to evaluate the predictive performance of potential short-term goals for predicting long-term goals. A p-value <0.05 indicated a statistically significant difference. All statistical analyses were performed using EZR ver. 1.60 (Saitama Medical Center, Jichi Medical University, Saitama, Japan).
Results
Patient background at baseline and at the time of Biopsy 2
Patient background characteristics at baseline and at the time of Biopsy 2 are shown in Table 1. The ISN/RPS classifications at the time of Biopsy 1 were as follows: Class III, 3; IV, 8; V, 2; and III + V and IV + V, 10. Biopsy 2 was performed at a median of 27 (quartile range: 25–34) months after starting treatment. At the time of Biopsy 2, proteinuria ⩽0.2 g/day was present in 20 patients (87%), the median serum Cr level was 0.70 (0.66–0.86) mg/dl, and the median PSL dose was 5 (5–7.5) mg/day. At the time of Biopsy 2, SLEDAI remission was achieved in 14 patients (61%), “A” in 12 (52%), and “B” in 12 (52%). Histologically, 17 patients (74%) had “LR,” 8 (35%) had “IR,” and 13 (57%) had “ER.”
Patient background characteristics at baseline and at the time of Biopsy 2 and outcomes at 5 years.

Data are shown as the median (IQR) or the number of patients (percentage).
AI, activity index; CI, chronicity index; Cr, creatinine; CR, complete remission; CRR, complete renal response; DORIS, definitions of remission in SLE; eGFR, estimated glomerular filtration rate; ER, electron microscopy remission; IQR, interquartile range; IR, immunofluorescence remission; LR, light microscopy remission; MZB, mizoribine; PSL, prednisolone; SLEDAI, systemic lupus erythematosus disease activity index; TAC, tacrolimus.
Potential indicators of the ideal long-term goals
Clinical and histological indices up to the time of Biopsy 2 that predict the ideal long-term goals (“A” and “B” at 5 years, A-5y and B-5y) are shown in Table 2. The indices that were correlated with the achievement of both A-5y and B-5y simultaneously are none at baseline; SLEDAI-2K score at 6 months; C3 levels, SLEDAI-2K score, and PSL dose at 12 months; C3 levels, SLEDAI-2K score, SLEDAI-R, DORIS-R, A-2y, B-2y, PSL dose, ER, and EDD score at the time of Biopsy 2.
Potential indicators that predict the ideal long-term goals (“A” and “B” at 5 years).

Data are shown as the median (IQR) or the number of patients (percentage). The indicators that can predict both the ideal 5-year goals, A-5y and B-5y, are highlighted in bold. A-5y, “A” goal at 5 years defined as SLEDAI-2K = 0 and PSL ⩽5 mg/day; B-5y, “B” goal at 5 years defined as proteinuria ⩽0.2 g/day and normal serum Cr levels and PSL ⩽5 mg/day; A-2y, “A” goal at 2 years; B-2y, “B” goal at 2 years; A-12m, “A” goal at 12 months; B-12m, “B” goal at 12 months.
AI, activity index; CI, chronicity index; Cr, creatinine; CR, complete remission; CRR, complete renal response; cSLEDAI-R, Clinical Systemic Lupus Erythematosus Disease Activity Index Remission; DORIS, definitions of remission in SLE; EDD, electron-dense deposit; eGFR, estimated glomerular filtration rate; ER, electron microscopy remission; IQR, interquartile range; IR, immunofluorescence remission; LR, light microscopy remission; PSL, prednisolone; SLEDAI-R, Systemic Lupus Erythematosus Disease Activity Index Remission.
Time course of the predictive performance of candidate short-term goals toward the ideal long-term goals
The time course of the predictive performance of the candidate’s short-term goals toward the ideal long-term goals (A-5y and B-5y) by comparing the AUC is shown in Figure 1. The short-term goals with an accuracy (AUC: 95% confidence interval) of ⩾0.8 to predict the long-term goals were as follows: “A-5y,” A-2y (0.91: 0.79–1.00), DORIS-R-2y (0.87: 0.72–1.00), EDD score (0.85: 0.70–1.00), B-2y (0.83: 0.66–0.99), and SLEDAI-R-2y (0.82: 0.66–0.98) as well as “B-5y,” A-2y (0.87: 0.73–1.00), B-2y (0.87: 0.73–1.00), EDD score (0.85: 0.69–1.00), and DORIS-R-2y (0.83: 0.67–0.99). The best predictive short-term goal was A-2y.
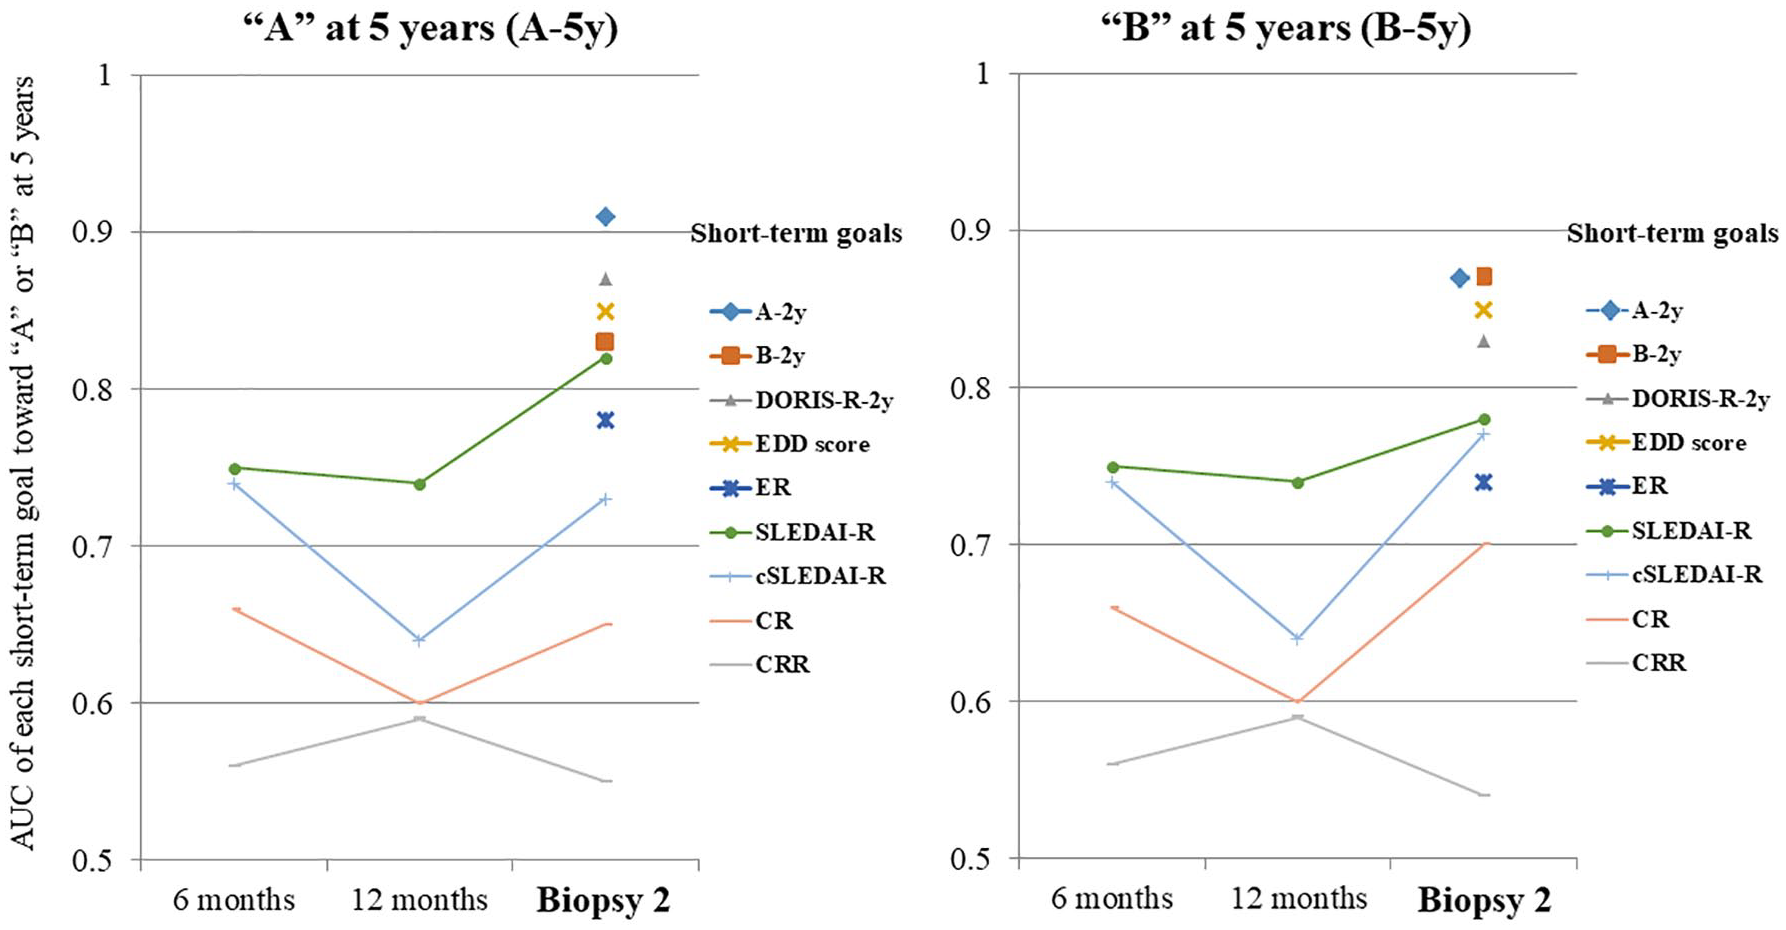
Time course of the predictive performance of candidate short-term goals toward ideal long-term goals (“A” and “B”).
The short-term goals, such as proteinuria, CR, and CRR, consisting solely of renal indices, had low predictive performance for long-term goals.
Usefulness of pathological targets on Biopsy 2 for predicting long-term outcomes
The interrelationships among pathological targets on Biopsy 2 (AI ⩽1, IR, EDD score ⩽1) and between short- and long-term goals (A-5y and B-5y) are shown in Figure 2. The electron microscopy evaluation had a higher predictive ability (AUC of 0.78 and LR+ of 3.06 for A-5y; AUC of 0.74 and LR+ of 2.46 for B-5y) than light or immunofluorescence microscopy. EDD scores and grading of immune deposits based on their intensity, amount, and location were useful in predicting A-5y, B-5y, and PSL doses at 5 years in proportion to the score (Figure 3 and Table 3).

The usefulness of Biopsy 2 pathological targets for predicting long-term outcomes.

The association between EDD score and long-term outcomes.
Patient background characteristics and outcomes at 5 years based on the EDD scores at the time of Biopsy 2.

Data are shown as the median (IQR) or the number of patients (percentage).
A-5y, “A” goal at 5 years defined as SLEDAI-2K = 0 and PSL ⩽5 mg/day; B-5y, “B” goal at 5 years defined as proteinuria ⩽0.2 g/day, normal serum Cr levels, and PSL ⩽5 mg/day; A-2y, “A” goal at 2 years; B-2y, “B” goal at 2 years.
EDD score, electron-dense deposit score; Cr, creatinine; eGFR, estimated glomerular filtration rate; IQR, interquartile range; PSL, prednisolone; SLEDAI-2K, Systemic Lupus Erythematosus Disease Activity Index 2000.
Interrelationships among candidate short-term goals and between short- and long-term goals
The interrelationships among candidate short-term goals (A-2y, B-2y, DORIS-R-2y, and ER) and between short- and long-term goals (A-5y and B-5y) are shown in Figure 4. The clinical goals of A-2y, B-2y, and DORIS-R-2y were highly consistent. The histologically defined ER was also well-matched with the abovementioned three clinical goals. These measures efficiently predicted A-5y and B-5y. Despite being defined from different perspectives, the patients meeting A-5y and B-5y were nearly identical.

Interrelationship among the candidate’s short-term goals and between the short- and long-term goals.
Discussion
This study demonstrated the usefulness of electron microscopic evaluation of Biopsy 2 at 2 years. The ER and EDD scores predicted the long-term goals at 5 years. These results are reasonable and consistent with the pathogenesis of LN. The five findings that characterize LN are “full-house” staining by immunofluorescence, intense C1q staining, extraglomerular deposits, combined subendothelial and subepithelial deposits, and endothelial tubuloreticular inclusions. 30 Even though the abovementioned findings can be obtained by immunofluorescence and electron microscopy, conventional histological evaluations were based on light microscopic findings alone, defining “AI = 0 as histological remission.”
In addition, we first demonstrated a concordance between clinical and histological remissions as defined clinically by “A,” “B,” and “DORIS remission,” and histologically by “ER,” suggesting optimal short-term goals for LN.
Conventional renal indices, such as proteinuria levels, CR, and CRR, could not predict the ideal long-term goals. This finding is consistent with that of studies reporting that proteinuria and serum Cr levels do not correlate quantitatively with AI and do not accurately reflect the response to induction therapy. 31 If renal indices are used, the PSL dose should be added as observed in “B,” with proteinuria ⩽0.2 g/day, normal Cr level, and PSL ⩽5 mg/day. As the PSL dose is carefully reduced while monitoring the treatment response, achieving “PSL ⩽5 mg/day” represents a favorable clinical course.
Setting ideal long-term goals first was beneficial in identifying the short-term goals. The short-term goals to be achieved depend on the long-term goals set. For example, a short-term goal of “proteinuria ⩽0.8 or 0.7 g/day at 12 months” was identified for the long-term goal of “serum Cr ⩽1 mg/dl at 7 years;” however, its prediction accuracy was not very good.8,9 We defined two long-term goals at 5 years: “A,” which would be considered ideal for rheumatologists, and “B,” for nephrologists. Even though both criteria were defined from different perspectives, as shown in Figure 2, the patient groups who met each goal were concordant at 2 and 5 years. This finding indicates that both “A” and “B” are ideal short- and long-term goals. Additionally, in our previous report, 23 cases that achieved “A” maintained remission without relapse for up to 5 years, suggesting that “A” is an excellent short-term goal.
SLEDAI-R-2y was more predictive than cSLEDAI-R-2y, and A-2y was more predictive than DORIS-R-2y, suggesting target superiority, including serologic indices. A-2y was a better predictor than SLEDAI-R-2y, and DORIS-R-2y was a better predictor than cSLEDAI-R-2y, suggesting target superiority, including the PSL dose. However, considering that the difference in predictive performance between “A” and “DORIS-R” was small in this study, the merits and demerits of aiming for the normalization of serological indices should be carefully judged in each case. Further prospective comparisons of the long-term outcomes are needed to determine the optimal goal.
The present study has some limitations. First, the dosing of PSL is susceptible to variations in prescribing behavior and practices among different clinicians. This variability could potentially influence the attainment of outcomes “A” and “B.” Second, future prospective studies are warranted to determine how maintenance therapy can be tapered in patients meeting ER at 2 years and how treatment should be modified for patients presenting with residual activity of non-ER. Third, our results need to be validated with various induction regimens. Each treatment regimen may have a different short-term goal and timing. Regarding maintenance therapy, no difference was observed in histological findings between the MMF and AZA groups post-induction with IVCY and the subsequent 2 years of maintenance therapy with these drugs. 32 Since the publication of the Japanese Guideline for the Management of Systemic Lupus Erythematosus, our department has switched to MMF as a first-line treatment; thus, we plan to compare the results of the MMF groups with our present findings. Finally, this is a single-center, retrospective study with a small number of cases and without sample size calculation. This may limit the generalizability of the findings and increase the risk of type II errors, potentially leading to underpowered results that might miss detecting significant differences or associations. Nevertheless, the fact that the results were as expected with statistically significant differences suggests that the present findings are truly clinically important.
Conclusion
The best predictive short-term goal was A-2y, that is, SLEDAI-R and PSL ⩽5 mg/day at 2 years. Thus, we recommend adjusting medications with the aim of SLEDAI-R in the early stage, subsequently aiming for “A” by 2 years. B-2y, that is, proteinuria ⩽0.2 g/day, normal Cr level, and PSL ⩽5 mg/day, DORIS-R-2y, and ER can be alternative short-term goals. The concordance between clinical and histological remissions at 2 years was demonstrated for the first time with these newly defined remission criteria. If only the renal indices are targeted, the ideal long-term prognosis will not be achieved. The comprehensive criteria, including the PSL dose, are useful but somewhat subjective. Achieving ER on repeat kidney biopsy indicates that the patient is in good histological remission. Future prospective studies are needed to determine how the treatment should be modified for patients presenting residual activity on electron microscopy.