
Abstract
Background:
Thyroid hormones are known to regulate bone metabolism and may influence bone mineral density (BMD), as well as the risk of osteoporosis (OP) and fractures in patients with type 2 diabetes mellitus (T2DM). Recently, sensitivity to thyroid hormone indices has been linked with T2DM and OP independently. However, the relationship between thyroid hormone sensitivity and OP in euthyroid T2DM patients has yet to be investigated.
Objectives:
The aim of this study was to determine the association between sensitivity to thyroid hormone indices and the risk of OP in euthyroid patients with T2DM.
Design:
This study employed a retrospective, cross-sectional design and utilized data acquired from the Cangzhou Central Hospital in China between 2019 and 2020.
Methods:
We retrospectively analyzed the data of 433 patients with T2DM for anthropometric measurements, clinical laboratory test results, and BMD. The thyroid-stimulating hormone index, thyrotroph thyroxine resistance index, and thyroid feedback quantile-based index (TFQI) were calculated to determine thyroid hormone sensitivity. Finally, multivariable logistic regression, generalized additive models, and subgroup analysis were performed to detect the association between sensitivity to thyroid hormone indices and the risk of OP in these patients.
Results:
We did not observe a statistically significant linear relationship between sensitivity to thyroid hormones indices and OP after covariate adjustment. However, a nonlinear relationship existed between TFQI and the prevalence of OP. The inflection point of the TFQI was at −0.29. The effect sizes (odds ratio) on the left and right of the inflection point were 0.07 [95% confidence interval (CI): 0.01–0.71; p = 0.024] and 2.78 (95% CI: 1.02–7.58; p = 0.046), respectively. This trend was consistent in older female patients with higher body mass index (BMI; 25–30 kg/m2).
Conclusion:
An approximate U-shaped relationship was observed between sensitivity to thyroid hormone indices and OP risk in euthyroid patients with T2DM with variations in sex, age, and BMI. These findings provide a new perspective to elucidate the role of thyroid hormones in OP, specifically in patients with T2DM.
Introduction
Type 2 diabetes mellitus (T2DM) and osteoporosis (OP) are common chronic diseases worldwide, and their correlation is becoming a prominent area of research. 1 The incidence of OP in Chinese patients with T2DM is 37.8%, which is four to five times higher than that in non-diabetes patients. 2 OP has been recognized as one of the most common complications of T2DM, which seriously affects the quality of life of patients and imposes a substantial economic burden on the global healthcare systems. 3 Therefore, identifying the risk factors for OP in patients with T2DM is crucial for developing effective prevention and management strategies.
The risk factors of OP in individuals with diabetes are multifactorial, including obesity, increased insulin resistance, blood sugar disturbances, production of advanced glycation end products, muscle dysfunction, macro- and micro-vascular complications, and certain medications, which can lead to bone mass destruction and microstructural changes. Additionally, comorbidities commonly associated with diabetes, such as thyroid disorders, gonadal dysfunction, and malabsorption, may also contribute to bone loss.4,5
Thyroid hormones are essential for normal bone development and metabolism in adults, and thyroid dysfunction can have a detrimental impact on bone structure. However, numerous studies investigating this relationship are controversial and inconclusive.6,7 Hyperthyroidism leads to enhanced osteoclast activity and OP, and patients with hypothyroidism have increased bone mineralization.8,9 Recently, several authors have reported that thyroid status may be a continuous variable related to bone mineral density (BMD) and strength, even within normal reference ranges.10–13 Some authors have suggested that low thyroid-stimulating hormone (TSH) or high thyroid hormone levels (within the normal range) lead to low BMD and increased fracture odds, whereas others have failed to establish this relationship.11,14 However, most of these conflicting studies focused on postmenopausal women and normal populations, making it unclear whether these results could be extrapolated to other populations. Currently, limited studies have explored the correlation between thyroid hormones and bone loss among euthyroid patients with T2DM.
Thyroid function is clinically evaluated by measuring serum triiodothyronine (FT3), free thyroxine (FT4), and TSH concentrations. However, either FT4 or TSH may not appropriately reflect the regulation of thyroid hormone homeostasis. 15 Therefore, sensitivity to thyroid hormone indicators, including thyrotrophic T4 resistance index (TT4RI), TSH index (TSHI), and thyroid feedback quantile-based index (TFQI), have been proposed as quantitative markers of pituitary thyrotropic function for a comprehensive interpretation of thyroid status.16,17 Recently, sensitivity to thyroid hormone indices has been linked with T2DM, obesity, metabolic syndrome, and non-alcoholic fatty liver disease (NAFLD).18,19 Notably, reduced sensitivity to thyroid hormones was associated with T2DM and OP independently.18,20–22 However, to our knowledge, the relationship between sensitivity to thyroid hormone indices and the risk of OP in patients with T2DM has not been reported, which highlights an important research gap. Therefore, we conducted a population-based study to gain new insights into the association between thyroid hormone sensitivity and OP risk in euthyroid men and women (in the postmenopausal stage) with T2DM.
Materials and methods
Study population
We conducted a hospital-based cross-sectional study to examine the data of 433 patients with T2DM who were admitted to the Endocrinology Department of Cangzhou Central Hospital from January 2019 to December 2020. Sample size calculation and power analysis were conducted using G*Power 3.1 statistical program (University of Düsseldorf, Germany) to determine the appropriate sample size for logistic regression. Our primary outcome was the risk of OP. We set the statistical power at 0.8, the significance level at 0.05, and anticipated a moderate effect size [odds ratio (OR) = 2.0] for the regression models. Based on preliminary data, we estimated that a minimum of 337 patients would be required, considering a 20% rate of loss to follow-up. We determined that a total sample size of 433 participants would provide sufficient statistical power for our analyses. To verify the validity of our sample size calculations and assess the robustness of our regression models, we conducted computer simulations using Monte Carlo methods.
The inclusion criteria were: (a) men aged ⩾50 years and postmenopausal women; (b) individuals diagnosed with T2DM according to the World Health Organization (WHO 1999) criteria 23 ; (c) individuals diagnosed with OP based on the WHO (2015) diagnostic criteria 24 ; (d) people with normal thyroid function and negative autoantibodies, including antibodies against thyroid peroxidase (TPO), thyroglobulin, or thyrotropin receptor. Patients excluded from the study included those who had any acute complication of diabetes, a history of thyroid disease, or any other endocrine disorder affecting bone metabolism, sex hormones, and thyroid function (e.g., hypopituitarism, Addison’s disease, Cushing syndrome, pituitary adenoma, parathyroid disease, or hypogonadism), severe infection, inflammatory disease, malignant tumors, severe liver or renal dysfunction, or other secondary OP. In addition, patients taking medications or drugs that alter bone metabolism, sex hormones, and thyroid function were also excluded from the study.
Assessment of thyroid function
Serum FT3, FT4, TSH, and anti-TPO antibody (reference range: 0–34.0 IU/mL) concentrations were measured using an electrochemiluminescence analyzer (Cobas e601, Roche, Basel, Switzerland). Patients with TSH, FT3, and FT4 in the range of 0.27–4.20 m/L, 3.08–6.78 pmol/L, and 11.97–21.88 pmol/L were defined as patients with euthyroidism.
Indices of thyroid hormone sensitivity
Three indices, including TSHI, TT4RI, and TFQI, were calculated to evaluate the central sensitivity to thyroid hormones. TSHI and TT4RI were calculated as previously described, 15 and TFQI was calculated using the method proposed by Laclaustra et al. 18 Lower TT4RI, TSHI, and TFQI values indicated higher central sensitivity to thyroid hormones.
(1) TSHI = ln TSH (mIU/L) + 0.1345 × FT4 (pmol/L)
(2) TT4RI = FT4 (pmol/L) × TSH (mIU/L)
(3) TFQI = cdfFT4 − (1−cdfTSH)
Clinical and laboratory data of patients
The covariates were demographic information, clinical data, and laboratory data. We collected data on demographic parameters, including age, sex, height, and weight, and clinical parameters, including blood pressure, previous history of hypertension, and diabetes duration. Body mass index (BMI) was calculated by dividing weight by height squared (kg/m2). Homeostasis model assessment of insulin resistance (HOMA-IR) score was derived from the formula: fasting glucose (mmol/L) × fasting insulin (pmol/L)/22.5. The estimated glomerular filtration rate (eGFR) was calculated using the modification of diet in renal disease (MDRD) GFR equation. Hypertension was defined as systolic blood pressure ⩾140 mmHg and diastolic blood pressure ⩾90 mmHg (or the use of antihypertensive drugs). We also obtained the data of the following variables from the Hospital Information System: aspartate aminotransferase, alanine aminotransferase, serum creatinine, urea nitrogen, hemoglobin A1c, fasting blood glucose, fasting blood insulin, total cholesterol (TC), triglyceride (TG), high-density lipoprotein cholesterol (HDL-C), low-density lipoprotein cholesterol (LDL-C), serum 25-hydroxyvitamin D [25(OH)D], serum calcium, and serum phosphorus concentrations.
Statistical analysis
Continuous variables were represented as mean ± standard deviation or median (quartiles), and categorical variables were represented as frequencies or percentages. Statistical differences in means and proportions between groups were determined using one-way analysis of variance (normal distribution), Kruskal–Wallis test (skewed distribution), and Chi-square test (categorical variables).
We used a generalized additive model (GAM) for a preliminary understanding of the relationship between sensitivity indices and OP risk. If a linear relationship was observed between the two variables, univariate and multivariate linear regression models were used to evaluate their relationship. We complied with STROBE guidelines and constructed three models, namely an unadjusted model, a model adjusted to demographics, and a fully adjusted model. The adjusted variables for the fully adjusted model were the relevant covariates that affected the matched odds ratio by at least 10% when added to this model (considering the nonlinear relationship of these variables with OP). If a nonlinear correlation was found, a two-piecewise linear regression model was used to determine the threshold effect of the indices of thyroid hormone sensitivity and the risk of OP in terms of the smoothing plot. When the ratio of thyroid hormone sensitivity to OP was visible in a smooth curve, the recursive method automatically calculated the inflection point at which the maximum model likelihood was used. Then, the subgroup analyses were performed using stratified binary logistic regression models. The likelihood ratio test investigated the modification and interaction of subgroups to find the effect modifying factors that interfered with their relationship. Finally, the effects of potential confounders or modifiers were expelled to reveal the independent effect on indices of thyroid hormone sensitivity and OP. In addition, hierarchical interaction analyses were performed to explore the robustness of the results in different subgroups.
All analyses were performed using the statistical software packages R (http://www.R-project.org, The R Foundation) and EmpowerStats (http://www.empowerstats.com, X&Y Solutions, Inc., Boston, MA, USA). p Values below 0.05 (two-sided) were considered statistically significant.
Results
Baseline characteristics of the study participants with or without OP
Table 1 presents the demographic characteristics of the 433 participants included in our study. The OP group had more females than the non-OP group. Participants in the OP group were older and had lower BMI, eGFR, serum 25(OH)D concentrations, and a longer duration of diabetes than those in the non-OP group. However, FT3, FT4, TSH, TSHI, TT4RI, and TFQI values were not significantly different between the two groups (p > 0.05).
Clinical and laboratory characteristics of the study participants.
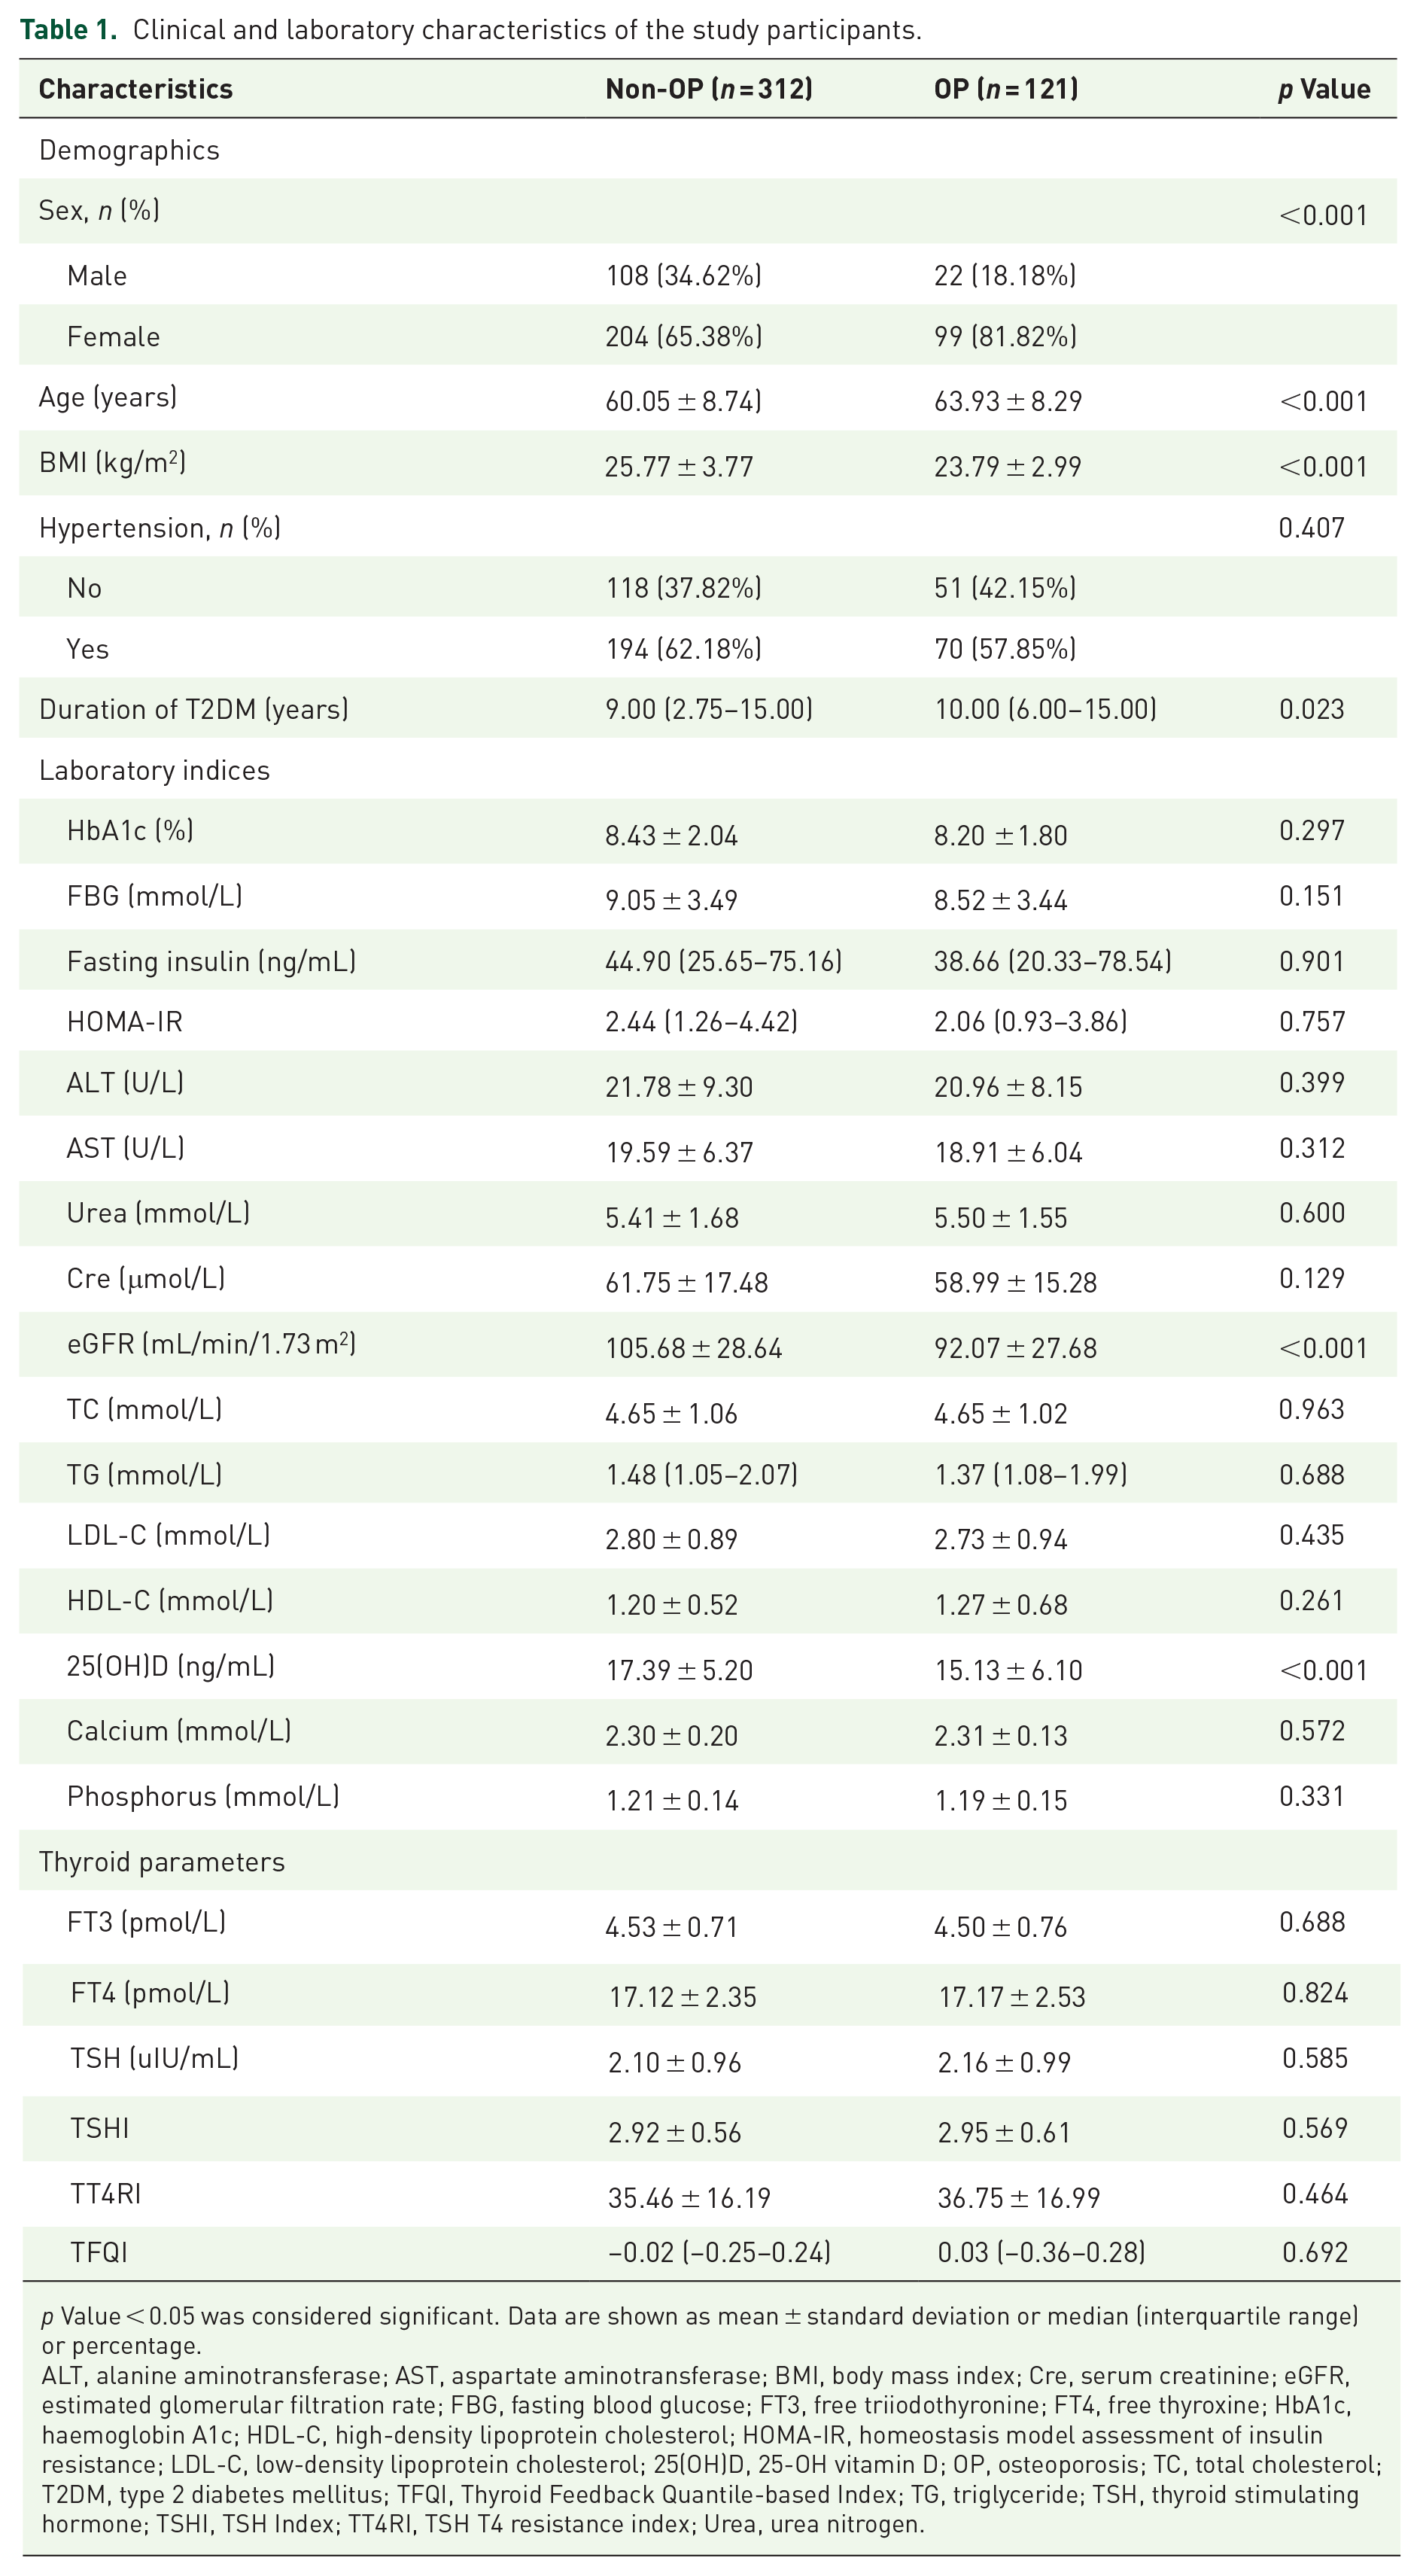
p Value < 0.05 was considered significant. Data are shown as mean ± standard deviation or median (interquartile range) or percentage.
ALT, alanine aminotransferase; AST, aspartate aminotransferase; BMI, body mass index; Cre, serum creatinine; eGFR, estimated glomerular filtration rate; FBG, fasting blood glucose; FT3, free triiodothyronine; FT4, free thyroxine; HbA1c, haemoglobin A1c; HDL-C, high-density lipoprotein cholesterol; HOMA-IR, homeostasis model assessment of insulin resistance; LDL-C, low-density lipoprotein cholesterol; 25(OH)D, 25-OH vitamin D; OP, osteoporosis; TC, total cholesterol; T2DM, type 2 diabetes mellitus; TFQI, Thyroid Feedback Quantile-based Index; TG, triglyceride; TSH, thyroid stimulating hormone; TSHI, TSH Index; TT4RI, TSH T4 resistance index; Urea, urea nitrogen.
Associations between sensitivity to thyroid hormone indices and OP
Supplemental Table S1 shows the multivariate regression analysis between sensitivity to thyroid hormone indices and OP in patients with T2DM. TSHI, TT4RI, and TFQI were not associated with the risk of OP in the unadjusted, minimally adjusted, and fully adjusted models (p > 0.05). We converted TSHI, TT4RI, and TFQI from continuous variables to categorical variables (according to quartile) for sensitivity analysis and the categorical-transformed variables were then reintroduced into the model; however, the trend was not significant among different quartiles (p > 0.05).
The results obtained from multivariate models based on logistic regression were not statistically significant. Therefore, we speculated that a nonlinear relationship may exist between sensitivity to thyroid hormone indices and the prevalence of OP. We used the GAM and smooth curve fitting and observed an approximate U-shaped relationship between the sensitivity to TFQI and unfavorable OP risk in patients with T2DM, which was evident in both unadjusted (Figure 1(a)–(c)) and adjusted models (Figure 1(d)–(f)) (sex, age, BMI, duration of T2DM, HbA1c, HOMA-IR, eGFR, TC, TG, LDL-C, HDL-C, 25(OH)D, FT3, and FT4 were adjusted).

Association between sensitivity to thyroid hormone indices (TSHI, TT4RI, and TFQI) and the prevalence of OP in euthyroid patients with T2DM in unadjusted (a) to (c) and adjusted (d) to (f) models. Solid and dashed lines represent the estimated values and their corresponding 95% confidence interval, respectively. The adjustment factors were sex, age, BMI, duration of T2DM, HbA1c, HOMA-IR, eGFR, TC, TG, LDL-C, HDL-C, 25(OH)D, FT3, and FT4.
Then, we modeled data to a piecewise binary logistic regression model to fit two different slopes and selected the best-fit model using the log-likelihood ratio test. We obtained the inflection point of TSHI, TT4RI, and TFQI using a recursive algorithm, and then calculated the effect sizes and confidence interval on the left and right sides of the inflection point (Table 2). The results showed a threshold effect for TFQI (but not for TSHI and TT4RI) which were consistent with the smoothing curve fitting (Figure 1). However, the results were different for unadjusted and adjusted models. We calculated that the inflection point was −0.27 using a two-piecewise linear regression model (unadjusted). On the left of the inflection point, TFQI was negatively correlated with the incidence of OP (OR = 0.1; 95% CI: 0.02–0.55; p = 0.008), whereas on the right side, we observed a positive relationship between TFQI and OP (OR = 2.51; 95% CI: 1.16–5.42; p = 0.019). After adjusting for covariates, the inflection point remained the same, and effect sizes (OR) on the left and right of the inflection point at −0.29 were 0.07 (95% CI: 0.01–0.71; p = 0.024) and 2.78 (95% CI: 1.02–7.58; p = 0.046), respectively.
Threshold effect analysis of sensitivity to thyroid hormone indices on OP using the two-piecewise linear regression model.

Crude model was adjust for: None. Adjusted model was adjust for: sex; age (smooth); BMI (smooth); duration of T2DM (smooth); HbA1c; HOMA-IR; eGFR (smooth); TC; TG; LDL-C; HDL-C; 25(OH)D (smooth); FT3; FT4. p Value < 0.05 was considered significant.
BMI, body mass index; CI, confidence interval; DR, diabetic retinopathy; eGFR, estimated glomerular filtration rate; FT3, free triiodothyronine; FT4, free thyroxine; HbA1c, glycated hemoglobin; HDL-C, high-density lipoprotein cholesterol; HOMA-IR, homeostasis model assessment of insulin resistance; LDL-C, low-density lipoprotein cholesterol; 25(OH)D, 25-OH vitamin D; OP, osteoporosis; OR, odds ratio; Ref, reference; TC, total cholesterol; TFQI, Thyroid Feedback Quantile-based Index; TG, triglyceride; TSHI, TSH Index; TT4RI, TSH T4 resistance index.
Associations between sensitivity to thyroid hormone indices and OP stratified by sex, age, and BMI
We determined whether the nonlinear relationship between sensitivity to thyroid hormone indices and OP risk was stable in different subgroups. Hierarchical and interactive analyses with sex, age, and BMI as the stratified variables were performed to determine the trends in effect sizes. The results of smooth curve-fitting and threshold effect analysis showed that sex (Table 3; Figure 2(a)–(c)), age (Table 4; Figure 2(d)–(f)), and BMI (Table 5; Figure 2(g)–(i)) played interactive roles in nonlinear relationships between sensitivity to thyroid hormone indices and the incidence of OP; however, interactive differences were not statistically significant. After adjusting for covariates, a similar nonlinear relationship and threshold effect to the general population between TFQI and the prevalence of OP was detected in females (Figure 2(c)) (TFQI ⩾ −0.73) with effect sizes (OR) of 0.01 (95% CI: 0.00–1.03; p = 0.051) and 4.25 (95% CI: 1.12–16.06; p = 0.032) on the left and right side of the inflection point at −0.31, respectively. Similar parameters were detected in the elderly (>60) (Figure 2(f)), with effect sizes (OR) of 0.02 (95% CI: 0.00–0.70; p = 0.032) and 3.83 (95% CI: 1.01–14.52; p = 0.048) on the left and right side of the inflection point at −0.35, respectively, and in overweight individuals (BMI: 25–30 kg/m2) (Figure 2(i)) with effect sizes (OR) of 0.01 (95% CI: 0.00–0.05; p = 0.002) and 3.00 (95% CI: 0.58–15.55; p = 0.190) on the left and right side of the inflection point at −0.36, respectively. We also calculated inflection points for the relationships between the sensitivity to thyroid hormone indices (TFQI, TSHI, and TT4RI) and OP in other subgroups. However, we observed either a non-curved or irregularly curved relationship.
Threshold effect analysis of sensitivity to thyroid hormone indices on OP using the two-piecewise linear regression model with sex differences.

Sex; age (smooth); BMI (smooth); duration of T2DM (smooth); HbA1c; HOMA-IR; eGFR (smooth); TC; TG; LDL-C; HDL-C; 25(OH)D (smooth); FT3;FT4 were adjusted. p value < 0.05 was considered significant.
BMI, body mass index; CI, confidence interval; eGFR, estimated glomerular filtration rate; FT3, free triiodothyronine; FT4, free thyroxine; HbA1c, glycated hemoglobin; HDL-C, high-density lipoprotein cholesterol; HOMA-IR, homeostasis model assessment of insulin resistance; LDL-C, low-density lipoprotein cholesterol; 25(OH)D, 25-OH vitamin D; OP, osteoporosis; OR, odds ratio; Ref, reference; TC, total cholesterol; TFQI, Thyroid Feedback Quantile-based Index; TG, triglyceride; TSHI, TSH Index; TT4RI, TSH T4 resistance index.

Association between sensitivity to thyroid hormone indices (TSHI, TT4RI, and TFQI) and the prevalence of OP in euthyroid patients with T2DM stratified by sex (a) to (c), age (d) to (f), and BMI (h) to (i). Sex, age, BMI, duration of T2DM, HbA1c, HOMA-IR, eGFR, TC, TG, LDL-C, HDL-C, 25(OH)D, FT3, and FT4 were adjusted.
Threshold effect analysis of sensitivity to thyroid hormone indices on OP using the two-piecewise linear regression model with age differences.

Sex; age (smooth); BMI (smooth); duration of T2DM (smooth); HbA1c; HOMA-IR; eGFR (smooth); TC; TG; LDL-C; HDL-C; 25(OH)D (smooth); FT3; FT4 were adjusted. p value < 0.05 was considered significant.
BMI, body mass index; CI, confidence interval; eGFR, estimated glomerular filtration rate; FT3, free triiodothyronine; FT4, free thyroxine; HbA1c, glycated hemoglobin; HDL-C, high-density lipoprotein cholesterol; HOMA-IR, homeostasis model assessment of insulin resistance; LDL-C, low-density lipoprotein cholesterol; 25(OH)D, 25-OH vitamin D; OP, osteoporosis; OR, odds ratio; Ref, reference; TC, total cholesterol; TFQI, Thyroid Feedback Quantile-based Index; TG, triglyceride; TSHI, TSH Index; TT4RI, TSH T4 resistance index.
Threshold effect analysis of sensitivity to thyroid hormone indices on OP using the two-piecewise linear regression model with BMI differences.

Sex; age (smooth); BMI (smooth); duration of T2DM (smooth); HbA1c; HOMA-IR; eGFR (smooth); TC; TG; LDL-C; HDL-C; 25(OH)D (smooth); FT3; FT4 were adjusted. p value < 0.05 was considered significant.
BMI, body mass index; CI, confidence interval; eGFR, estimated glomerular filtration rate; FT3, free triiodothyronine; FT4, free thyroxine; HbA1c, glycated hemoglobin; HDL-C, high-density lipoprotein cholesterol; HOMA-IR, homeostasis model assessment of insulin resistance; Inf, infimum; LDL-C, low-density lipoprotein cholesterol; 25(OH)D, 25-OH vitamin D; OP, osteoporosis; OR, odds ratio; Ref, reference; TC, total cholesterol; TFQI, Thyroid Feedback Quantile-based Index; TG, triglyceride; TSHI, TSH Index; TT4RI, TSH T4 resistance index.
Discussion
Here, we investigated the relationship between thyroid hormone sensitivity and the risk of OP in euthyroid men and women (in the postmenopausal stage) with T2DM. We observed an approximate U-shaped relationship between sensitivity to TFQI and the prevalence of OP in euthyroid T2DM patients. In subgroup analyses stratified by sex, age, and BMI, a similar relationship between TFQI and OP was observed in females, elderly, and overweight patients within a certain range. To our knowledge, we used sensitivity to thyroid hormone indices rather than FT3, FT4, and TSH as predictors of OP in euthyroid T2DM patients for the first time. The nonlinear relationship provided new insight into the relationship between thyroid function and OP in euthyroid patients with T2DM. However, as mentioned below, this finding needs to be interpreted with caution.
Thyroid hormones play important roles in bone development and growth; moreover, they are critical for maintaining bone mass and strength in adults. Thyroid dysfunction is one of the multiple risk factors for OP. Hyperthyroidism results in bone loss and increased bone fragility, whereas hypothyroidism leads to delayed skeletal development and bone aging with short stature. 25 Studies on the effect of thyroid hormones (within normal ranges) on BMD have yielded inconsistent results.10,12,13,26 However, to date, a limited number of studies have reported the relationship between normal thyroid hormone levels and OP in patients with T2DM. van Rijn et al. 27 revealed that low TSH concentrations were associated with decreasing BMD at the femoral neck and hip joint in women with postmenopausal T2DM and euthyroidism. However, Fang et al. 28 indicated that FT3, FT4, and TSH concentrations were not correlated with bone mineral content and BMD of the lumbar spine and femur. Here, we did not observe a linear or nonlinear relationship between FT3, FT4, and TSH and the risk of OP (Supplemental Tables S2 and S3). The conflicting results may be attributed to the cross-sectional design, small sample size, short duration of follow-up, inadequate key laboratory indicators, insufficient critical laboratory data, incomplete adjustment for confounding factors, such as prior or family history of fracture, physical activity, use of relevant medicine, prior history of thyroid disease, or use of T4. Therefore, additional studies are required to explore the relationship between thyroid hormones (normal ranges) and the risk of OP. In addition, the interactions between TSH, FT4, and FT3 are strong and tightly regulated, and complex interactions occur along the hypothalamic–pituitary–thyroid (HPT) axis (i.e., thyroid homeostasis). 29 Therefore, measuring a single parameter may not be sufficient to explain the relationship between the thyroid system and OP, and comprehensive indicators should be used for further evaluation in this context.
Given the inconsistencies in the previous studies, we used TSHI, TT4RI, and TFQI as novel central thyroid hormone resistance indicators. Among them, TFQI is based on the empirical co-distribution of FT4 and TSH with the advantage of not producing extreme values when thyroid dysfunction occurs. 18 Compared with single indicators, these new indicators were less biased, systematically reflected the regulation of thyroid hormone homeostasis, and better explained the different associations between thyroid hormone alterations and OP. Several cross-sectional studies have shown that TSHI and TT4RI are significantly associated with the incidence of chronic kidney disease, 30 NAFLD, 19 and coronary heart disease. 31 Laclaustra et al. 18 reported a strong association between TFQI and obesity, metabolic syndrome, and diabetes-related mortality. Recently, Chen et al. 32 indicated that TFQI level was positively associated with the prevalence of osteoarthritis in the lower BMI group. In another study, the authors also showed a significant negative relationship between TFQI and lumbar BMD in male participants. 21 Liu et al. 22 showed that impaired sensitivity to thyroid hormone correlated to OP and fractures in euthyroid individuals.
Here, we did not observe any significant relationship between thyroid sensitivity indices (TSHI, TT4RI, and TFQI) and OP in unadjusted, minimally adjusted, and fully adjusted multivariate linear logistic regression models. Therefore, we further explored the data using logistic regression with cubic spline functions and smooth curve fitting (cubic spline smoothing). Finally, we observed a U-shaped association between TFQI and unfavorable OP risk. This nonlinear association remained consistent after adjusting for multiple covariates, indicating that TFQI was negatively and positively correlated with the incidence of OP on the left and right side of the inflection point, respectively, which was subsequently confirmed in specific subgroups.
The possible reasons for the difference in results between us and the previous related research21,22 could be partly due to race, sample size, and specific population. In addition, the disparities found among the three indices may stem from their specific formulae. In TFQI, the calculation of resistance to thyroid hormones incorporates both TSH and FT4 parameters, resulting in the joint distribution of FT4 and TSH without extreme values for thyroid hormones. Conversely, TT4RI and TSHI separately represent extreme values for FT4 and TSH. Consequently, the associations identified for TT4RI and TSHI may be consistent with the current relationships of FT4 and TSH, respectively, with metabolic abnormalities.
The U-shaped curve suggested that both low and high thyroid hormone sensitivity may lead to increased susceptibility to OP. However, the reasons for this nonlinear relationship are unclear. Several possibilities can explain this phenomenon. First, an increased thyroid hormone sensitivity index may indicate near-hypothyroidism hormonal end effects, 18 which have been linked to decreased bone mass and increased risk of fractures in previous studies. Moreover, a decreased thyroid hormone sensitivity index may indicate near-hyperthyroidism hormonal end effects, which have also been linked to decreased bone density by disrupting osteoclast and osteoblast homeostasis. Overall, these disruptions may result in decreased bone density and an increased risk of OP. Second, the relationship between TFQI and OP may be partially explained by genetic factors. Thyroid hormone receptor (TR)α and TRβ mRNA are found in skeletal cells and cell lines. 33 Thyroid hormones affect bones through the TRα1 isotype (its concentration is tenfold higher than TRβ in bone cells) for late effects 34 ; however, TRβ also mediates acute responses to transient modifications in thyroid hormone concentrations, generating a high bone turnover, rapid bone loss, and decreased tissue mineral density. 35 Additionally, TRβ is the primary isoform responsible for hypothalamohypophyseal negative feedback loops in the thyrotropin receptors, and it defines the set point of the HPT axis. 36 The syndrome of resistance to thyroid hormone (RTH) occurs due to mutations in the TRβ receptor that cause dominant-negative THRB mutations. These mutations disrupt the HPT axis, resulting in elevated TSH levels while maintaining normal or increased levels of circulating T4 and T3. The clinical manifestation of RTH syndrome is a mixed phenotype, wherein some tissues show hyperthyroid-like responses and others present hypothyroid effects. The tissue responses vary based on genetic backgrounds, the THRB mutation’s severity, and the ratio of mutant and wild-type TRβ proteins expressed, as well as tissue-specific differences in the expression ratio of TRα and TRβ proteins. 7 In conclusion, the aforementioned findings on a bidirectional effect caused by TRβ establish a genetic basis for the bidirectional association between thyroid hormone sensitivity index and OP. Therefore, the relationship between TFQI calculations based on the HPT axis and OP may be connected with TRβ. Third, risk factors for OP, such as diabetes, obesity, metabolic syndrome, and NAFLD, are associated with impaired sensitivity to thyroid hormones.18,19,37 Although multiple metabolic variables were adjusted, a possibility existed that metabolic disorders served as crosstalk between the TFQI and OP. However, the underlying mechanisms explaining these findings have not been fully elucidated, and further investigation is warranted. Moreover, the U-shaped curve should be interpreted with caution, and the optimal range of thyroid hormone sensitivity index to prevent OP in patients with type 2 diabetes needs to be identified in future studies.
We analyzed the specific association between thyroid hormone sensitivity and OP stratified by sex, age, and BMI to address the differences in sex, age, and BMI with previous studies.21,22 The results showed a similar U-shaped relationship and threshold effect between TFQI and incident OP in females aged >60 years. The high proportion of older postmenopausal women in our population may partly explain this finding. Postmenopausal OP is a function of aging and estrogen deficiency. However, approximately 75% of bone loss in the first 15 years after menopause is caused by estrogen deficiency alone. 38 Estrogen has a regulatory effect on thyroid function, and its concentration may affect the development of diabetes, especially after the age of 60. 39 Further, differences in sex hormones may be a reason for the differences in the relationship between thyroid hormone sensitivity and OP found in this study. However, a recent study showed a positive association between reduced thyroid hormone sensitivity index and increased risk of OP in the elderly population with no significant difference between the sexes, suggesting that certain gender-specific biological factors may influence the response of participants to changes in thyroid hormones. Further research using larger sample sizes or subgroup analyses is necessary to validate the significance of sex-based differences observed in our study. In addition, TFQI was consistently associated with the risk of OP in the BMI (25–30 kg/m2) group. Zhou et al. 40 determined that obese patients had higher TSHI and TFQI levels than the control individuals. Nevertheless, another cross-sectional analysis showed a significant negative correlation between TSHI and BMI, suggesting that obesity reduced the thyroid homeostasis index. 41 These conflicting results suggested that other underlying mechanisms may link fat accumulation and resistance to thyroid hormone.
The strengths of this study are demographic and clinical data of a specific patient population, sensitive thyroid hormone indices as indicators, and nonlinear relationship-fitting results with differences in sex, age, and BMI. However, our study had several limitations. First, we conducted a single-center cross-sectional study; therefore, causality cannot be inferred and extrapolation of the results was restricted. Therefore, further multicenter prospective studies are required to validate our findings. Second, the sample size should be increased to enhance statistical power. Third, all analyses were adjusted for multiple confounders. Nonetheless, some residual confounding associated with diabetes and OP affecting thyroid hormone sensitivity were not considered, such as nutritional factors, socioeconomic status, diabetes medication, and deiodinase balance. These potential residual confounding must be considered while interpreting the results of this study.
Conclusions
The U-shaped curve indicated a nonlinear relationship between TFQI (a thyroid hormone sensitivity index) and the risk of OP in euthyroid patients with type 2 diabetes, thereby suggesting the importance of monitoring thyroid function in these patients to prevent the onset of OP. The complex mechanisms involved in this interaction should be further investigated to provide better clinical guidance for managing OP in patients with T2DM.
Supplemental Material
sj-docx-1-taj-10.1177_20406223231189230 – Supplemental material for Association between sensitivity to thyroid hormone indices and osteoporosis in euthyroid patients with type 2 diabetes mellitus
Supplemental material, sj-docx-1-taj-10.1177_20406223231189230 for Association between sensitivity to thyroid hormone indices and osteoporosis in euthyroid patients with type 2 diabetes mellitus by Xuelun Wu, Furui Zhai, Ailing Chang, Jing Wei, Yanan Guo and Jincheng Zhang in Therapeutic Advances in Chronic Disease
Footnotes
References
Supplementary Material
Please find the following supplemental material available below.
For Open Access articles published under a Creative Commons License, all supplemental material carries the same license as the article it is associated with.
For non-Open Access articles published, all supplemental material carries a non-exclusive license, and permission requests for re-use of supplemental material or any part of supplemental material shall be sent directly to the copyright owner as specified in the copyright notice associated with the article.