
Abstract
Background:
Corneal fluorescein sodium staining is a valuable diagnostic method for various ocular surface diseases. However, the examination results are highly dependent on the subjective experience of ophthalmologists.
Objectives:
To develop an artificial intelligence system based on deep learning to provide an accurate quantitative assessment of sodium fluorescein staining score and the size of cornea epithelial patchy defect.
Design:
A prospective study.
Methods:
We proposed an artificial intelligence system for automatically evaluating corneal staining scores and accurately measuring patchy corneal epithelial defects based on corneal fluorescein sodium staining images. The design incorporates two segmentation models and a classification model to forecast and assess the stained images. Meanwhile, we compare the evaluation findings from the system with ophthalmologists with varying expertise.
Results:
For the segmentation task of cornea boundary and cornea epithelial patchy defect area, our proposed method can achieve the performance of dice similarity coefficient (DSC) is 0.98/0.97 and Hausdorff distance (HD) is 3.60/8.39, respectively, when compared with the manually labeled gold standard. This method significantly outperforms the four leading algorithms (Unet, Unet++, Swin-Unet, and TransUnet). For the classification task, our algorithm achieves the best performance in accuracy, recall, and F1-score, which are 91.2%, 78.6%, and 79.2%, respectively. The performance of our developed system exceeds seven different approaches (Inception, ShuffleNet, Xception, EfficientNet_B7, DenseNet, ResNet, and VIT) in classification tasks. In addition, three ophthalmologists were selected to rate corneal staining images. The results showed that the performance of our artificial intelligence system significantly outperformed the junior doctors.
Conclusion:
The system offers a promising automated assessment method for corneal fluorescein staining, decreasing incorrect evaluations caused by ophthalmologists’ subjective variance and limited knowledge.
Keywords
Introduction
The cornea is located in the anterior part of the eyeball. It is directly exposed to the external environment, which can easily be influenced by traumatic factors, 1 environmental factors, 2 and infectious and inflammatory diseases. 3 The corneal epithelium, as the outermost physiological structure of the cornea, is particularly problematic.4–6 Ophthalmologists used corneal fluorescein sodium staining to test the integrity of the corneal epithelium. 7 Different staining shapes, the number of stained dots, and the size of the staining area are often used to distinguish various illnesses or disease severity. In addition, accurate measurement of the defect area is essential to assess the corneal repair function and the effectiveness of the treatment.8,9 However, the evaluation of corneal sodium fluorescein staining relies heavily on the subjective perception of the clinician. Therefore, there exists a great need for automated quantitative analysis of corneal sodium fluorescein staining.
Researchers have accomplished a wide variety of related work. Pritchard et al. 10 developed a method for digital imaging to evaluate punctate corneal staining. Gaussian edge detection and RGB color system were combined to detect corneal erosions. 11 The corneal ulcer area was identified by k-means clustering. 12 A joint Otsu and Gaussian mixture modeling method was performed to segment corneal ulcers. 13 The limitations of these studies are the relatively small amount of data studied, traditional insufficient digital technology, or the insufficient generalization capacity of the model.
With the advent of massive data, the deep neural network has wildly succeeded in various visual tasks14–19 and achieved satisfactory results in the last decades. In the field of ophthalmology, deep neural network methods have been used for optic disk segmentation, 20 cataract image classification, 21 eye tracking, 22 detection of diabetic retinopathy, 23 and iris segmentation, 24 which brings great convenience to multiple clinical tasks, such as disease screening, diagnosis, and prevention.
In this study, we showcase a novel and effective way to quantify corneal sodium fluorescein staining, which can accurately evaluate the sodium fluorescein staining of the entire corneal area. Furthermore, the evaluation system can automatically detect the corneal stained area. Our experimental results demonstrated that deep learning–based artificial intelligence technology could reduce the variability of clinicians in interpreting corneal staining results and improve the reliability of measurement results, which provides a powerful tool for disease management.
Materials and methods
Image data set collection
We stained the patient’s cornea after moistening the fluorescein impregnated strips with a drop of sterile normal saline without applying a local anesthetic. Subsequently, the patient was asked to blink three times to ensure that the fluorescein dye was evenly applied throughout the tear film. Images were taken with a digital slit-lamp camera 3 min after the instillation of fluorescein sodium dye solution. The image was saved in JPG format, 1624 × 1232 in size. In our experiment, we focused on the staining of the corneal region, so that, each photo was designed to put the corneal part in the center of the image. Considering the model’s generalization ability, images at different magnifications are retained. In this prospective study, 1896 slit-lamp images were consecutively collected between October 2021 and May 2022.
Inclusion and exclusion criteria
Data set division
In the field of machine learning or deep learning, it is very important to divide the training set, validation set, and test set reasonably. To reduce information leakage and improve the efficiency of the reaction model, we split the data set in this experiment into a training set, validation set, and test set at a ratio of 7:1:2. One image per patient was selected to form the data set. Each image is augmented with a random enhancement algorithm to make the training model more generalizable. The details of each set of various computer vision tasks are presented in Table 1.
Data set division is used in this study.

Image preprocessing
We labeled the corneal region with Labelme software (version 4.6.0). The corneal region was labeled as the foreground, while the other areas were labeled 0 as the background. Because of the particular corneal structure, padding resize is employed to transmit it into the neural network for segmentation. We used the steps in Figure 1 to extract the corneal region. Patchy defects in corneal epithelium significantly affect the patient’s vision and, in severe cases, lead to blindness in patients.25,26 We selected bigger corneal epithelial defects for manual labeling; 254/249 images were used to train cornea and patchy defect area segmentation, respectively, and 73/70 images were used to verify the performance of model training.

Images segmentation neural network structure for cornea boundary and corneal lesion region.
Image segmentation
We proposed a novel U-shaped structure segmentation network for successfully segmenting the cornea and huge defect region. The network employed the Swin-Transformer 27 to replace the standard convolution process, allowing for a more significant consideration of global information in feature extraction. Simultaneously, Swin-Transformer has a quicker reasoning speed than other vision transformers’ (VIT) structures. 28 To extract image features at various scales, we employed a patch merge layer to accomplish 2 × 2 feature map scaling. A convolutional neural network was still used for feature recovery in the upper sampling part to ensure the image edge’s detailed features were better. The structure is shown in Figure 1.
Automatic corneal staining scoring system
We divided the extracted corneal region into five subdomains. We scored the stained images according to the NEI Workshop on Clinical Trials in Dry Eyes, 29 and two experienced ophthalmologists scored each subdomain. When a picture was consistently scored, it was included in the study. We used the framework in Figure 2 to train a four-classification neural network model, which directs the allocation of five subareas of the cornea to one of the four grades of 0–3. Of the 1279 images, 895 scored by the experts in total were used for the training of the model. The remaining photos were used for the performance test of the neural network.

Flow chart of corneal fluorescein sodium staining score system.
Implementation details
The software used in this experiment is Python (version 3.7.11). The network architecture is built on PyTorch (version 1.10.1), an open-source Python machine learning library primarily used in deep learning research. PyTorch supports GPU computing, which significantly speeds up application execution. This is especially important in the era of big data. In this experiment, we used four RTX2080Ti graphics cards.
Model evaluation and data analysis
Results
Segmentation of corneal boundary
In this research, we focused on the staining of the corneal region. Therefore, we first identified the corneal boundary from the original image using a segmentation model based on Swin-Transformers (Figure 1). In our approach, the DSC for identification of cornea boundary was 0.9824, while HD was 3.605 (Table 2). In addition, classic and excellent performance methods of medical image segmentation, such as Unet, 34 Unet++, 35 Swin-Unet, 36 and TransUnet, 37 were performed to compare with our proposed method in the task of corneal region segmentation. Compared with Unet, Unet++, TransUnet, and Swin-Unet can improve DSC by 12.6%, 7.25%, and 23.2%, respectively, while decreasing HD by 56.1%, 55.9%, and 77.9%, respectively. Among the methods mentioned above, our proposed method achieves the best performance; it can increase DSC by 24.4% and decrease HD by 84.4%.
Quantitative evaluation of corneal boundary segmentation performance.

DSC, dice similarity coefficient; HD, Hausdorff distance; Our, our proposed method. Bold values indicate that the result is the best of this metric.
In addition, we presented visualization results of corneal segmentation using five different segmentation methods (Figure 3). Visually, we can intuitively find that the segmentation performance of our process is the closest to GT. In addition, it can be seen that our model has good performance in corneal staining images of different enlarged sizes, which indicates that our model has good generalization ability.
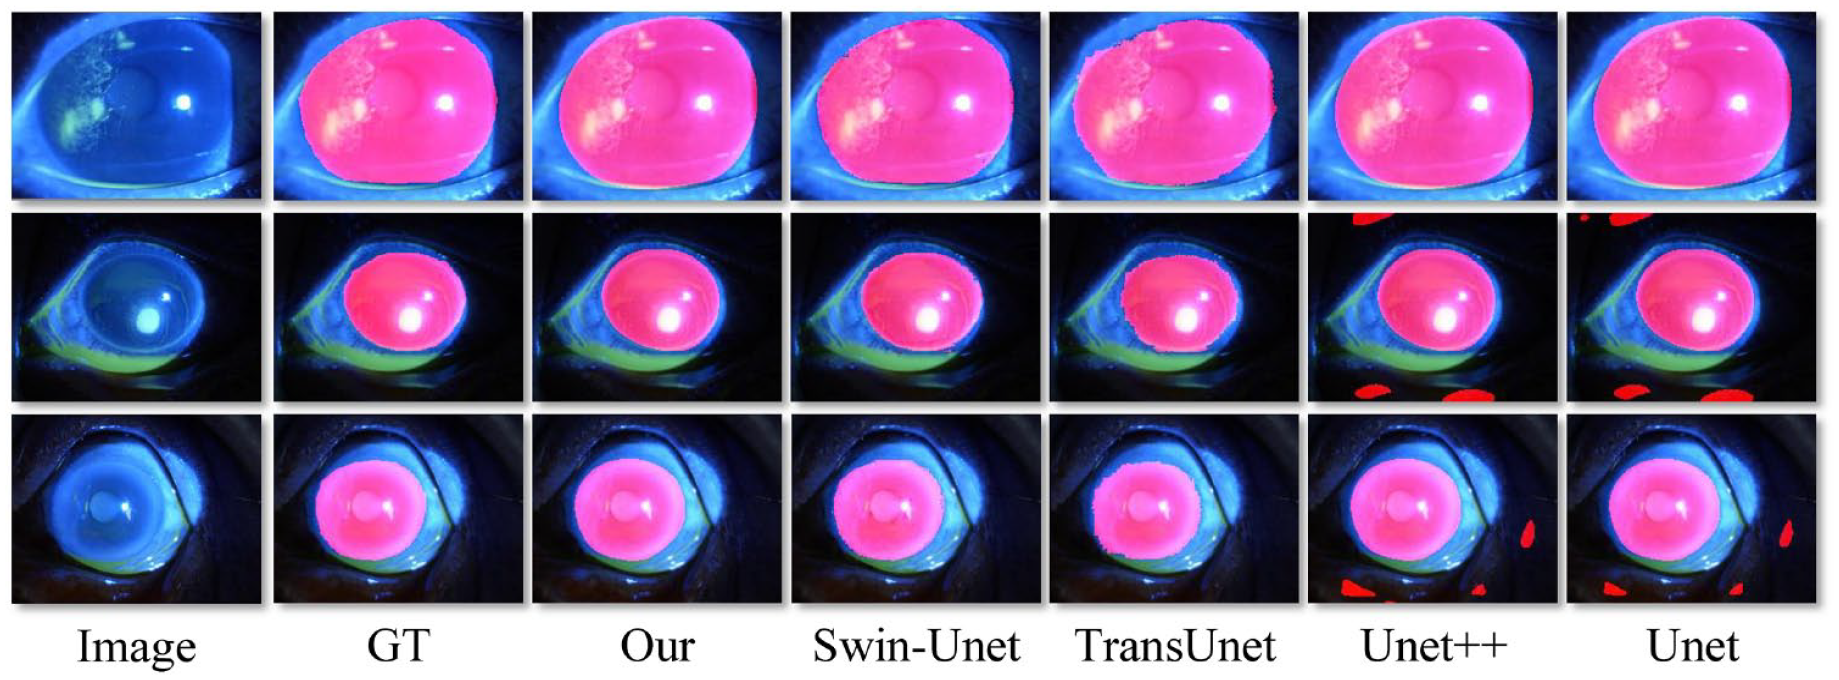
Performance of corneal area segmentation on various methods.
Segmentation of corneal lesion area
Similar to the corneal boundary segmentation task, we used several different methods the abovementioned for patchy corneal staining region segmentation. Using our way, the DSC for detecting corneal staining lesions was 0.9776, while HD was 8.3909 (Table 3). Compared with Unet, the three methods, including Unet++, TransUnet, and Swin-Unet, can improve DSC by 20.3%, 18.5%, and 22.9%, respectively, while decreasing HD by 37.1%, 35.3%, and 66.9% respectively. Our proposed method increased DSC by 31.5% and reduced HD by 77.4%. We finally achieved the best performance in identifying corneal staining lesions by far surpassing the second place.
Quantitative evaluation of patchy corneal lesion segmentation performance.
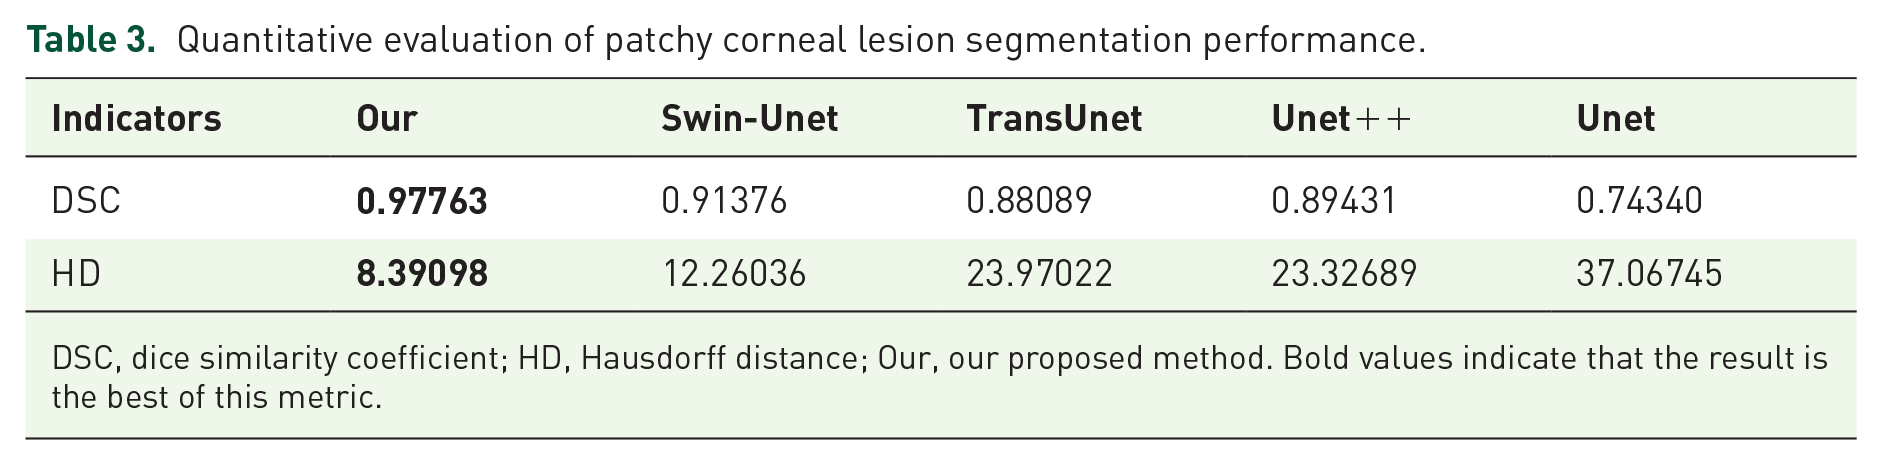
DSC, dice similarity coefficient; HD, Hausdorff distance; Our, our proposed method. Bold values indicate that the result is the best of this metric.
We visually generated the corneal patchy defect area’s mask (the red region) and drew it automatically on the original image. Three representative segmentation outcomes with different methods are shown in Figure 4. It can be seen that whether the defect shape is complex or simple, our model can reasonably identify the location and boundary of the cornea defect. Our proposed method achieved the best segmentation results.
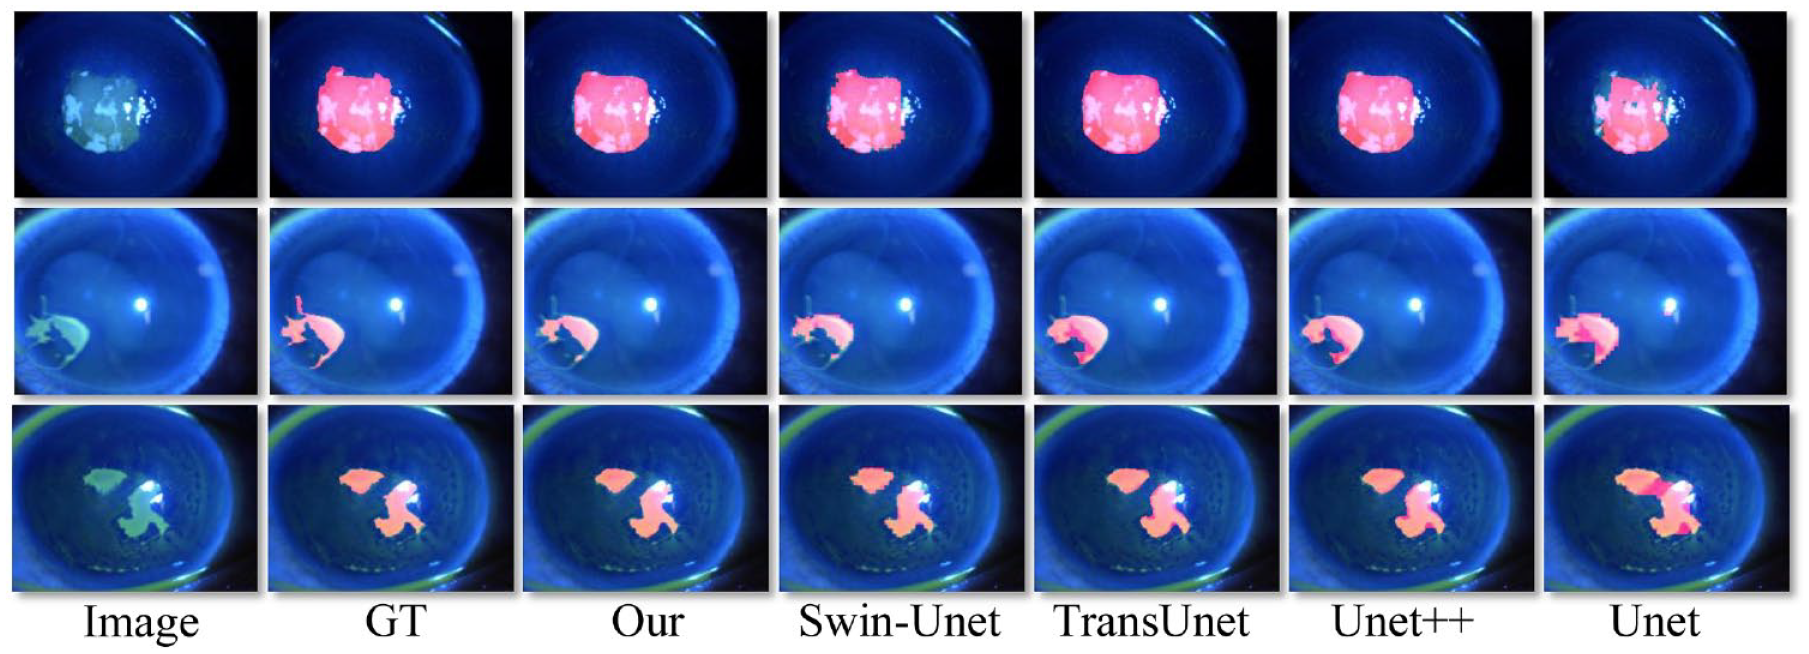
Performance of detection of patchy corneal staining region on several methods.
Corneal fluorescein sodium staining score system
A score for each cornea subdomain was obtained using the method in Figure 2. Accuracy, as the most commonly used index in classification models, cannot reasonably reflect the prediction ability of models when there are unbalanced samples. Therefore, we also introduced precision, recall, and F1-score to more comprehensively evaluate the performance of the classification model. Inception, 38 ShuffleNet, 39 Xception, 40 EfficientNet_B7, 41 DenseNet,42, 43 ResNet, and VIT 44 have been used for medical image classification tasks and achieved promising performance. Here, compared with the other seven methods, our developed model achieves the best performance in accuracy, precision, and F1-score, which are 91.2%, 78.6%, and 79.2%, respectively, and the implementation of precision achieved 84.244% (Table 4).
Performance of corneal fluorescein staining evaluation system using different frameworks.

Our, our proposed method. Bold values indicate that the result is the best of this metric.
Comparison of artificial intelligence technology and ophthalmologists in corneal staining evaluation
We randomly selected three doctors who were asked to rate corneal staining images. Then, we compared the evaluation results of these three doctors with the results of machine learning. Our developed artificial intelligence-based approach far outperformed junior ophthalmologists on all four measures. In addition, we can see a big difference between the three ophthalmologists in the evaluation of corneal staining, especially in precision, recall, and F1-score. Table 5 shows their respective performance.
Comparison of artificial intelligence system with various ophthalmologists in corneal staining evaluation results.
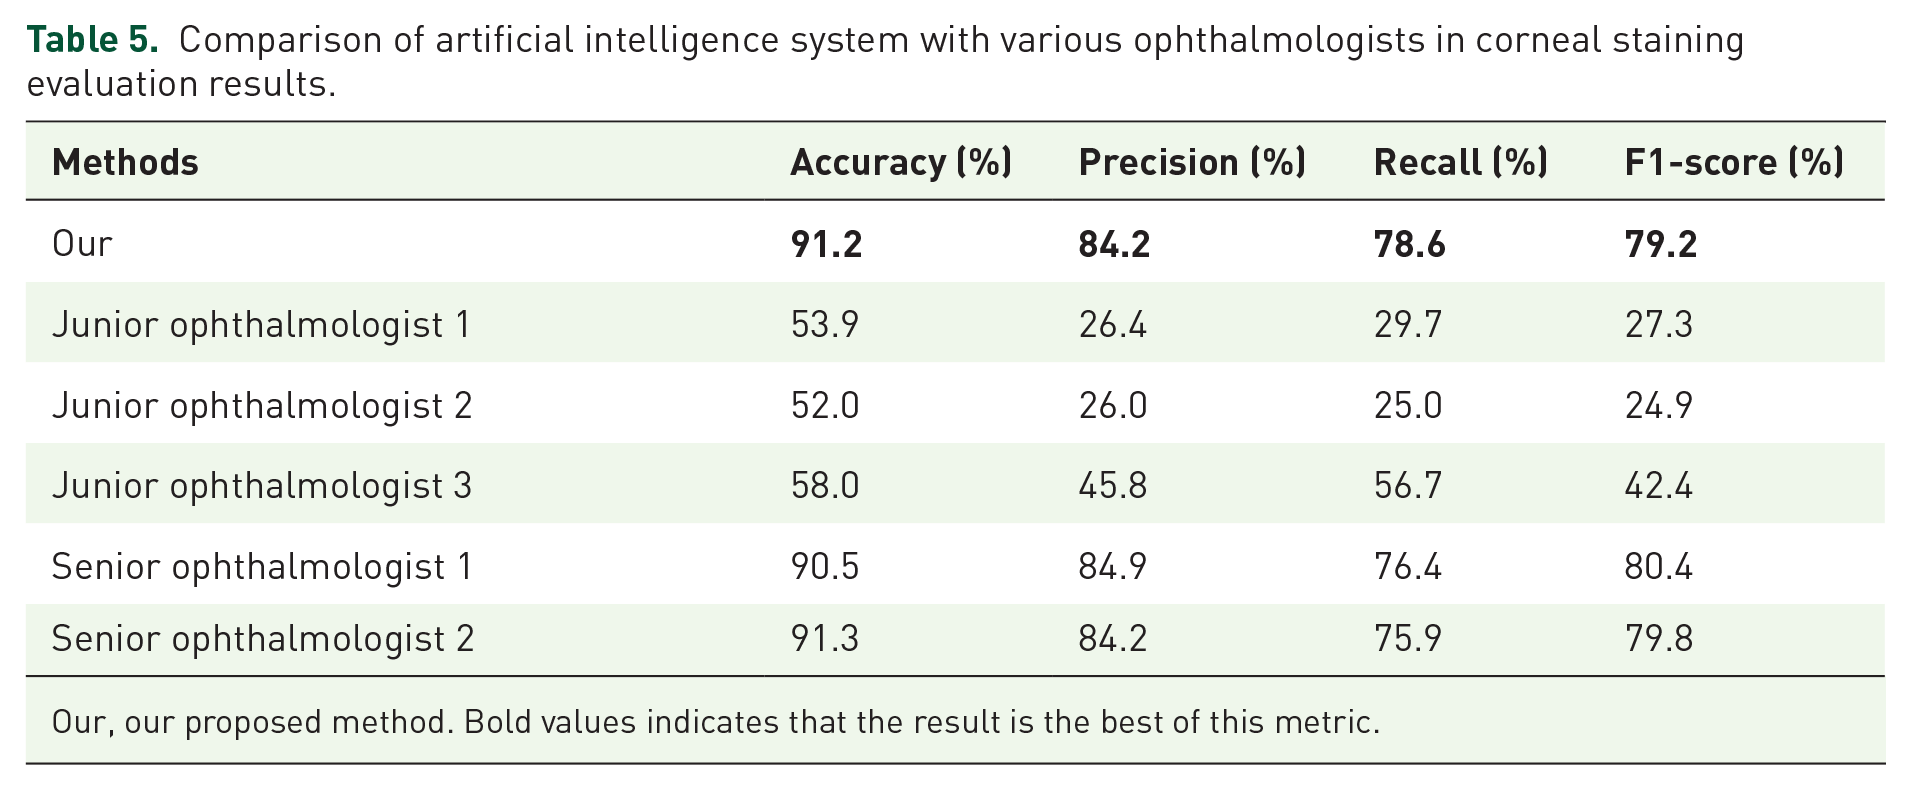
Our, our proposed method. Bold values indicates that the result is the best of this metric.
Discussion
Corneal fluorescein sodium staining is the most commonly used way in ophthalmology to assess corneal integrity. The evaluation of corneal staining and accurate automatic detection of the stained lesion area is very important for various clinical purposes, such as the evaluation of patient symptoms, quantitative study of lesions, monitoring of drug treatment, and management of the patient’s condition. 45
At present, the emerging field of deep learning has exerted a significant impact on medical imaging. As effective methods used in biomedical image segmentation, Unet, Unet++, TransUnet, and Swin-Unet deep learning frameworks have achieved promising performance on many medical vision tasks, such as iris segmentation, 46 pupil segmentation, 47 retinal vessel segmentation, 48 skin lesion segmentation, and classification. 49 However, these methods cannot model global features well and are prone to lose a wealth of detailed local information. Deep learning techniques suitable for massive data have yet to be fully utilized to solve the aforementioned clinical problem.
This article introduces an artificial intelligence method based on deep learning to automatically and accurately assess corneal fluorescein sodium staining. As shown in Figures 3 and 4, our proposed method can perfectly identify the corneal region and the corneal epithelial defect area. The best performance of the segmentation task may result from Swin-Transformer. It is used as the backbone in the segmentation model’s down-sampling part. It can model global features better than the backbone based on convolution. Patch merging is also used for scaling to extract global features at different sizes and decrease computer resources. The patch reconstructs module transforms the patch-based feature map into the standard feature matrix. In the up-sampling part, residual basic is used as the foundation to achieve pixel-level restoration. Finally, the corneal and lesion region segmentation is accomplished.
In contrast to the typical convolution-based classification model, the classification model’s backbone uses a Swin-Transformer, which pays more attention to the context information and can have global modeling features. Based on the segmentation results, this article uses a patch mask to mask the padding region. It does not involve feature modeling to decrease interference to the target region and lower the degree of computation. Therefore, we achieved the best accuracy, recall, and F1-score (Table 4). As for failing to reach the best precision, we argue that the transformer model has global features, and the input image is significantly unbalanced, which results in poor performance of our proposed model in this task. Moreover, the mask mechanism is also introduced into the traditional VIT model (VIT+ mask) to optimize it to ensure the fairness of the comparative experiment. Ultimately, our artificial intelligence system outperformed the young ophthalmologists (Table 5). We hypothesize that the following reasons may explain the above phenomenon. First of all, the excess sodium fluorescein dye on the corneal surface may also be one of the reasons for the poor performance of young doctors, who may mistakenly believe that this is a region of corneal epithelial defect. Second, young ophthalmologists lack rich clinical experience and may have poor judgment in Grades 1 and 2 of corneal staining, but machine learning has learned the knowledge of experts. Finally, the interpretation of corneal staining results depends heavily on the doctor’s individual subjective feelings. At the same time, the machine’s standard is fixed and will not be affected by multiple factors, such as working environment and mental state.
This study also has limitations. Punctate staining areas may be challenging to detect and count. Kourukmas and Rodriguez analyzed punctate corneal lesion staining regions using digital image analysis techniques,50,51 but such methods are suitable for a small amount of data, and their ways perform poorly in the era of massive data. Therefore, the future research direction is implementing the accurate quantification of fine punctate staining, which is still very challenging work. In addition, it is costly and time-consuming for doctors to label images, so researchers need to consider unsupervised machine learning methods to process the big data generated in outpatient clinics in future work. Finally, in deep learning for image segmentation and classification, one image is regarded as a sample, and the gap between the image and the target region is viewed as a loss to leverage backpropagation to update the neural network parameters and carry out network optimization. Power analysis is not used in this application scenario. It is well-known that the cost of image labeling by physicians is prohibitive. Furthermore, according to expert experience, in the sample collection labeling stage, as far as possible to be consistent with the distribution of actual samples, and to ensure the diversity and complexity of samples, each sample has a certain independence and representativeness. In a word, incremental learning was used in our study; that is to say, when the sample size we collected is enough to allow the neural network model to learn the characteristics and perform well, we do not collect data.
Conclusion
Our proposed method performs state-of-the-art vision tasks, including identifying corneal regions, detecting patchy corneal epithelial defects, and automatically assessing corneal staining scores (Figure 5). Moreover, this method is a fast, simple and trustworthy way. Besides, our proposed deep neural network framework has better generalization ability. The development of such a system offers the possibility of future applications in practical clinical scenarios.

Schematic overview of the entire corneal staining evaluation system.