
Abstract
Objectives
To apply image registration in the follow up of lung nodules and verify the feasibility of automatic tracking of lung nodules using an artificial intelligence (AI) method.
Methods
For this retrospective, observational study, patients with pulmonary nodules 5–30 mm in diameter on computed tomography (CT) and who had at least six months follow-up were identified. Two radiologists defined a ‘correct’ cuboid circumscribing each nodule which was used to judge the success/failure of nodule tracking. An AI algorithm was applied in which a U-net type neural network model was trained to predict the deformation vector field between two examinations. When the estimated position was within a defined cuboid, the AI algorithm was judged a success.
Results
In total, 49 lung nodules in 40 patients, with a total of 368 follow-up CT examinations were examined. The success rate for each time evaluation was 94% (345/368) and for ‘nodule-by-nodule evaluation’ was 78% (38/49). Reasons for a decrease in success rate were related to small nodules and those that decreased in size.
Conclusion
Automatic tracking of lung nodules is highly feasible.
Introduction
Numbers of diagnostic imaging examinations are increasing due to improvements in equipment performance. 1 Consequently, the workload of radiologists has increased. Comparison of lung nodules is a common task for radiologists and so automatic tracking of these lesions may well reduce their workload. The development of artificial intelligence (AI) technology is expected to help address issues by preventing missed diagnoses and reducing the burden on daily work. 2
Image registration is a technique for aligning positions between images. In recent years, various algorithms that use deep learning have been studied. 3 While lung image registration studies have included several that were targeted at inhalation and exhalation 4 and radiation therapy, 5 as far as we are aware, none have applied image registration to the follow-up of lung nodules. Therefore, the purpose of this present study was to apply image registration for the follow-up of lung nodules and to verify the feasibility of automatic tracking of lung nodules using an AI method.
Methods
For this observational study, patients with pulmonary nodules 5–30 mm in diameter on computed tomography (CT) and who had at least six months follow-up (i.e., from April 1, 2006 to March 31 2019) were identified from our hospital database. The lung nodules included, ground-glass opacities, solid nodules, and partly solid nodules. Lung nodules outside the measurement range were excluded. Other exclusions were signs of pleural effusion, atelectasis, or pneumonia near the nodule.
The scanners, kernels, and spacing of the evaluation data were as follows:
Scanners: Canon Aquilion (216 cases)/Canon Aquilion ONE (59 cases)/Canon Aquilion PRIME (50 cases)/Canon Aquilion Precision (20 cases) (a single CT scan may have included multiple nodules); Kernels: FC52 (130 cases), FC53 (214 cases), FC86 (1 case); Pixel spacing (xy direction): mean (SD) = 0.56 mm (0.08), median (interquartile range [IQR]) = 0.56 mm (0.53–0.60); Slice spacing (z direction): mean (SD) = 2.0 mm (0.16), median (IQR) = 2.0 mm (2.0–2.0); Number of pixels (xy direction): mean (SD) = 532 (101), median (IQR) = 512 (512–512) Number of slices (z direction): mean (SD) = 154 (16), median (IQR) = 154 (143–165)
A cuboid circumscribing the nodule was defined for each nodule by the consensus of two radiologists [Y.T.; S.O.] and used to judge the success or failure of the nodule tracking.
For the AI method, every CT image was initially pre-processed to align roughly with a predefined image size (i.e., 384 × 256 × 320 pixels with slice thickness of 1 mm). A trained image registration model was subsequently used to calculate the deformation vector field for each pair of consecutive follow-up CT images (i.e., Nth and [N + 1]th). The model is a U-net type neural network model that outputs a deformation vector field of the same number of pixels as the input image, and each pixel has a three-dimensional (3 D) deformation vector at its pixel position.4,6,7 The model was independently trained using 1056 randomly selected chest CT images using the dimensions 384 × 256 × 320 pixels with slice thickness of 1 mm. The number of re-sampled pixels was determined to cover the entire lung. Learning was not focused on lung nodules, but was done so that corresponding points could be obtained for shape changes in the entire lung field. Images were generated before and after use of a random deformation vector field. For this, the deformation vector field between the Nth and (N + 1)th CT image was used, and the nodule position in the (N + 1)th CT image was estimated based on the nodule cuboid defined in the Nth CT image. If the estimated position was within the defined cuboid, the AI algorithm was judged to have been a success in tracking the nodule (Figure 1).
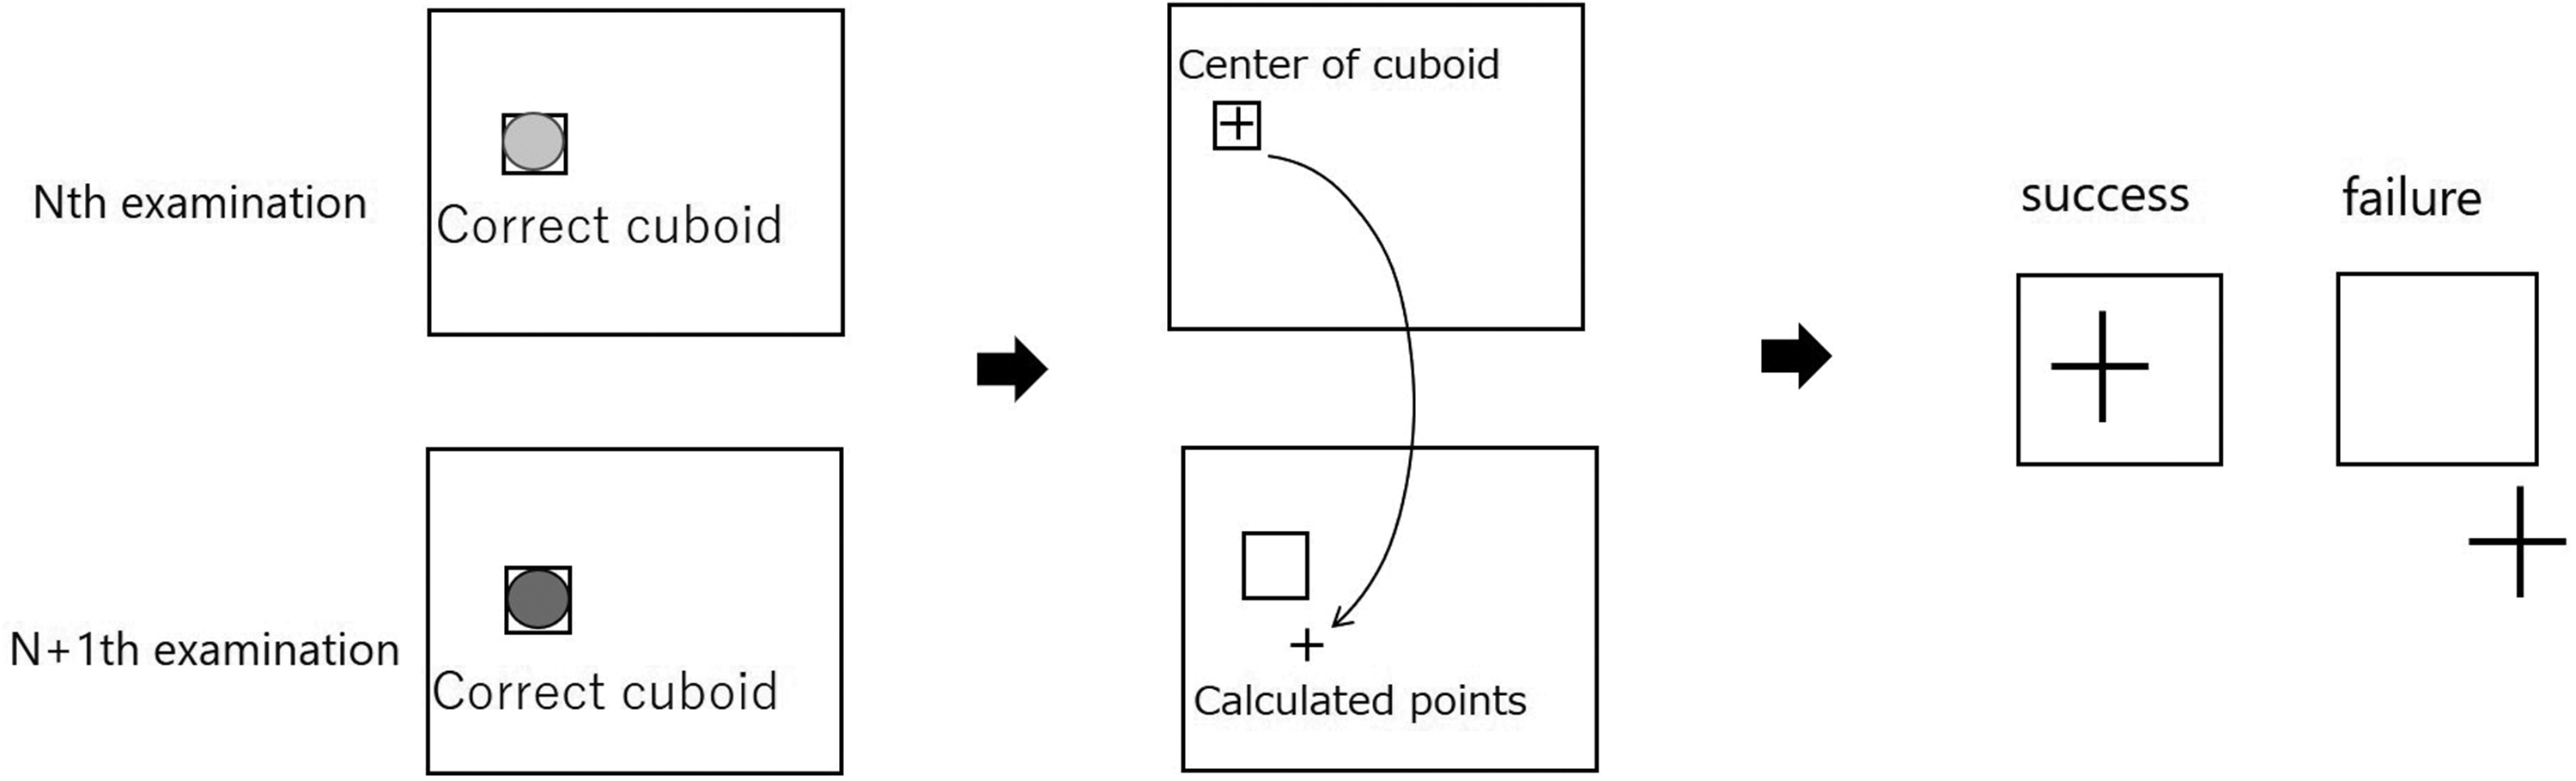
The evaluation method. A cuboid circumscribing the nodule was defined for each nodule by the consensus of two radiologists and used to judge the success or failure of the nodule tracking, If the calculated point was inside the ‘correct’ cuboid, it was considered successful, otherwise, it was considered a failure.
The success rate of the AI method was assessed using two methods. The first measure was evaluation of success/failure between each follow-up CT scan (i.e., each evaluation) and the denominator was 368 (i.e., the total number of follow-up visits). The second measure of success was assessed in all follow-ups for each nodule (i.e., nodule-by-nodule evaluation) and the denominator was 49. Additional evaluations were also performed. For example, the size of the ‘correct’ cuboid was increased. Specifically, if one side of the cuboid was <20 mm, it was extended to 20 mm. In addition, an evaluation based on the overlap of cuboids was assessed. For this, the intersection over union (IoU), which is an evaluation index for object detection, was used for success/failure evaluation. The same cuboid as in the Nth inspection was mapped to the points calculated in the (N + 1)th inspection. Specifically, the centre of the Nth cuboid was moved to the calculated corresponding point, and the Nth cuboid was re-positioned. If the mapped cuboid slightly overlapped the correct cuboid, it was considered successful (IoU > 0), otherwise, it was considered a failure (IoU = 0).
The reporting of this study conforms to STROBE guidelines. 8 The study was approved by the hospital ethics review board approved. Patient consent was not required because this was a retrospective study using routine laboratory data and data were anonymized.
Statistical analysis
Statistical analysis was performed using IBM SPSS Statistics for Windows, version 28.0.1.1 (Armonk, NY: IBM Corp). A P-value <0.05 was considered to indicate statistical significance. Lung nodule size (mm), lung nodule size change rate, lung volume change (ml), lung volume change rate, and changes in lung findings were analysed. For nodule size, the average value of the three side lengths of the ‘correct’ cuboid was calculated, and the (N + 1)th value was used. The rate of change in nodule size was calculated as (N + 1)th nodule size – Nth nodule size) ÷ Nth nodule size. The change in lung volume and the rate of change in lung volume were analysed using the functions installed in the SYNAPSE SAI viewer of the FUJIFILM Corporation. Finally, if pneumonia, pleural effusion, or atelectasis newly appeared, improved, or exacerbated, between the Nth and (N + 1)th CT images, changes in lung findings were observed. These were manually determined by the consensus of two radiologists [Y.T.; S.O.].
Continuous data were presented as mean (SD) and Student's t-test was used to compare results between groups and categorical variables were compared using χ2 test and Fisher’s exact tests. Binary logistic regression analysis was performed on items with a P-value <0.05 and odd ratios (ORs) and 95% confidence intervals (CIs) were calculated. A receiver operating characteristic (ROC) curve was generated for success/failure of nodule size using free Easy R (EZR) statistical software. 9
Results
In total, 49 lung nodules in 40 patients, with a total of 368 follow-up CT examinations were examined. Lung nodule size was often <10 mm; the mean [SD] was 13.5 [7.2] mm) (Figure 2a). Rates of shrinkage and growth in nodule size were similar (Figure 2b). The number of follow-up CT images for each nodule ranged from 2 to 19 (Figure 2c) and the follow-up period for each nodule ranged from 0.5 year to >10 years (Figure 2d).

(a) Distribution of lung nodule size at follow-up. Many nodules were less than 10 mm (mean [SD], 13.5 [7.2] mm). (b) Distribution of lung nodule size change rates. Rates of shrinkage and growth in nodule size were similar. (c) Distribution of the number of follow-up visits for each nodule. The number of follow-up CT images for each nodule ranged from 2 to 19 and (d) Distribution of follow-up periods for each nodule. The follow-up period for each nodule ranged from 0.5 year to >10 years.
The success rate for ‘each evaluation’ was 94% (345/368) and the success rate for ‘nodule-by-nodule evaluation’ was 78% (38/49). In the additional evaluations, the success rate increased for both methods. For example, the success rate when the size of the ‘correct’ cuboid was increased was 99% (366/368) for the ‘each evaluation’ and 98% (48/49) for ‘nodule-by-nodule evaluation’ The success rate of evaluation by overlapping cuboids was 98% (361/368) for ‘each evaluation’ and 90% (44/49) for ‘nodule-by-nodule evaluation’. The average IoU value was 0.48. However, tracking sometimes failed when the nodule size was small (Figure 3a) or when the nodule size decreased between the Nth and (N + 1)th CT image (Figure 3b).

(a) Success rate according to nodule size. Black indicates success and grey indicates failure. The success rates were reduced for lesions <10 mm and (b) Success rate according to rate of change in nodule size. Black indicates success and grey indicates failure. The greater the reduction rate, the lower the success rate.
A significant difference was observed between success and failure for nodule size and nodule size change rate (Table 1). However, no significant differences were found in lung volume change and lung volume change rate. In some cases, lung volumes differed between the Nth and (N + 1)th CT images because of differences in inspiratory volume, which was thought to be a possible cause of the tracking failure.
Evaluation of success/failure between each follow-up CT scan.

ns, not statistically significant. A cuboid circumscribing the nodule was defined for each nodule and used to judge the success or failure of the nodule tracking. For nodule size, the average value of the three side lengths of the ‘correct’ cuboid was calculated, and the (N + 1)th value was used. The rate of change in nodule size was calculated as (N + 1)th nodule size – Nth nodule size) ÷ Nth nodule size. The change in lung volume and the rate of change in lung volume were analysed using the functions installed in the SYNAPSE SAI viewer of the FUJIFILM Corporation.
There were 17 cases where changes in lung findings were present between the Nth and (N + 1)th CT image (Table 2). Of these, 13 were judged a success and four a failure. The presence of changes in lung findings was also thought to be a possible cause of tracking failure.
Changes in lung findings.

A cuboid circumscribing the nodule was defined for each nodule and used to judge the success or failure of the nodule tracking.
Binary logistic regression analysis (success/failure) was performed using lung nodule size, nodule size change rate, and changes in lung findings. Lung nodule size and changes in lung findings were found to be significant factors in success/failure of the method (Table 3).
Binary logistic regression analysis using success/failure.

ns, not statistically significant.
With regard to the four patients who had changes in lung findings and were judged ‘failures’, their nodule size was smaller than 10 mm (average, 7.4 mm). By contrast, for the 13 patients with changes in lung findings and considered ‘successful’, the average nodule size was relatively large at 24.3 mm. Therefore, it was considered that the significant difference in changes in lung findings might be due to differences in nodule size. The ROC curve for nodule size and success/failure showed a cut-off value of 8.4 mm (Figure 4). Using this value, nodule sizes were categorised as large or small. However, no significant differences were found between changes in lung findings and large or small nodule sizes (Table 4). Therefore, we suggest that the decrease in the success rate, depending on the presence or absence of changes in lung findings, did not depend on nodule size.

Receiver operating characteristic (ROC) curve of nodule size and success or failure. The cut-off value was 8.4 mm.
Changes in lung findings and nodule size.

ns, not statistically significant; ROC, receiver operating characteristic. Using the cut-off value of 8.4 mm from a ROC curve, nodule sizes were categorized as large or small.
Discussion
Image registration using deep learning was applied to follow-up CT images of the lung nodules, and the tracking performance was evaluated. In the evaluation of the performance of lung field registration, not all pixels in the CT image could be evaluated, and so, the study was performed by considering lung nodules as representative points. We obtained a success rate of 94%. While there are no similar studies with which to compare our results, achieving this high success rate with this method would eliminate difficulties in searching for lesions in follow-up examinations which would lessen the burden on radiologists.
Significant differences were observed between success and failure groups for nodule size and nodule size change rate. Failure suggested that the ‘correct’ cuboid for the (N + 1)th CT image was probably small, and so the calculated nodule position was more likely to be outside the cuboid. Indeed, if the estimated position was near the cuboid, the success rate could be increased by increasing the size of the cuboid. This was demonstrated in the results of additional evaluations, where the success rate increased when the size of the correct cuboid increased and when the cuboids were evaluated by overlapping.
Radiologists will be ultimately responsible for diagnostic imaging using AI and so must be trained on the use of AI. 10 When using AI as a supplemental aid, even if the position is estimated to be slightly away from the ‘correct’ cuboid, it will be useful for radiologists to understand the approximate position. We chose a large value of 20 mm for one side because we believed radiologists would be able to easily check the findings. For example, the AI cannot distinguish between two different nodules in an enlarged cuboid, and it is likely that in these situations radiologists will be required to make a judgement. Moreover, changes in lung nodule size and lung findings were significant independent factors in the success/failure of evaluation of CT images but our analysis showed that the decrease in success rate, related to presence or absence of changes in lung findings, did not depend on nodule size.
Our study had limitations. Firstly, we had a small number of cases with changes in lung findings. Therefore, more cases with pneumonia, pleural effusion, or atelectasis are required to determine if these factors are strongly involved. Indeed, because we considered the nodule as a representative point for the lungs, accurate results cannot be obtained if it is obscured by atelectasis, consolidations, or other changes. The success rate may be increased by learning more cases or combining it with nodule detection techniques. 11 Secondly, we were limited to cases from our hospital. Therefore, the alignment model needs to be re-examined by applying it to images from other hospitals. Lastly, we did not collect and analyse demographic data on the patients. Therefore, further studies are needed to provide more data and confirm our results. However, our results suggest that automatic tracking of the lungs, including the lung nodules, is feasible and may help reduce the burden on radiologists.
Supplemental Material
sj-pdf-1-imr-10.1177_03000605241230033 - Supplemental material for Evaluation of an artificial intelligence U-net algorithm for pulmonary nodule tracking on chest computed tomography images
Supplemental material, sj-pdf-1-imr-10.1177_03000605241230033 for Evaluation of an artificial intelligence U-net algorithm for pulmonary nodule tracking on chest computed tomography images by Yuhei Takeshita, Shiro Onozawa, Shichiro Katase, Yuya Shirakawa, Kouji Yamashita, Jun Shudo, Akihito Nakanishi, Sadato Akahori and Kenichi Yokoyama in Journal of International Medical Research
Footnotes
References
Supplementary Material
Please find the following supplemental material available below.
For Open Access articles published under a Creative Commons License, all supplemental material carries the same license as the article it is associated with.
For non-Open Access articles published, all supplemental material carries a non-exclusive license, and permission requests for re-use of supplemental material or any part of supplemental material shall be sent directly to the copyright owner as specified in the copyright notice associated with the article.