
Abstract
Background:
Infectious keratitis (IK) is an ocular emergency caused by a variety of microorganisms, including bacteria, fungi, viruses, and parasites. Culture-based methods were the gold standard for diagnosing IK, but difficult biopsy, delaying report, and low positive rate limited their clinical application.
Objectives:
This study aims to construct a deep-learning-based auxiliary diagnostic model for early IK diagnosis.
Design:
A retrospective study.
Methods:
IK patients with pathological diagnosis were enrolled and their slit-lamp photos were collected. Image augmentation, normalization, and histogram equalization were applied, and five image classification networks were implemented and compared. Model blending technique was used to combine the advantages of single model. The performance of combined model was validated by 10-fold cross-validation, receiver operating characteristic curves (ROC), confusion matrix, Gradient-wright class activation mapping (Grad-CAM) visualization, and t-distributed Stochastic Neighbor Embedding (t-SNE). Three experienced cornea specialists were invited and competed with the combined model on making clinical decisions.
Results:
Overall, 4830 slit-lamp images were collected from patients diagnosed with IK between June 2010 and May 2021, including 1490 (30.8%) bacterial keratitis (BK), 1670 (34.6%) fungal keratitis (FK), 600 (12.4%) herpes simplex keratitis (HSK), and 1070 (22.2%) Acanthamoeba keratitis (AK). KeratitisNet, the combination of ResNext101_32x16d and DenseNet169, reached the highest accuracy 77.08%. The accuracy of KeratitisNet for diagnosing BK, FK, AK, and HSK was 70.27%, 77.71%, 83.81%, and 79.31%, and AUC was 0.86, 0.91, 0.96, and 0.98, respectively. KeratitisNet was mainly confused in distinguishing BK and FK. There were 20% of BK cases mispredicted into FK and 16% of FK cases mispredicted into BK. In diagnosing each type of IK, the accuracy of model was significantly higher than that of human ophthalmologists (p < 0.001).
Conclusion:
KeratitisNet demonstrates a good performance on clinical IK diagnosis and classification. Deep learning could provide an auxiliary diagnostic method to help clinicians suspect IK using different corneal manifestations.
Introduction
Infectious keratitis (IK) is an ocular emergency and potentially sight-threatening condition caused by a variety of microorganisms, including bacteria, fungi, viruses, and parasites.1,2 It is essential for clinicians to find out the pathogen and perform targeted treatment as soon as possible to prevent destructive outcomes. Conventional laboratory examinations, including corneal scraping, Giemsa stain, and microbial culture, have been the gold standard for the diagnosis of IK, while the low positive rate of biopsy and long turn-around time limited its clinical application. 3 Therefore, ophthalmologists often need to make proper clinical diagnosis based on patients’ anterior segment characteristics. Different pathogens lead to various manifestations consisting of corneal ulceration, stromal infiltration, anterior chamber reaction, etc. Some studies have shown that IK caused by specific pathogens presented unique signs.4,5 For example, a stromal ring infiltrate usually becomes a hint for advanced Acanthamoeba keratitis (AK) with high sensitivity. 6 A large purulent infiltrate is highly related to gram-negative bacterial keratitis (BK). 7 Infiltrates with feathery, fluffy, or serrated margins are useful features for diagnosing fungal keratitis (FK).8–10
Although ophthalmologists from areas with high incidence of IK had more diagnosis experience and higher accuracy in IK diagnosis, 9 it still remains a problem for most ophthalmologists to distinguish IK. A multicenter study distributed 80 photographs of culture-proven and smear-proven BK and FK to 15 cornea specialists, and their diagnosis revealed that only 66% cornea specialists could distinguish BK from FK. 9 Another similar study with international ophthalmologists involved shown same dilemma as the area under the curve (AUC) for differentiating BK and FK was 0.72. 11 These studies indicate that human experts have difficulty in making clinical diagnosis with ocular manifestations IK presented. Therefore, there is an urgent need to develop an objective, rapid, and accurate clinical diagnostic system based on the clinic signs of IK.
Deep learning (DL)-based methods have been proved to have great potential dealing with complicated medical images.12,13 Some researchers have made efforts to improve the diagnosis of IK based on DL technology and ophthalmic imaging equipment.14–17 Slit-lamp photos and smartphone photos were already used for screening keratitis with DL-based method and got AUC of 0.990. 17 In Taiwan, different DL networks were applied to differentiate BK and FK with slit-lamp photos and got accuracy for diagnosing BK ranged from 79.6% to 95.9% and FK from 26.3% to 65.8%. 14 Another study focused on diagnosing BK using slit-lamp images and DL-based method, and retrieved 69%–72% accuracy. 16 These DL-based studies mainly concerned diagnosing IK caused by one or two certain types of pathogens. Recently in Japan, researchers collected 4306 slit-lamp images from 669 consecutive cases and first distinguished four main types of IK were with DL-based method. 15 Though they got accuracy above 85% for each label, they have mentioned their limited case numbers. In this study, we attempted to apply DL algorithms to current biggest IK slit-lamp image data set and distinguish four main types of IK, aiming to improve diagnostic accuracy of IK and provide a reference for clinics.
Materials and method
This was a retrospective study, and the research procedure was approved by the Medical Ethics Committee of Beijing Tongren Hospital (TRECKY2021-024). The study protocol fully adhered to the Declaration of Helsinki and the Association for Research in Vision and Ophthalmology (ARVO) statement on human subjects. All subjects or their guardians signed the written informed consent documents. The study was partitioned into four sections – data set building, image pre-processing, model training, and model validation. The code for training and assessing models was built with Python 3.10 and PyTorch framework. Figure 1 depicted the construction and validation of this model.

Deep learning framework for the diagnosis of IK based on slit-lamp images. (a) Data set establishment. Slit-lamp images were collected and annotated with etiological diagnosis label. Then labeled images were splitted into training, testing and external validation set, (b) Image pre-processing. After the original input images were resized to same height and width, image normalization, histogram equalization, and augmentation were applied to our data set successively, (c) Model training. Nine representative image classification networks were implemented with training data set. Models with high accuracy were combined using model blending technique to further improve the performance and (d) Model validation. Ten-fold cross-validation, t-SNE, ROC curves, confusion matrix, Grad-CAM visualization as well as comparation to human experts were used to assess the application potential of final model.
Data set building
Study population
Patients diagnosed with IK who presented to Beijing Tongren Hospital between June 2010 and May 2021 were recruited. The enrolled patients must meet one of the following criteria: (1) patients suspected with HSK should be diagnosed by three cornea specialists depending on their medical history, clinical manifestations, and effective response after empirical antiviral therapy; (2) FK, BK, or AK were defined as compatible clinical manifestations and at least one positive laboratory test (smear or microbial cultures). Patients were excluded if they had one of the following criteria: (1) patients with mixed ocular infections; (2) patients with a history of ocular inflammation, ocular trauma, or eye surgery; (3) patients without slit-lamp images or images with poor quality including diffuse illumination, out-of-focus images, incomplete lesion displaying, etc.
Pathogen identification
Corneal scraping for microbiological tests was performed under slit-lamp microscopy by an ophthalmologist. The samples were then placed on the glass slides for staining with Giemsa, calcofluor white, KOH, gram staining, etc. Blood agar medium, chocolate agar medium, potato dextrose medium, and Page’s medium with Escherichia coli were used to culture the microorganism from cornea lesions, including bacteria, fungi, and Acanthamoeba individuals. The grown colonies were identified by mass spectrometry.
Image collection
Corneal photography was performed by three certified ophthalmic technicians using Topcon SL-D7 slit-lamp microscopy (since June 2010), and Topcon SL-D701 (since January 2017). The resolution of captured photographs ranged from 1600 × 1200 to 2584 × 2000 pixels. The quality of image was assessed with following criterion – (1) image magnification was 10x or 16x and contained bulbar conjunctiva and full cornea; (2) image was correctly exposed and focused on cornea; (3) fluorescein-staining images were excluded. Any privacy information of patients was deleted. Slit-lamp images with multiple visits of the same patient were included. The labels of these slit-lamp photos were defined by their final etiological diagnosis.
Data set establishment
Overall, 5030 slit-lamp images were collected and 4830 slit-lamp images with etiological diagnosis label (AK, BK, FK, and HSK) were randomly divided into the training data set and the test data set with random split method provided by PyTorch, following the ratio 9:1. When splitting data set, images of the same patient would not appear in training and testing set at the same time. The other 200 photos from 200 patients (50 patients for each etiological diagnosis label) were randomly selected as the external validation set to evaluate the performance of KeratitisNet comparing with that of ophthalmologists [Figure 1(a)].
Power analysis
A total sample size of 5030 achieved 100% power to detect a change in sensitivity from 0.5 to 0.7 using a two-sided binomial test and 100% power to detect a change in specificity from 0.5 to 0.87 using a two-sided binomial test. The target significance level is 0.05. The actual significance level achieved by the sensitivity test is 0.0459 and the specificity test is 0.0467. The prevalence of the disease is 0.308.
Model construction
Image pre-processing
Image pre-processing is a critical stage for computer vision and convolutional neural network (CNN). With this procedure, unwanted distortions could be avoided and features of images would be enhanced. This module was built with transform API in PyTorch. First, the original input images with different size would be resized to 244 × 244 pixels with bilinear interpolation. Then, image normalization, histogram equalization, and augmentation were applied successively. For image normalization, the range of pixel intensity values was changed, so that every image had the same standard deviation [0.229, 0.224, 0.225] and mean value [0.485, 0.456, 0.406]. Histogram equalization, a method of distributing the frequency of pixel intensity to 0 and 255, could improve the contrast of the image and assist the model to obtain more detailed information from the training data set. The image augmentation contained random crop and flip, which helped the model to get rid of the possible adverse influence from the image position [Figure 1(b)].
Image classification
After image pre-processing, training data set was fed into nine popular representative image classification networks with different parameters (ResNet18, ResNet50, 18 DenseNet121, DenseNet169, 19 EfficientNet-b0, EfficientNet-b5, EfficientNet-b7, 20 ResNext101_32x8d, and ResNext101_32x16d). 21 Pre-trained model on ImageNet was conducted to avoid too much training epochs on small data set leading overfit. The learning rate was dynamically adjusted and set to grow linearly from 0 to target value, and then gradually transit to a cosine decay schedule. During the training period, model learned how to distinguish the type of infection from the training data set and then evaluated its performance including accuracy and AUC on the test data set. Models with high performance were combined using model blending technique to improve the performance and to fit as more features of slit-lamp images as possible [Figure 1(c)].
Model assessment
The application potential of the blending model was further assessed after model construction. However, 10-fold cross-validation was performed to reduce the influence of random factors during the calculation of accuracy, sensitivity, specificity, positive predictive value (PPV) and negative predictive value (NPV) of each model. Receiver operating characteristic curves (ROC), AUC, and confusion matrix were calculated to quantify the performance of the model. Three experienced cornea specialists were invited to make clinical diagnosis for each image in external validation set and competed with the prediction of model. Confusion matrix was calculated to measure differences. For more intuitive evaluation, gradient-wright class activation mapping (Grad-CAM) visualization and t-SNE were performed [Figure 1(d)].
10-fold cross-validation
The 10-fold cross-validation 22 was performed as follows. (1) After external validation set was picked out, the left data set was randomly divided into 10 groups. (2) Model was trained separately for 10 times. In each time, nine groups were chosen and used for training model, and the remaining group was used for testing. (3) For each iteration, accuracy, sensitivity, specificity, PPV, and NPV for each label would be calculated. After 10 times, all performance parameters would be averaged, so that they could assess the model on the whole data set rather than randomly selected onefold data. With the final averaged performance parameter, the confusion matrix and the ROC curves were calculated.
T-distributed stochastic neighbor embedding
T-distributed stochastic neighbor embedding (t-SNE) 23 was applied to group eyes with similar corneal characteristics together and to separate eyes with dissimilar characteristics as far away as possible. R program with Rtsne package was used for this procedure. t-SNE was well suited for visualization and monitoring the performance of a classifier by clinicians since it provided a user-friendly visualization, and it allowed subjective validation of clustering because one can see how the clusters are distributed and overlapped in two-dimensional space.
ROC curves
ROC 24 plotted true positive rate and false positive rate at every possible cut-off for each model. AUC was the entire two-dimensional area underneath ROC curve and was used to assess the performance of each model to distinguish among each type of IK.
Confusion matrix
Confusion matrix 25 demonstrated the misclassification similarity of a classifier. Element (i, j) of each confusion matrix represents the empirical probability of predicting class j given that the ground truth was class i. In this study, confusion matrix was used to measure the possibility of misclassification for models and ophthalmologists.
Comparation with ophthalmologists
Three experienced cornea specialists were invited to view the external validation set and make clinical diagnosis for each image. Confusion matrix was calculated and the accuracy for IK diagnosis was analyzed between the models and ophthalmologists.
Grad-CAM visualization
A thermal map with the same size as the original images was obtained through Grad-CAM visualization 26 to better explain the neural network. Red area on the thermal map represented greater contribution to the prediction, which could tell whether the prediction was made based on the lesion area.
Statistical analysis
The performance indices, including sensitivity, specificity, PPV, NPV, and diagnostic accuracy of each label, were calculated using Jupyter Notebook with Python version 3.10. Chi-square test and Fisher’s exact test were used for comparing the accuracy of distinguishing IK between ophthalmologists and model via R program (V.4.0, R Foundation for Statistical Computing, Vienna, Austria).
Results
Data set characteristics
Overall, 5030 slit-lamp images from 4283 patients were collected from patients confirmed IK between June 2007 and May 2018. However, 200 images from 200 patients (50 patients for each etiological diagnosis label) were picked out as the external validation set. The remaining data set containing 4830 images from 4083 patients consisted of 1490 (30.8%) BK, 1670 (34.6%) FK, 600 (12.4%) HSK, and 1070 (22.2%) AK. Meanwhile, 323 AK patients had multiple visits and their follow-up slit-lamp images were included in data set. After randomly splitting with the ratio 9:1, 1341 BK, 1503 FK, 540 HSK, and 963 AK were included in the training data set, and the testing data set contained 149 BK, 167 FK, 60 HSK, and 107 AK.
Performance of different models
In this study, nine methods for model development (ResNet18, ResNet50, DenseNet121, Den seNet169, EfficientNet-b0, EfficientNet-b5, Effi cientNet-b7, ResNext101_32x8d, and ResNext 101_32x16d) were first conducted and evaluated with 10-fold cross-validation. The performance of these models was shown in Table 1, and the ROC curve and AUC for diagnosing each type of IK were shown in Figure 2. ResNext101_32x16d presented the highest average accuracy (75.83%) in the classification of four common types of IK and showed 69.59% accuracy in diagnosing BK (AUC = 0.84), 75.30% in FK (AUC = 0.90), 84.76% in AK (AUC = 0.96), and 75.86% in HSK (AUC = 0.98). Model blending technology was applied on ResNext101_32x16d with other models. Eight blending models were constructed and assessed with 10-fold cross-validation. Their accuracy of distinguishing IK was shown in Figure 3, and the ROC curve and AUC were shown in Figure 4. There were no significant differences between blending models (all ps > 0.05).
Performance of different models in classification of four common types of IK.
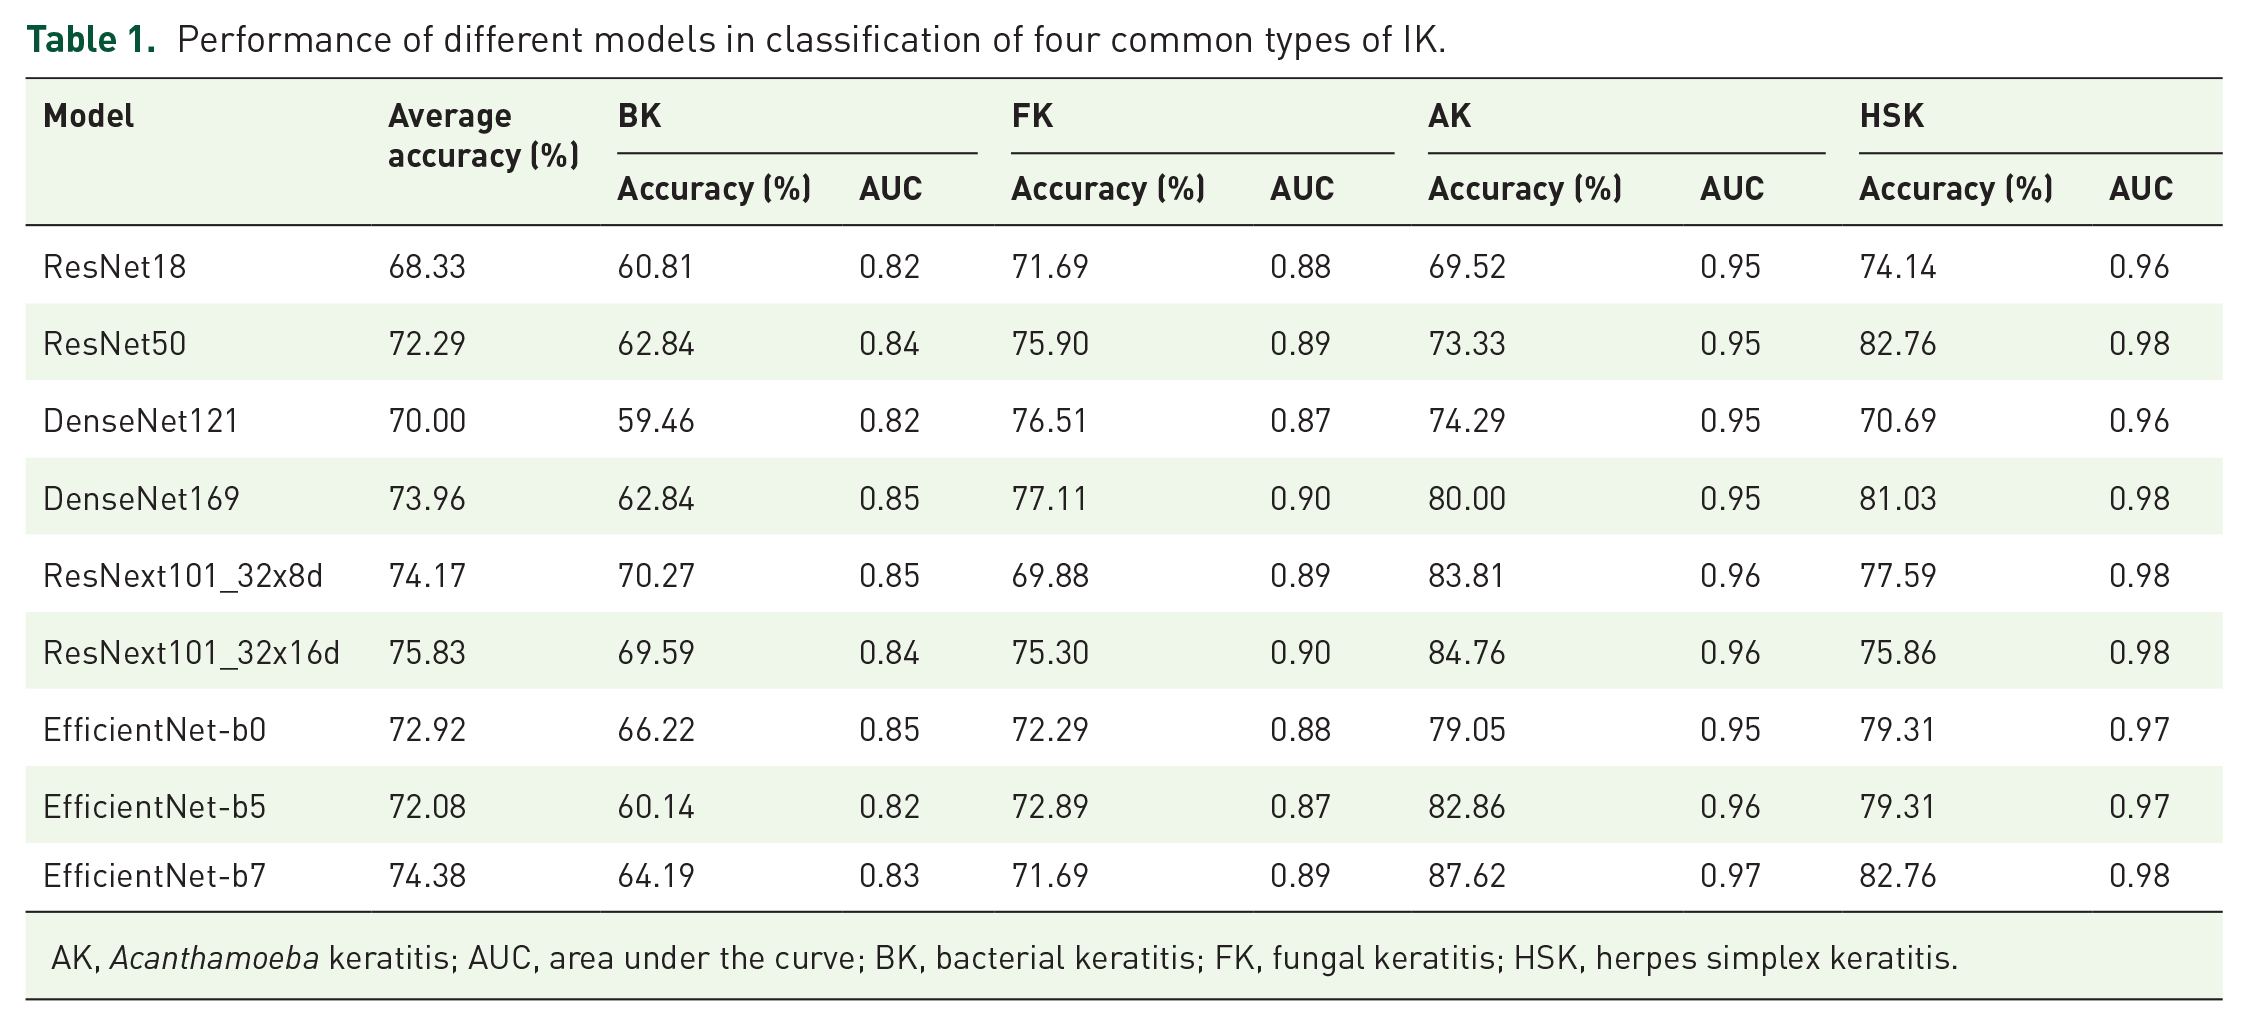
AK, Acanthamoeba keratitis; AUC, area under the curve; BK, bacterial keratitis; FK, fungal keratitis; HSK, herpes simplex keratitis.

Performance of distinguishing IK-embodied ROC curve in different classification models.
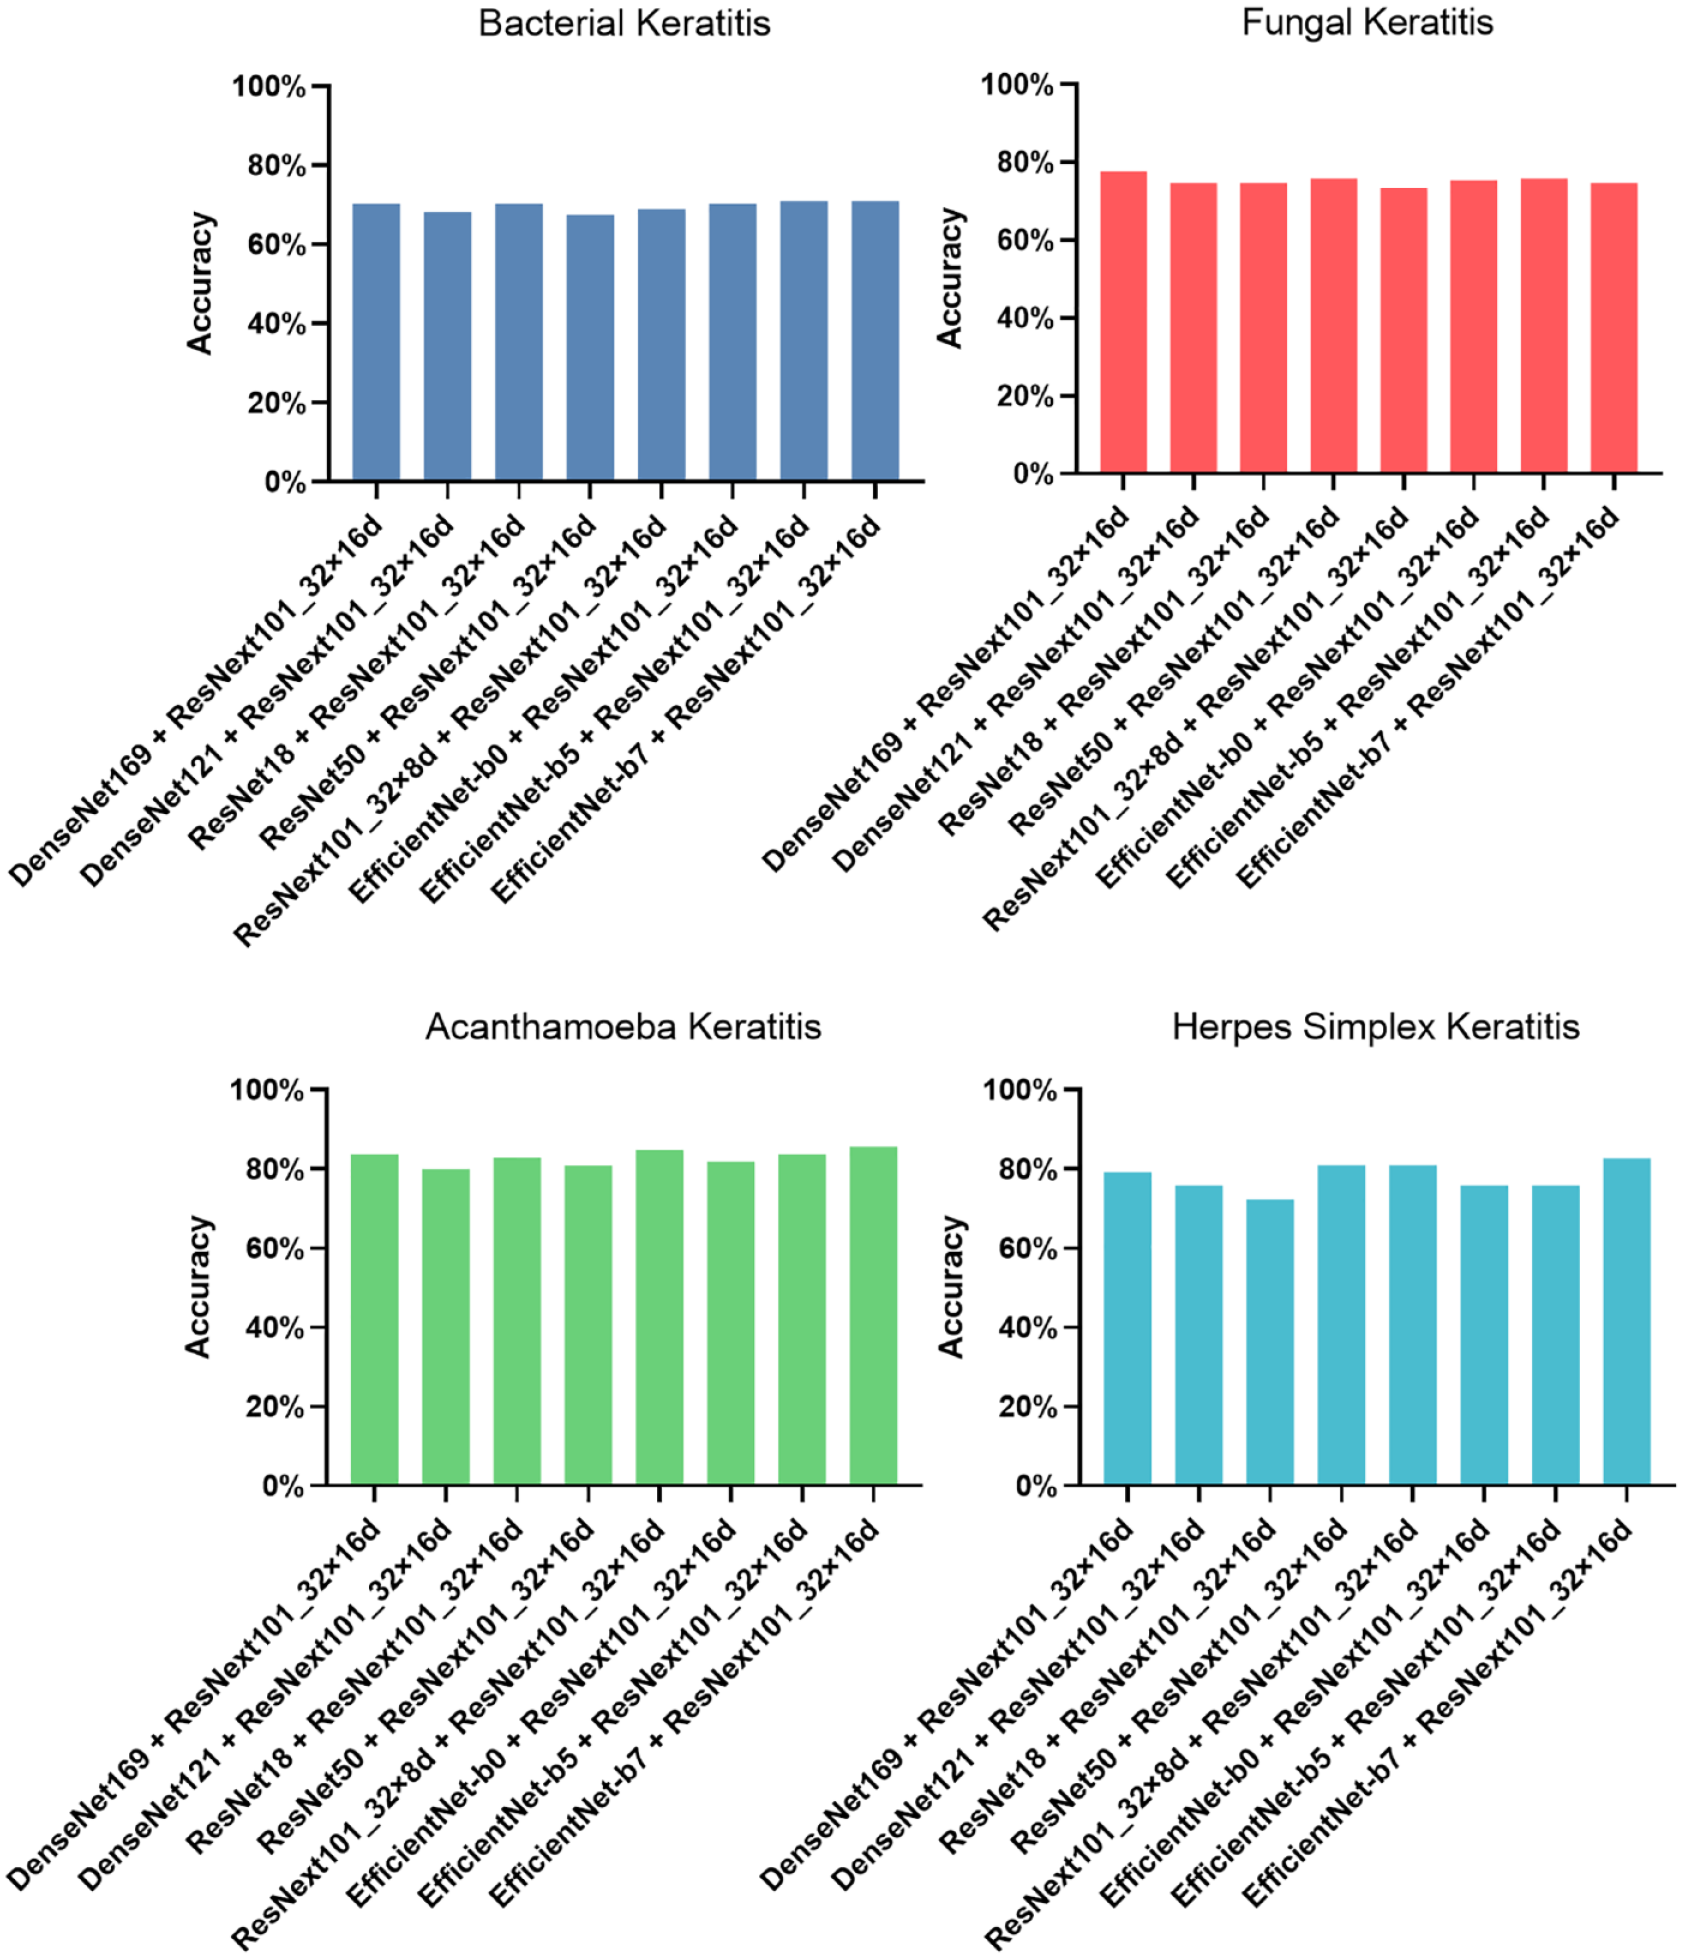
Accuracy of distinguishing IK with different blending models.

Performance of distinguishing IK-embodied ROC curve in different blending models.
Assessment of KeratitisNet
The combination of ResNext101_32x16d and DenseNet169 further improved the performance of diagnosing BK, FK, and HSK and was chosen to be the final modeling method, namely KeratitisNet, which demonstrated the highest average accuracy 77.08%. The accuracy for diagnosing BK, FK, AK and HSK of KeratitisNet was 70.27%, 77.71%, 83.81%, and 79.31%, and AUC was 0.86, 0.91, 0.96, and 0.98, respectively. The classification ability of KeratitisNet was further visualized via t-SNE. Slit-lamp images of IK were mainly divided into four clusters (Figure 5).
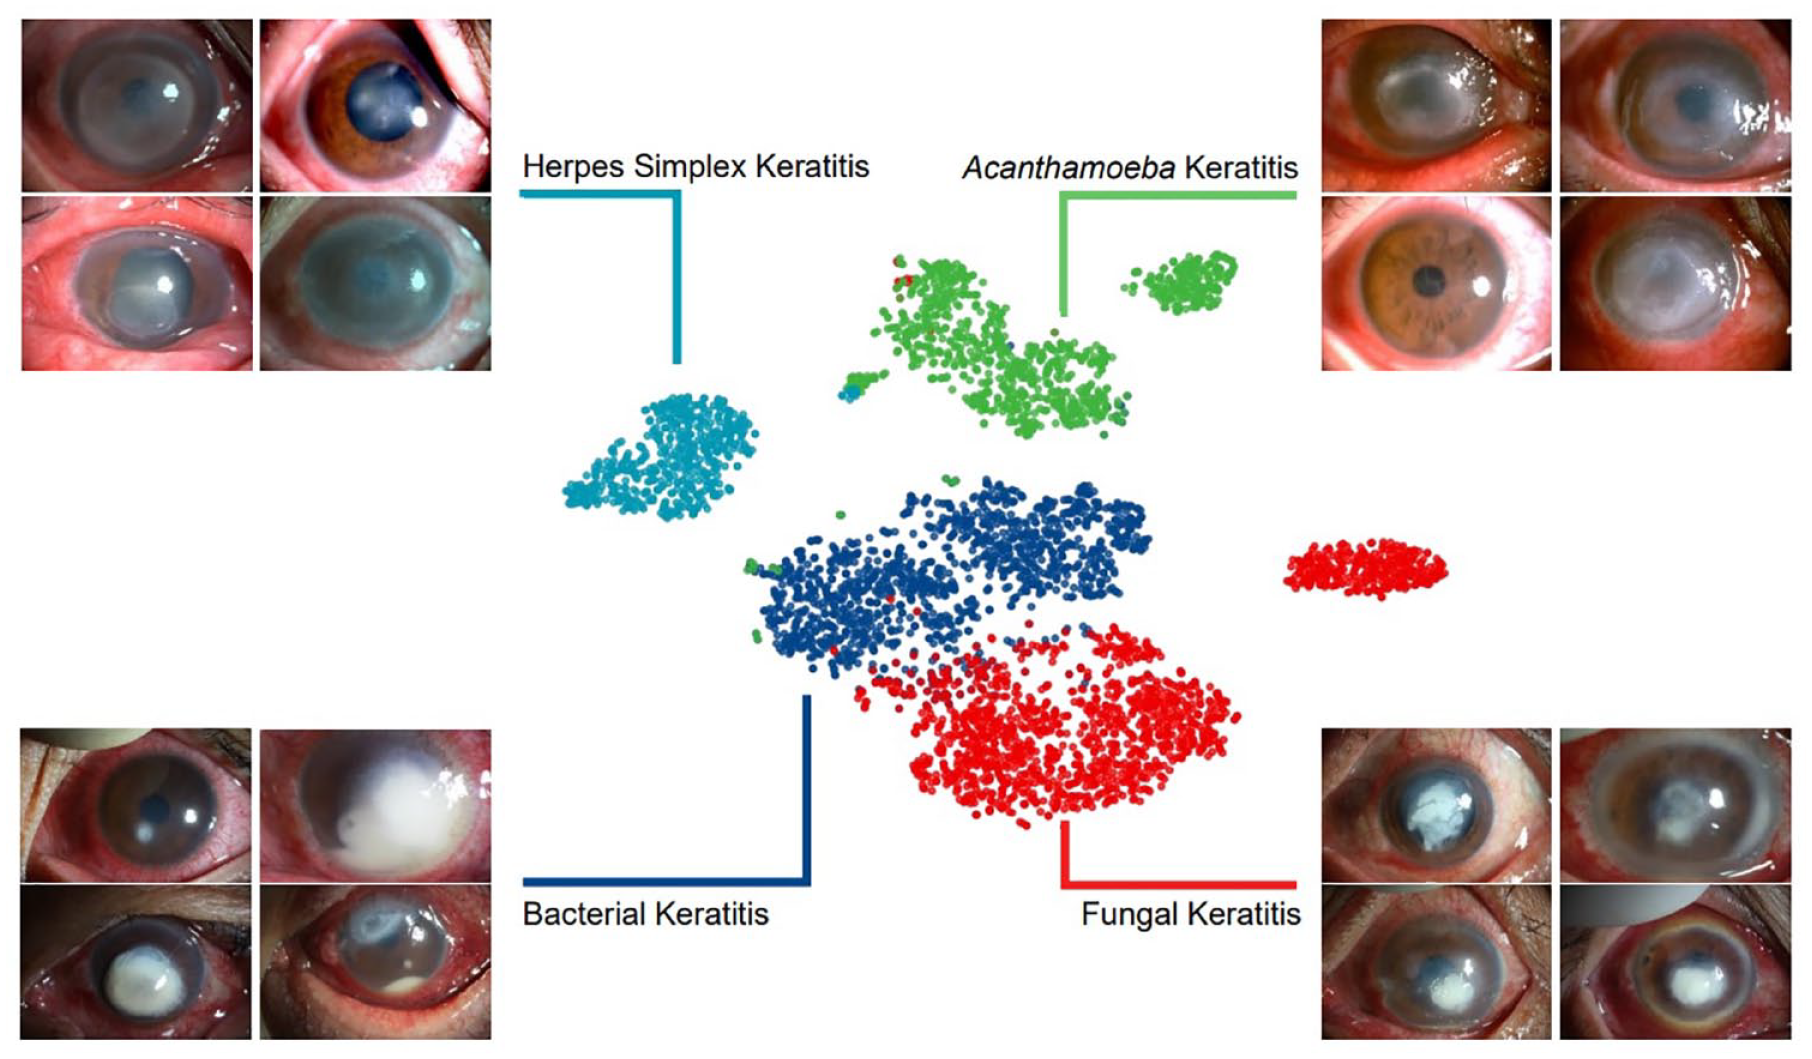
The t-SNE visualization of the pooling layer of KeratitisNet.
The correct prediction rate and misclassification rate of KeratitisNet to these four types of IK were evaluated with confusion matrix [Figure 6(a)]. The recall rate of diagnosing BK, FK, AK, and HSK was 70%, 78%, 84%, and 80%, respectively. KeratitisNet was mainly confused in distinguishing BK and FK. There were 20% BK cases mispredicted into FK and 16% FK cases mispredicted into BK.

Confusion matrix of KeratitisNet and ophthalmologists in distinguishing IK. (a) Confusion matrix for prediction of KeratitisNet in test data set and (b) Confusion matrix for three ophthalmologists making clinical diagnosis among external validation set.
Confusion matrix for the three ophthalmologists making clinical diagnosis among external validation set was showed in Figure 6(b). The recall rate of diagnosing BK, FK, AK, and HSK was significantly lower than those of KeratitisNet on external validation set (BK 47% versus 98%; FK 63% versus 92%; AK 31% versus 94%; HSK 59% versus 96%, all ps < 0.001). Heatmaps (Figure 7) produced by Grad-CAM algorithm could provide clinicians with visual explanations for KeratitisNet. In most IK images, the model could focus prediction weights on most infiltration and ulceration, which made results more convincing.
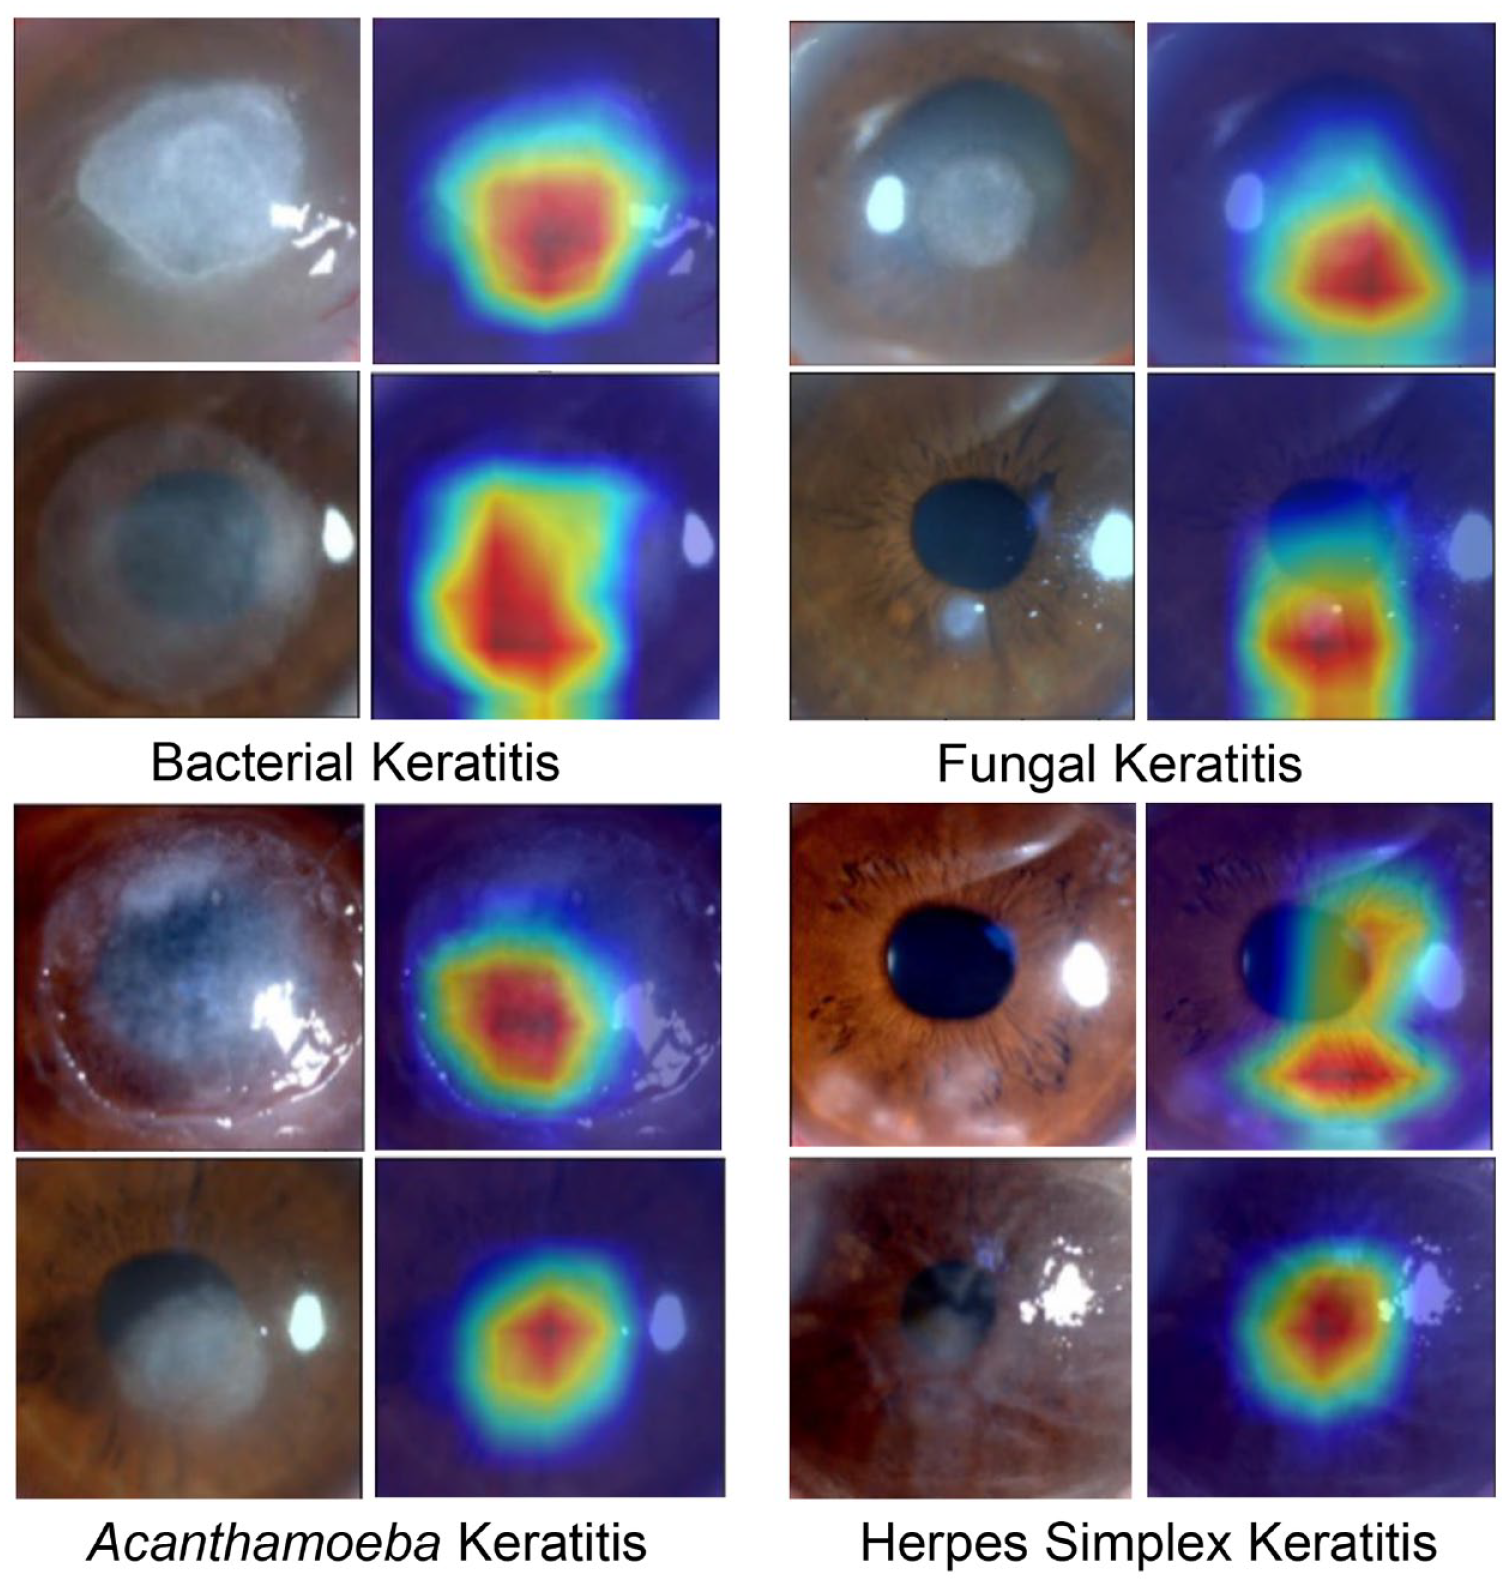
Heatmaps of cornea images of IK produced by Grad-CAM algorithm.
Discussion
In this study, an auxiliary diagnostic system was established with DL algorithm to improve the speed and accuracy of IK diagnosis. Nine different modeling methods were conducted with a total of 4830 slit-lamp images. ResNext101_32x16d reached the highest average accuracy in the classification of four common types of IK. To further improve the accuracy, eight blending methods between ResNext101_32x16d and other models were conducted. KeratitisNet, the combination of ResNext101_32x16d and DenseNet169, retrieved the highest average accuracy 77.08%, with no significant difference compared with other combinations. Xu et al. 27 developed a sequential-level deep model to distinguish BK, FK, HSK, and other cornea diseases, and the model received 78.73% accuracy, slightly higher than mean accuracy of our KeratitisNet in distinguishing BK, FK, AK, and HSK. Their research presented partition sampling was beneficial for model to extract feature of cornea in slit-lamp images. However, their data set consisted only 2284 images from 867 patients, which was smaller than data set in this research. Moreover, they did not collect AK, a destructive infectious cornea disease with rising incidence. 28 The accuracy of KeratitisNet for diagnosing BK, FK, AK and HSK was 70.27%, 77.71%, 83.81%, and 79.31%, and AUC was 0.86, 0.91, 0.96, and 0.98, respectively. Koyama et al. 15 built a similar computer-assisted diagnosis system based on InceptionResNetV2 with 4306 slit-lamp images from 362 consecutive cases. The AUC in their study for diagnosing BK, FK, HSK, and AK was 0.963, 0.975, 0.946, and 0.995. The reason for lower AUC in this study may be the difference between data sets. In their study, data set contained 4306 slit-lamp images from only 669 consecutive IK cases, which meant there were multiple images from the same patient in their training data set. Training on multiple photos of the same eye may allow model to better learn the characteristics of each type of IK. In our study, larger patient numbers lead to more complicated image data set and thus our model performed relatively poorly but more robust.
Through the t-SNE algorithm, the dimension of input data was reduced, 29 and images with similar characteristics in the t-SNE space were clustered. Clear boundaries between each type of cluster may suggest that different types of corneal infection result in characteristic corneal manifestations, with which it was possible to make rapid and accurate clinical diagnosis. However, there were still some slit-lamp photos mixed with other clusters in the t-SNE space. The points represented for BK and FK were closed. This may indeed result from the similar clinical features between them and explained the high misprediction rate of KeratitisNet in distinguishing BK and FK. Some points of AK were clustered close to BK, which may also result from the same reason.
Confusion matrix revealed that the recall rate of KeratitisNet in diagnosing BK, FK, AK, and HSK was 70%, 78%, 84%, and 80%, respectively. The most easily mispredicted IK was BK and FK. However, 20% cases of BK were misclassified into FK and 16% FK cases were into BK. As some researches reported,5,8 accurate distinguishing of BK and FK was a difficult task for both DL-based models and even human ophthalmologists. Hung et al. 14 designed a DL-based model based on DenseNet161 for the identification of BK and FK and 1330 images from 580 patients, and the accuracy for diagnosing FK was 65.8%, which meant 34.2% cases of FK were misclassified into BK. Kuo et al. 16 developed a DL-based slit-lamp photo diagnostic model concentrating on distinguishing FK and non-FK, based on DenseNet, and they got 69.4% accuracy in diagnosing FK. In this study, a larger data set was prepared, and our KeratitisNet could identify IK with higher accuracy.
Three corneal specialty ophthalmologists were invited to view the external validation set and make clinical diagnosis. Their recall rate of diagnosing BK, FK, AK, and HSK was 47%, 63%, 31%, and 59%, respectively. KeratitisNet had significantly higher diagnostic ability than experts for each type of infection (all ps < 0.001). Compared to expert diagnosis conducted by Kuo et al., 16 the accuracy to identify FK of our experts was lower. This may result from more IK type options to exclude.
There were still some limitations in our study. First, due to the variable incidence of BK, FK, AK, and HSK, we were unable to obtain a larger and more homogeneous data set, which limited the accuracy of KeratitisNet. Considering the lower incidence of AK and to avoid unbalanced data sets affecting the validity of the model, follow-up slit-lamp photos of AK patients were added into our data sets. Large public IK database of slit-lamp images is necessary to further improve the accuracy of DL-based diagnostic models. More importantly, models from different studies could be compared on public data set. Second, since we developed IK models from specialized hospital-based data, the aspect of generalizability (external validity) of our models for use in other populations of IK patients should be concerned although 10-fold cross-validation was performed. We were looking forward to improving the robustness of KeratitisNet via collecting IK patients from other centers and feeding models with more data. Third, KeratitisNet was trained by feeding images directly. Some studies4,30–33 have already proved that using characteristic clinical signs could improve the accuracy of diagnosing FK. More detailed annotation was beneficial for the model to learn more meaningful features for IK diagnosis.
In conclusion, we constructed a DL-based model named KeratitisNet, which retrieved 77.08% average accuracy for distinguishing BK, FK, AK, and HSK, and was significantly more precise than corneal specialty ophthalmologists. These results further demonstrated that DL could provide an auxiliary diagnostic method to help clinicians suspect IK using different corneal manifestations caused by different pathogens.
Conclusion
Based on the world biggest IK slit-lamp databases, KeratitisNet demonstrated a good performance on clinical IK diagnosis and classification. DL could provide an auxiliary diagnostic method to help clinicians suspect IK using different corneal manifestations.