
Abstract
Background:
Periodontitis is one of the most common diseases associated with the oral cavity. Previous studies have suggested that there is an association between periodontitis and metabolic dysfunction. Recently, the triglyceride glucose (TyG) index, high-density lipoprotein cholesterol (TG/HDL-C) ratio, and metabolic score for insulin resistance (METS-IR) index have been identified as useful markers for assessing insulin resistance.
Objective:
This study aimed to evaluate the relationship between periodontitis and non-insulin-based insulin resistance (IR) indices and compare the predictive values of these indices in the Korean population.
Design:
This is a cross-sectional study.
Methods:
A total of 13,584 participants were included in the 2013–2015 Korean National Health and Nutrition Examination Survey data. A community periodontal index score⩾3 was used to define periodontitis. Participants were divided into quartiles according to each index. Odds ratios (ORs) and 95% confidence intervals (CIs) for the prevalence of periodontitis and the TyG index, TG/HDL-C ratio, and METS-IR index quartiles were calculated using multiple logistic regression analysis. We estimated the areas under the receiver operating characteristic curves (AUCs) of the indices to compare the predictive values of the three indices.
Results:
Compared with quartile 1, the fourth quartile ORs (95% CIs) for periodontitis were 1.23 (1.01–1.49) for the TyG index, 1.23 (1.02–1.48) for the TG/HDL-C ratio, and 1.53 (1.25–1.88) for the METS-IR index after adjustment for confounders. The AUC (95% CIs) was 0.608 (0.598–0.618) for the TyG index, 0.600 (0.590–0.610) for the TG/HDL-C ratio, and 0.617 (0.608–0.627) for the METS-IR index to identify periodontitis. The predictive power of METS-IR was significantly higher than that of the TyG index and TG/HDL-C.
Conclusion:
Higher TG/HDL-C ratio, TyG, and METS-IR indices are associated with a higher prevalence of periodontitis. The METS-IR index is a more powerful predictor of periodontitis prevalence than the TyG index and TG/HDL-C ratio.
Introduction
Periodontitis is a gingival inflammation accompanied by the loss of supportive connective tissue, including the periodontal ligament and alveolar bone. 1 Periodontitis is considered one of the crucial risk factors for worsening oral health and one of the leading causes of tooth loss. 2 According to the 2016 Global Burden of Diseases study, periodontal diseases are the 11th most prevalent diseases with a worldwide prevalence of up to 50%. 3
Periodontitis has considerable effects on the social healthcare system and individual quality of life. 4 A meta-analysis of eight cohort studies suggested that periodontitis is related to a 19% increase in the risk of cardiovascular disease. 5 Another meta-analysis of 11 epidemiologic studies reported that periodontitis with elevated bacterial exposure was significantly associated with elevated coronary heart disease (CHD) and early atherosclerosis. 6 According to previous studies, a higher incidence of periodontitis was also closely related to an increased risk of diverse cancers, including tongue, oral, gastric, and esophageal cancers.7–9 A systemic review showed that periodontitis is related to worsened glycemic control, leading to an increased risk of type 2 diabetes mellitus (DM) and its complications. 10 Previous studies have found significant associations between the presence of periodontitis and metabolic dysfunction, such as obesity, dyslipidemia, and insulin resistance (IR).11–13 In patients with periodontitis, microbial dysbiosis from increased bacteria in periodontal pockets was shown to be related to metabolic dysfunction and inflammation-induced IR by triggering chronic inflammation.14–16
IR is a state of impaired biological response to insulin-mediated glucose disposal in the liver, muscle, and adipose tissue. 17 In addition, IR plays an essential role in the development of type 2 diabetes, 17 obesity, 18 dyslipidemia, 19 and cardiovascular diseases. 20 Therefore, many researchers have attempted to develop simple and reliable alternative IR markers. Recently, the triglyceride glucose (TyG) index, which consists of serum triglyceride (TG) level and fasting plasma glucose (FPG) level, has been considered a surrogate marker for assessing IR. 21 Many studies have demonstrated that the predictive power of the TyG index is superior to that of the homeostasis model assessment estimate of insulin resistance (HOMA-IR) in identifying metabolic syndrome. 22 Jing Wen et al. 23 found that the TyG index was more closely related to the prevalence of prediabetes than other IR indices in the Chinese population. Kim et al. 24 suggested that the TG to high-density lipoprotein cholesterol (TG/HDL-C) ratio was significantly associated with IR evaluated by HOMA-IR regardless of waist circumference (WC). Bello-Chavolla et al. 25 developed a novel metabolic score for insulin resistance (METS-IR) index using biochemical measurement and anthropometric variables easily obtained in primary care clinics, and demonstrated good diagnostic performance to assess insulin sensitivity.
A pilot study which included 37 patients with severe periodontitis and 37 individuals with healthy periodontium reported that HOMA-IR was significantly higher in patients with periodontitis than in healthy controls. 26 A recent study found that high TyG levels were associated with increased odds of periodontitis in the US population. 27 Kwon et al. 28 found a significant association between TG/HDL-C ratio and the prevalence of periodontitis in the Korean population. No previous studies, however, have investigated the relationship between the METS-IR index and periodontitis. Therefore, this study aimed to reveal the association between periodontitis and non-insulin-based IR indices, including the TyG index, TG/HDL-C ratio, and METS-IR index, using large population-based Korean cohorts. We also compared the predictive performance of the TyG index, TG/HDL-C ratio, and METS-IR index for periodontitis.
Methods
Study population
This cross-sectional study used data from the phase VI (2013–2015) Korean National Health and Nutrition Examination Survey (KNHANES), performed annually by the Korea Centers for Disease Control and Prevention (KCDC). The purpose of this survey was to provide representative and trustworthy statistical information about the health status, health behaviors, and nutritional status of Koreans. The sampling design of this study was a multi-stage clustered probability sampling, and the sample weights for participants were allocated to best represent all of Koreans after considering the nonresponse rate and post-stratification. 29 The KNHANES consists of a health interview survey, health behavior survey, health examination survey, and nutrition survey. Health examinations included anthropometric measurements, blood pressure measurements, oral examinations, and laboratory tests. The health examinations in the KNHANES collect information regarding chronic diseases such as diabetes, obesity, and hypertension (HTN). According to standardized protocols, all health examination procedures are performed by trained medical staff. Blood samples are collected to obtain laboratory results that provide prevalence estimates for diabetes, dyslipidemia, and infectious diseases, information on exposure to heavy metals, and kidney and thyroid functions. 29
A total of 22,948 participants were recruited during the 2013–2015 KNHANES. We included participants over 20 years of age (n = 17,780) and excluded those without oral examination data, who had missing data on oral examination (n = 3044), TyG index (n = 2523), TG/HDL-C ratio (n = 2519), or METS-IR index (n = 2544). As a result, 13,584 participants were included in this study (Figure 1). Prior to the survey, all participants provided written informed consent. This study was approved by the Institutional Review Board of Yongin Severance Hospital (IRB no. 2019-0011-001).
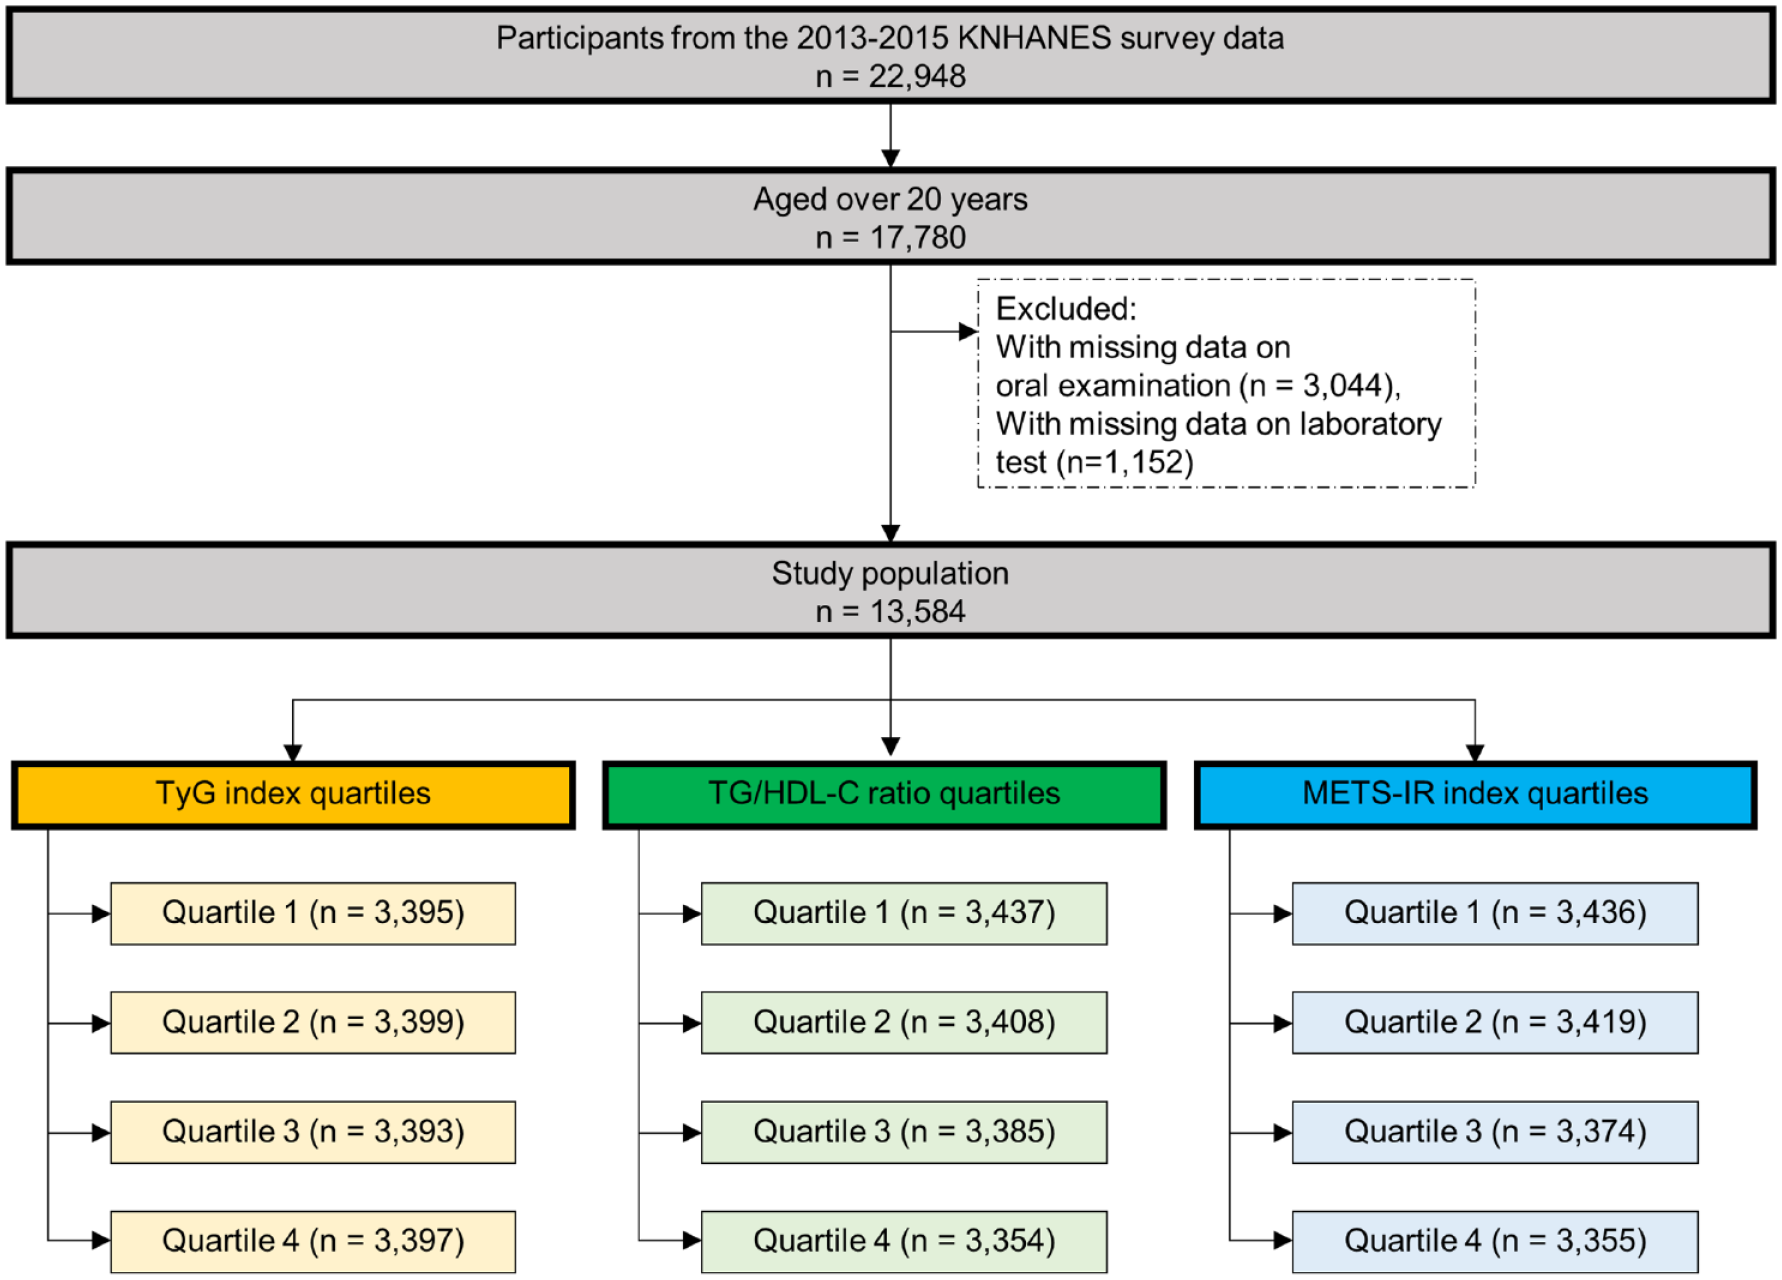
Flow chart describing the study population selection.
Data collection
Sociodemographic data were obtained through face-to-face interviews. Confounders were determined as variables influencing exposure and outcome; demographics (age and sex), anthropometric measurement [body mass index (BMI)], lifestyle (current smoking, regular drinking, and regular exercise), underlying diseases (HTN, DM, and dyslipidemia), and oral health behaviors (brushing before sleep, and use of floss) based on the univariate analysis and literature review.28,30–32 The BMI was calculated as the ratio of weight in kilograms to height in meters squared (kg/m2). 33 WC was measured at the midpoint of the mid-axillary line between the superior iliac crest and inferior aspect of the 12th rib. 34 Systolic blood pressure (SBP) and diastolic blood pressure (DBP) were measured three times at intervals of 5 min using a standard mercury sphygmomanometer (Baumanometer; W.A. Baum Co., Inc., Copiague, NY, USA). 29 The average values of the last two results were recorded. The FPG, total cholesterol, TG, and HDL-C levels were obtained from samples collected after overnight fasting which were analyzed using a Hitachi Automatic Analyzer 7600-210 (Hitachi Co., Tokyo, Japan). 29 The TyG index was defined as follows: ln [serum TG level (mg/dl) × FPG (mg/dl)/2] 35 and METS-IR was calculated using the following equation: METS-IR = ln [(2 × FPG (mg/dl) + serum TG level (mg/dl)) × BMI (kg/m2)]/ln [serum HDL-C level (mg/dl)]. 25
We defined current smokers as those who had smoked more than 100 cigarettes during their lifetime. 36 People who exercised regularly indicated that they performed mild physical activity for more than 30 min a day on more than 5 days a week. 28 Current drinkers were defined as those drinking alcohol more than twice per week. 37 HTN was defined as SBP ⩾ 140 mmHg, DBP ⩾ 90 mmHg, previously diagnosed HTN, or use of antihypertensive medications. 38 DM was defined as an FPG level ⩾ 126 mg/dl, previously diagnosed diabetes, or the use of anti-diabetic medications. 39
Dyslipidemia was defined as previously diagnosed dyslipidemia or the use of lipid-lowering drugs. According to previous studies, high serum levels of total cholesterol (>200 mg/dl), low serum levels of HDL-C (<40 mg/dl), or high serum levels of TG (>150 mg/dl) were defined as dyslipidemia. 40 Oral health behaviors including brushing before sleep, use of dental floss, use of interdental brush, and history of current oral examination within 1 year were assessed via a self-reporting questionnaire.
Assessment of periodontal disease
We used the community periodontal index (CPI) tool based on World Health Organization (WHO) 41 guidelines to diagnose periodontitis. The CPI tool contains five categories. Healthy periodontal conditions are defined as ‘score 0’, and if there is gingival bleeding on probing, the condition is categorized as ‘score 1’. Furthermore, if there is calculus deposition with less than 3 mm pocket depth, the condition is categorized as ‘score 2’. Shallow periodontal pockets of 4–5 mm depth are defined as ‘score 3’, and deep periodontal pockets over 6 mm in depth are categorized as ‘score 4’. In this study, periodontitis was defined as a CPI score of more than or equal to ‘score 3’ in at least one site. The 10 index teeth (11, 16, 17, 26, 27, 31, 36, 37, 46, and 47) were examined in adults older than 20 years, according to the Federation Dentaire Internationale Numbering System (FDI). A lower score was assigned when the dentist found it challenging to decide between the two standards. After all the index teeth had been examined, the highest score was assigned. The dentists performing these examinations utilized plane mouth mirrors and CPI probes with a 0.5-mm ball tip that met the WHO specifications. 41
Statistical analyses
Considering the complex survey design for collecting representative data of the Korean population, the KNHANES data were examined by applying sample weights to the study population. The sample weights for the age- and sex-specific variables were adjusted using the inverse values of the selection probability and those of the response rates (poststratification). 29 The sample size used in this study was sufficiently large to detect significant ORs over 90% power (Q1 versus Q4). Therefore, this study’s population was large enough to detect meaningful associations.
Subjects were categorized into quartiles (Qs) according to the TyG index, TG/HDL-C ratio, and METS-IR index as follows: Q1 < 8.14, 8.14 ⩽ Q2 < 8.57, 8.57 ⩽ Q3 < 9.03, and 9.03 ⩽ Q4 for the TyG index; Q1 < 1.32, 1.32 ⩽ Q2 <2.18, 2.18 ⩽ Q3 < 3.64, and 3.64 ⩽ Q4 for the TG/HDL-C ratio; and Q1 < 2.15, 2.15 ⩽ Q2 <2.28, 2.28 ⩽ Q3 < 2.43, and 2.43 ⩽ Q4 for the METS-IR index. Baseline characteristics of the study population were described with the mean value for continuous variables or percentage for categorical variables, and standard errors (SEs) were analyzed by descriptive statistics. The clinical characteristics of subjects based on the prevalence of periodontitis were analyzed using a weighted one-way analysis of variance for continuous variables and a weighted Chi-square test for categorical variables. All data are represented as the mean value ± SEs or number (percentage). Multiple logistic regression analysis was conducted to calculate odds ratios (ORs) and 95% confidence intervals (CIs) for a higher incidence of periodontitis along with the TyG index, TG/HDL-C ratio, and METS-IR index quartiles, respectively. Variables found to be closely associated with periodontitis (p < 0.05) in the initial analysis were imported into the final multivariate models, as were variables known to be risk factors or related factors for periodontitis including age, BMI, smoking, alcohol consumption, oral health–related behavior, and chronic diseases such as diabetes, hypertension, and dyslipidemia.28,30–32 Model 1 was unadjusted. In model 2, we adjusted for age, sex, and BMI. We additionally adjusted for variables including current smoking, regular drinking, HTN, DM, and dyslipidemia in model 3. In model 4, we finally adjusted for age, sex, BMI, current smoking, regular drinking, regular exercise, hypertension, DM, dyslipidemia, brushing before sleep, and use of floss. We also assessed the interaction between IR markers and sex on periodontitis. Analyses were conducted using the SPSS statistical software (SPSS version 23.0; IBM Corp., Armonk, NY, USA). Statistical significance was set at p < 0.05, and all statistical tests were two-sided. The R package version 4.1.2 (R Foundation for Statistical Computing, Vienna, Austria) was used to determine the relationship between the prevalence of periodontitis and each index in the form of a restricted cubic spline curve in the unadjusted model. Receiver operating characteristics (ROC) analysis was performed, and the areas under the ROC curves (AUCs) were used to compare the predictive powers of the TyG index, TG/HDL ratio, and METS-IR for prevalence. Post hoc comparisons of the AUC were also performed.
Results
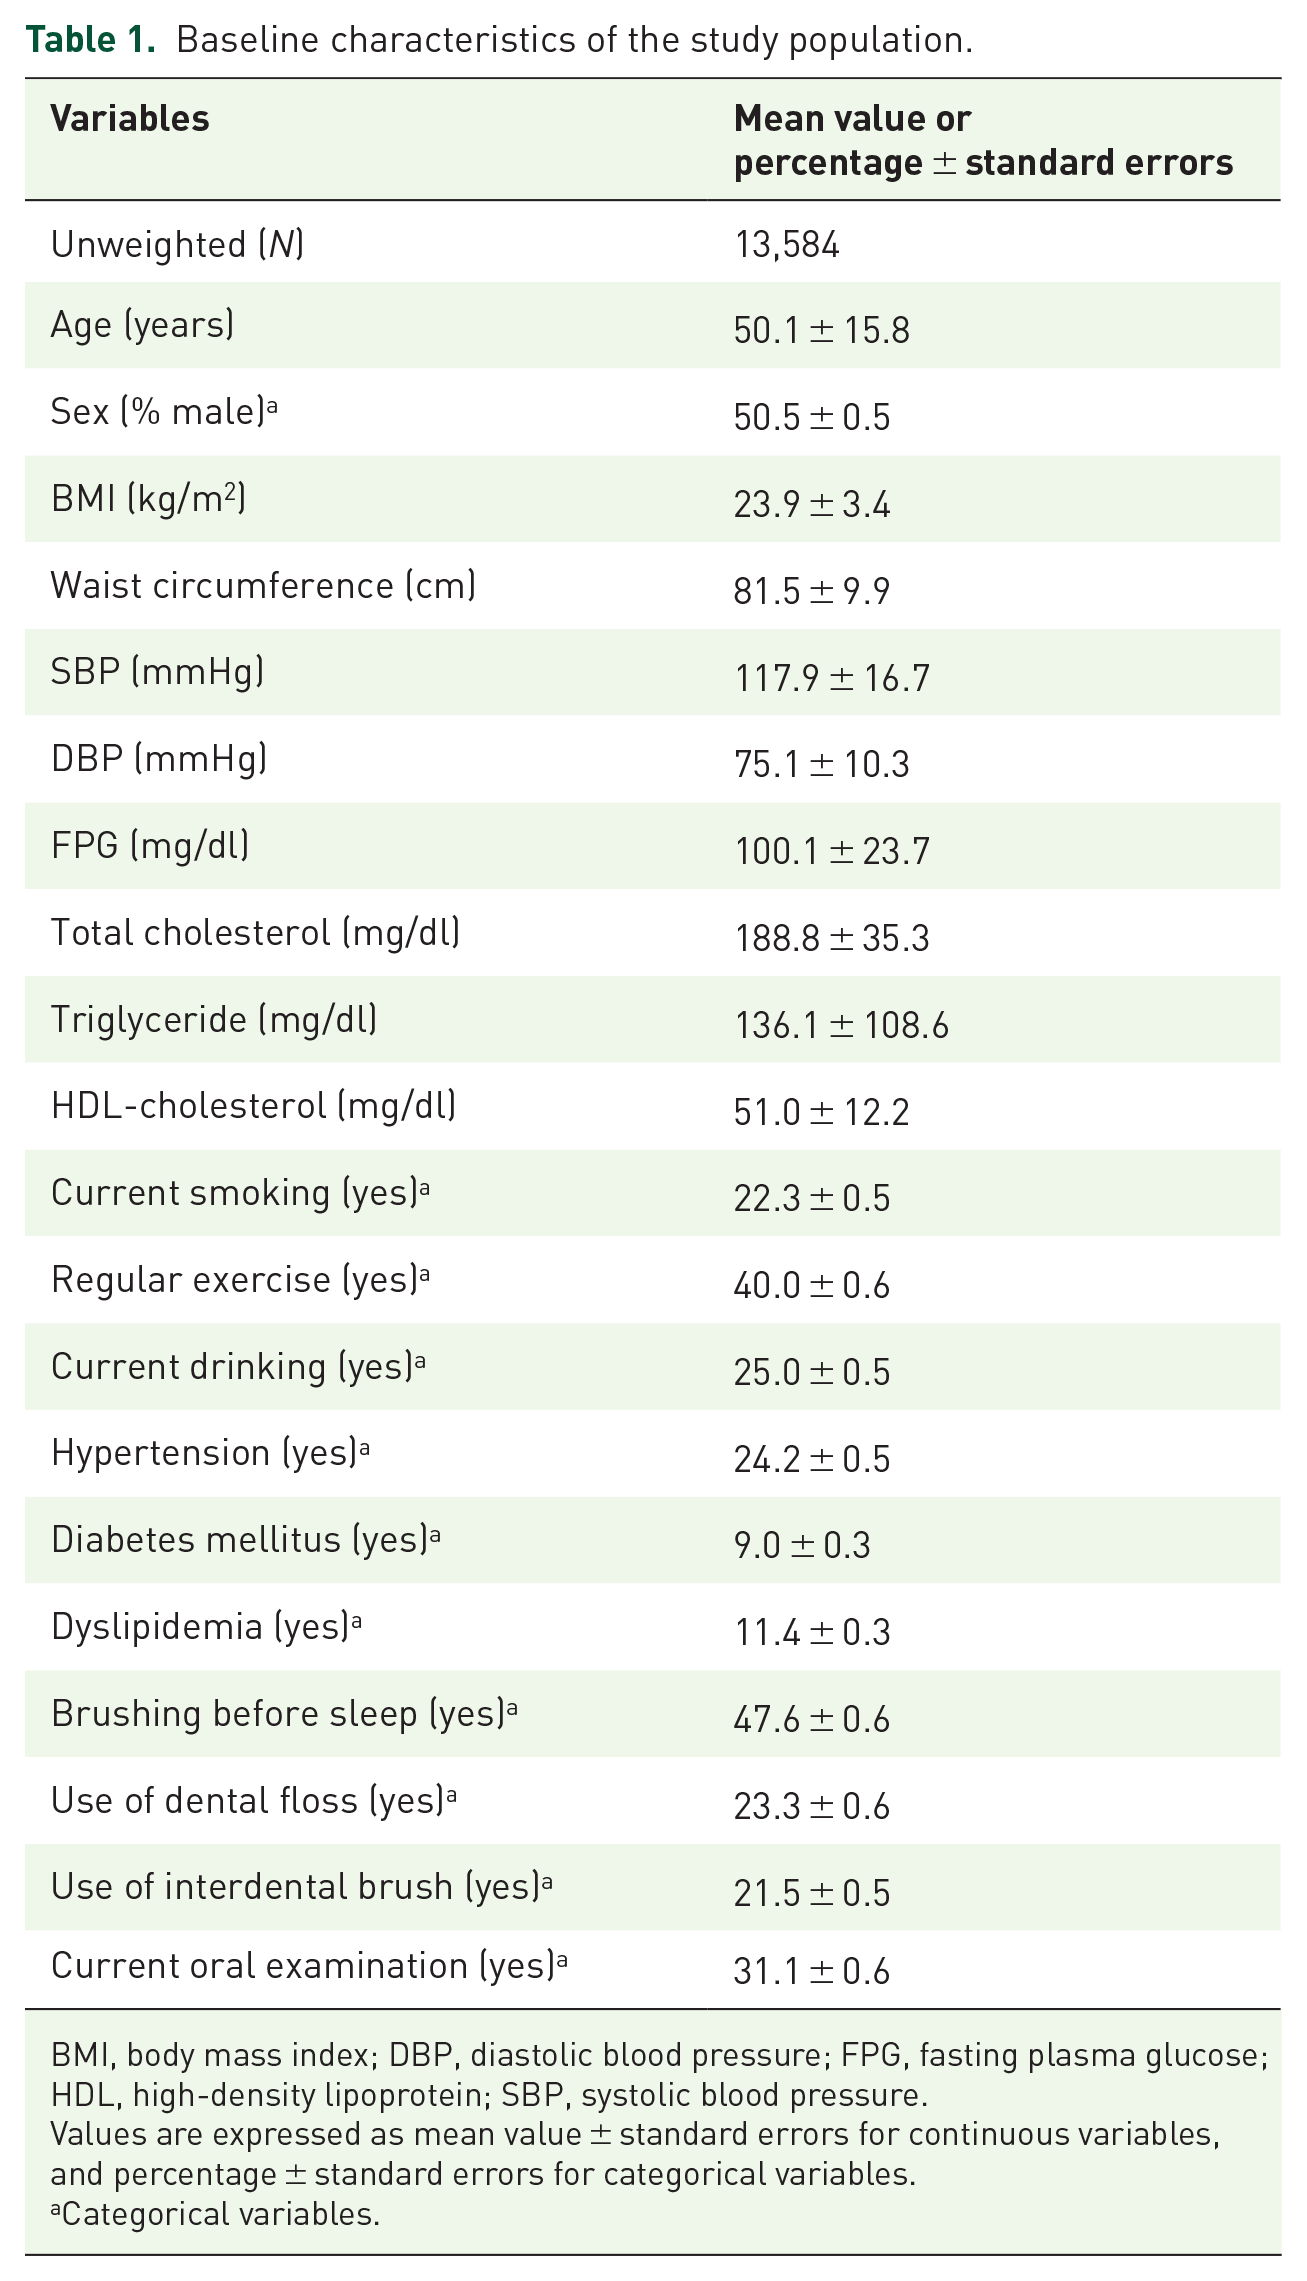
Baseline characteristics of the study population are shown in Table 1. The mean age (±SEs) of the population was 50.1 (±15.8) years, and the mean values (±SEs) of BMI, WC, SBP, and DBP were 23.9 (±3.4 kg/m2), 81.5 (±9.9 cm), 117.9 (±16.7 mmHg), and 75.1 (±10.3 mmHg), respectively. The mean serum levels (±SEs) of FPG, total cholesterol, TG, and HDL-C were 100.1 (±23.7), 188.8 (±35.3), 136.1 (±108.6), and 51.0 (±12.2) mg/dl. The proportion (±SEs) of male participants was on average 50.5% (±0.5%), and the proportions (±SEs) of current smokers, regular exercisers, and regular drinkers were 22.3% (±0.5%), 40.0% (±0.6%), and 25.0% (±0.5%), respectively. The proportion (±SEs) of the subjects who had hypertension, diabetes, and dyslipidemia was 24.2% (±0.5%), 9.0% (±0.3%), and 11.4% (±0.3%), respectively, and those who brushed their teeth before sleep, used dental floss, utilized an interdental brush, and underwent oral examination currently comprised 47.6% (±0.6%), 23.3% (±0.6%), 21.5% (±0.5%), and 31.1% (±0.6%) of the study population.
Baseline characteristics of the study population.
BMI, body mass index; DBP, diastolic blood pressure; FPG, fasting plasma glucose; HDL, high-density lipoprotein; SBP, systolic blood pressure.
Values are expressed as mean value ± standard errors for continuous variables, and percentage ± standard errors for categorical variables.
Categorical variables.
Table 2 shows baseline characteristics of the subjects according to the prevalence of periodontitis. There were 4344 participants with periodontitis (periodontitis group) and 9240 participants without periodontitis (nonperiodontitis group) in the study population. The periodontitis group had higher mean values of age, BMI, WC, SBP, DBP, FPG, total cholesterol, and TG, and lower HDL-C levels than those of the nonperiodontitis group. The proportion of men, current smokers, and regular drinkers was significantly higher in the periodontitis group than in the nonperiodontitis group. The proportions of brushing before sleep, use of dental floss, and interdental brush were significantly lower in the periodontitis group than in the nonperiodontitis group. There was no significant difference in the proportion of current oral examination between the two groups. The prevalence of hypertension, diabetes, and dyslipidemia was higher for participants with periodontitis than in those without periodontitis.
Baseline characteristics of the study population according to the prevalence of periodontitis.

BMI, body mass index; CPI, community periodontal index; DBP, diastolic blood pressure; FPG, fasting plasma glucose; HDL, high-density lipoprotein; SBP, systolic blood pressure.
Values are expressed as mean value ± standard error for continuous variables, and numbers (percentage) for categorical variables.
Categorical variables.
Table 3 shows the ORs for periodontitis according to TyG index, TG/HDL-C ratio, and METS-IR index quartiles. Multiple logistic regression analyses were performed to investigate the association between each index and periodontitis severity. Compared with Q1 of the TyG index, the ORs (95% CIs) for periodontitis in Q4 were 2.89 (2.50–3.33) in model 1, 1.46 (1.24–1.72) in model 2, 1.26 (1.04–1.53) in model 3, and 1.23 (1.01–1.49) in model 4. Compared with Q1, the ORs (95% CIs) for periodontitis using the TG/HDL-C ratio for Q4 were 2.59 (2.25–2.98) in model 1, 1.37 (1.16–1.61) in model 2, 1.26 (1.05–1.52) in model 3, and 1.23 (1.02–1.48) in model 4. Compared with Q1, ORs (95% CIs) for periodontitis using the METS-IR index for Q4 were 3.24 (2.81–3.74) in model 1, 1.70 (1.43–2.02) in model 2, 1.54 (1.25–1.88) in model 3, and 1.53 (1.25–1.88) in model 4.
ORs and 95% CIs for higher incidence of periodontitis (CPI ⩾ 3) according to the TyG index, TG/HDL-C ratio, and METS-IR index quartiles.

BMI, body mass index; CI, confidence interval; CPI, community periodontal index; METS-IR, metabolic score for insulin resistance; OR, odds ratio; ref., reference; TG/HDL-C, triglyceride to high-density lipoprotein cholesterol; TyG, triglyceride glucose.
Model 1: unadjusted; model 2: adjusted for age, sex, and BMI; model 3: adjusted for age, sex, BMI, current smoking, current drinking, diabetes mellitus, dyslipidemia, and brushing before sleep; model 4: adjusted for age, sex, BMI, current smoking, current drinking, regular exercise, hypertension, diabetes mellitus, dyslipidemia, brushing before sleep, and use of floss.
The prevalence of periodontitis increased with increasing TyG index, TG/HDL ratio, and METS-IR index quartiles (Figure 2(a)–(c)). The prevalence of periodontitis according to the TyG index quartiles was 18.8%, 25.6%, 32.8%, and 40.1%, respectively (p value < 0.001). The prevalence of periodontitis according to the TG/HDL ratio index quartiles was 19.7%, 25.3%, 33.1%, and 38.9%, respectively (p value < 0.001). The prevalence of periodontitis according to METS-IR index quartiles was 17.7%, 25.6%, 32.8%, and 41.0%, respectively (p value < 0.001). We also found a linear relationship between the incidence of periodontitis and continuous values of the TyG index, TG/HDL ratio, and METS-IR (Figure 2(d)–(f)).

The relationship between periodontitis and IR indexes in the Korean population. (a) The proportion of participants with periodontitis according to TyG index quartiles. (b) The proportion of participants with periodontitis according to TG/HDL-C ratio quartiles. (c) The proportion of participants with periodontitis according to METS-IR index quartiles. (d) The regression spline curve of odd ratios of periodontitis according to TyG index. (e) The spline curve of odd ratios of periodontitis according to TG/HDL-C ratio index. (f) The spline curve of odd ratios of periodontitis according to METS-IR index.
The ROC curves of the TyG index, TG/HDL-C ratio, and METS-IR index and the estimates of AUC for each index are presented in Figure 3.

Comparison of the predictive power for TyG index, TG/HDL ratio, and METS-IR.
The AUC (95% CI) was 0.608 (0.598–0.618) for the TyG index, 0.600 (0.590–0.610) for the TG/HDL ratio, and 0.617 (0.608–0.627) for METS-IR. The AUC for METS-IR was significantly higher than that for the TyG index (post hoc p value = 0.016) and TG/HDL ratio (post hoc p value < 0.001), although the absolute values of AUC for the three indexes were not higher than 0.7.
The effects of the interactions between TyG and sex (p < 0.001), TG/HDL and sex (p < 0.001), and METS-IR and sex (p < 0.001) on periodontitis were statistically significant. Table 4 shows the ORs and 95% CIs for periodontitis (CPI ⩾ 3) according to the TyG index, TG/HDL-C ratio, and METS-IR index quartiles in men and women. In men, the TyG index, TG/HDL-C ratio, and METS-IR index for Q4 had higher ORs for the prevalence of periodontitis than those for Q1 [Q4 versus Q1, OR and 95% CI = 2.60 (2.09–3.24) in TyG, 2.03 (1.32–2.54) in TG/HDL-C, and 2.57 (2.03–3.25) in METS-IR]. The significance of these associations remained after adjusting for age, BMI, current smoking, regular drinking, regular exercise, hypertension, DM, dyslipidemia, brushing before sleep, and use of floss.
ORs and 95% CIs for periodontitis (CPI ⩾ 3) according to the TyG index, TG/HDL-C ratio, and METS-IR index quartiles in men and women.

BMI, body mass index; CI, confidence interval; CPI, community periodontal index; METS-IR, metabolic score for insulin resistance; OR, odds ratio; ref., reference; TG/HDL-C, triglyceride to high-density lipoprotein cholesterol; TyG, triglyceride glucose.
For women, the TyG index, TG/HDL-C ratio, and METS-IR index for Q4 had higher ORs with 95% CIs for prevalence of periodontitis than those for Q1 [Q4 versus Q1, OR and 95% CI = 2.67 (2.23–3.20) in TyG; 2.41 (2.10–2.88) in TG/HDL-C; 3.14 (2.61–3.77) in METS-IR]. After adjusting for the same confounders, only METS-IR was significantly associated with periodontitis [Q4 versus Q1, OR and 95% CI = 1.32 (1.01–1.72)].
Discussion
We found a significant association between the prevalence of periodontitis and non-insulin-based IR indices, including the TyG index, TG/HDL-C ratio, and METS-IR index in Korean adults using multiple logistic regression analysis. The results showed that the highest quartiles of the TyG index and TG/HDL-C ratio were associated with an increased prevalence of periodontitis by 23% after adjusting for age, sex, BMI, health-related behaviors (current smoking, regular drinking, regular exercise), underlying diseases (HTN, DM, and dyslipidemia), and oral and health behaviors (brushing before sleep and use of floss), compared with those of the lowest quartiles. Furthermore, after adjusting for the same confounders, the highest METS-IR index quartile had a 53% higher risk of periodontitis than that of the lowest quartile. By assessing the AUC values, we also found that the METS-IR index is a more powerful predictive marker of periodontitis than the TyG index and TG/HDL-C ratio. In the sex-specific analysis, the highest quartiles of the TyG index, METS-IR, and TG/HDL-C ratio were associated with an increased prevalence of periodontitis compared with those of the lowest quartile in men, while only METS-IR was significantly associated with periodontitis in women.
Recently, several studies have assessed the relationship between IR and periodontitis prevalence. Lim et al. 42 found that the prevalence of periodontitis had a significantly positive association with higher HOMA-IR, which is a measurement tool for IR in Korean post-menopausal women. Another study suggested that periodontitis is a risk factor for impaired fasting glucose and is associated with decreased β-cell function. 43 A single-center cross-sectional study showed that periodontitis was significantly associated with increased fasting insulin levels and decreased quantitative insulin sensitivity check index (QUICKI) reflecting tissue insulin sensitivity. 44 Although fasting insulin–based indices such as HOMA-IR, HOMA-β, or QUICKI have traditionally been used as basic measurement tools for IR, 45 these indices have been limited due to their variability and low practicality because there were many difficulties in measuring fasting insulin levels in primary care clinics. 25 In this regard, potential alternative non-insulin-based IR indices – including the TyG index, TG/HDL-C ratio, and the METS-IR index – were developed and validated. The TyG index has been proposed as a credible surrogate marker for IR and metabolic syndrome. 46 The TG/HDL ratio has been advocated as a simple clinical indicator of IR and has been evaluated as a predictor of diabetes and CHD.47,48 METS-IR, a novel non-insulin-based fasting score to evaluate insulin sensitivity, was developed by Bello-Chavolla et al. 25 A 6-year prospective cohort study suggested that the METS-IR index is significantly related to type 2 DM in the Chinese population. 49 Mehta et al. 50 found a significant association between the METS-IR index and central aortic arterial stiffness, reflecting the cardiometabolic risk in Mexican participants. Several underlying mechanisms to explain the correlation between non-insulin-based IR indices and IR have been suggested. Excessive TG accumulation in muscular and hepatic tissues may restrict glucose metabolism in the target organ, and higher serum TG levels can release free fatty acids (FFAs) from adipose tissues, which induces IR in nonadipose tissues.46,51 Therefore, TG can be used as a marker for IR with glucose metabolism in terms of the TyG index. In addition, high levels of circulating TG induce heparin to initiate the activation of lipoprotein lipase and release FFAs, which causes IR through oxidative stress. 52 Increased levels of lipoproteins and circulating FFAs deliver excessive FFAs to β-cells and promote the production of ceramide and nitric oxide (NO) leading to β-cell apoptosis. 53 Based on this, previous studies have suggested that the TG/HDL-C ratio can be used as an indicator for IR and lipotoxicity with regard to apoptosis and impaired function of β-cells. 53 The METS-IR index is related to ectopic fat accumulation, including intrahepatic fat content. 25 Intrahepatic fat accumulation may interfere with lipid and glucose metabolism and may be considered as one of the main causes for hepatic IR. 54 Shulman 55 and Roden et al. 56 suggested that ectopic fat components in the muscular and hepatic tissues lead to the development of IR. These mechanisms demonstrate the significant association between the METS-IR index and IR.
Several previous studies have found an association between non-insulin-based IR indices and periodontitis. A recent study of 4813 participants in the National Health and Nutrition Examination Survey found that elevated TyG levels were associated with an increased risk of periodontitis in the US population. 27 Kwon et al. 28 found that a higher TG/HDL-C ratio is associated with an increased prevalence of periodontitis in the Korean population using the same data set.
Our findings are consistent with those of previous studies. We also found that the highest TyG index, TG/HDL-C ratio, and METS-IR index values were significantly associated with a higher prevalence of periodontitis in the Korean population. Several mechanisms may explain the significant association between IR and periodontitis. Periodontitis and IR have a bidirectional relationship. 57 Infection of the periodontal tissues causes inflammatory reactions such as periodontitis, leading to mechanistic pathways related to systemic diseases or conditions. 58 Patients with periodontitis have increased bacteria in their blood as several species of bacteria – including Aggregatibacter actinomycetemcomitans, Porphyromonas gingivalis, Fusobacterium nucleatum, and several other periodontal bacteria – can reach blood vessels through epithelial ulceration of the inflamed deep periodontal pockets. 59 Microbial dysbiosis of periodontal pockets and elevated serum bacteria level induce the production of inflammatory markers such as interleukin-1 (IL-1) and tumor necrosis factor alpha (TNF-α), 14 and these markers cause an inflammatory cascade with secondary mediators such as cyclooxygenases, prostaglandins, and chemotactic cytokines. 16 Increased levels of various inflammatory markers and mediators induce and maintain the chronic inflammatory status related to adiposity, 60 which activates both IκB kinase-β (IKKβ)/nuclear factor-κB (NF-κB) and c-Jun N-terminal kinase (JNK) pathways.61,62 Many studies suggested that both IKKβ/NF-κB and JNK pathways play a key role in the induction of inflammation-induced IR.15,63,64 Moreover, previous studies suggested that hyperglycemic conditions in patients with diabetes can activate the increased inflammatory markers and cause oxidative stress.65,66 The secretion of TNF-α and IL-1 from monocytes is significantly increased in patients with diabetes than in patients without diabetes.67,68 Walrand et al. 69 found the potential effects of insulin on the actions of polymorphonuclear leukocytes (PMNLs) such as phagocytosis, apoptosis, and chemotaxis. Calvet et al. 70 suggested that IR may impair the functions of PMNLs directly. The malfunction of PMNLs contributes to the retention of PMNLs in the periodontium, which destroys the periodontal tissues with increased oxidative stress and inflammatory markers such as proinflammatory cytokines and matrix metalloproteinases (MMPs). 71 Moreover, the inflammatory responses accelerate the production of TNF-α and lead to more damage in periodontal tissues induced by pathogens including P. gingivalis in patients with diabetes. 72
Furthermore, we found that METS-IR had a superior predictive power for periodontitis compared with that of the TyG index and TG/HDL ratio. Although the precise mechanisms underlying the superiority of METS-IR over the TyG index and TG/HDL ratio in predicting periodontitis are not understood, several explanations have been suggested. Thus, METS-IR may be regarded as a more favorable predictor of periodontitis than the TyG index and TG/HDL ratio because the combination of TGs, BMI, FPG, and HDL-C may lead to a better explanation of adiposity and cardiometabolic risk factors.25,49,50 In a longitudinal study, Gorman et al. 73 found that general obesity and central obesity are associated with an increased risk of periodontal disease progression in men. In the sex-specific analysis, TyG index, TG/HDL-C ratio, and METS-IR compared with those of lowest quartiles were associated with an increased prevalence of periodontitis in men. In women, TyG index and TG/HDL-C ratio were not associated with higher prevalence of periodontitis, while only METS-IR was significantly associated with periodontitis. Further studies are needed to clarify the reason for sex difference in the association between IR markers and periodontitis.
This study had several limitations. First, CPI protocols may not fully reflect periodontitis prevalence. Chu and Ouyang 74 pointed out that CPI protocols may induce overestimation and poor accuracy in detecting periodontitis, considering the high susceptibility of incisors and molars. CPI, however, is a global tool for detecting periodontal disease in large populations. Second, this study could not reveal a causal relationship between the TyG index and periodontitis due to its cross-sectional design. Nevertheless, this study has several strengths. First, to the best of our knowledge, this is the first study to investigate the association between periodontitis risk and comprehensive non-insulin-based IR indices in the Korean population. Second, we investigated and compared the predictive power of the TyG index, TG/HDL-C ratio, and METS-IR index for periodontitis. Finally, we applied sampling weights to all analyses to represent the general Korean adult population, allowing our results to be generalizable to the Korean adult population as a whole.
Conclusion
We found that the participants in the highest quartiles for the TyG index, TG/HDL-C ratio, and METS-IR index had a significantly higher prevalence of periodontitis than the participants in the lowest quartiles. Our results also indicate that the METS-IR index has superior predictive power to assess the risk of periodontitis compared with that of the TyG index and TG/HDL-C ratio in the Korean population. Further longitudinal studies, however, are needed to clarify the shared pathophysiology between IR and periodontitis.