
Abstract
Objectives:
Multiparametric magnetic resonance imaging (MRI) is established as a technical instrument for the characterisation of patients with amyotrophic lateral sclerosis (ALS). The contribution of relaxation-weighted sodium (23NaR) MRI remains to be defined. The aim of this study is to apply 23NaR MRI to investigate brain sodium homeostasis and map potential alterations in patients with ALS as compared with healthy controls.
Materials and Methods:
Seventeen patients with ALS (mean age 61.1 ± 11.4 years, m/f = 9/8) and 10 healthy control subjects (mean age 60.3 ± 15.3 years, m/f = 6/4) were examined by 23NaR MRI at 3 T. Regional sodium maps were obtained by the calculation of the weighted difference from two image data sets with different echo times (TE1 = 0.3 ms, TE2 = 25 ms). Voxel-based analysis of the relaxation-weighted maps, together with 23Na concentration maps for comparison, was performed.
Results:
ROI-based analyses of relaxation-weighted brain sodium concentration maps demonstrated increased sodium concentrations in the upper corticospinal tracts and in the frontal lobes in patients with ALS; no differences between ALS patients and controls were found in reference ROIs, where no involvement in ALS-associated neurodegeneration could be anticipated.
Conclusion:
23NaR MRI mapped regional alterations within disease-relevant areas in ALS which correspond to the stages of the central nervous system (CNS) pathology, providing evidence that the technique is a potential biological marker of the cerebral neurodegenerative process in ALS.
Keywords
Introduction
Amyotrophic lateral sclerosis (ALS) is the most frequent adult-onset motor neuron disease, characterized by progressive pareses.1,2 Despite the emphasis on the motor neurons, ALS has evolved to be regarded as a multisystem disorder, 3 given that it affects several brain regions in a distinctive propagation pattern. 4 In the clinical diagnostic processes, neuroimaging with magnetic resonance imaging (MRI) has an essential role in the exclusion of other etiologies of the clinical presentation. 5 In addition, MRI approaches with advanced postprocessing, focused on but not limited to diffusion-weighted imaging techniques, have been established as biological markers of the disease with reliable measures for monitoring disease progression and have greatly improved our understanding of its in vivo pathoanatomy.6,7 In the search for features of diagnostic classifiers, the integration of multiparametric MRI including diffusion tensor imaging (DTI), volumetric, and texture data may be the best approach to generate a neuroimaging-based diagnostic tool for ALS, 8 also for multicenter studies.9,10 In that context, the role of dedicated advanced MRI acquisition techniques has been more limited yet due to the specific and complex protocols which need a prospective study design, being 1H magnetic resonance spectroscopy a typical example. 11 However, the potential of these techniques needs to be further taken use of. A range of processes shared with ALS impact ionic homeostasis including neuroinflammation and neurodegeneration by way of mitochondrial and sodium potassium pump (Na+/K+-ATPase) dysfunctions across the cell membrane, leading to intracellular sodium (Na+) and subsequent calcium overload in patients. 12 These pathological processes could lead to homeostatic dysfunctions in motor regions and subsequent abnormal elevated sodium concentration in patients with ALS, while sodium dysbalance, in turn, could thus indicate early cellular dysfunction before degeneration of the cell. 13 As a promising advanced MRI approach, total tissue sodium concentration (which is associated with the viability of cells) can be assessed by 23Na MRI.14,15 The technique has been applied to study brain tissue, given that the Na + ion plays a crucial role in cell physiology as many conditions lead to changes in the average concentration of this element in cerebral tissue. 16 Grapperon and colleagues used 23Na MRI to show that in patients with ALS, higher sodium concentration could be found in motor regions [bilateral precentral gyri, corticospinal tracts (CSTs), and corpus callosum]. 12
The 23Na concentration data are a volume-weighted average of 23Na assigned to the intra- and extracellular space, respectively. Thus, interstitial fluid, plasma, and cerebrospinal fluid (CSF) are attributed to the extracellular space; however, intracellular 23Na might be more indicative of pathological processes. In contrast to the 23Na concentration mapping, relaxation-based methods are a possibility to suppress 23Na with a longitudinal relaxation time such as in CSF, 16 that way obtaining data with an increased weighting of intracellular space. Based on the differential sodium ion concentration between the intracellular and extracellular space, changes of the sodium ion concentration gradient point to pathological conditions, as investigated in neurodegenerative diseases like Huntington’s disease. 17 Relaxation-weighted sodium MRI (23NaR) enables a further differentiation of the total sodium signal by suppressing sodium signal that originates from long T2* compartments such as in fluids. 16 The aim of this study was to analyse the ALS-associated brain sodium homeostasis by applying 23NaR MRI 16 to a group of participants with ALS in comparison to controls.
Methods
Subjects and patients
All participating patients and controls provided written informed consent for the study according to institutional guidelines. The study was approved by the Ethical Committee of the University of Ulm (reference #143/16).
The analysis included cross-sectional data from ALS patients (N = 17) and controls (N = 10; Table 1). All ALS patients underwent standardized clinical-neurological and routine laboratory examinations. The ALS patients (mean age 61.1 ± 11.4 years, m/f = 9/8) presented with a sporadic form of clinically definite or probable ALS according to the revised El Escorial diagnostic criteria. 18 Severity of physical symptoms, as measured with the revised ALS functional rating scale (ALS-FRS-R), 19 was 40 ± 7 (range 24–46). Disease duration was 17 ± 13 months. None of the ALS patients had a history of any other neurological or psychiatric disorders or other medical conditions. None of the patients had any contraindications against MRI scanning. A normal database of age-matched healthy controls (mean age 60.3 ± 15.3 years, m/f = 6/4, p = 0.9 compared to ALS) was used for comparison. None had a history of neurological or psychiatric disease. The total acquisition period of this study was 1 year (11/2018 to 11/2019).
Subjects’ characteristics.

ALS, amyotrophic lateral sclerosis; ALS-FRS-R, ALS functional rating scale.
MRI acquisition
MRI scanning was performed on a 3.0 T Skyra (Siemens Medical, Erlangen, Germany) using a double-resonant (1H/23Na) quadrature birdcage coil (Rapid Biomedical GmbH, Rimpar, Germany). A double-echo, density-adapted 3D radial acquisition technique 20 was applied with the following parameters: TE1 = 0.3 ms, TE2 = 25.0 ms, repetition time TR = 100 ms, readout duration TRO = 20 ms, nominal spatial resolution 4 × 4×4 mm3, flip angle: 90°, acquisition time: 13 min 20 s.
MRI data analysis
The pre- and postprocessing was performed by use of the analysis software Tensor Imaging and Fibre Tracking (TIFT). 21
Stereotaxic normalization
Stereotaxic normalization was done by a rigid-brain-transformation to AC–PC-line, followed by a non-affine normalization according to landmarks. Intensity was normalized according to regression of sodium signal intensities derived from six chambers filled with 2% agarose gels with different NaCl-concentrations (25, 50, 75, 100, 125, and 150 mmol/L); 22 data processing is visualized in Figure 1.
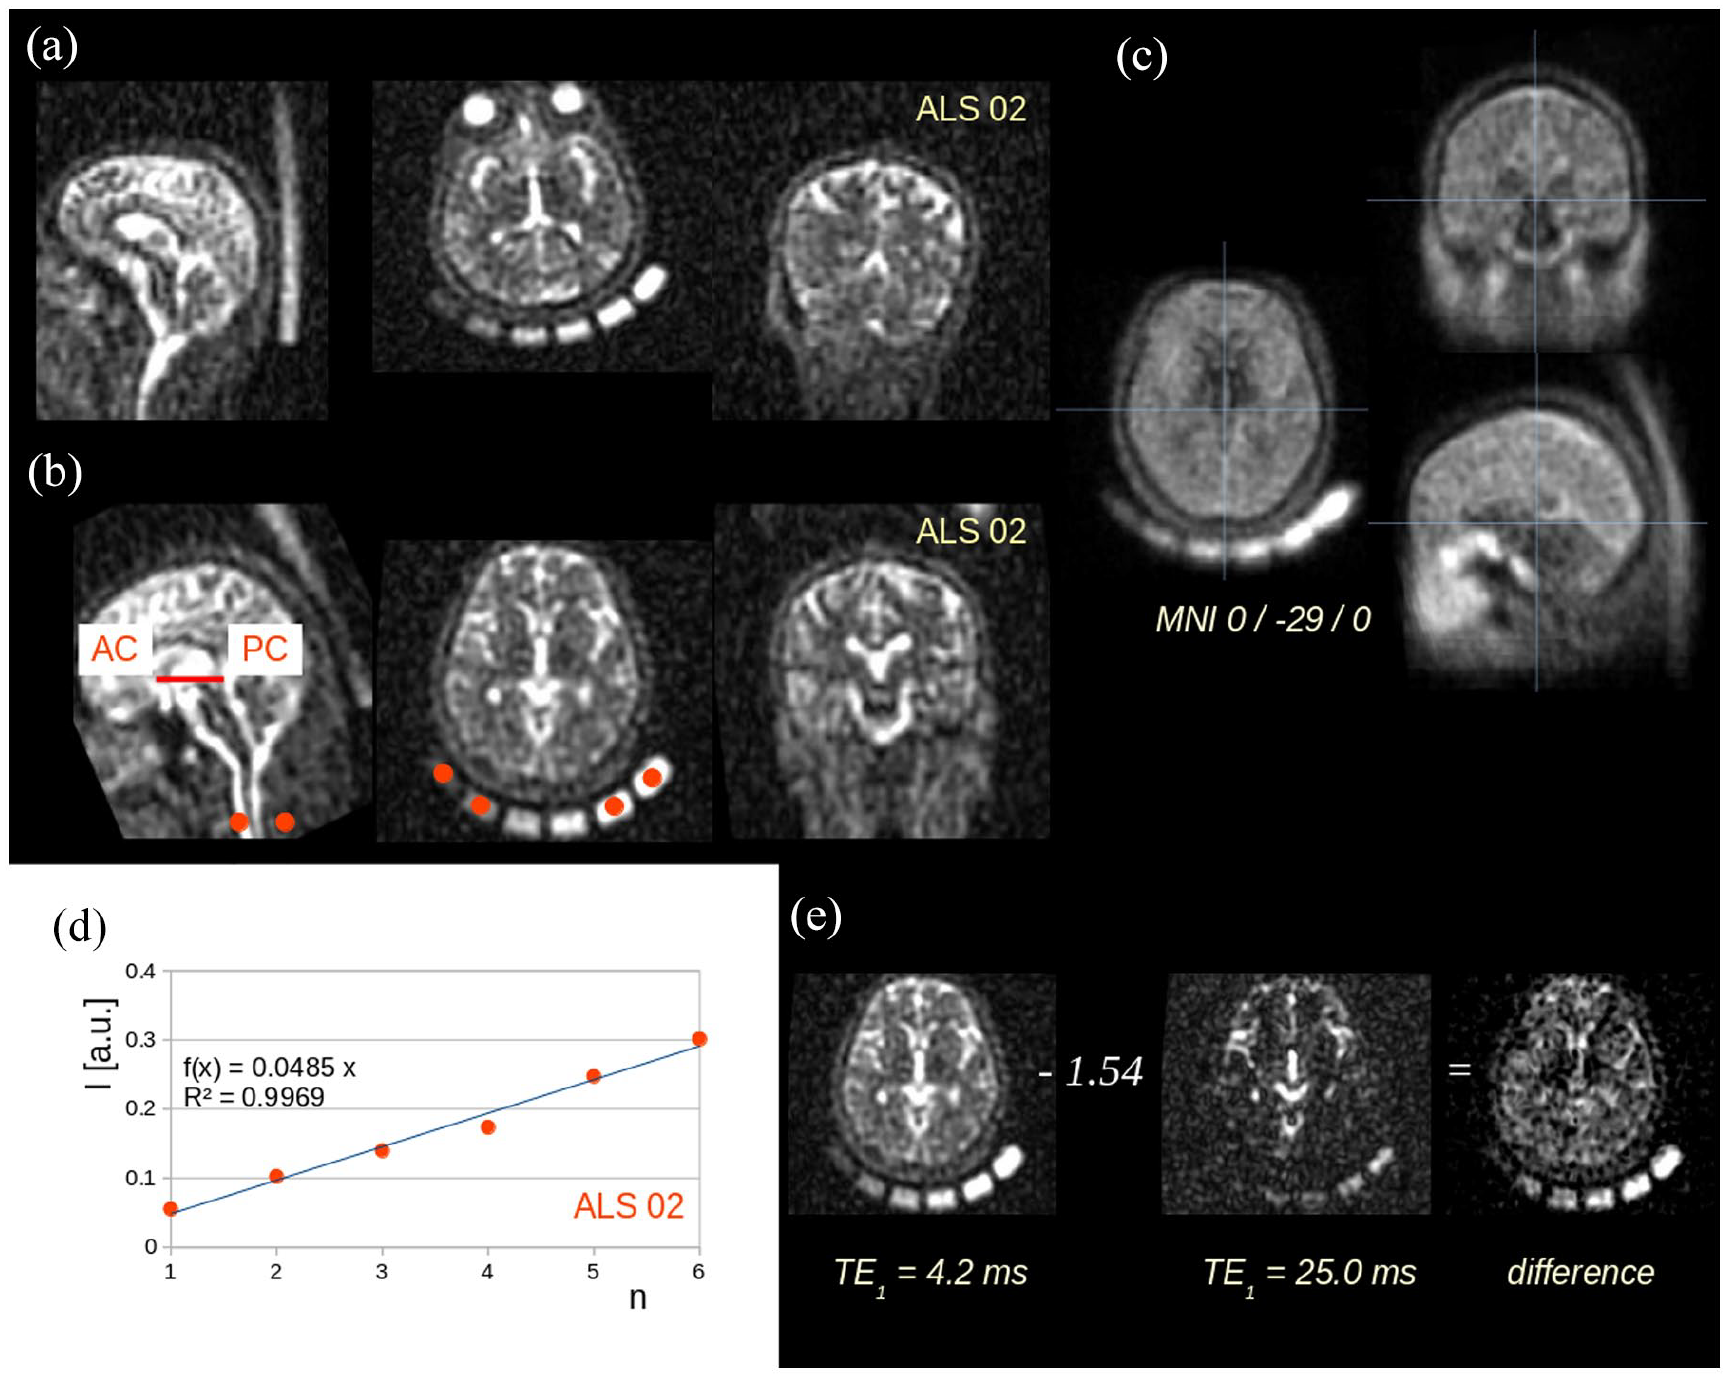
Data processing: example. (a) Originally recorded 23Na scan at TE1 (ALS patient 02) with six 23Na probes with slices in axial, coronar, and sagittal orientation. (b) The same data set after stereotaxic normalization to anterior commissure (AC) – posterior commissure (PC) orientation, note red ROIs located in the six 23Na probes. (c) Example for the quality of the normalization procedure: the template averaged from 27 subjects′ 23NaR scans at TE1. (d) Example for intensity normalization (ALS patient 02) according to regression analysis driven by ROI analysis of the six 23Na probes. (e) Relaxation weighting: images with echo times TE1 and TE2 were subtracted using a weighted difference of 1.54.
Relaxation weighting
According to a previously published protocol, 16 images with echo times TE1 and TE2 were subtracted using a weighted difference. The weighting factor exp[(TE2–TE1)/T2*CSF] was chosen such that sodium ions exhibiting relaxation properties like in CSF were fully suppressed. For each voxel, the difference intensity ID (representing the sodium concentration) was calculated according to

with TE1 = 0.3 ms and TE2 = 25.0 ms, and T2*CSF = 56 ms, the weighting factor calculates as 1.554 (Figure 1).
The resulting difference maps were then smoothed with a Gaussian filter of FWHM 4 mm to obtain a good balance between sensitivity and specificity.
ROI analyses
Based on the staging concept, ROI analysis was performed by locating spherical ROIs at predefined positions in the stereotaxically normalized difference maps, i.e. upper CST, frontal lobes, and basal ganglia. The corresponding anatomical localizations were selected in a hypothesis-guided approach according to results of previous MRI studies9,23–25 where brain alterations have already been identified in accordance with the phosphorylated 43 kDa TAR DNA-binding protein (pTDP-43)-associated ALS propagation pattern.4,26 As a reference region, an ROI was placed in the callosal area V where no involvement in ALS-associated neurodegeneration could be anticipated. Methodologically, the size of the ROIs was varied between 7 and 15 mm in order to investigate the dependence of differences between ALS patients and controls on ROI size. ROI positions were also varied by 5 mm in each spatial direction, that way detecting the optimum position at maximum differences between ALS patients and controls.
For comparison, ROI analysis in the upper CST, basal ganglia, and, as a reference, callosal area V was performed in 23Na concentration maps (TE1 = 0.3 ms). For correlation analyses, Spearman correlation was calculated to assess potential associations of regional 23Na accumulation (23NaR MRI mapping as well as 23Na concentration mapping) with the clinical deficits (ALS-FRS-R) and disease duration, respectively.
Results
To analyse sodium concentration alterations that are localized in the CST, i.e. related to ALS stage 1, 4 ROI locations in the upper CST were chosen. As additional ROI locations, we selected the frontal lobes and the basal ganglia, related to ALS stages 2 and 3, respectively; 4 furthermore, an ROI was placed in the callosal area V as a reference region for comparison where no ALS-associated affectation could be anticipated. In order to validate the choice of the ROIs, the variation both of the size of the ROIs and of the ROI localizations are summarized in Supplementary Figure 1.
A significant increase of sodium concentration in ALS patients at the group level was observed in the upper CST (p < 0.0005) and in the frontal lobes (p < 0.01) when compared to controls, as demonstrated in Figure 2. A trend for sodium concentration increase was observed in the basal ganglia (p = 0.2). No significant differences were observed in the callosal area V (reference region, p = 0.9). For comparison, the ROI analysis in 23Na concentration maps (TE1 = 0.3 ms) revealed significantly increased 23Na accumulation in the upper CST (ALS patients: 44 mmol/L; controls: 41 mmol/L; p < 0.05) and in the frontal lobes (ALS patients: 43 mmol/L; controls: 39 mmol/L; p < 0.05); a trend of increased 23Na concentration was observed in the basal ganglia (ALS patients: 40 mmol/L, controls: 37 mmol/L; p = 0.5); no significant alterations were observed in the callosal area V (reference) (ALS patients: 43 mmol/L, controls: 44 mmol/L; p = 0.8; Supplementary Figure 2). Spearman correlation demonstrated no significant associations of the ROIs in the upper CST, frontal lobes, and basal ganglia with the ALS-FRS-R scores or with disease duration, respectively, neither for relaxation-weighted maps nor for concentration maps.

Results from ROI-based analysis of relaxation-weighted (relaxation-w.) difference. After filtering the normalized 23NaR difference maps with a Gaussian filter of FWHM 4 mm, spherical ROIs with a radius of 8 mm were placed in the upper corticospinal tract (CST) at MNI ± 22/-34/60 and in the frontal lobes at MNI ± 24/16/47, revealing significantly increased 23NaR in ALS patients at the group level. Analysis in basal ganglia (MNI ± 21/6/18) demonstrated a trend of increased 23NaR. The reference ROI in the callosal area V at MNI 0/-29/10 demonstrated no significant alterations. MNI – Montreal Neurological Institute coordinate frame.
Discussion
23NaR MRI as an advanced metabolic imaging technique of the brain was shown to be capable to provide deeper insights into the pathophysiological mechanisms of tissue degeneration in ALS by localizing changes of cerebral tissue sodium concentration in ALS. The regional patterns of sodium homeostasis which could be identified included first, motor areas (i.e. upper CST) as the most prominent finding and second, frontal areas. As such, this topography of abnormal sodium concentration mirrored elements of the neuropathologically defined cerebral pTDP-43 distribution patterns of ALS, spreading from the motor neocortex downwards and then to frontal and last, parietal and anteromedial temporal lobes.4,26 The involvement of primary motor cortices and CSTs in fact correspond to the core elements of the ALS pathoanatomy in the central nervous system, as has already been demonstrated in vivo by other MRI approaches like DTI. 27 23 NaR MRI as an advanced metabolic imaging technique has shown to be an improvement compared to 23Na concentration mapping; despite limited subject numbers, these results of the ROI analysis in 23Na concentration maps (TE1 = 0.3 ms) and of the ROI analysis in 23NaR maps are in accordance with previous results in sodium MRI. 12 Spearman correlation demonstrated no association of the ROIs in any of the investigated structures with ALS-FRS-R or with disease duration; here, the assumption is that a data sample of 17 patients might too low to perform this association analysis. The acquisition time of 23NaR MRI of less than 15 minutes can be regarded as an acceptable burden even for ALS patients in an advanced stage of disease. The regions which showed a common pattern of abnormally elevated sodium concentration correspond to the stages 1 and 2 of the central nervous system (CNS) pathology in ALS; the fact that the upper CST constituted the key area of the highest significant alterations is in line with other current studies in which the upper CST was identified as the region of the highest normalized importance across the most relevant imaging variables in computational models for the analysis of MRI data in ALS. 28 As such, findings in the current data may reflect the common pattern of CNS affectation found across the investigated ALS patients despite their heterogeneity of disease burden.
Thus, these findings support the hypothesis that elevated brain tissue sodium concentration as a measure of loss of cell integrity could be a potential marker of neurodegeneration processes; several pathophysiological processes involved in ALS, including mitochondrial dysfunction (as reported in ALS), 29 ionic disturbances, neuronal hyperexcitability, and neuroinflammation, could contribute to the altered sodium concentration observed in our and previous studies. 12 As such, the intraneuronal sodium overload may reflect both energy failure and axonal hyperexcitability as features of ALS.12,30
The application of relaxation-weighted 23Na MRI 16 offers the possibility to assess the fluid-suppressed sodium signal and to achieve a weighting towards the intracellular space. However, data quality control and analysis have to be thoroughly performed, given that the weighted subtraction image is more prone to susceptibility artefacts. The finding of regional sodium signal increase in 23NaR MRI (in contrast to signal reduction in 23NaR MRI, as it would be expected in association with local atrophy) might be due to the structure alterations and dysfunction of mitochondria which is regarded as a player in the pathogenesis of ALS, partially overlapping with other neurodegenerative diseases. 31 Although, the ROI-based analysis was able to identify sodium increase in specific regions, the signal-to-noise ratio of the data sample of this study did not allow to detect sodium alteration along specific ALS-related tracts. 27
This study had some limitations. First, the number of participants was limited and due to the novelty of the application of the 23NaR MRI technique to ALS, no estimation of the significance of the results could be performed and thus, no effect size/power calculation for study planning was possible. An increased sample size covering a larger spectrum of disease burden and also a longitudinal design could provide more insights in order to guide in the assessment of sources of heterogeneity at the individual patient level and in monitoring disease progression in the future. Second, different contributions to sodium signal such as intra- and extracellular sodium could not be distinguished, since a clear separation between intra- and extracellular sodium would require the use of paramagnetic shift reagents that cannot be applied in humans, 32 although relaxation-weighted imaging might result in a weighting towards the intracellular sodium.16,33 Thus, our results are in accordance with an intraneuronal sodium increase. Third, although cognitive impairment is a well-established feature in ALS patients, a neuropsychological assessment was not part of the protocol in this methodological (proof-of-principle) study; we recommend the inclusion of dedicated neuropsychological data in future studies in 23Na-MRI in ALS. In the future, also other non-invasive techniques such as triple-quantum–filtered 14 or multiecho sodium MRI 34 or multipulse multicompartment quantification 35 might be exploited to further characterize the observed sodium concentration increase.
Conclusion
In summary, this study provides evidence that 23NaR MRI depicts abnormal sodium concentration specifically in brain regions known to be particularly vulnerable in ALS and which correspond to the stages 1 and 2 of the pTDP-43 pathology of ALS. This mapping of tissue sodium concentration alterations could be a promising imaging biomarker to non-invasively analyse the regional cellular and metabolic integrity associated with neurodegeneration and might guide in monitoring the effects of therapeutic options which address e.g. mitochondrial dysfunction.
Supplemental Material
sj-docx-1-taj-10.1177_20406223221109480 – Supplemental material for Relaxation-weighted 23Na magnetic resonance imaging maps regional patterns of abnormal sodium concentrations in amyotrophic lateral sclerosis
Supplemental material, sj-docx-1-taj-10.1177_20406223221109480 for Relaxation-weighted 23Na magnetic resonance imaging maps regional patterns of abnormal sodium concentrations in amyotrophic lateral sclerosis by Hans-Peter Müller, Armin M. Nagel, Franziska Keidel, Arthur Wunderlich, Annemarie Hübers, Lena V. Gast, Albert C. Ludolph, Meinrad Beer and Jan Kassubek in Therapeutic Advances in Chronic Disease
Supplemental Material
sj-docx-2-taj-10.1177_20406223221109480 – Supplemental material for Relaxation-weighted 23Na magnetic resonance imaging maps regional patterns of abnormal sodium concentrations in amyotrophic lateral sclerosis
Supplemental material, sj-docx-2-taj-10.1177_20406223221109480 for Relaxation-weighted 23Na magnetic resonance imaging maps regional patterns of abnormal sodium concentrations in amyotrophic lateral sclerosis by Hans-Peter Müller, Armin M. Nagel, Franziska Keidel, Arthur Wunderlich, Annemarie Hübers, Lena V. Gast, Albert C. Ludolph, Meinrad Beer and Jan Kassubek in Therapeutic Advances in Chronic Disease
Footnotes
Acknowledgements
The authors would like to thank the Ulm University Center for Translational Imaging MoMAN for its support.
Ethics approval and consent to participate
All participating patients and controls provided written informed consent for the study according to institutional guidelines. The study was approved by the Ethical Committee of the University of Ulm (reference #143/16).
Consent for publication
All authors have agreed on publication.
Author contributions
Funding
The authors received no financial support for the research, authorship, and/or publication of this article.
Conflict of interest statement
The authors declared the following potential conflicts of interest with respect to the research, authorship, and/or publication of this article: The authors declare that the research was conducted in the absence of any commercial or financial relationships that could be construed as a potential conflict of interest. An associate editor of Therapeutic Advances in Chronic Disease is an author of this paper; therefore, the peer-review process was managed by alternative members of the Board, and the Editor had no involvement in the decision-making process.
Availability of data and materials
Data are available upon reasonable request. Reasonable data sharing requests are made in writing through Jan Kassubek (
Supplemental material
Supplemental material for this article is available online.
References
Supplementary Material
Please find the following supplemental material available below.
For Open Access articles published under a Creative Commons License, all supplemental material carries the same license as the article it is associated with.
For non-Open Access articles published, all supplemental material carries a non-exclusive license, and permission requests for re-use of supplemental material or any part of supplemental material shall be sent directly to the copyright owner as specified in the copyright notice associated with the article.