
Abstract
Objective
To evaluate alterations in phase-shift values in the gray matter of patients with amyotrophic lateral sclerosis (ALS) using susceptibility-weighted imaging (SWI).
Methods
Twenty patients with definite or probable ALS and 19 age- and sex-matched healthy controls were enrolled. SWI was performed using a 3.0 T magnetic resonance imaging scanner. Phase-shift values were measured in corrected phase images using regions of interest, which were placed on the bilateral precentral gyrus, frontal cortex, caudate nucleus, globus pallidus, and putamen.
Results
Phase-shift values of the precentral gyrus were significantly lower in ALS patients (−0.176 ± 0.050) than in the control group (−0.119 ± 0.016) on SWI. The average phase-shift values of the frontal cortex, caudate nucleus, globus pallidus, and putamen in ALS patients (−0.089 ± 0.023, −0.065 ± 0.016, −0.336 ± 0.191, and −0.227 ± 0.101, respectively) were not significantly different from those in the healthy controls (−0.885 ± 0.015, −0.079 ± 0.018, −0.329 ± 0.136, and −0.229 ± 0.083, respectively).
Conclusions
Compared with healthy controls, ALS patients had a lower phase-shift value in the precentral gyrus, which may be related to abnormal iron overload. Thus, SWI is a potential method for identifying ALS patients.
Keywords
Introduction
Amyotrophic lateral sclerosis (ALS) is one of the most common neuromuscular diseases worldwide, and affects people of all races and ethnic backgrounds. One or two out of 100,000 people develop ALS each year. It is characterized by selective damage to both upper and lower motor neurons, resulting in progressive weakness and eventually death—usually from respiratory failure.
The pathogenesis of ALS remains unclear, although glutamate toxicity has been associated with this disease.1–3 Decreased N-acetylaspartate levels and higher glutamate/glutamine (β, γ-Glx) values have been identified in ALS patients, suggesting metabolic abnormalities in the precentral gyrus.4,5 Another hypothesis is that ALS is caused by a disorder of iron homeostasis.6,7 Dysfunctional iron regulation can induce oxidative stress and lead to motor neuron damage.8–11
Abnormal iron deposition in the brain has been suggested by the presence of a hypointense signal or dark line in the precentral gyrus of ALS patients via magnetic resonance imaging (MRI) techniques, such as T2-weighted imaging (T2WI).12–15 However, iron deposition can also occur in the cortex of the normal population with aging. 15 Thus, T2WI may show a similar low intensity in the precentral gyrus of the normal aged population, rendering T2WI ineffective for differentiating ALS patients from healthy individuals. A more sensitive method is therefore needed to determine upper motor neuron damage.
Susceptibility-weighted imaging (SWI) is an advanced imaging technique based on the magnetic susceptibility differences of tissue.16,17 It involves three-dimensional acquisition, full flow compensation, high resolution, and a thin-layer gradient-echo sequence reconstruction. Both magnitude and phase images can be obtained on SWI. The phase image is performed with a high-pass filter to remove unwanted artifacts. The magnitude image is then combined with the phase image to create an enhanced-contrast magnitude image (i.e., SWI). SWI has been demonstrated to be highly sensitive to vein structures, blood metabolites, and iron deposition. It is of high clinical value in imaging brain tumors, cerebrovascular disease, traumatic brain injury, neurodegenerative diseases, and other central nervous system lesions. 18 Therefore, the application of SWI may provide new, key information that may help us to better understand the physiology of ALS.
In the present study, we aimed to investigate whether SWI was able to identify ALS patients from the healthy population, using statistical analyses of the phase data generated from SWI.
Materials and methods
Patients
This study included patients diagnosed with or suspected to have ALS, as determined by a hospital clinical neurology specialist. These patients were included after a careful application of the El Escorial criteria. Disability was evaluated using the modified Norris score and the ALS Functional Rating Scale (ALSFRS).
For the control group, age- and sex-matched volunteers were enrolled. These control patients had no history of any organic disease or other neurological disorders, and were not taking any medication that may impact the nervous system.
This retrospective study was approved by the Ethics Committee of Chinese PLA General Hospital. Written informed consent was obtained from all participants.
MRI acquisition
MRI examinations were performed on a 3.0 T MRI scanner (GE Medical Systems, Milwaukee WI, USA) with a gradient field of 40 mT/m, a gradient switching rate of 150 T/m/s, and an eight-channel head coil. Images were analyzed using a Sun graphics workstation (Sun Microsystems Inc., Menlo Park, CA, USA) and Advantage™ for Windows version 4.2 software (TA Instruments, New Castle, DE, USA). The following SWI sequence parameters were used: T2-weighted imaging (T2WI; repetition time (TR)/echo time (TE) = 5000 ms/113.7 ms), slice thickness = 6 mm, interval = 1 mm, flip angle = 90°, field-of-view (FOV) = 24 cm × 24 cm, number of excitations (NEX) = 1. Phase images were acquired using a three-dimensional flow-compensated gradient-echo sequence, with a total of 56 slices: slice thickness = 2 mm, TR = 32 ms, TE = 19 ms, flip angle = 20°, FOV = 24 × 24 cm, matrix 448 × 384, NEX = 0.75.
Data processing and analysis
The obtained gradient-echo sequence images were stored in the Sun graphics workstation and were corrected using FuncTool software (GE Healthcare, Chicago, IL, USA). Two experienced radiologists who were unaware of the clinical data reviewed the regions of interest (ROIs) in the corrected phase images. Five ROIs were identified: the bilateral precentral gyrus (15–25 pixels), frontal cortex (15–25 pixels), caudate nucleus (25–35 pixels), globus pallidus, and putamen. To measure the phase-shift value in the precentral gyrus, the three slices with the largest amount of phase shift were selected. To measure phase-shift values in the frontal cortex, caudate nucleus, globus pallidus, and putamen, the slice with the highest phase-shift value among three measurements was selected.
Statistical analysis
SPSS for Windows, Version 15.0 (SPSS Inc., Chicago, IL, USA) was used to analyze the correlations between phase-shift values and disease severity (as assessed by disease duration, modified Norris score, and ALSFRS score). P < 0.05 was considered statistically significant.
Results
Patients
This study included 20 patients (13 male patients and seven female patients with a mean age of 46 ± 14.5 years, ranging from 17 to 75 years) diagnosed with or suspected to have ALS. Of the 20 patients, 11 were cases of definite ALS, five were cases of probable ALS, and four were cases of possible ALS. All patients except two had sporadic ALS. Disease duration for the 18 sporadic ALS cases ranged from 4 to 76 months, while the disease durations for the two familial cases were 144 and 192 months. The overall mean disease duration was 41.2 ± 57.1 months. Thirteen cases had received routine electromyography and showed neurogenic damage.
For the control group, 19 age- and sex-matched volunteers (11 male patients and eight female patients with a mean age of 43.8 ± 12.7 years, ranging from 14 to 62 years) were enrolled. All patients in the ALS and control groups were right-handed. The clinical characteristics of both groups are presented in Table 1.
Amyotrophic lateral sclerosis (ALS) clinical cases and controls

ALSFRS, Amyotrophic Lateral Sclerosis Functional Rating Scale.
Comparisons of SWI images between ALS patients and controls
The SWI images (Figure 1) showed a higher number of low-signal lines in the bilateral precentral gyrus of ALS patients (left) compared with healthy controls (right). Although the precentral gyrus of healthy controls also showed some low-signal lines, they were not as dark or abundant as those in ALS patients.

Comparison of susceptibility-weighted images of the precentral gyrus between a 47-year-old amyotrophic lateral sclerosis patient (left) and a 54-year-old healthy control (right)
Comparative analysis of the phase-shift values
We further compared the phase-shift values of ALS patients with those of controls in the precentral gyrus, frontal cortex, caudate nucleus, globus pallidus, and putamen (Table 2 and 3). The average phase-shift values of the precentral gyrus, frontal cortex, caudate nucleus, globus pallidus, and putamen in ALS were −0.176 ± 0.050, −0.089 ± 0.023, −0.065 ± 0.016, −0.336 ± 0.191, and −0.227 ± 0.101, respectively. The corresponding average phase-shift values of the controls were −0.119 ± 0.016, −0.885 ± 0.015, −0.079 ± 0.018, −0.329 ± 0.136 and −0.229 ± 0.083, respectively. The phase-shift values were significantly lower in the precentral gyrus of ALS patients compared with the control group (F = 16.859, P < 0.001). No significant differences were identified between the two groups in the comparison of other regions (Figure 2).
The relative phase-shift values in the bilateral frontal cortex, caudate nucleus, globus pallidus, and putamen in 20 amyotrophic lateral sclerosis patients

F, female; M, male.
The phase-shift values in three selected slices of bilateral precentral gyrus in amyotrophic lateral sclerosis patients
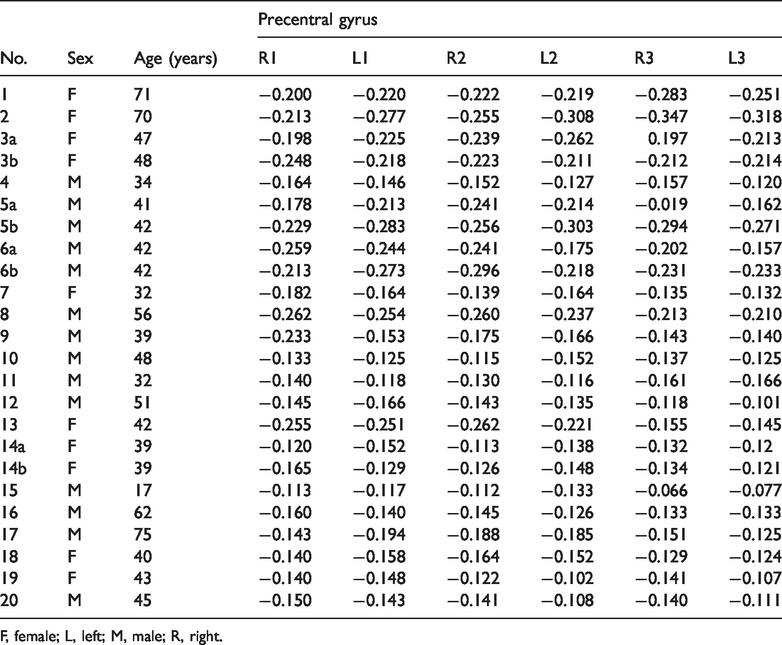
F, female; L, left; M, male; R, right.

Comparisons of phase-shift values in various regions of the brain between amyotrophic lateral sclerosis patients and controls
Comparative analysis of gray matter phase-shift values between the left and right hemispheres in ALS patients
We also compared the gray matter phase-shift values between the left and right hemispheres in ALS patients, to determine whether there were differences in the amount of iron deposition. There were no significant differences between the left and right gray matter regions (including the precentral gyrus, frontal cortex, caudate nucleus, globus pallidus, and putamen) in ALS patients.
Correlations between the precentral gyrus phase-shift value and disease severity
Statistical analysis revealed no significant correlations between the precentral gyrus phase-shift values (means) and disease duration, modified Norris score, or ALSFRS (data not shown).
Discussion
ALS is a fatal neurological disorder that is characterized by the progressive failure of motor neurons. 19 Brain morphology is generally normal in ALS patients, with only varying degrees of precentral gyrus atrophy. 20 Other hallmarks of ALS pathophysiology include a reduction in the motor cortex pyramidal cell layer, gliosis in the second and/or third layers of the brain, and secondary degeneration in the corticospinal tract.21,22 To date, no test can provide a definite diagnosis of ALS, although the presence of upper and lower motor neuron abnormalities in a single limb is strongly suggestive of the disease. Damage in the lower motor neurons can be accurately identified using muscle and nerve biopsies and electromyograms; however, it is clinically more challenging to determine damage in the upper motor neurons. When ALS is suspected, physicians commonly perform an MRI examination to take detailed images of the brain and spinal cord. However, these MRI scans can only reveal evidence of other problems that may be causing the symptoms, such as a spinal cord tumor, multiple sclerosis, a herniated disk in the neck, syringomyelia, or cervical spondylosis.
Elevated iron levels in the brain have been associated with many neurodegenerative diseases. 23 In 1922, Julius Hallervorden and Hugo Spatz first reported a neurodegenerative disease associated with motor abnormalities among children; this disease, which was later named pantothenate kinase-associated neurodegeneration, was associated with abnormal iron deposition in the basal ganglia. 24 Similarly, increased iron content has been detected in the substantia nigra and globus pallidus of patients diagnosed with Parkinson’s disease,25,26 and in the hippocampus of patients with Alzheimer’s disease. 27 In addition, deposition of spherical non-heme iron near chronic plaques has been observed in patients with multiple sclerosis. 28 Furthermore, in patients with Huntington’s disease, iron content in the putamen is reportedly 150% higher compared with a healthy control group. 29 A recent investigation has also suggested iron overload in the motor cortex of ALS patients.6,30
The localization of iron deposition can be attributed to ischemia or hypoxia in the basal ganglia. Dietrich and Bradley 31 demonstrated that the normal axonal transport of iron is interrupted during brain tissue ischemia or hypoxia. During hypoxia/ischemia, increased iron deposition may be the result of direct damage caused by degraded products from lipid peroxidation, a process that is catalyzed by iron. 31 It is therefore important to understand the progress of neurodegenerative diseases by determining iron deposition.
Abnormal deposition of iron in brain tissue is suggested to be represented by a dark line that is evident in T2WI and fluid-attenuated inversion recovery (FLAIR); however, T2WI and FLAIR are ineffective for discriminating between ALS patients and the healthy aged population (free of neurological diseases) because increased iron accumulation occurs in both populations. In the present study, we performed statistical analyses to determine whether SWI was able to be used to identify specific characteristics or alterations in patients with ALS compared with age-matched healthy patients. SWI is usually run at a relatively high resolution (1 mm3) and is extremely sensitive at detecting bleeding in the gray matter/white matter boundaries, thus enabling the observation of very small lesions and the detection of very subtle injuries. SWI may therefore be useful for assessing iron deposition in ALS patients, and potentially for discriminating individuals with ALS from an age-matched population.
Previous studies have also investigated ALS using SWI. For example, Prell et al. 32 analyzed SWI data from a cohort of 27 patients with ALS and 30 healthy age-matched controls. These authors suggested that SWI may be capable of identifying iron and myelin disturbances in ALS patients. The SWI patterns observed in this previous study indicate that widespread alterations are caused by iron disturbances in patients with ALS, and correlate with disease severity. 32 Adachi et al. 30 scored the signal intensity of the motor cortex on SWI, and reported a significant difference in precentral cortex signal intensity scores between ALS patients and controls. These authors concluded that a low signal intensity in the motor cortex on SWI may be useful for the diagnosis of ALS, particularly in younger patients. MRI was also helpful for speculating on the etiology of ALS. 30 Furthermore, Endo et al. 33 analyzed the relationship between relative susceptibility changes in the motor cortex. Patients with ALS exhibited significantly lower signal intensity in the precentral gyrus on SWI compared with controls. 33 Our analyses of SWI data in the present study clearly demonstrated that the phase-shift value in the precentral gyrus was lower (because of a higher local magnetic susceptibility) in ALS patients compared with age-matched controls. This lower phase-shift value was likely the result of increased iron deposition in ALS patients, suggesting the presence of lesions in the precentral gyrus. There were no differences in phase-shift values between ALS patients and healthy patients in the frontal cortex, caudate nucleus, globus pallidus, or putamen. Our results therefore indicate that SWI may be a potential method for diagnosing ALS.
There are several limitations in our study. First, our results did not show any correlations between phase-shift values and disease duration or severity. However, the lack of significance may be caused by the relatively small number of patients included in our study. Second, there was no follow-up of patients in the present study. Third, no postmortem study was performed to validate the increase in iron deposition in the precentral gyrus of ALS patients; thus, the relevance of abnormal iron deposition in ALS pathogenesis remains unclear. Further study is therefore warranted to confirm the association between phase shifts and ALS pathology.
Conclusions
The ALS patients presented reduced phase-shift values in the precentral gyrus. SWI may potentially be used to diagnose ALS patients.
Footnotes
Acknowledgements
The authors thank all patients for their participation and all staff of the neurological department for their assistance in every step of this study.
Author contributions
Meng-Yu Liu: data acquisition and analysis; Zhi-Ye Chen: data analysis; Jing-Feng Li: data acquisition; Hua-Feng Xiao: data analysis; Lin Ma: concept, design, and manuscript review.
Declaration of conflicting interest
The authors declare that there is no conflict of interest.
Funding
The author(s) disclosed receipt of the following financial support for the research, authorship, and/or publication of this article: This work was supported by the National Natural Science Foundation of China (30470512).