
Abstract
Background:
A novel coronavirus disease 2019 (COVID-19) has caused outbreaks worldwide, and the number of cases is rapidly increasing through human-to-human transmission. Because of the greater transmission capacity and possible subsequent multi-organ damage caused by the virus, it is crucial to understand precisely and manage COVID-19 patients. However, the underlying differences in the clinical features of COVID-19 with and without comorbidities are not fully understood.
Aim:
The objective of this study was to identify the clinical features of COVID-19 patients with and without complications to guide treatment and predict the prognosis.
Method:
We collected the clinical characteristics of COVID-19 patients with and without different complications, including hypertension, cardiovascular disease and diabetes. Next, we performed a baseline comparison of each index and traced the dynamic changes in these factors during hospitalization to explore the potential associations.
Result:
A clinical index of differential expression was used for the regression to select top-ranking factors. The top-ranking clinical characteristics varied in each subgroup, such as indices of liver function, renal function and inflammatory markers. Among them, the indices of renal function were highly ranked in all subgroups and displayed significant differences during hospitalization.
Conclusion:
Organ functions of COVID-19 patients, particularly renal function, should be cautiously taken care of during management and might be a crucial factor for a poor prognosis of these patients with complications.
Introduction
A coronavirus disease 2019 (COVID-19) pandemic has occurred since December 2019. The disease spread rapidly across China and other countries worldwide. The number of new cases peaked in early January 2021 when there were just under 5 million cases reported in 1 week. Nevertheless, new cases have continued to rise globally in past weeks.
COVID-19 is caused by severe acute respiratory syndrome–coronavirus 2 (SARS-CoV-2). Compared with severe acute respiratory syndrome (SARS) and the Middle East respiratory syndrome, COVID-19 has greater transmission capacity and a higher incidence of acute respiratory failure. 1 Despite the fact that vaccines against SARS-CoV-2 have been phased in during the past year, new strains of the virus, such as B.1.1.7 (501Y.V1), have suddenly surged in India, associated with probable diagnostic test failures and antibody escape. 2 Emerging evidence suggests that SARS-CoV-2 infection also leads to multi-system disorders.3 –5 For example, SARS-CoV-2-mediated endothelial injury is another risk during infection, and dysfunction of the vascular system with its sequelae, wis a crucial factor influencing the prognosis. COVID-19 patients with diabetes, 8 cardiovascular disease (CVD), 9 or other complications usually suffer from increased severity and mortality compared with COVID-19 patients without those diseases. A pooled analysis 10 exhibited a higher risk of severe COVID-19 in patients with hypertension – odds ratio (OR): 2.49; 95% confidence interval (CI): 1.98–3.12 – and a higher mortality risk – OR: 2.42; 95% CI: 1.51–3.90. Patients benefit from proper management of complications such as freedom from mechanical ventilation. 11
Chronic organ dysfunction, particularly renal impairment, is an independent risk factor for mortality in patients with COVID-19 (OR: 1.33; 95% CI: 1.28–1.40). 12 About 20% of severe COVID-19 patients require renal replacement therapy, and the in-hospital mortality is nearly 50% among patients with acute kidney injury (AKI) compared to 8% among those without AKI (adjusted OR: 9.2; 95% CI: 7.5–11.3). 13 Of the surviving patients in a New York study, 13 the renal function of nearly 30% of patients recovered after discharge from the hospital. Therefore, identifying and managing the clinical features of COVID-19 patients with complications could play important roles in guiding treatment and predicting the prognosis.
Notably, the clinical features of COVID-19 with and without complications have been incompletely described. Among the features, cardiovascular, gastrointestinal, neurological and metabolic symptoms have been underestimated. In this study, we describe the clinical characteristics of patients diagnosed with COVID-19 with and without specific prognostic effectors and trace the space–time dynamics of the disease to facilitate the management of COVID-19 and improve the prognosis of these patients.
Materials and methods
Patients
The data were collected from 512 patients hospitalized at Tongji Hospital, Wuhan, China, from 20 January 2020 to 20 February 2020. All patients were defined according to “Prevention and control of COVID-19 Protocol” issued by the National Health Commission of the People’s Republic of China. All infected individuals had positive nucleic acids in nasal and/or pharyngeal swabs. The coronavirus nucleic acid was detected by real-time polymerase chain reaction (RT-PCR), and the viral gene was sequenced with a known sequence of SARS-CoV-2.
This retrospective study was reviewed and approved by the Institutional Review Board for Human Studies of Second Affiliated Hospital of Zhejiang University, School of Medicine (2020-132) and Tongji Hospital (TJ-IRB20210115). The need for consent was waived by the ethics committee because of no intended intervention or subsequent damage. The enrolment process and exclusion criterion for this study are shown in Figure 1.
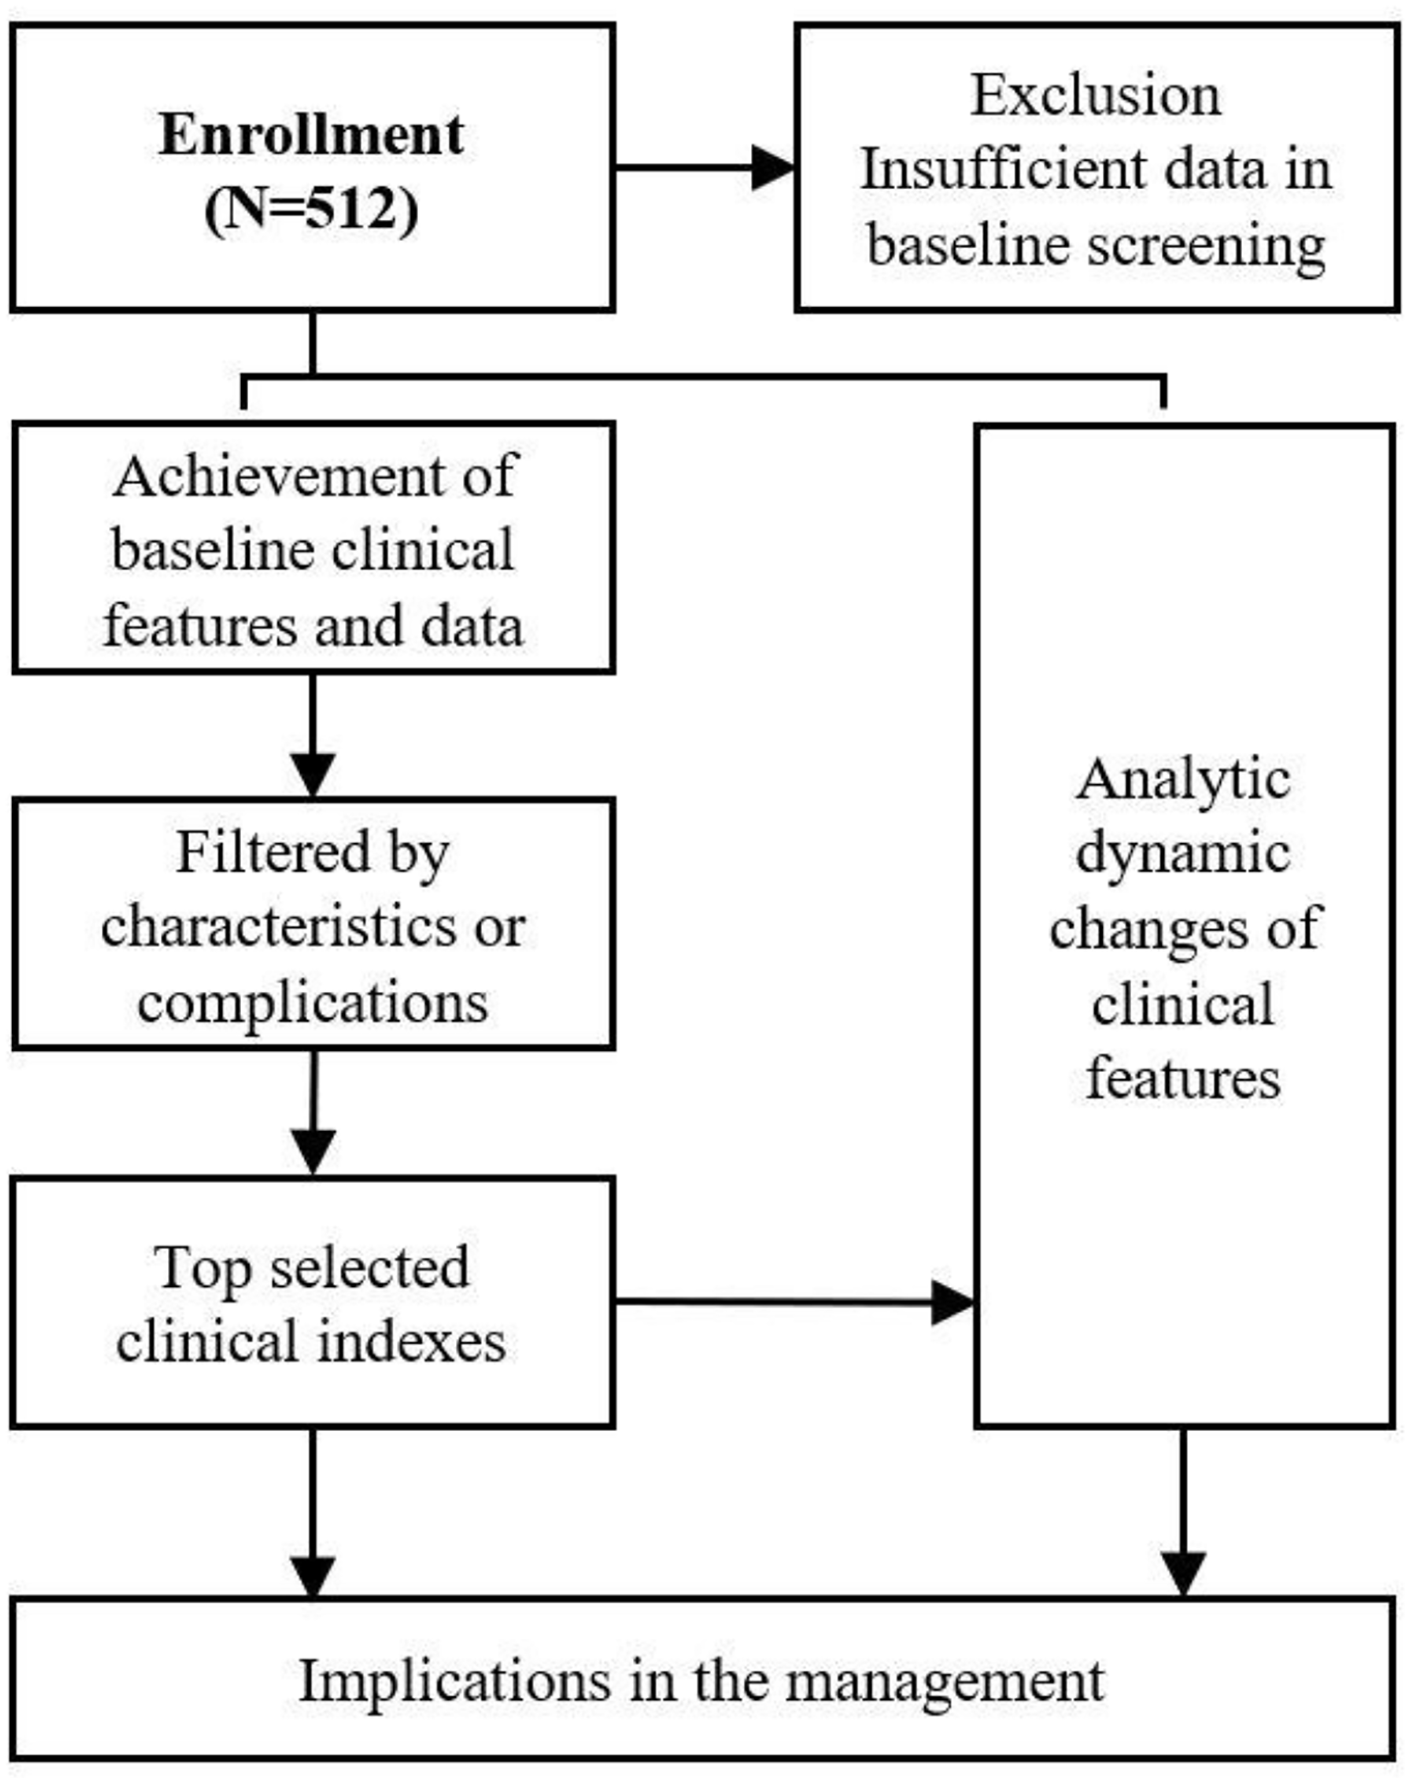
The patient enrolment process and excluded criterion.
Data collection and analysis
The diagnosis of comorbidities, such as hypertension, diabetes or CVD, was based on medical history. The baseline and dynamic changes in blood indices were recorded to reflect the progression of disease in COVID-19 patients. We used the area under the curve (AUC) formula to calculate the areas under the curve of the blood examination data among various time points to detect whether dynamic changes could be used to predict patient outcomes. Because the values of each index varied significantly, all vertical coordinates underwent a logarithmic transformation.
Statistical analysis
Two subgroups were created according to different clinical features, and means and upper and lower quartiles were represented as box plots. Data in tables are represented as mean ± standard deviation (SD). The chi-square test was performed for the contingency data. Statistical analyses were conducted using GraphPad Prism software (version 9.0; GraphPad Software, Inc., La Jolla, CA, USA). A p value < 0.05 was considered significant.
Results
Patient demographics
A total of 512 patients were diagnosed with COVID-19 according to our criteria. The patient characteristics are summarized in Table 1. The majority of the patients had an epidemiological history of COVID-19. Genders were generally matched, and nearly 60% of the patients were more than 60 years old. A minority of patients admitted to smoking history, and a few patients were diagnosed with obesity according to their body mass index.
The comparison of demography in COVID-19 patients (N = 512).

COVID-19, coronavirus disease 2019.
Clinical patterns of COVID-19 patients with and without a specific clinical index
For an in-depth understanding of the clinical characteristics of the patients with COVID-19, we evaluated the clinical features on subsets of test cohorts divided by gender, age, hypertension, CVD and diabetes. The clinical indices were subjected to regression to select the top-ranking factors. We performed a baseline comparison of each index and traced the dynamic changes of these factors during hospitalization. As 2 male patients did not provide the medical history of certain implications, these 2 patients would be excluded in the following subgroup analysis.
The baseline and dynamic changes in each index were analysed in COVID-19 patients to observe the progression of the disease. Moreover, we used the AUC formula to calculate the area under the curve for an examination of the five blood factors described below. As the hospitalized time of each patient varied, we used the average AUC [total AUC/hospitalized period (days)] to represent the dynamic changes between the different time points.
Comparison of the clinical manifestations of COVID-19 patients by gender
We compared male and female patients. The demographic data are summarized below (Table 2). According to the baseline data, no differences in the stratified factors were observed between male and female patients.
The comparison of clinical manifestations in COVID-19 patients with different genders.

COVID-19, coronavirus disease 2019; NA, not available.
We used linear regression and clustering analyses to identify the clinical features with the greatest differences, and creatinine (Cr), blood urea nitrogen (BUN), C-reactive protein (CRP), interleukin-6 (IL-6) and alanine aminotransferase (ALT) were associated with gender in COVID-19 patients (Figure 2(a)).

Clinical characteristics in sex-related subgroup: (a) index at baseline and (b) dynamic change of each index.
Higher Cr (male versus female, 1.917 ± 0.120 versus 1.771 ± 0.109, p < 0.0001) and BUN (0.704 ± 0.191 versus 1.586 ± 0.172, p < 0.0001) were detected in male patients at baseline than female patients. Inflammatory markers, such as CRP (1.511 ± 0.619 versus 1.182 ± 0.685, p < 0.0001) and IL-6 (1.071 ± 0.559 versus 0.919 ± 0.487, p = 0.0201), were higher in male patients than female patients. In addition, male patients also had elevated ALT levels (1.529 ± 0.268 versus 1.350 ± 0.314, p = 0.0003) at baseline compared to female patients.
As the disease progressed, male patients demonstrated higher levels of Cr (1.909 ± 0.093 versus 1.775 ± 0.089, p < 0.0001), BUN (0.692 ± 0.138 versus 0.620 ± 0.114, p < 0.0001), CRP (1.117 ± 0.531 versus 0.849 ± 0.576, p < 0.0001), IL-6 (1.035 ± 0.526 versus 0.816 ± 0.401, p = 0.0023) and ALT (1.541 ± 0.260 versus 1.348 ± 0.246, p < 0.0001) (Figure 2(b)). These data suggest that there might be gender differences in renal function, liver function and systemic inflammation in COVID-19 patients.
Comparison of the clinical manifestations in COVID-19 patients of different ages
Next, we divided the COVID-19 patients into two subgroups – patients >60 years and patients ⩽60 years – to analyse further their clinical features (Figure 3(a)). The demographic data are summarized in Table 3.
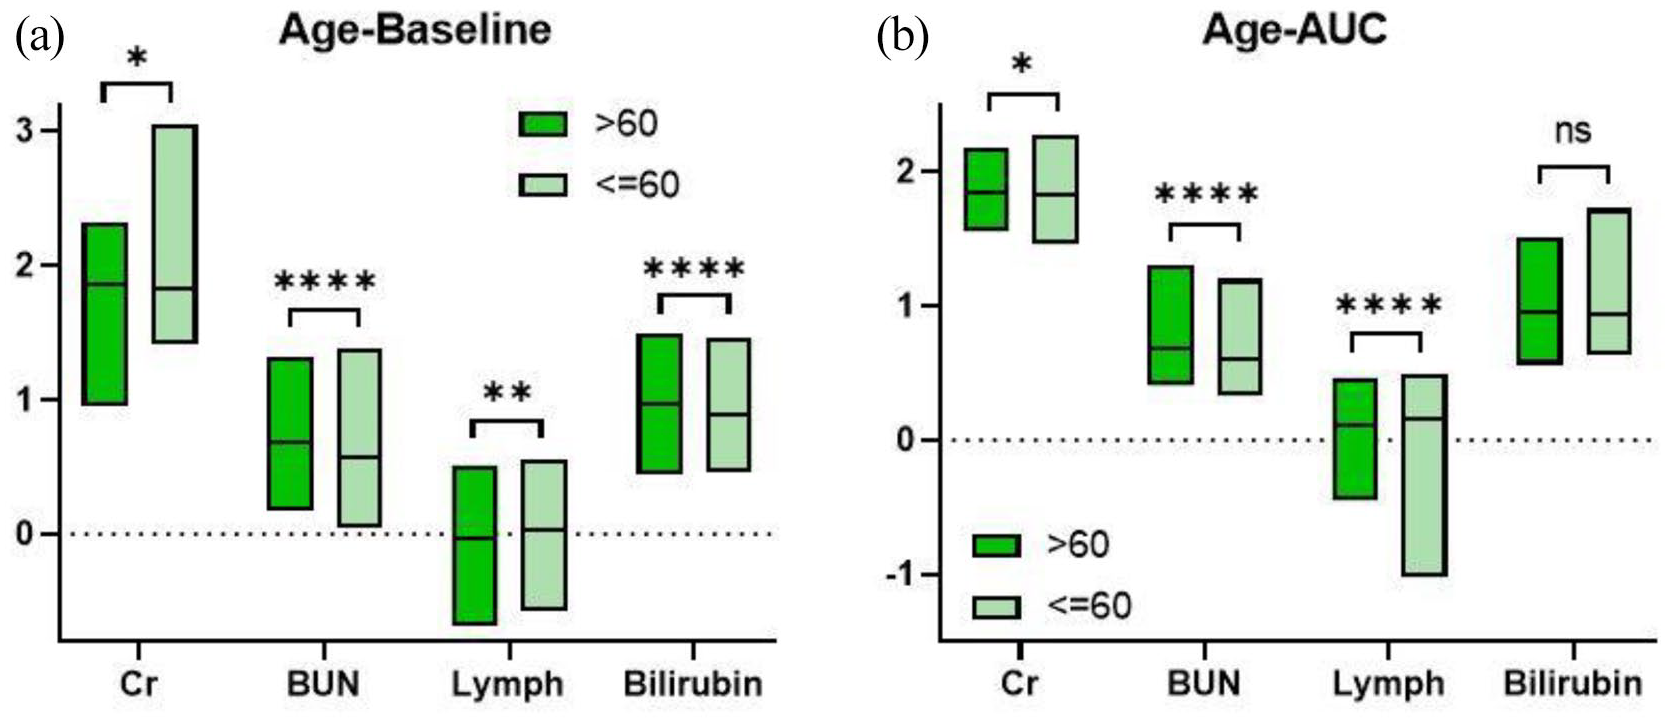
Clinical characteristics in age-related subgroup: (a) index at baseline and (b) dynamic change of each index.
The comparison of clinical manifestations in COVID-19 patients with different ages.

COVID-19, coronavirus disease 2019; NA, not available.
Similarly, there were still significant differences in the renal function-related indices, such as Cr and BUN, between the two subgroups. Younger patients demonstrated a decrease of Cr (>60 group versus ⩽60 group, 1.853 ± 0.138 versus 1.826 ± 0.167, p = 0.0312) and BUN (0.686 ± 0.176 versus 0.569 ± 0.192, p < 0.0001). In the clustering analysis, the number of lymphocytes and bilirubin levels were significantly different between the two groups. Lymphocyte cellularity was lower in patients >60 years than that of younger patients at baseline (−0.032 ± 0.222 versus 0.025 ± 0.208, p = 0.0015), which could be attributed to lower immune function and nutritional status. 14 Furthermore, a higher level of bilirubin (0.966 ± 0.214 versus 0.893 ± 0.183, p < 0.0001) was detected in the older subgroup. In the following dynamics analysis (Figure 3(b)), younger patients also demonstrated lower levels of Cr (1.847 ± 0.110 versus 1.823 ± 0.116, p = 0.0106) and BUN (0.686 ± 0.125 versus 0.600 ± 0.124, p < 0.0001), a greater number of lymphocytes (0.107 ± 0.153 versus 0.162 ± 0.149, p < 0.0001) and comparable bilirubin (0.952 ± 0.163 versus 0.933 ± 0.153, p = 0.1568). Our findings suggest that renal function could be correlated with COVID-19, and bilirubin level and the number of lymphocytes may also be age-related in COVID-19 patients.
Comparison of the clinical manifestations of COVID-19 patients with and without hypertension
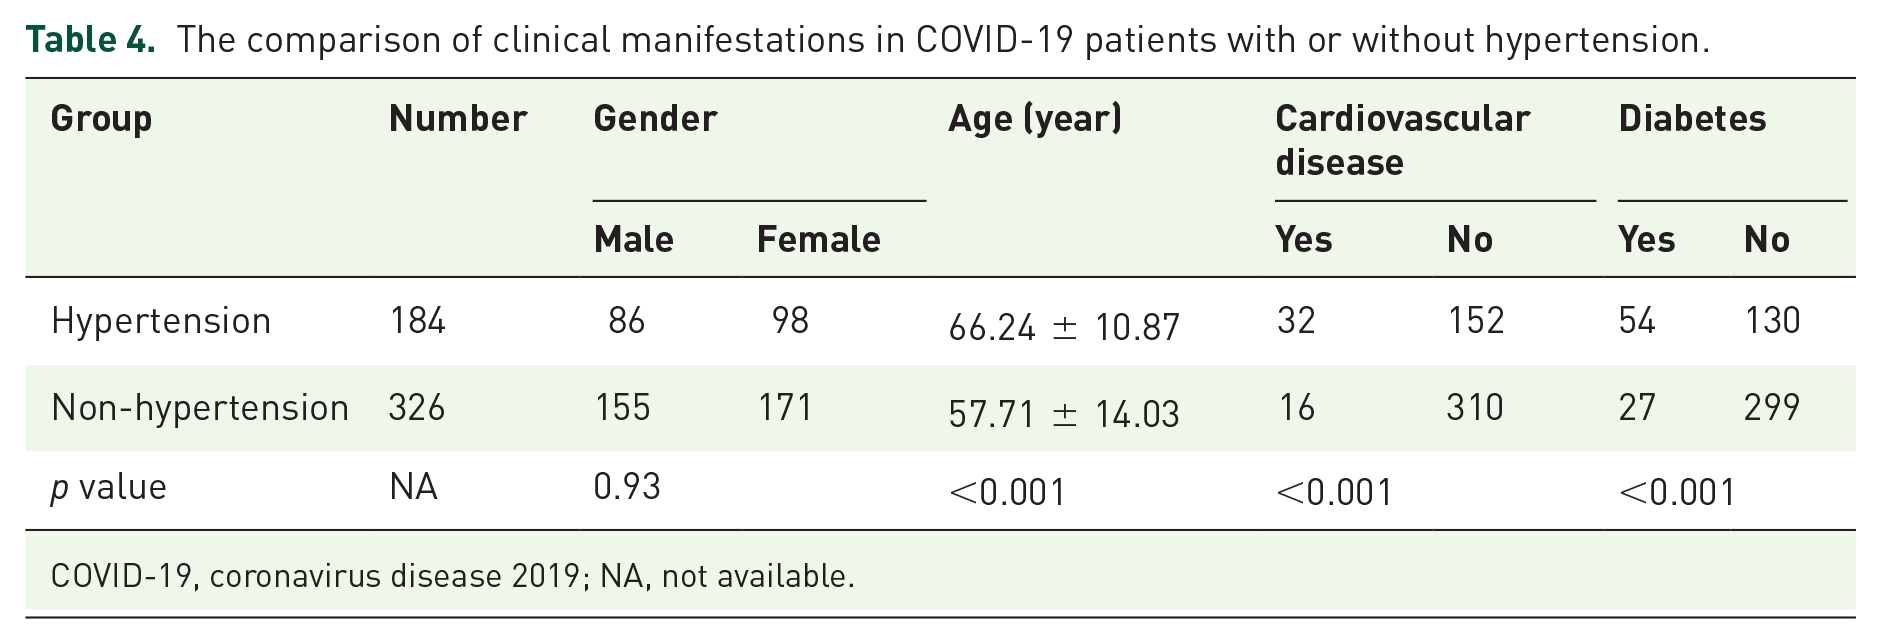
For the next subgroup analysis, patients were grouped according to whether they were diagnosed with hypertension. The demographic characteristics are presented in Table 4.
The comparison of clinical manifestations in COVID-19 patients with or without hypertension.
COVID-19, coronavirus disease 2019; NA, not available.
The six indices varied during hospitalization. In line with the other subgroup analysis, Cr and BUN were different at baseline (Figure 4(a)). Increases in Cr (hypertensive group versus non-hypertensive group, 1.870 ± 0.153 versus 1.823 ± 0.122, p = 0.0001) and BUN (0.706 ± 0.191 versus 0.603 ± 0.179, p < 0.0001) were detected in COVID-19 patients with hypertension compared to those without. The number of white blood cells (0.774 ± 0.164 versus 0.737 ± 0.172, p = 0.0085) was higher in the hypertensive group than in the non-hypertensive group; however, inflammatory cytokines, such as tumour necrosis factor (TNF; 0.942 ± 0.198 versus 0.922 ± 0.184, p = 0.3799), were not significantly different. Our findings suggested higher levels of bilirubin (0.976 ± 0.220 versus 0.918 ± 0.195, p = 0.0011) and lactate dehydrogenase (LDH; 2.495 ± 0.145 versus 2.464 ± 0.143, p = 0.0104) in COVID-19 patients with hypertension. The differences in white blood cells vanished (0.778 ± 0.132 versus 0.758 ± 0.118, p = 0.0589) with a comparable TNF concentration (0.950 ± 0.158 versus 0.918 ± 0.169, p = 0.1053; Figure 4(b)). In addition, the differences in Cr (1.860 ± 0.122 versus 1.826 ± 0.105, p = 0.0004), BUN (0.703 ± 0.132 versus 0.626 ± 0.123, p = 0.0005), bilirubin (0.975 ± 0.173 versus 0.927 ± 0.149, p = 0.0005) and LDH (2.369 ± 0.093 versus 2.347 ± 0.094, p = 0.0058) remained. Taken together, renal function, bilirubin and LDH could be associated with a risk of COVID-19 in patients who are also diagnosed with hypertension; however, inflammatory status might not be associated.

Clinical characteristics in hypertension-related subgroup: (a) index at baseline and (b) dynamic change of each index.
Comparison of the clinical manifestations of COVID-19 patients with and without CVD
The patients were divided into subgroups with and without a history of CVD. The demographic characteristics are shown in Table 5.
The comparison of clinical manifestations in COVID-19 patients with or without CVD.

COVID-19, coronavirus disease 2019; CVD, cardiovascular disease; NA, not available.
Only the renal indices, such as Cr and BUN, were picked as a result of the clustering analysis. Our findings demonstrated that the levels of Cr (CVD group versus non-CVD group, 1.891 ± 0.129 versus 1.834 ± 0.136, p = 0.0011) and BUN (0.714 ± 0.202 versus 0.633 ± 0.189, p = 0.0012) were higher in COVID-19 patients with CVD than without CVD upon admission (Figure 5(a)). Expectedly, Cr (1.884 ± 0.109 versus 1.833 ± 0.112, p = 0.0005) and BUN (0.726 ± 0.141 versus 0.646 ± 0.129, p < 0.0001) still remained elevated in patients with CVD during hospitalization (Figure 5(b)).
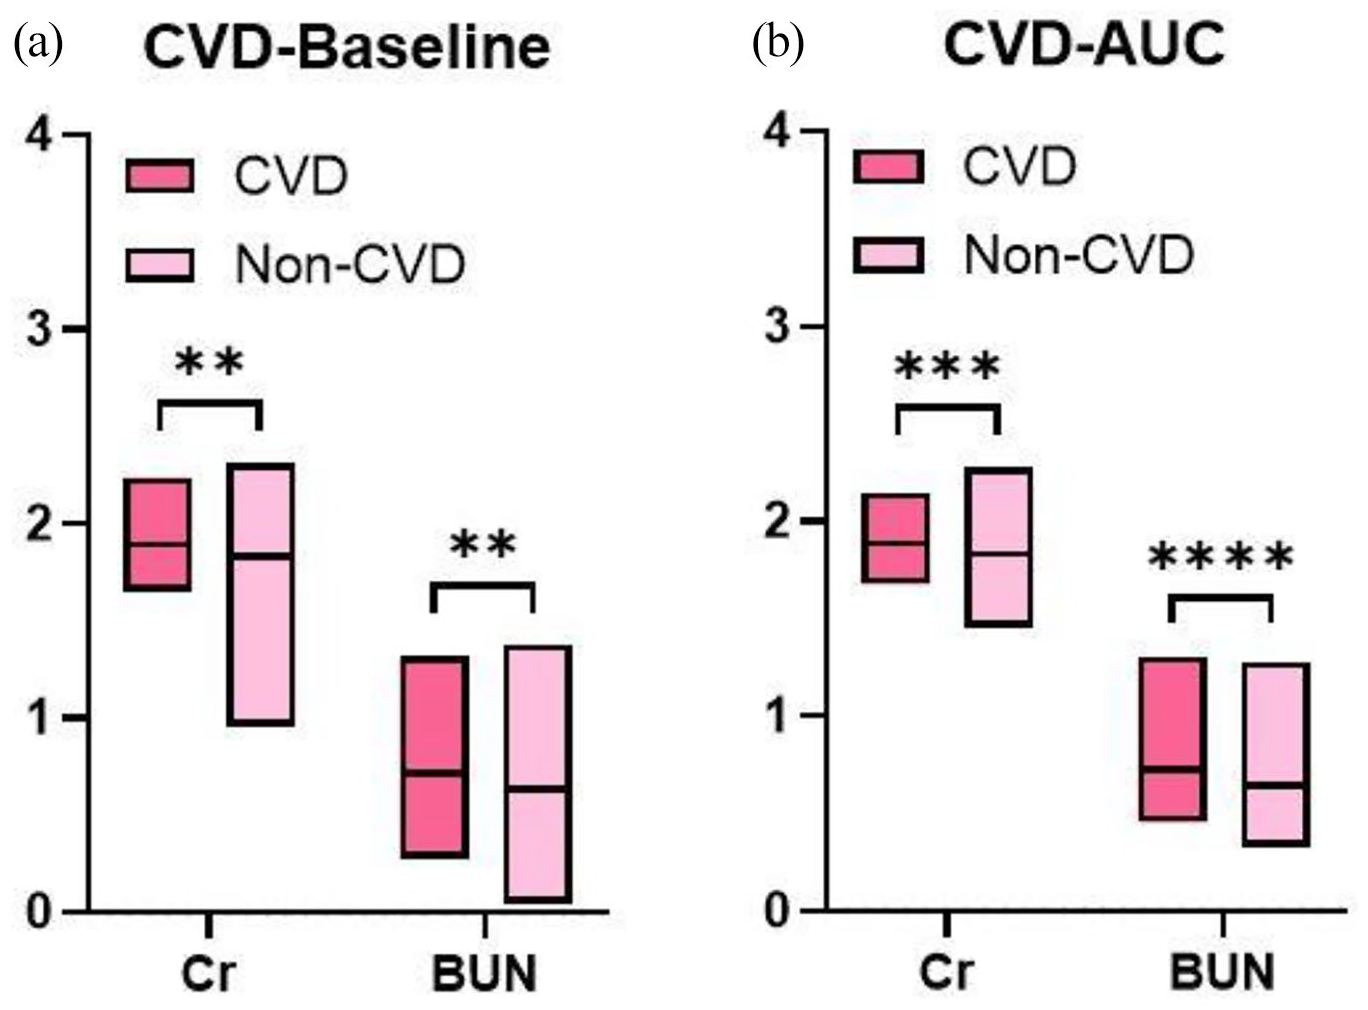
Clinical characteristics in CVD-related subgroup: (a) index at baseline and (b) dynamic change of each index.
Comparison of clinical manifestations in COVID-19 patients with and without diabetes
We performed a subgroup analysis between COVID-19 patients with and without diabetes. The demographic data are summarized in Table 6.
The comparison of clinical manifestations in COVID-19 patients with or without diabetes.

COVID-19, coronavirus disease 2019; NA, not available.
Three indices filtered by the clustering analysis were collected. The baseline BUN level (diabetes group versus non-diabetes group, 0.721 ± 0.215 versus 0.628 ± 0.183, p = 0.0008) was higher in diabetic patients, whereas Cr (1.864 ± 0.187 versus 1.835 ± 0.124, p = 0.1617) was not significantly different between the two groups (Figure 6(a)). However, the dynamic analysis suggested that Cr (1.869 ± 0.164 versus 1.833 ± 0.100, p = 0.0473) and BUN (0.730 ± 0.171 versus 0.641 ± 0.118, p < 0.0001) increased in diabetic COVID-19 patients (Figure 6(b)). These findings suggest that renal function should be a concern when managing COVID-19 patients with diabetes. In another observed index, the number of lymphocytes was comparable between diabetic and non-diabetic COVID-19 patients at admission (0.001 ± 0.264 versus −0.013 ± 0.210, p = 0.6547) and at discharge (0.118 ± 0.218 versus 0.130 ± 0.140, p = 0.6107).

Clinical characteristics in diabetes-related subgroup: (a) index at baseline and (b) dynamic change of each index.
Discussion
COVID-19 remains a global challenge. Emerging evidence has demonstrated that SARS-Cov-2 causes systemic damage rather than lung injury only. 15 In our study, we focused on certain clinical characteristics of COVID-19 patients and performed dynamic analyses to distinguish changes in indices.
Linear regression and clustering analyses were performed for each subgroup analysis to describe the clinical features of COVID-19 patients with certain characteristics and explore the related indices. Interestingly, the renal function indices, such as Cr and BUN, were filtered in every subgroup analysis. Infection with COVID-19 could lead to renal dysfunction, particularly in severe cases.16,17 According to a single-center retrospective study, patients with renal dysfunction are more susceptible to developing AKI with a COVID-19 infection. 18 Chronic diseases, such as hypertension, 19 diabetes, 20 and cancer, lead to secondary kidney impairment. Early renal dysfunction is a potential cardiovascular risk factor, 21 which may due to metabolic syndrome or oxidative stress, and these dysfunctions lead to renal disorder. Inappropriate activation of the renin–angiotensin system is found in most cases of renal dysfunction. 22 Angiotensin-converting enzyme 2 (ACE2) is a powerful modulator during activation of the renin–angiotensin system. However, ACE2 is also widely accepted as an essential receptor of SARS-Cov-2. 23 According to the latest studies, ACE2 is highly expressed in the kidney; 24 therefore, viral entry through ACE2 probably contributes to the formation of the AKI caused by COVID-19. Reduced or absent renal function limits the drug choices that can be used against COVID-19. 25 Supportive therapy for other complications would also be limited, as a minority of COVID-19 patients recover their renal function. 13 Although our study could not identify the reason for the renal impairment in the patients, it suggests that attending to all causes of renal dysfunction might be needed to manage COVID-19 patients with underlying diseases.
Our study revealed that the number of lymphocytes varied by age in COVID-19 patients. Early studies have demonstrated that a decrease in total lymphocytes is a common clinical feature of COVID-19 patients. 26 According to a systemic review, COVID-19 patients with lymphopenia are more vulnerable to severe pneumonia 27 (OR: 4.5, 95% CI: 3.3–6.0). Hence, researchers have used the neutrophil-to-lymphocyte ratio 28 or the lymphocyte-to-CRP ratio 29 as an index to imply the severity of COVID-19. In our study, lower lymphocyte cellularity was found in older COVID-19 patients. This finding is in line with the results showing that the older population is more susceptible to severe COVID-19. 30 Furthermore, CD8+ lymphocytes, rather than CD4+ lymphocytes, are likely to be an independent precursor of COVID-19 severity.31 –33 As the fulfilment of immunity atlas in COVID-19, 34 accuracy predictors should be explored, and more elaborate studies should be conducted.
Evidence of the relationship between cigarette smoking and COVID-19 is being uncovered. According to Lowe and colleagues, 35 smokers are more vulnerable to severe COVID-19 infection, 36 and the relationship might be enhanced in cumulative exposed smokers. A study that enrolled 8910 COVID-19 patients who were hospitalized in 169 hospitals on three continents suggested that 9.4% of current smokers would not survive compared with 5.6% mortality of former smokers or non-smokers. 37 Chronic pulmonary inflammation or altered airway repair 38 contributes to the increased severity of COVID-19 in these patients. We did not perform such a subgroup analysis between smokers and non-smokers because of the limited number of smokers. Interestingly, no evidence exists between susceptibility to COVID-19 and cigarette smoking; hence, more studies are needed.
Our study had a number of limitations that should be discussed. First of all, this study was a retrospective analysis; all the patients were consecutively recruited and analysed without calculation and justification in sample size. Second, in each subgroup analysis, the demographic summary suggested that the ages of the patients with complications were significantly different compared with patients without complications, which was due to selection bias. However, these differences in baseline demographics did not affect our results and fit the result of epidemiological investigations of chronic disease.39,40 Third, the reasons for renal impairment varied and are not fully understood. In addition to previous diseases, such as hypertension or diabetes, social, environmental and health risk factors might lead to renal dysfunction.41,42 We could not exclude the scenario that renal damage existed before COVID-19 infection. As a retrospective analysis, our study suggests that the renal dysfunction indices increased in COVID-19 patients. Nonetheless, more accurate group schemes should be developed to explore the association between COVID-19 and certain chronic diseases.
Taken together, our study illustrates a number of clinical features in COVID-19 patients, with different subgroup analyses, and describes the dynamic changes. We hope that our study will provide some practical hints for managing COVID-19 patients.
Conclusion
High-ranking clinical indices varied in COVID-19 patients with different characteristics. Among them, renal function–related indices were mostly screened out. Thus, renal dysfunction was likely to be a potential prognostic factor and should be a focus when managing COVID-19 patients with complications.
Footnotes
Acknowledgements
Fen Lan, Chen Zhu, Rui Jin and Lingxiao Zhou contributed equally to this article.
Author contributions
F.L. and W.L. contributed to the design of this study. C.Z., L.Z. and R.J. contributed to data analysis and manuscript drafting. Y.X., Y.H., J.Z. and S.X. contributed to data collection, analyses and verification. All the processes were under the supervision of Y.X. and W.L. All authors contributed to revision of the manuscript, and confirmed the final approval of manuscript.
Conflict of interest statement
The authors declared no potential conflicts of interest with respect to the research, authorship, and/or publication of this article.
Funding
The authors disclosed receipt of the following financial support for the research, authorship, and/or publication of this article: This work was supported by the Zhejiang University Emergency Special Scientific Research Fund for COVID-19 (491020-X02004).