
Abstract
Background:
Accumulating evidence has demonstrated that bone marrow mesenchymal stem cells (BMSCs)-derived extracellular vesicles (EVs) can be used effectively to transfer drugs and biomolecules to target lesions. Meanwhile, BMSCs have been reported to be beneficial in the treatment of rheumatoid arthritis (RA). In this study, we employ gain- and loss-of-function experiments to determine how BMSCs-derived EVs alleviate RA in vitro and in vivo.
Methods:
We isolated EVs from BMSCs and characterized them by transmission electron microscopy and western blot analysis. The regulatory relationship between miR-21 and TET1 was predicted by bioinformatics analysis and validated by dual luciferase assay. Next, we utilized bisulfite sequencing PCR to decipher how TET1 promoted KLF4 transcription. Then, we established an RA mouse model and determined the role of miR-21 in RA progression. Functional assays were used to validate the role the miR-21-TET1-KLF4 regulatory axis in controlling mouse fibroblast-like synoviocytes (mFLS) cell proliferation and inflammatory cytokines secretion in vitro.
Results:
RT-qPCR results revealed that miR-21 was highly expressed in BMSCs-derived EVs, and confirmed that BMSCs-derived EVs transferred miR-21 into mFLS cells. Bioinformatic analysis predicted that TET1 was the directly downstream target of miR-21, which was further validated by dual luciferase assay. TET1 promoted KLF4 promoter methylation to increase its expression. Collectively, BMSCs-derived EVs relieved RA by delivering miR-21, while the exosomal miR-21 alleviated RA through targeting the TET1/KLF4 regulatory axis.
Conclusion:
miR-21 from BMSCs-derived EVs suppresses KLF4 to relive RA by targeting TET1.
Keywords
Introduction
Rheumatoid arthritis (RA) is an autoimmune disease, often characterized by persistent synovitis and systemic inflammation, key factors in its pathology. 1 Fibroblast-like synoviocyte (FLS) cells, also known as B-type synovial fibroblasts or synovial fibroblasts, are a special cell type which derive from the synovial lining and play an important role in the regulation of the aberrant inflammatory response and joint destruction during RA. 2 Bone marrow mesenchymal stem cells (BMSCs) can differentiate into bone, cartilage and adipose tissues, and accumulated evidence reveals that mesenchymal stem cells (MSCs) can be utilized to treat RA. 3 It has recently been demonstrated that injection of MSCs alleviates the severity of arthritis and reduce collagen-induced joint damage in a mouse RA model. 4 Importantly, numerous reports have revealed that MSCs achieve their biological function by secreting extracellular vesicles (EVs). 5 EVs are a kind of small vesicle with a diameter of approximately 30–100 nm, which are involved in diverse range of biological processes. 6 Moreover, EVs mediate cell–cell communication by transferring proteins and RNAs to target tissues. 7 For example, MSCs-derived EVs can alleviate RA progression by transferring miR-150. 8
microRNAs (miRNAs) are a class of small non-coding RNAs which are involved in the regulation of the expression of a wide range of genes, either by promoting mRNA degradation or inhibiting translation.9,10 miRNAs have been reported to play a role in multiple diseases, including RA, 11 where miR-21 has been reported to relieve RA in rats by directly targeting the Wnt signaling pathway. 11 However, the molecular mechanism by which miR-21 acts during RA remains elusive. TET1, a member of the DNA demethylase family which regulates expression of numerous genes has also been associated with RA. 12 KLF4 plays a vital role in cell survival and proliferation, and was recently reported to be upregulated in RA. 13 Although the cause of its upregulation is still unknown, TET1 has been reported to act upstream of KLF4. 14 We therefore hypothesized that miR-21 transferred from BMSCs-derived EVs might participate in the regulation of RA progression by targeting the TET1–KLF4 axis. In this study, we established an RA mouse model and utilized gain- and loss-of-function analysis to uncover the role of BMSCs in RA progression.
Methods
Ethical approval
All experimental procedures involving animals comply with ethical standards. In the process of animal experiments, we strictly abide by the relevant regulations of the Ministry of Science and Technology of the People’s Republic of China “Guiding Opinions on the Treatment of Laboratory Animals” (2006, No.398), and strictly comply with the protection and use of laboratory animals issued by the NIH Guidelines (NIH Publication No.85-23, revised in 1996). Great efforts were made to decrease the number of animal used and minimize the pain of experimental animals. All experimental procedures involving animals were approved by Animal Care and Use Committee of Clinical Medical College, Yangzhou University (2018A053).
Bioinformatic analysis
The RA-related microarray dataset GSE10500 was obtained from the GEO database (https://www.ncbi.nlm.nih.gov/gds), and the “limma” software package in R language was used to conduct differential analysis. A total of eight samples were used, including three normal samples (two males and one female with a mean age of 42.1 ± 4.6 years) and five RA samples (three males and two females with a mean age of 50.1 ± 7.2 years). The threshold of logFC >1, p < 0.05 was used to screen differentially expressed genes microarray dataset. The target genes of miR-21 were predicted using the starBase (http://starbase.sysu.edu.cn/index.php), TargetScan (http://www.targetscan.org/vert_71/), and mirDIP databases (http://ophid.utoronto.ca/mirDIP/index.jsp).
mFLS culture and transfection
Mouse synovial tissues were cut into small sections (1–3 mm) and incubated in Dulbecco’s modified Eagle medium (DMEM; Thermo Fisher Scientific, Inc, Waltham, MA, USA) with 4 mg/mL collagenase (Merck, Darmstadt, Germany) for 4 h at 37°C, 5% CO2. Cells were then centrifuged at 500 g and resuspended in DMEM supplemented with 20% fetal bovine serum (FBS, 10,100147, Gibco BRL, Invitrogen, CA, USA). After 12–24 h, the non-adherent cells were removed and the adherent cells were cultured in DMEM supplemented with 20% FBS. The isolated cells were maintained at 37°C and 5% CO2 for 14 days and the mFLS at passage 3–10 was collected for subsequent experiments.
A lentiviral packaging system was constructed via LV5-GFP (lentiviral gene overexpression vector) and pSIH1-H1-copGFP (lentiviral shRNA fluorescence expression vector). sh-TET1, oe-TET1, oe-KLF4, and negative control (NC) were synthesized by Gene Pharma (Shanghai, China). The packaging virus and the target vector were co-transfected into HEK293T cells, and the supernatant collected after 48 h culture, filtered and centrifuged to isolate the virus particles. Viruses in the logarithmic growth phase were collected and used for transfection. Cells were divided into groups of treatment with sh-NC (downregulated TET1 control), oe-NC (overexpressed TET1 or KLF4 control), oe-TET1 (overexpressed TET1), sh-TET1-1 (downregulated TET1 shRNA-1), sh-TET1-2 (downregulated TET1 shRNA-2), and oe-KLF4 (overexpressed KLF4). Cells in logarithmic phase were digested by trypsin, resuspended at 5 × 10⁶ cells/mL cell, seeded into 6-well plates supplemented with 2 mL medium per well, and incubated overnight at 37°C. Next, the expression of relevant genes in each group of cells was detected by reverse transcription quantitative polymerase chain reaction (RT-qPCR) 48 h after infection.
The miR-21 mimic, miR-21 inhibitor, and their corresponding controls were provided by RiboBio (Guangzhou, China). The miR-21 mimic/inhibitor were diluted to a final concentration of 50 nM and incubated with Lipofectamine-2000 (Invitrogen, Carlsbad, Calif.) for 20 min at room temperature before transfection. The detailed treatment grouping was as follows: mimic-NC (mimic control), inhibitor-NC (inhibitor control), miR-21 mimic (miR-21 mimic), and miR-21 inhibitor (miR-21 inhibitor).
Establishment of a collagen-induced RA mouse model
A total of 96 male BALB/c mice obtained from Guangdong Medical Animal Laboratory Center were maintained in the controlled environment of controlled temperature (25–27°C) and humidity (45–50%) and were injected by tail injection with 10 mg type II bovine collagen (Chondrex, Redmond, WA, USA) supplemented with 100 μL incomplete Freund’s adjuvant and Mycobacterium tuberculosis (Biolead, Beijing, China). Twenty-one days later, a booster injection was given with the same dose of type II bovine collagen mixed with incomplete Freund’s adjuvant. After the second injection, when the limb and feet of mice displayed obvious swelling, the diameter of the ankle joint was increased by more than 2 mm and the volume of the hind paw was increased by more than 0.80 mm. During a period of 1–4 weeks, we observed synovial hyperplasia, followed 4 weeks later by irreversible destruction of the articular cartilage, presenting in chondrocyte death, cartilage degradation, and fibrosis-like structures. Finally, 6 months later, the presence of chronic inflammatory response indicated that RA was successfully induced in the mice. 15
To track the EVs that were inoculated into the articular cavity, an immunofluorescence assay was performed to observe the PKH26-labeled EVs. Treatment began when arthritis had become well established, which was 3 weeks after the primary immunization. The collagen-induced arthritis (CIA) mice were injected with 100 mL phosphate-buffered saline (PBS) or 100 mL PBS containing 50 mg exosomes, twice a week. 8 The normal mice were fed as control to detect the relevant indexes. Inflammation assessment was conducted as described previously. 16 The total clinical score was calculated as the sum of an inflammation score on a scale of 0–2 for each mouse and a limb swelling score on a scale of 0–3 for each paw, giving a maximum total clinical score of 14. The classification of the inflammation score was evaluated as follows: 0 score = no inflamed digit; 0.5 score = 1–5 digits inflamed; 1 score = 6–10 digits inflamed; 1.5 scores = 11–15 digits inflamed; 2 scores = 16 or more digits inflamed. Paw swelling (paw thickness increased relative to day 0) was evaluated as follows: 0 = increased ⩽30%, 1 = increased >30%, 2 = increased >50%, 3 = increased >80%. This experiment was approved by the ethics committee of Clinical Medical College, Yangzhou University.
The mice of successful modeling were randomly divided into the following groups (n = 12): RA (RA modeling), RA + EVs-inhibitor NC (RA modeling + EVs containing inhibitor-NC), RA + EVs-miR-21 inhibitor (RA modeling + EVs containing miR-21 inhibitor), RA + oe-NC + EV-mimic-NC (RA modeling + lentiviral overexpressing vector + mimic NC), RA + oe-NC + EV-miR-21-mimic (RA modeling + lentiviral overexpressing vector + miR-21-mimic), RA + oe-KLF4 + EV-mimic-NC (RA modeling + lentiviral overexpressing KLF4 + mimic NC), and RA + oe-KLF4 + EV-miR-21-mimic (RA modeling + lentiviral overexpressing KLF4 + miR-21-mimic). Mice without modeling were used as control (normal group).
MicroCT analysis
Under anesthesia with 3% pentobarbital sodium (4 mg/kg), the mice were subjected to microCT analyses, and were euthanized by carbon dioxide inhalation at the end of the study. Bone mineral density (BMD) was assessed with scanner software (CTan, Skyscan, Kontich, Belgium).
Histological evaluation
The hind limb of the euthanized mice was fixed by immersion in 4% paraformaldehyde, decalcified with ethylenediaminetetraacetic acid (EDTA) solution for 21 days, and paraffin-embedded. Based on standard protocols for morphological analysis, serial ankle joint sections (5 μm) were cut and subjected to hematoxylin and eosin (HE) staining. The score of synovial inflammation was based on a scale of 0–4, following an assessment as described previously. 16
Immunohistochemical staining
The tissues were fixed with 4% paraformaldehyde for 2 days, decalcified with a nitric acid solution for 16–18 h, and subjected to conventional dehydration, clearing and paraffin embedding, followed by sectioning (3 μm), heating, and dewaxing and rehydration. The sections were soaked in 3% hydrogen peroxide for 10 min. After being washed in PBS with tween-20 (PBST), the sections were then incubated with 1:100 diluted rabbit anti-mouse antibody to tartrate-resistant acid phosphatase (TRAP; ab2391, Abcam, Cambridge, UK) at 4°C overnight. Next, the sections were incubated with 1:200 diluted HRP-conjugated goat anti-rabbit antibody for 60 min at room temperature followed by PBST washes. The sections were then developed with diaminobenzidine for 30 s, rinsed under running water for 5 min, and stained with hematoxylin for 1 min. Finally, the sections were dehydrated, cleared, sealed and subjected to microscopic observation.
Identification of BMSCs and detection of BMSC markers by flow cytometry
BMSCs obtained from Cyagen Biotechnology Co., Ltd. (Suzhou, China) (https://www.cyagen.com/cn/zh-cn/product/bone-marrow-msc-MUBMX-01001.html) were cultured in DMEM supplemented with 10% FBS and maintained at 37°C in a saturated humidity atmosphere containing 95% air and 5% CO2. Flow cytometry analysis showed that BMSCs CD29 (ab21845, Abcam), CD44 (ab21024, Abcam), and CD73 (ab239246, Abcam) were positive, while hematopoietic markers CD34 (ab18224, Abcam), CD45 (ab27287, Abcam), and HLA-DR (ab1182, Abcam) were negative.
Osteogenic and lipogenic differentiation and staining
BMSCs at passage three in the logarithmic growth phase were inoculated into a 24-well plate and the medium was replaced with osteogenic induction solution (DMEM containing 10% FBS, 0.1 μM dexamethasone, 10 mM β-glycerophosphate sodium, 50 mg/L vitamin C, 1% penicillin, and 2.5 mg/L streptomycin) for continuous culture after 24 h. The BMSCs were then inoculated into a 6-well plate and the culture was renewed with osteogenic induction solution or adipogenic induction solution after 24 h of culture. Finally, the BMSCs were subjected to Alizarin Red staining or Oil Red O staining, and then observed under an Olympus microscope.
Isolation and detection of EVs
EV-depleted FBS was used in the following experiments to avoid the impact of EVs. FBS was depleted of EVs by ultracentrifugation at 1 × 10⁵ g at 4°C for 16 h (Beckman Coulter Avanti J-30I, USA). After a 48–72 h incubation, the culture medium was harvested and EVs were isolated by ultracentrifugation. In brief, the cell culture medium was sequentially centrifuged at 300 g for 10 min, 2000 g for 15 min, and 12,000 g for 30 min to remove floating cells and cellular debris. The supernatant was further ultracentrifuged at 1 × 10⁵ g for 2 h at 4°C, washed in PBS, and submitted to a second ultracentrifugation in the same conditions and resuspended in PBS. The EVs in PBS were stored at −80°C.
For the transmission electron microscope (TEM) morphology investigation, 10 μL of EV pellet was placed on formvar carbon-coated 200-mesh copper electron microscopy grids for 1 min, and stained for 5 min at room temperature with 30 μL phosphotungstic acid solution (pH = 6.8) followed by observation under a TEM. The EVs were diluted in 0.15 M NaCl and mixed well, and then added into the NanoSight ZS90 instrument (Malvern, UK) for automatic tracking and size estimation from the Brownian motion and diffusion coefficient.
Internalization of EVs
FAM miR-21 was transfected into BMSCs followed by extraction of EVs. Purified BMSC-derived EVs were mixed with 1 μM Dil (Invitrogen), incubated for 5 min and ultracentrifuged at 100,000 g for 1 h at 4°C using a 70 Ti rotor (Beckman Coulter) to remove excess dye. The EVs were resuspended in PBS and washed three times. Dil-labeled EVs were co-cultured with mFLS cells for 6 h, and then the mFLS was washed with PBS and fixed in 4% paraformaldehyde. The internalization was observed by fluorescence microscopy (Leica, DM500).
RT-qPCR
Total RNA was extracted from tissue samples and cells using a Trizol kit as per the manufacturer’s instructions (Invitrogen, USA). RNA was then reversely transcribed into cDNA according to the instructions of the Reverse Transcription Kit (RR047A, Takara, Japan). RT-qPCR was performed using an ABI7500 quantitative PCR instrument. U6 was used as the internal reference for miR-21, and glyceraldehyde-3-phosphate dehydrogenase (GAPDH) was used as the internal reference for indicated genes. The 2−ΔΔCt method was employed to calculate the ratio of the relative expression of a target gene in the experimental group to that in the control group with the following formulas: ΔΔCt = ΔCt experimental group – ΔCt control group and ΔCt = Ct target gene – Ct internal reference. Three independent experiments were conducted. Used primers are listed in Table S1.
Western blot
The total tissue or cell proteins were lysed in RIPA lysate (R0010, Solarbio) in strict accordance with the instructions, and then centrifuged at 4°C for 15 min. Next, the lysates were quantified by a BCA kit (20201ES76, Yeasen Biotechnology Co., Ltd., Shanghai, China). The protein sample was separated using freshly prepared sodium dodecyl sulfate-polyacrylamide gel electrophoresis (SDS-PAGE), electrotransferred onto PVDF membranes, blocked by 5% BSA for 1 h, and probed with primary antibodies overnight at 4°C. Immunoblots were visualized with HRP-conjugated secondary antibody IgG (ab205718, 1:10,000, Abcam) and enhanced chemiluminescence detection reagents and captured under the Vilber FUSION FX5 (Vilber Lourmat, France). Gray value of target protein bands was quantified using Image J software, with Actin used for normalization. Used primary antibodies were TET1 (ab191698, 1:1000, Abcam), KLF4 (ab215036, 1:1000, Abcam), CD63 (ab217345, 1:1000, Abcam), TSG101 (ab125011, 1:1000, Abcam), Calneixin (ab92573, 1:1000, Abcam), and β-actin (ab179467, 1:1000, Abcam).
Dual luciferase assay
The potential binding fragment for miR-21 in TET1 and a mutant-type (MUT) TET1 fragment were cloned into separate PGLO vectors, namely, PGLO-TET1-WT and PGLO-TET1-MUT. The two reporter plasmids were separately co-transfected with miR-21 mimic into 293T cells. After transfection for 24 h, the cells were lysed and centrifuged at 10000 × g for 1 min, and the supernatant was collected. Luciferase activity was measured using the Dual-Luciferase® Reporter Assay System (E1910, Promega, Madison, WI, USA). The relative luciferase activity was calculated as the ratio of the activity of firefly luciferase to that of Renilla luciferase. The experiment was repeated three times.
DNA methylation analysis and 5-aza-CdR treatment
RNA was isolated using an RNAiso kit and RT-qPCR was conducted to evaluate the expression of KLF4, after T24 and UM-UC-3 cells were treated with 5 μM 5-aza-2′-deoxycytidine (5-aza-CdR, Sigma A3656, USA) for 4 days. Bisulfate sequencing PCR (BSP) was started with bisulfite conversion, and then the CpG islands of KLF4 were amplified using the following primers 5′-TAGGTTGATTATTTGAGGTTAGGTG-3′ (forward) and 5′-AACAATTTTCAACCAACCATCTC-3′ (reverse). The PCR products were cloned into the pUC18 T-vector. Bacterial amplification was performed and eight clones were subjected to DNA sequencing (Sangon, Shanghai, China).
Measurement of cytokines
The levels of tumor necrosis factor-alpha (TNF-α; ZK-R3528), interleukin-1β (IL-1β; ZK-R3160), and prostaglandin E2 (PGE2; ZK-R3366) in the supernatant of tissue homogenate and serum were determined by enzyme linked immunosorbent assay (ELISA) kits (RJ17323, RenJie Biotechnology, Shanghai, China). The concentrations of NO (ZK-R3046) and iNOS (ZK-R3047) in serum were determined by the nitrate reductase method. The above kits were purchased from Shenzhen Zike Biological Co., Ltd. (Shenzhen, Guangdong, China). The level of TRAP in the serum was also determined by the ELISA kit. The quantification was conducted according to the kits’ instructions.
Cell counting kit-8 (CCK-8) assay
Cells in the logarithmic growth phase were seeded into 96 well plates (1 × 10⁴ cells/well) and 10 μL of CCK-8 solution was added to each well followed by incubation at 37°C for 4 h. The absorbance at 450 nm was measured using a microplate reader (Synergy 4; BioTek, Winooski, VT, USA) to indirectly identify the number of viable cells.
EdU assay
Cell proliferation was analyzed using Cell-Light EdU Apollo 567 in vitro kits (RiboBio Corporate, Guangzhou, Guangdong, China). Transfected cells were cultured in 96-well plates (1 × 10⁴ cells/well). After 48 h, 50 μΜ of EdU labeling media was added and cells were incubated for 2 h. Cells were then fixed in 4% of paraformaldehyde, permeabilized in 0.5% of TritonX-100/PBS, and stained with Apollo staining solution and Hoechst33342. Images of cells were obtained under an inverted fluorescence microscope IX73-AIZFL/PH (OLYMPUS Corporation, Tokyo, Japan).
Statistical analysis
All data were processed using SPSS 22.0 statistical software (IBM Corp. Armonk, NY, USA). Data are shown as the mean ± standard deviation from at least three independent experiments. Unless otherwise noted, statistical comparisons were performed using unpaired t-test when only two groups were compared, or by Tukey’s test-corrected one-way analysis of variance (ANOVA) with when more than two groups were compared. Variables were analyzed at different time points using Bonferroni-corrected repeated measures ANOVA. p < 0.05 was considered as a level of statistical significance.
Results
Isolation and identification of BMSCs-derived EVs
To investigate the role of BMSCs-derived EVs in RA, we first isolated BMSCs from mice, and then confirmed their successful isolation by following assays. We examined the expression of BMSCs surface markers (CD73, CD44, and CD29) as well as hematopoietic markers (CD34, CD45, and HLA-DR) by flow cytometry, which showed that CD73, CD44, and CD29 were highly expressed, while CD34, CD45, and HLA-DR were poorly expressed, which confirmed the identity of the isolated BMSCs (Figure 1a).
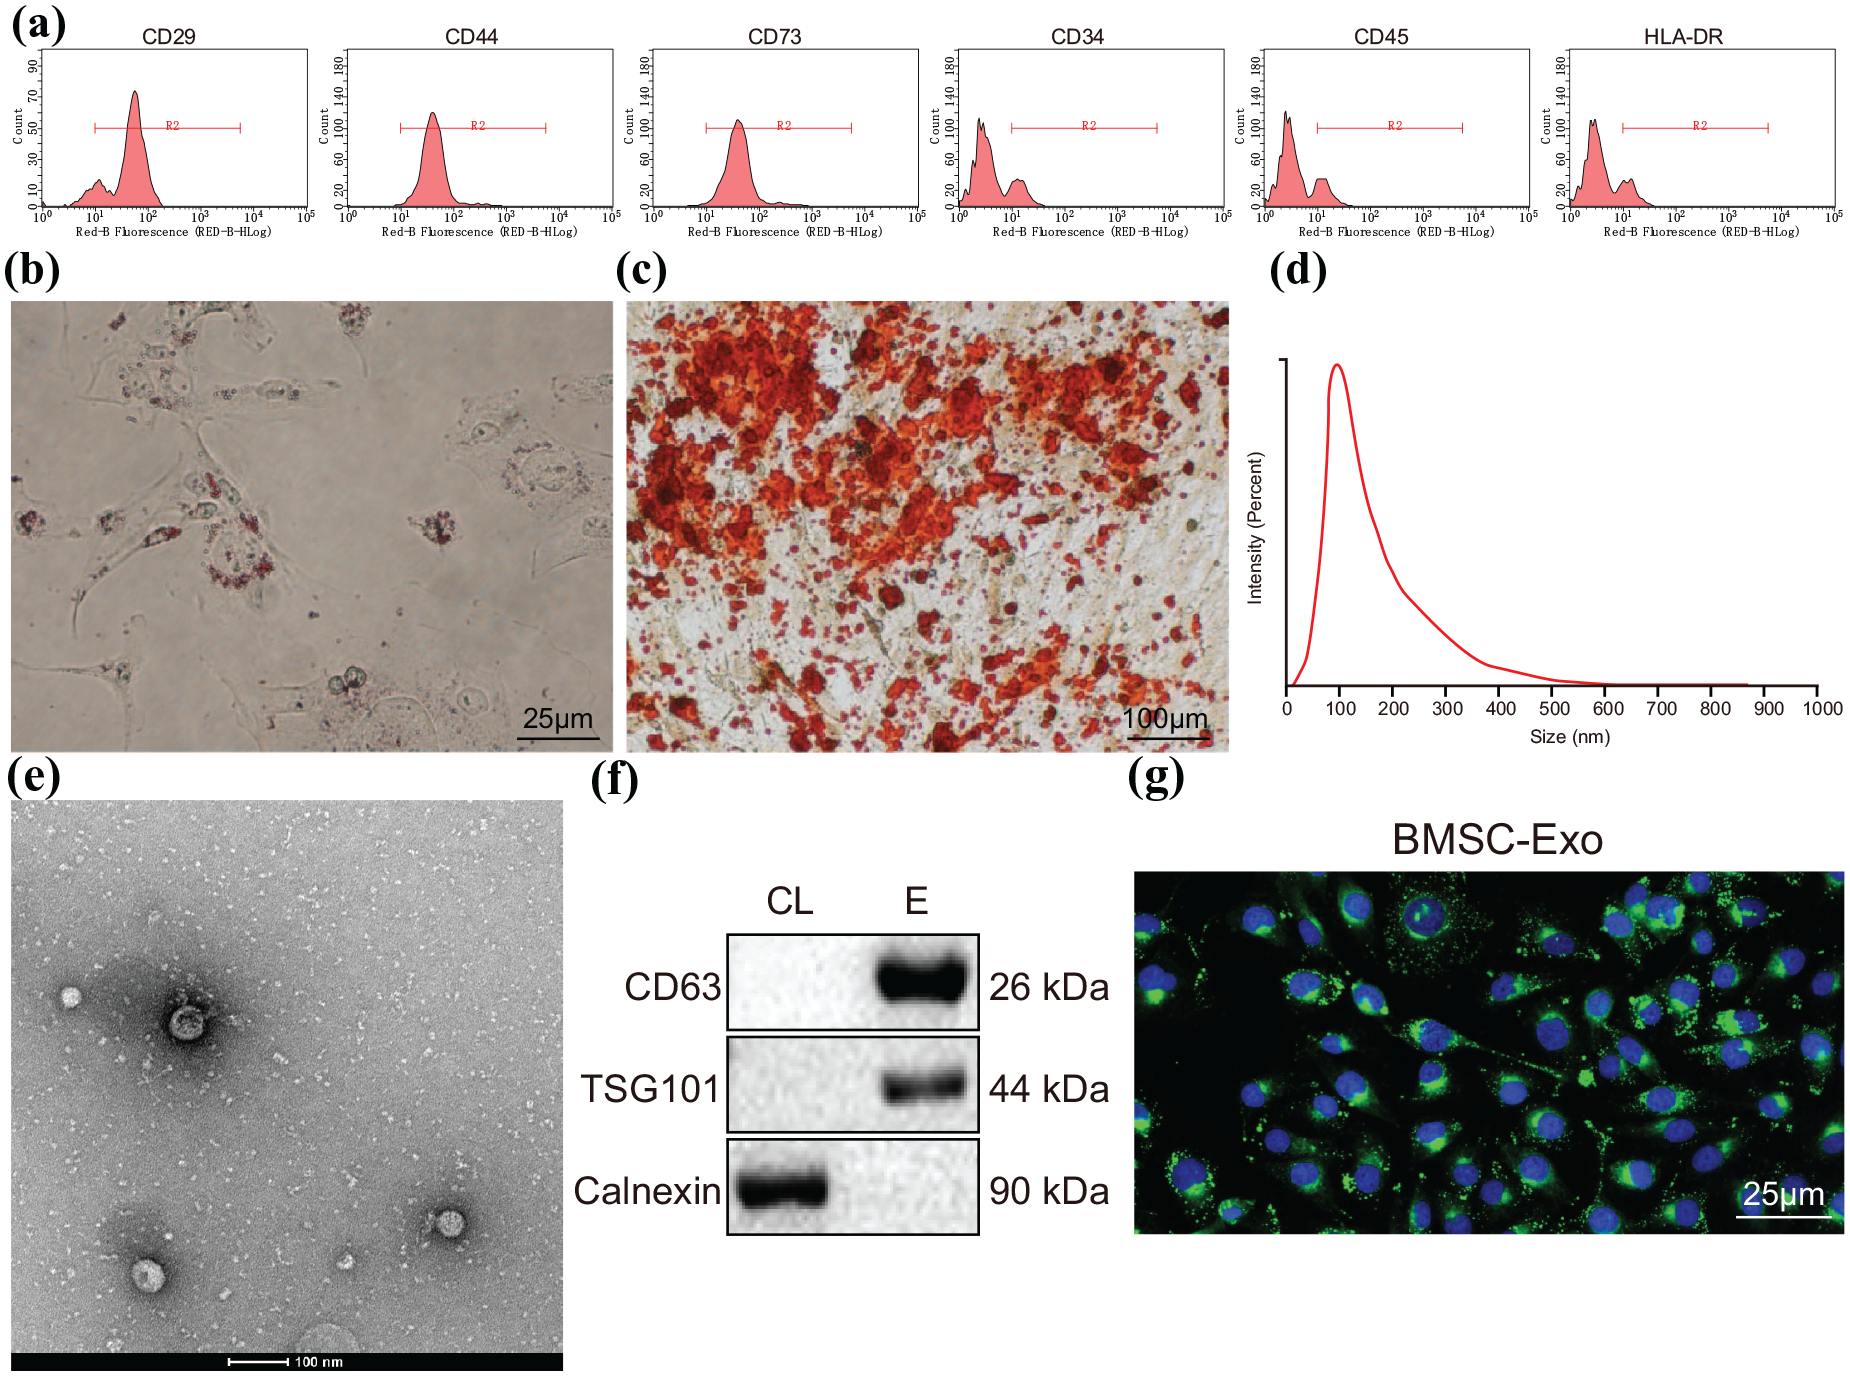
Isolation and characterization of BMSCs-derived EVs. (a) Surface marker expression of BMSCs determined by flow cytometry. (b) Adipogenesis determined by Oil Red O staining, Scale bar = 25 μm. (c) Osteoblastic differentiation determined by Alizarin Red staining, Scale bar = 100 μm. (d) The size distribution of EVs measured by DLS. (e) The morphology of EVs observed by TEM, Scale bar = 100 nm. (f) Surface markers of EVs, CD63, TSG101, and Calnexin determined by western blot (CL, cell lysate; E, EV). (g) Fluorescence microscopy to observe mFLS cells internalizing Dil-labeled EVs and red-labeled EVs were visible in the recipient cells (red fluorescence: Dil, blue fluorescence: DAPI), Scale bar = 25 μm.
Next, we examined the differentiation capacity of BMSCs using Red Oil O and Alizarin Red staining, which showed that the BMSCs had osteogenic and lipogenic capacities, further confirming their identity as BMSCs (Figure 1b–c). Based on this finding, we isolated EVs from the BMSC culture medium by ultracentrifugation. Observation using dynamic light scattering (DLS) showed that the diameters of EV distribution ranged between 30 and 100 nm (Figure 1d). Meanwhile, TEM showed that the EVs were cup-like or spherical in shape (Figure 1e). Consistently, we found high expression of CD63 and TSG101, but low Calnexin expression in the EVs when compared with cell lysates (Figure 1f). Collectively, these results confirmed successful isolation of EVs from BMSCs. We next used Dil to label the EVs to determine whether mFLS cells could internalize EVs. Results showed red fluorescence in mFLS cells after incubation with PKH67-labeled EVs for 12 h (Figure 1g). In summary, we successfully isolated BMSC-derived EVs and proved that they could be internalized by mFLS cells.
BMSCs-derived EVs promote mFLS cells proliferation and suppress inflammatory cytokine expression by transferring miR-21
Next, we hypothesized that BMSC-derived EVs might regulate mFLS cell proliferation and suppress inflammatory cytokines expression by delivering specific miRNA as cargoes. Bioinformatics analysis predicted high expression of miR-21 in BMSC-EVs, which we confirmed by RT-qPCR (Figure 2a). To investigate whether BMSC-derived EVs can transfer miR-21 to mFLS cells, Hoechst (blue)-labeled mFLS cells were incubated with Dil (red)-labeled EVs derived from BMSCs that were transfected with FAM (green)-labeled miR-21. After incubation, RFP and GFP signals could be observed in mFLS cells (Figure 2b). Meanwhile, miR-21 was significantly upregulated in mFLS cells co-cultured with BMSCs and EVs, an effect which was clearly diminished after treatment with the EVs with the inhibitor GW4869, indicating that EVs transferred miR-21 to mFLS cells (Figure 2c).

BMSCs-derived EVs facilitated mFLS cell proliferation and repressed inflammatory cytokine expression by transferring miR-21. (a) miR-21 expression in mFLS, BMSC, and BMSC-derived EVs determined by RT-qPCR, **p < 0.01 compared with mFLS. (b) Transfer of miR-21 visualized by immunofluorescence, scale bar = 20 μm. (c) miR-21 expression in mFLS after being co-cultured with BMSCs determined by RT-qPCR, **p < 0.01 compared with mFLS. (d) miR-21 expression in BMSC after being transfected with miR-21 inhibitor and inhibitor NC determined by RT-qPCR, **p < 0.01 compared with NC-inhibitor. (e) miR-21 expression in mFLS determined by RT-qPCR, **p < 0.01, compared with mFLS. (f) mFLS cells proliferation determined by EdU, scale bar = 100 μm. (g) mFLS cells proliferation determined by CCK-8 assay, *p < 0.05, compared with mFLS group. (h) IL-1β and TNF-α determined by ELISA, *p < 0.05, compared with mFLS group.
To further validate the effect of BMSCs-derived exosomal miR-21 on the mFLS proliferation and inflammatory factor expression, we knocked down the expression of miR-21 in BMSCs, and confirmed that treatment of miR-21 inhibitor decreased the expression of miR-21 in BMSCs (Figure 2d). Based on these results, we co-cultured mFLS cells with BMSCs, and RT-qPCR results demonstrated that miR-21 expression was not influenced in mFLS cells incubated with BMSCs transfected with NC-inhibitor, while miR-21 was significantly downregulated when mFLS cells were incubated with miR-21 depleted BMSCs (Figure 2e). CCK-8 and EdU assays revealed that treatment with downregulated miR-21 reduced mFLS cell proliferation (Figure 2f–g). Moreover, inflammatory cytokines TNF-α and IL-1β were found to be upregulated in miR-21 downregulated mFLS cells, while analysis of the secretion of the inflammatory cytokines showed no significant difference between mFLS cells and NC-inhibitor treated mFLS cells (Figure 2h). Collectively, inhibiting BMSC-derived exosomal miR-21 suppressed mFLS cell proliferation and inflammatory cytokine expression.
BMSC-derived EVs improve RA in RA mice by delivering miR-21
To determine whether BMSC-derived EVs promote alleviation of arthritis symptoms in mice through transferring miR-21, we silenced miR-21 in BMSCs followed by extraction of EVs. Next, we injected mice with BMSCs-derived EVs and examined miR-21 expression on days 6, 10 and 16 after RA modeling. miR-21 expression was significantly elevated in RA mice injected with NC-inhibitor-EVs compared with RA mice without treatment. In contrast, miR-21 expression was decreased in RA mice injected with miR-21-inhibitor-EVs compared with RA mice with NC-inhibitor-EVs (Figure 3a). Clinical scores of RA mice were recorded every 2 days until the end of the experiment. We observed that the mean clinical scores of all RA mice were significantly higher than those of normal mice, while the mean clinical scores of RA mice injected with NC-inhibitor-EVs were significantly lower relative to the RA group. Meanwhile, the mean clinical scores of RA mice injected with miR-21-inhibitor-EVs were significantly higher compared with the NC-inhibitor-EVs group (Figure 3b). After 16 days post RA induction, HE staining results revealed that, compared with the untreated RA group, inflammatory infiltration and synovial hyperplasia were significantly reduced in RA mice injected with NC-inhibitor-EVs, while RA mice injected with miR-21-inhibitor-EVs showed more severe inflammatory infiltration and synovial hyperplasia compared with the NC-inhibitor-EVs group (Figure 3c). Moreover, we analyzed BMD of the paws of RA mice by microCT, which showed that the BMD of all RA mice was lower than that of normal mice. Furthermore, the BMD of RA mice injected with NC-inhibitor-EVs was significantly elevated in comparison with the RA group, while the BMD of RA mice injected with miR-21-inhibitor-EVs was significantly reduced in comparison with the NC-inhibitor-EVs group (Figure 3d). To decipher the molecular mechanism by which miR-21 acts during RA, we determined the activity of the marker enzyme TRAP in joints by immunohistochemistry (IHC) and ELISA, which showed that TRAP activity was higher in RA mice than in normal mice, whereas TRAP activity was significantly higher still in RA mice treated with miR-21-inhibitor-EVs than in RA mice treated with NC-inhibitor-EVs (p < 0.01) (Figure 3e). Consistent with ELISA, IHC revealed that TRAP-positive rates were much higher in RA mice, while injection of NC-inhibitor EVs reduced TRAP-positive rates in comparison with that in RA mice or the miR-21-inhibitor-EVs group (Figure 3f).

BMSCs-derived EVs alleviated RA progression by transferring miR-21. (a) miR-21 expression at indicated time point determined by RT-qPCR. (b) Clinical RA scores were recorded every 2 days before the end of the experiment. (c) Bone joints of RA mice analyzed and scored by HE staining. (d) microCT images of paws analyzed by BMD. (e) TRAP activity in plasma determined by ELISA. (f) TRAP expression in synovial tissues analyzed by IHC. (g) TNF-α, IL-1β, and PGE2 levels in synovial tissues determined by ELISA. (h) TNF-α, IL-1β, and PGE2 levels in plasma determined by ELISA. (i) NO and iNOS levels in plasma of RA mice determined by nitrate reductase assay.
Next, we further analyzed the levels of PGE2, IL-1β, and TNF-α in plasma and synovial tissues of RA mice, as well as the levels of NO and iNOS in plasma. We found that the levels of PGE2, IL-1β, and TNF-α were significantly reduced in plasma and synovial tissues and the levels of NO and iNOS were also significantly reduced in the NC-inhibitor-EVs group in comparison with RA mice, while the opposite effects were observed in the miR-21-inhibitor-EVs group in comparison with the NC-inhibitor-EVs group (Figure 3g–i). Collectively, our data revealed that BMSCs-derived EVs suppressed inflammatory cytokine expression and thus alleviated the RA phenotype by transferring miR-21.
miR-21 directly targets TET1
To identify downstream targets of miR-21, we predicted the potential targets of miR-21 by starBase, TargetScan, and mirDIP, and obtained 2163, 381, and 994 candidates, respectively. Analysis of microarray GSE10500 by R language revealed 2333 significantly differentially expressed genes, among which 1207 genes were upregulated (Figure 4a). Based on this result, we identified the top 33 candidate genes involved in RA, which included TET1, by overlapping the potential target genes and upregulated genes (Figure 4b). A previous report likewise revealed that TET1 was highly expressed in RA and that silencing TET1 relieved RA. 17 Consistent with these results, our microarray data revealed that TET1 was indeed upregulated in RA patients (Figure 4c). Moreover, TET1 was also found to be highly expressed in RA mouse joint tissues when examined by qPCR and western blot analysis (Figure 4d). Furthermore, we accessed miR-21 binding sites on TET1 by starBase (Figure 4e).

BMSC-derived exosomal miR-21 suppressed TET1 expression by directly targeting it. (a) Heatmap of differentially expressed genes in the microarray of RA patients, each row representing a differentially expressed gene and each column representing a sample. (b) Downstream targets of miR-21 in RA patient predicted by starBase, mirDIP, and TargetScan. (c) TET1 expression in microarray. (d) TET1 expression in bone tissues of normal mice and RA mice determined by western blot and RT-qPCR, p < 0.05, compared with normal. (e) miR-21 binding sites on TET1 predicted by starBase. (f) Binding affinity validated by dual luciferase assay, **p < 0.01, compared with NC-mimic. (g) TET1 expression in each group determined by RT-qPCR, *p < 0.05, compared with mimic NC. #p < 0.05 compared with inhibitor NC. (h) TET1 expression in each group determined by western blot, *p < 0.05, compared with mimic NC. #p < 0.05 compared with inhibitor NC.
We next validated the predicted relationship between miR-21 and TET1 using dual luciferase assay, which demonstrated that miR-21 overexpression significantly suppressed TET1-WT luciferase activity but not in TET1-MUT, relative to results with NC-mimic (Figure 4f). Furthermore, we constituently expressed or silenced miR-21 in mFLS cells to validate the effect of miR-21 on TET1 expression. Results demonstrated that miR-21 overexpression significantly reduced TET1 expression, while downregulation of miR-21 led to elevation of TET1 expression (Figure 4g, h). Collectively, these results revealed that TET1 was a direct downstream target of miR-21.
miR-21 promotes mFLS cell proliferation and suppresses inflammatory cytokine expression by targeting TET1
To investigate the regulatory role of miR-21 in RA, we introduced miR-21 alone or along with TET1 into mFLS cells. Western blot analysis demonstrated that ectopic expression of miR-21 significantly downregulated TET1 expression, while the overexpression of TET1 elevated TET1 expression (Figure 5a). In addition, functional assays revealed that miR-21 overexpression promoted mFLS cell proliferation, while this effect was abolished when TET1 was overexpressed (Figure 5b, c). Moreover, we analyzed the secretion of inflammatory cytokines by ELISA, which showed that miR-21 overexpression significantly reduced IL-1β and TNF-α secretion, and that restoration of TET1 in miR-21 overexpressed mFLS cells elevated their secretion (Figure 5d). Collectively, these results revealed that miR-21 promoted mFLS cell proliferation and the secretion of inflammatory cytokines by directly targeting TET1.

miR-21 promoted mFLS cell proliferation and suppressed inflammatory cytokines by repressing TET1. (a) TET1 in each group determined by western blot, *p < 0.05, compared with mimic NC + oe-NC, #p < 0.05, compared with miR-21 mimic + oe-NC. (b) Proliferation determined by EdU labeling, *p < 0.05, compared with mimic NC + oe-NC, #p < 0.05, compared with miR-21 mimic + oe-NC. (c) Proliferation rates of each group determined by CCK-8 assay, *p < 0.05, compared with mimic NC + oe-NC, #p < 0.05, compared with miR-21 mimic + oe-NC. (d) Inflammatory cytokines expression determined by ELISA, *p < 0.05, compared with mimic NC + oe-NC, #p < 0.05, compared with miR-21 mimic + oe-NC.
TET1 facilitated KLF4 expression by demethylating KLF4
It has previously been reported that TET, a member of the DNA demethylase family, epigenetically promotes KLF4 expression. This change in expression is associated with KLF4 demethylation, 14 a post-translational modification which plays a key role in KLF4-regulated cell differentiation, apoptosis, as well as exacerbated RA progression. 18 We therefore hypothesized that TET1 might regulate RA progression through demethylation of KLF4. Analysis of microarray data revealed that KLF4 was highly expressed in RA patients (Figure 6a). Consistent with this, KLF4 expression in the bone joint tissues from normal mice and RA mice detected by western blot analysis likewise revealed elevated expression in the bone joint tissues from RA mice (Figure 6b). Furthermore, we silenced or overexpressed TET1 in mFLS cells as confirmed by western blot (Figure 6c). Based on these results, we selected sh-TET1-1 for the subsequent western blot and qPCR experiments, which showed that TET1 overexpression significantly upregulated KLF4 protein level, while down-regulating TET1 caused a significant decrease of KLF4 protein expression (Figure 6d).

TET1 demethylated and promoted KLF4 expression. (a) TET1 expression in microarray data. (b) KLF4 expression in bone joint tissues determined by western blot, *p < 0.05, compared with normal. (c) TET1 expression in each group cells determined by western blot, *p < 0.05 compared with the oe-NC group, and #p < 0.05 compared with the sh-NC group. (d) TET1 and KLF4 protein levels determined by western blot, and KLF4 mRNA determined by RT-qPCR, *p < 0.05, compared with oe-NC; #p < 0.05, compared with sh-NC. (e) KLF4 expression in mFLS cell after 5-aza-dC treatment, **p < 0.05, compared with DMSO. (f) KLF4 methylation status determined by BSP sequencing.
CpG island program (http://www.urogene.org/methprimer/) analysis revealed there were several CpG islands in the 1500 bp region upstream of the KLF4 promoter (Supplemental Figure 1). KLF4 expression was significantly upregulated in mFLS cells treated with DNA methyltransferase inhibitor 5-Aza-dC (Figure 6e). Moreover, to further determine the effect of TET1 on KLF4 promoter methylation status, we carried out BSP sequencing, which showed that TET1 silencing significantly increased KLF4 promoter methylation, while there was a significant decrease of methylation in KLF4 in TET1 overexpressed mFLS cells (Figure 6f). Taken together, our data revealed that TET1 promoted KLF4 expression by demethylating its promoter.
miR-21 facilitates mFLS cell proliferation and represses inflammatory cytokine secretion by targeting a TET1/KLF4 regulatory axis
To further validate that miR-21 transferred by BMSCs-derived EVs affected RA progression by regulating TET1/KLF4 regulatory axis, we overexpressed KLF4 in mFLS cells transfected with a miR-21 mimic. Western blot and RT-qPCR showed that ectopic expression of miR-21 significantly downregulated TET1 and KLF4, while restoration of KLF4 only rescued KLF4 without affecting TET1 expression (Figure 7a, b). Furthermore, miR-21 significantly promoted mFLS cell proliferation, while restoration of KLF4 expression inhibited the pro-proliferative function of miR-21 in mFLS cells (Figure 7c, d). The results from ELISA revealed that miR-21 overexpression reduced IL-1β and TNF-α secretion, an effect which was again reversed by ectopic expression of KLF4 (Figure 7e). Collectively, these data revealed that miR-21 facilitated mFLS cell proliferation and suppressed inflammatory cytokine expression by repressing the TET1/KLF4 regulatory axis.
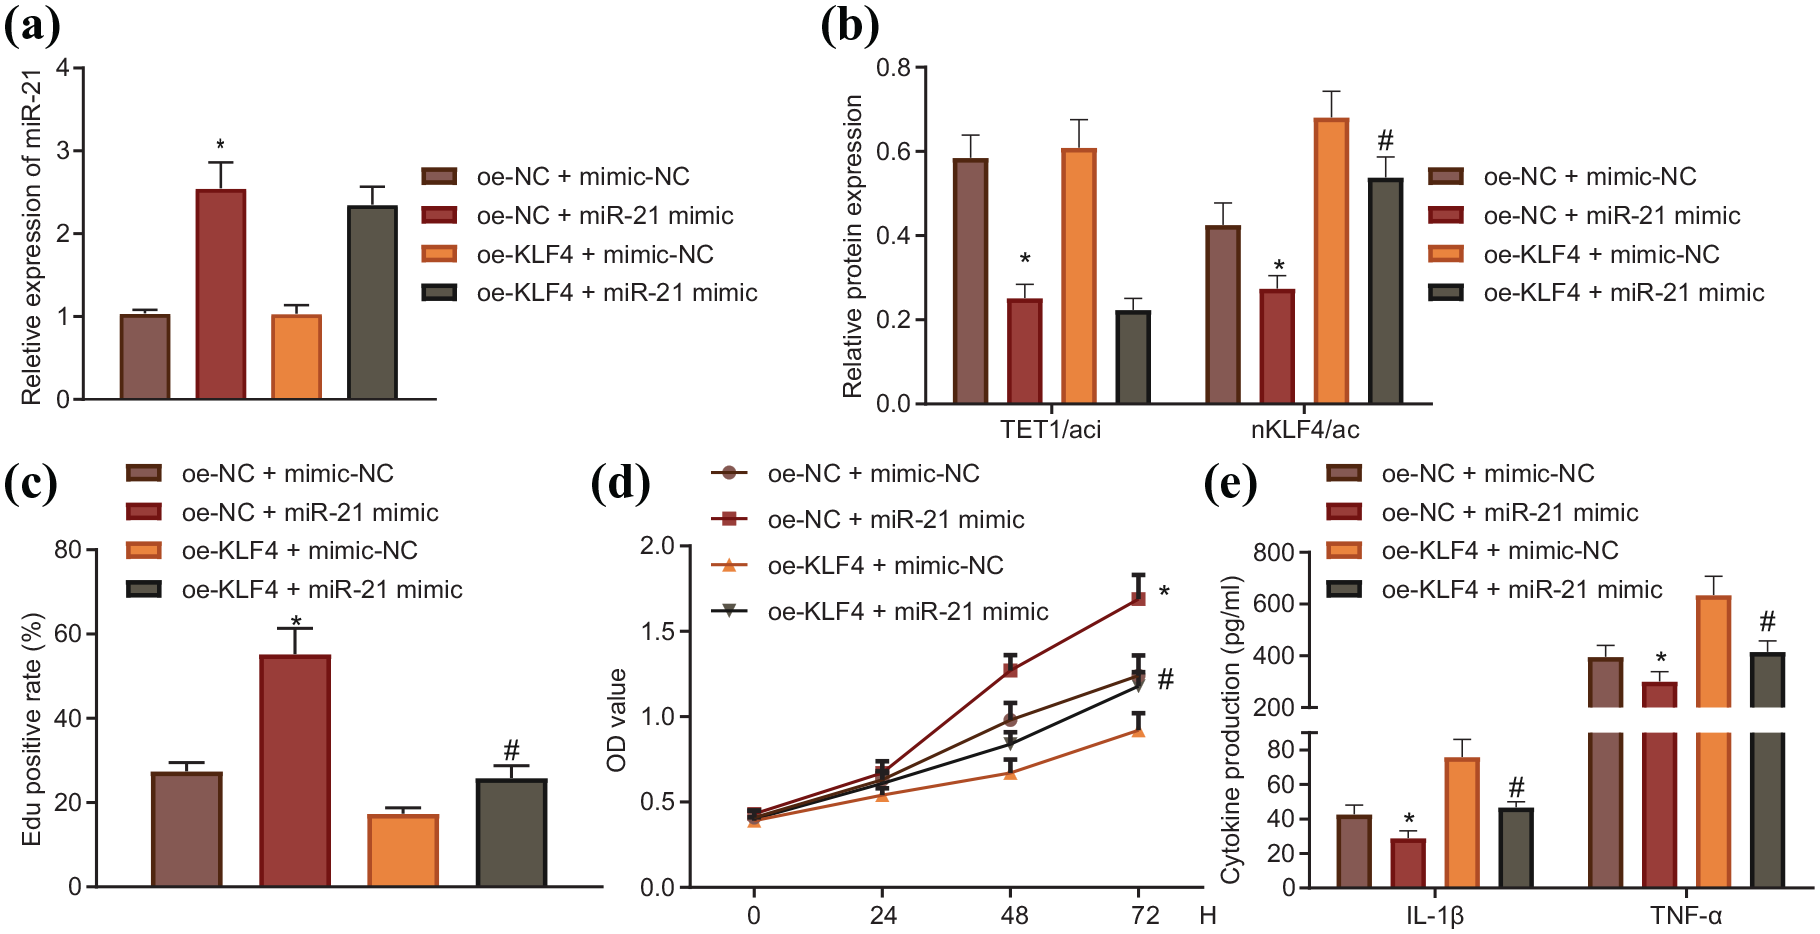
miR-21 promoted mFLS cell proliferation and suppressed inflammatory cytokines by repressing TET1/KLF4 axis. (a) miR-21 expression determined by RT-qPCR. (b) TET1 and KLF4 expression determined by western blot. (c) Cell proliferation determined by EdU, scale bar = 100 μm. (d) Proliferation rates of each group determined by CCK-8 assay. (e) Inflammatory cytokines expression determined by ELISA. *p < 0.05, compared with mimic NC + oe-NC, #p < 0.05, compared with oe-NC + miR-21 mimic.
miR-21 alleviates RA progression by suppressing a TET1/KLF4 axis in vivo
In order to confirm that miR-21 could alleviate RA progression by TET1/KLF4 axis in vivo, we overexpressed KLF4 and injected miR-21 mimic-EVs in RA mice. Using RT-qPCR and western blot analyses, we detected miR-21, TET1 and KLF4 expression in bone joint tissues, finding that injection of miR-21 mimic-EVs significantly elevated miR-21 expression accompanied with downregulation of TET1 and KLF4. Furthermore, ectopic expression of KLF4 in miR-21 mimic-EVs injected mice restored KLF4 expression without affecting miR-21 and TET1 expression (Figure 8a, b).

miR-21 delivered by EVs inhibited RA progression in vivo by TET1/KLF4 axis. (a) miR-21 expression in bone joint determined by RT-qPCR. (b) TET1 and KLF4 expression determined by western blot. (c) Clinical RA scores were recorded every 2 days before the end of the experiment. (d) Bone joints of RA mice analyzed and scored by HE staining. (e) microCT images of paws analyzed by BMD. (f) TRAP activity in plasma determined by ELISA. (g) TRAP expression in synovial tissues analyzed by IHC. (h) TNF-α, IL-1β, and PGE2 levels in synovial tissues determined by ELISA. (i) TNF-α, IL-1β, and PGE2 levels in plasma determined by ELISA. (j) NO and iNOS levels in plasma of RA mice determined by nitrate reductase assay.
Clinical scores of RA mice were recorded every 2 days, after which the bone and joint tissues of mice were stained by HE and scored for RA pathology (Figure 8c, d). We found that miR-21 mimic-EV injection significantly reduced the mean clinical score and inflammatory infiltration markers, while KLF4 overexpression elevated the clinical score, and exacerbated inflammatory infiltration, and synovial hyperplasia. In contrast, miR-21 mimic-EV-injected mice with upregulation of KLF4 showed reductions in the clinical score, inflammatory infiltration, and synovial hyperplasia. Next, microCT analysis revealed increased BMD in miR-21 mimic-EVs-injected mice when compared with the mimic-NC-EVs group, BMD was significantly lower in the KLF4 overexpression group. Moreover, restoration of KLF4 abolished the increase of BMD caused by miR-21 overexpression (Figure 8e). Further, ELISA results depicted that miR-21 mimic-EV-injected mice had reduced TRAP activity, while ectopic KLF4 expression in miR-21 overexpressed RA mice rescued TRAP activity (Figure 8f). Consistent with ELISA analysis of plasma, IHC results revealed miR-21 mimic-EV injection significantly reduced TRAP-positive rates, which was reversed by restoration of KLF-4 (Figure 8g).
Finally, we analyzed PGE2, IL-1β, and TNF-α expression in mouse plasma and synovial tissues and NO and iNOS expression in plasma. We observed that elevated miR-21 levels in RA mice were associated with significantly decreased PGE2, IL-1β, and TNF-α levels in plasma and synovial tissues, while NO and iNOS in plasma were also reduced. However, the positive effect of miR-21 overexpression was reversed by ectopic KLF4 expression (Figure 8h–i). Collectively, miR-21 alleviated RA progression by suppressing TET1/KLF4 regulatory axis in vitro and in vivo.
Discussion
Accumulated evidence has demonstrated that MSCs-derived EVs can efficiently transfer drugs and biological molecules to target cells. 19 For example, nanoparticle delivery of miR-21 mimic to cardiac macrophages improved myocardial remodeling after myocardial infarction. 20 In our present study, we have shown that miR-21 from BMSC-derived EVs suppressed KLF4 to alleviate RA by targeting TET1.
MSCs-derived EVs have a large cargo capacity and are therefore capable of transporting approximately 150 different miRNAs, meaning it is not surprising that EVs have been reported to participate in regulation of diverse range of diseases, including RA.11,21 We found from our study that BMSC-derived EVs could transfer miR-21 into mFLS to promote mFLS cell proliferation and repress inflammatory cytokines, IL-1β, and TNF-α secretion. miRNA-21 has been demonstrated as an important factor in regulation of multiple cancers and infectious diseases, through its function on inflammation, osteogenesis, as well as osteoclastogenesis.22–24 Specifically, transfection of miR-21 has been reported to reduce the release of IL-6 and TNFα. 25 Consistent with our finding, miR-21 has been reported to relieve RA in rats by targeting of the Wnt signaling pathway. 11 More importantly, injection of BMSC-derived EVs to RA mice could reduce the secretion of inflammatory cytokines secretion to relieve RA progression in vivo, as confirmed by the reported reparative effects of EVs derived from BMSCs in tissue damage. 26
Kruppel-like factors (KLFs) are an important class of transcriptional factors, 27 which play a key role in the production and maintenance of induced pluripotent stem cells and are involved in the regulation of cell proliferation, cell survival, and inflammatory response.28–30 Several research studies demonstrate KLF4 can interact with TNF-α and the p65 subunit to induce the NOS promoter in response to IFN-γ exposure. 31 Meanwhile, KLF4 was shown to regulate the secretion of inflammatory cytokines by monocytes and dendritic cells.28,32 Coincidently, RA is a chronic autoimmune disease resulting in mild to severe joint inflammation, and KLF4 has been reported to promote aberrant inflammation related disease. 30 Indeed, a recent study reveals that KLF4 is involved in the regulation of RA progression. 13 Here, we demonstrate that KLF4 was upregulated in clinical RA patients and in bone joint tissues from the RA mouse model, and that its forced overexpression could abolish the protective effect of miR-21 on RA tissue in vivo and in vitro. As previously reported, miR-21 exerts a promotive role in KLF4 in the regulation of human endometrial stromal cells, 33 again suggesting an interaction between miR-21 and KLF4.
Moreover, we found that KLF4 could be regulated by TET1 through demethylation. Similarly, a previous study also confirmed the interaction between KLF4 and TET1. 14 TET1 belongs to the DNA demethylase family and promotes the expression of downstream genes by removing the methylation on CpG island in gene promoter sequences. 34 Besides, TET1 has been known as a tumor suppressor gene in diverse cancers. 35 Although it has been reported to play a regulatory role in many diseases, the role of TET1 has not been well studied in RA.36–38 Previous evidence has shown that miR-21-5p can target TET1 in human colorectal cancer, 39 and that TET1 inactivates KLF4 in gastric cancer through a DNA methylation mechanism. 14 In this study, we showed that TET1 could promote KLF4 in mFLS cells to induce a proliferation defect and inflammatory response by remodeling the methylation status in the KLF4 promoter. We also demonstrated that TET1 was a direct downstream target of miR-21, capable of mediating the regulation of KLF4 by miR-21 in mFLS cells and bone joint tissues, thus indicating the importance of a miR-21/TET1/KLF4 functional axis in RA.
Taken together, our data revealed that BMSCs-derived EVs could alleviate RA progression in mice via their role in transferring miR-21. Upregulated miR-21 in RA tissues and mFLS cells promoted the cell proliferation rate and reduced inflammatory cytokine secretion by regulating the TET1/KLF4 axis (Figure 9). Thus, our study sheds light on a novel regulatory pathway which could be targeted therapeutically to provide a clinical treatment of RA. However, establishing how to apply safely BMSCs-derived EVs for clinical RA therapy requires further investigation. Our findings demonstrated that BMSCs-derived EVs efficiently relieved RA progression by transferring miR-21, thus merit in-depth study with an aim toward eventual translational research.

Summary of the proposed molecular mechanism. miR-21 delivered by EVs promoted mFLS cell proliferation and repressed inflammatory reaction by repressing TET1 and inhibiting methylation of KLF4 in RA.CIA, collagen induced arthritis; EVs, extracellular vesicles; mFLS, mouse fibroblast-like synoviocytes.
Supplemental Material
sj-docx-1-taj-10.1177_20406223211007369 – Supplemental material for MicroRNA-21 from bone marrow mesenchymal stem cell-derived extracellular vesicles targets TET1 to suppress KLF4 and alleviate rheumatoid arthritis
Supplemental material, sj-docx-1-taj-10.1177_20406223211007369 for MicroRNA-21 from bone marrow mesenchymal stem cell-derived extracellular vesicles targets TET1 to suppress KLF4 and alleviate rheumatoid arthritis by Guo-Qing Li, Yu-Xuan Fang, Ying Liu, Fan-Ru Meng, Xia Wu, Chun-Wang Zhang, Yu Zhang, Yan-Qing Liu and Dan Liu in Therapeutic Advances in Chronic Disease
Supplemental Material
sj-eps-2-taj-10.1177_20406223211007369 – Supplemental material for MicroRNA-21 from bone marrow mesenchymal stem cell-derived extracellular vesicles targets TET1 to suppress KLF4 and alleviate rheumatoid arthritis
Supplemental material, sj-eps-2-taj-10.1177_20406223211007369 for MicroRNA-21 from bone marrow mesenchymal stem cell-derived extracellular vesicles targets TET1 to suppress KLF4 and alleviate rheumatoid arthritis by Guo-Qing Li, Yu-Xuan Fang, Ying Liu, Fan-Ru Meng, Xia Wu, Chun-Wang Zhang, Yu Zhang, Yan-Qing Liu and Dan Liu in Therapeutic Advances in Chronic Disease
Footnotes
Acknowledgements
We would like to give our sincere appreciation to the reviewers for their helpful comments on this article.
Author contributions
Guo-Qing Li, Yu-Xuan Fang, Ying Liu, Fan-Ru Meng, Xia Wu and Yu Zhang designed the study. Dan Liu collated the data, carried out data analyses and produced the initial draft of the manuscript. Chun-Wang Zhang, Ying Liu and Dan Liu contributed to drafting the manuscript. All authors have read and approved the final submitted manuscript.
Conflict of interest statement
The authors declare that there is no conflict of interest.
Funding
The authors disclosed receipt of the following financial support for the research, authorship, and/or publication of this article: This study was supported by grants from National Natural Science Foundation of China (No. 82071821), Jiangsu Provincial Natural Science Foundation of China (No. BK20201222), The Fifth Phase of “333 Project” Scientific Research Project of Jiangsu Province in 2020 (No. BRA2020175), Yangzhou University “High-end Talent Plan” Top Talent Growth Plan (2019), Six Talent Peak Research Project in Jiangsu Province (No. 2015-WSN-105), Jiangsu Province Youth Medical Talent Project (No. QNRC2016348), and Key Talents of Science and Education in Yangzhou City in 13th Five-Year (No. ZDRC201881).
Supplemental material
Supplemental material for this article is available online.
References
Supplementary Material
Please find the following supplemental material available below.
For Open Access articles published under a Creative Commons License, all supplemental material carries the same license as the article it is associated with.
For non-Open Access articles published, all supplemental material carries a non-exclusive license, and permission requests for re-use of supplemental material or any part of supplemental material shall be sent directly to the copyright owner as specified in the copyright notice associated with the article.